Article

Mapping Groundwater Potential for Irrigation, by Geographical Information System and Remote Sensing Techniques: A Case Study of District Lower Dir, Pakistan

by
Abid Sarwar
1,
Sajid Rashid Ahmad
1,
Muhammad Ishaq Asif Rehmani
2,*,
Muhammad Asif Javid
1,
Shazia Gulzar
3,
Muhammad Ahmad Shehzad
4,
Javeed Shabbir Dar
5,
Alaa Baazeem
6,
Muhammad Aamir Iqbal
7,
Muhammad Habib Ur Rahman
8,
Milan Skalicky
9,
Marian Brestic
9,10 and
Ayman EL Sabagh
11,*
1
College of Earth and Environmental Science, University of Punjab Lahore, Lahore 160014, Pakistan
2
Department of Agronomy, Ghazi University, Dera Ghazi Khan 32200, Pakistan
3
The Fazl Haq College, Mardan 23200, Pakistan
4
Department of Statistics, Bahauddin Zakariya University, Multan 60000, Pakistan
5
Department of Agronomy, SZABAC Dokri, Larkana 70060, Pakistan
6
Department of Biology, College of Science, Taif University, P.O. Box 11099, Taif 21944, Saudi Arabia
7
Department of Agronomy, Faculty of Agriculture, University of Poonch, Rawalakot 12350, Pakistan
8
Institute of Crop Science and Resource Conservation (INRES), University Bonn, 53115 Bonn, Germany
9
Department of Botany and Plant Physiology, Faculty of Agrobiology, Food and Natural Resources, Czech University of Life Sciences Prague, 16500 Prague, Czech Republic
10
Department of Plant Physiology, Slovak University of Agriculture in Nitra, 94901 Nitra, Slovakia
11
Department of Agronomy, Faculty of Agriculture, Kafrelsheikh University, Kafr El-Shaikh 33516, Egypt
*
Authors to whom correspondence should be addressed.
Atmosphere 2021, 12(6), 669; https://doi.org/10.3390/atmos12060669
Submission received: 10 April 2021 / Revised: 17 May 2021 / Accepted: 19 May 2021 / Published: 24 May 2021

Abstract

:
The changing climate and global warming have rendered existing surface water insufficient, which is projected to adversely influence the irrigated farming systems globally. Consequently, groundwater demand has increased significantly owing to increasing population and demand for plant-based foods especially in South Asia and Pakistan. This study aimed to determine the potential areas for groundwater use for agriculture sector development in the study area Lower Dir District. ArcGIS 10.4 was utilized for geospatial analysis, which is referred to as Multi Influencing Factor (MIF) methodology. Seven parameters including land cover, geology, soil, rainfall, underground faults (liniment) density, drainage density, and slope, were utilized for delineation purpose. Considering relative significance and influence of each parameter in the groundwater recharge rating and weightage was given and potential groundwater areas were classified into very high, high, good, and poor. The result of classification disclosed that the areas of 113.10, 659.38, 674.68, and 124.17 km2 had very high, high, good, and poor potential for groundwater agricultural uses, respectively. Field surveys for water table indicated groundwater potentiality, which was high for Kotkay and Lalqila union councils having shallow water table. However, groundwater potentiality was poor in Zimdara, Khal, and Talash, characterized with a very deep water table. Moreover, the study effectively revealed that remote sensing and GIS could be developed as potent tools for mapping potential sites for groundwater utilization. Furthermore, MIF technique could be a suitable approach for delineation of groundwater potential zone, which can be applied for further research in different areas.

1. Introduction

The sustainability of modern ecosystems and survivability of human are largely dependent on water availability especially to ensure food security of rising populace [1,2]. The existing resources of surface water are insufficient owing to high population density, uneven distribution of water resources, space and time mandate, economic development, and climate change [3,4,5]. Consequently, the demand for groundwater, which accounts for 30% of world freshwater, has increased. In addition, increasing population and rapid urbanization could not be sustained without exploiting underground water resources [6]. However, there exists a serious lack of knowledge and research-based information regarding potential areas having sufficient quantities of underground water.
Pakistan is an agriculture-based country where groundwater constitutes one of its primary irrigation sources. The changing climate scenario has seriously reduced river water flows that has made groundwater an indispensable constituent of irrigation systems to ensure food security and economic stability [7,8,9]. This situation demands conducting studies to identify potential areas of groundwater resources in order to exploit those resources for irrigation purposes along with formulating strategies to conserve them [10,11]. It is quite pertinent to test different modern techniques for identifying potential groundwater areas under local conditions geographical information systems. Remote sensing technologies are commonly utilized for management of natural resources including water [12,13] and are useful tools for quantitative mapping potential groundwater areas [14]. In recent times, the widespread use of satellite imagery data, as well as traditional maps and verified ground control data, have assisted to provide primary and crucial information for the potential zoning of areas based on availability and quality of groundwater [15,16,17].
Conventionally, groundwater potential assessment is done by soil moisture modeling and hydrogeological field studies. These techniques are time-intensive and lacking economic feasibility, especially at regional scales [4,18]. Regional hydrogeological attributes, such as depth of weathering, drainage patterns, climate, extent of fractures, geological structures, landform, land cover/land use (LCLU), lithology, primary and secondary porosity, slope, and topography, regulate groundwater recharge [19,20]. In-site geophysics surveys and hydrogeology experiments assist to delineate processing involved in groundwater recharge and assess the spatiotemporal dissimilarities in the study regions [21,22,23]. Limited reliability of these surveys, mainly due to their focus on a single factor affecting groundwater recharge, have narrowed their role in predicting regional groundwater mapping [24].
Remote sensing has emerged as cost-efficient and faster alternative for spatial data collection, and hold potential for land surface characterization, wide-range scale of the spatiotemporal observation distribution, measuring, monitoring, and protecting factors regulating groundwater resources, therefore, their use in hydrogeological studies is rapidly expanding [19,25,26]. Satellite imageries data provides rapid and beneficial reference information on parameters including geology (rocks), topography (earth surface), LCLU and guidelines, control generation, and flow of groundwater [27,28]. The integrated utilization of remote sensing and geographic information system (GIS) are being widely used for groundwater prospecting, as remote sensing offers good functionality for mapping the groundwater recharge area, and can differentiate and identify various structures including rocks, vegetation, and water [29]. Moreover, integration of different techniques can solve problems associated with the hidden subsurface heterogeneity and identify different structures like rocks, water, and vegetation [16,30,31,32]. Potential groundwater zone boundaries include routes and fault zones [33,34,35], rainfall, soil, lithology, and texture. Various hydrogeological parameters influence groundwater dynamics, including soil [36], slope, elevation [13], drainage system [37,38], and soil distribution [39]. However, considerable research and knowledge gaps exist regarding identification of potential areas having sufficient quantities of underground water in Northern Pakistan regions. Therefore, this study was designed to delineate potential areas of groundwater in the Lower Dir, Northern province of Pakistan, i.e., Khyber Pakhtunkhwa, through a multi influencing factor approach leading to categorization of large areas depending on the quantity of underground water.

2. Materials and Methods

2.1. Study Area

District Lower Dir lies within 34°37’ and 35°07’ North Parallels and 71°31′ and 72°14′ East Meridians in the Northern province, Khyber Pakhtunkhwa, of Pakistan, with a geographic area of 1585 km2 and population of 0.7176 million according to the 1998 census [40]. It is surrounded by Upper Dir district on the North, Bajaur Agency, and Afghanistan on the West, Malakand Protected Areas towards the South, and the East by Swat district and Upper Dir District (Figure 1). A major river flowing through the study area is Panjkora; however, the most of population use groundwater for agriculture, drinking, and domestic purposes [41].

2.2. Methodology

Remote-sensing data of various spatiotemporal, spectral, radiometric, and temporal resolutions can be used to afford accurate, cost-effective, automated, near-real-time information, even in areas on the Earth that are difficult to access [42]. This study had the prime objective to delineate potential areas of groundwater through a multi influencing factor (MIF) approach. For this method, the required data were collected from different departments and then analyzed through procedures, sources, and steps (Figure 2) in ArcGIS 10.4, for groundwater potential zoning.
Seven influential input factors (drainage density (DD), geology (G), land cover, lineament density (LD), rainfall (R), soil type (ST), and topography (slope, TG)) were selected to identify groundwater potential zones. Each of these factors have influence and multifaceted interaction with other factors (Figure 3). Interrelationship of different influencing factors were established (Figure 3) [43], and relative strength, ranks, and weights were assigned [36,44,45]. These parameters were put into GIS platform and score ARC Map 10.2.2 software (Figure 2), and were processed to assigned relative weightage and score, by utilizing multi influencing factor (MIF) techniques, to ensure uniformity [41,46] (Table 1). Weighted overlay analysis is the integration of all influencing factors along with their weightage values.
Direct (indirect) influence of one factor over another was represented by major (minor) effect. These effects (major/minor) are categorized based on their holding capacity and the characteristics of surface and subsurfaces. The weightage of each influencing factor was calculated (Equation (1)), by considering the weak and strong relationship between them, indicating major influence (2 or A sub-category); low influence (1 or B sub-category) or no influence (0) of influencing factor over another. The collective score, i.e., A + B, of both minor (B) and major (A) and impact are calculated according to the (Equation (1)). Obtained relative effect was further used to calculate the weight of each influencing parameter (Table 1) [28,36,47,48].
MIF = ( A + B ) ( A + B ) × 100
where MIF is multi influencing factor, A is major effect, and B is minor effect between two influencing factors.
The qualitative and quantitative ranks were assigned to all seven parameters, and the calculated weights were equally divided. After assigning the weight and ranks to all seven influencing factors, and their sub-classes, as described in Table 2, the tool ‘weighted overlay’ in overlay toolset (built in inside the spatial analyst tools in Arc GIS) was used to perform weighted overlay analysis. Groundwater potential index of the study area was calculated using Equation (2).
G W P I = ( D D w × D D r ) + ( G w × G r ) + ( L C w × L C r ) + ( L D w × L D r ) + ( R w × R r ) + ( S T w × S T r ) + ( T G w × T G r )
where GWPI is groundwater potential index; DD, drainage density; G, geology; LC, land cover; LD, lineament density; R, rainfall; ST, soil type; TG topography (slope); r, feature rank within a layer; and w, layer weight calculated using MIF method.
After all data were ready for the thematic layers, these layers were transformed into raster datasets for weighted overlay analysis and further processes using ArcGIS spatial analyst tools. The map of groundwater potential zones displaying the groundwater scenario of the study area was produced and subsequently converted into raster format for easy integration and processing because raster layers are the foundation of a weighted overlay analysis. Therefore, if the data is in a vector format, then it is converted into raster datasets. Conversion from vector to raster is done within ArcGIS spatial analyst tools. Raster that participates in a weighted overlay service should be in geo TIFF format.
The weighted overlay tool overlays several raster using a common measurement scale and weights each according to its importance, which gives the output layer values ranging from 1–5. The value of 1 corresponds to very poor groundwater potential zones while value 5 indicates very good groundwater potential zones. Most of the layers were reclassified into mainly 4 classes. The land cover layer was further classified into 5 classes, while he drainage and geology layers were classified into 4 and 3 classes, respectively. The properties of all the parameters were studied as per the past available literature and assigned weights depending on their characteristics in the area of groundwater availability. Before performing weighted overlay analysis, it was ensured that all the rasters are in the same coordinate system, hence, in this research the projected coordinate system WGS_1984_UTM_Zone_43 was used. After assigning the suitable weightage to main parameters with respect to their availability in field finally the map of groundwater potential zones was prepared showing the groundwater scenario of the study area. Weighted overlay analysis indicated groundwater availability into four classes (very high, high, good, and poor).

2.2.1. Geology

Regional geological features, like permeability and porosity of various rocks, regulates groundwater occurrence and movement, and types of rocks significantly influence the availability and recharge of groundwater. Geological map of the study area was extracted from the geological map of Khyber Pakhtunkhwa, subsequently was digitized and reclassified into (1) igneous + metamorphic and (2) sedimentary rocks. Different scores were assigned depending upon groundwater recharge potential and infiltration capacity (Table 2).

2.2.2. Drainage, Elevation and Topography

SRTM (shuttle radar topography mission) digital elevation model (DEM) having 30 m resolution was used to identify the slope (topography), drainage, and elevation of study area. For measuring slope and elevation, special tools available in ArcGIS 10.4 were utilized.
The underground and ground formations of any terrain control its drainage capacity and is indicated by the underground lithology. It is an indirect function of surface runoff and groundwater infiltration. The regions were classified as very low (0–11.34), low (11.34–32.46), moderate (32.46–55.93), and high (55.93–99.74) drainage density zones. Line density tool was used to generate and drainage density map.

2.2.3. Rainfall

The groundwater potential zones significantly dependent on infiltration rate, which is regulated by precipitation distribution and slope gradient [36]. The annual rainfall data (2005–2018) of meteorological stations located at Kalam, Saidu Sharif, Malam Jabba Drosh, and Dir, were collected from the Regional Metrological Office, Peshawar. The data were added to ArcMap 10.4 for interpolation and rainfall map was generated using inverse distance weighted (IDW) tool. The results of rainfall data interpolation categorized the study area into five rainfall zones like very low (107–116 mm), low (116–121 mm), moderate (121–125 mm), good (125–129 mm), and high (129–133 mm). The appropriate weightage has been allocated for each class.

2.2.4. Lineament Density

Lineaments are markers of faults and fractures in subsurface regions, inducing the existence of groundwater acting as canals and reservoirs [27]. In an area, lineament density can eventually expose the potential of groundwater, subsequently, the lineament presence usually indicates permeable zones [49]. The lineament density was computed from the density analysis tool in ArcGIS 10.4 environment and expressed as length of the lineament per unit area (km km−2).

2.2.5. Land Cover Pattern

Regional land cover pattern regulates infiltration and surface runoff. Forest cover and vegetation promotes water infiltration and reduces runoff velocity. Paved road surfaces indicate urban settlements. To identify the temporal changes occurring in land cover pattern for over two decades (22 years) in the study area, images were categorized using supervised maximum likelihood classification. Landsat 8 (2018) images having 30 m resolution were used to prepare the land cover layer [46]. Groundwater recharge is significantly influenced by land use pattern of an area [4,5]. The land use in the study area was dominated by agricultural and forest land; however, land use under urban and barren is rapidly increasing [30,34,43].
The Landsat images used in the study were obtained from United States Geological Survey (USGS) images database. Accuracy assessment was carried out through the confusion matrix.

2.2.6. Soil Type

Water reaching the groundwater table is mainly provided by infiltration of water (through the soil), various drainage networks, and lateral feedings [50]. Soil texture (relative proportion of sand, silt, and clay) determines soil water holding capacity, porosity, permeability, and water transport processing including infiltration, and, therefore, groundwater recharge potential of an area.

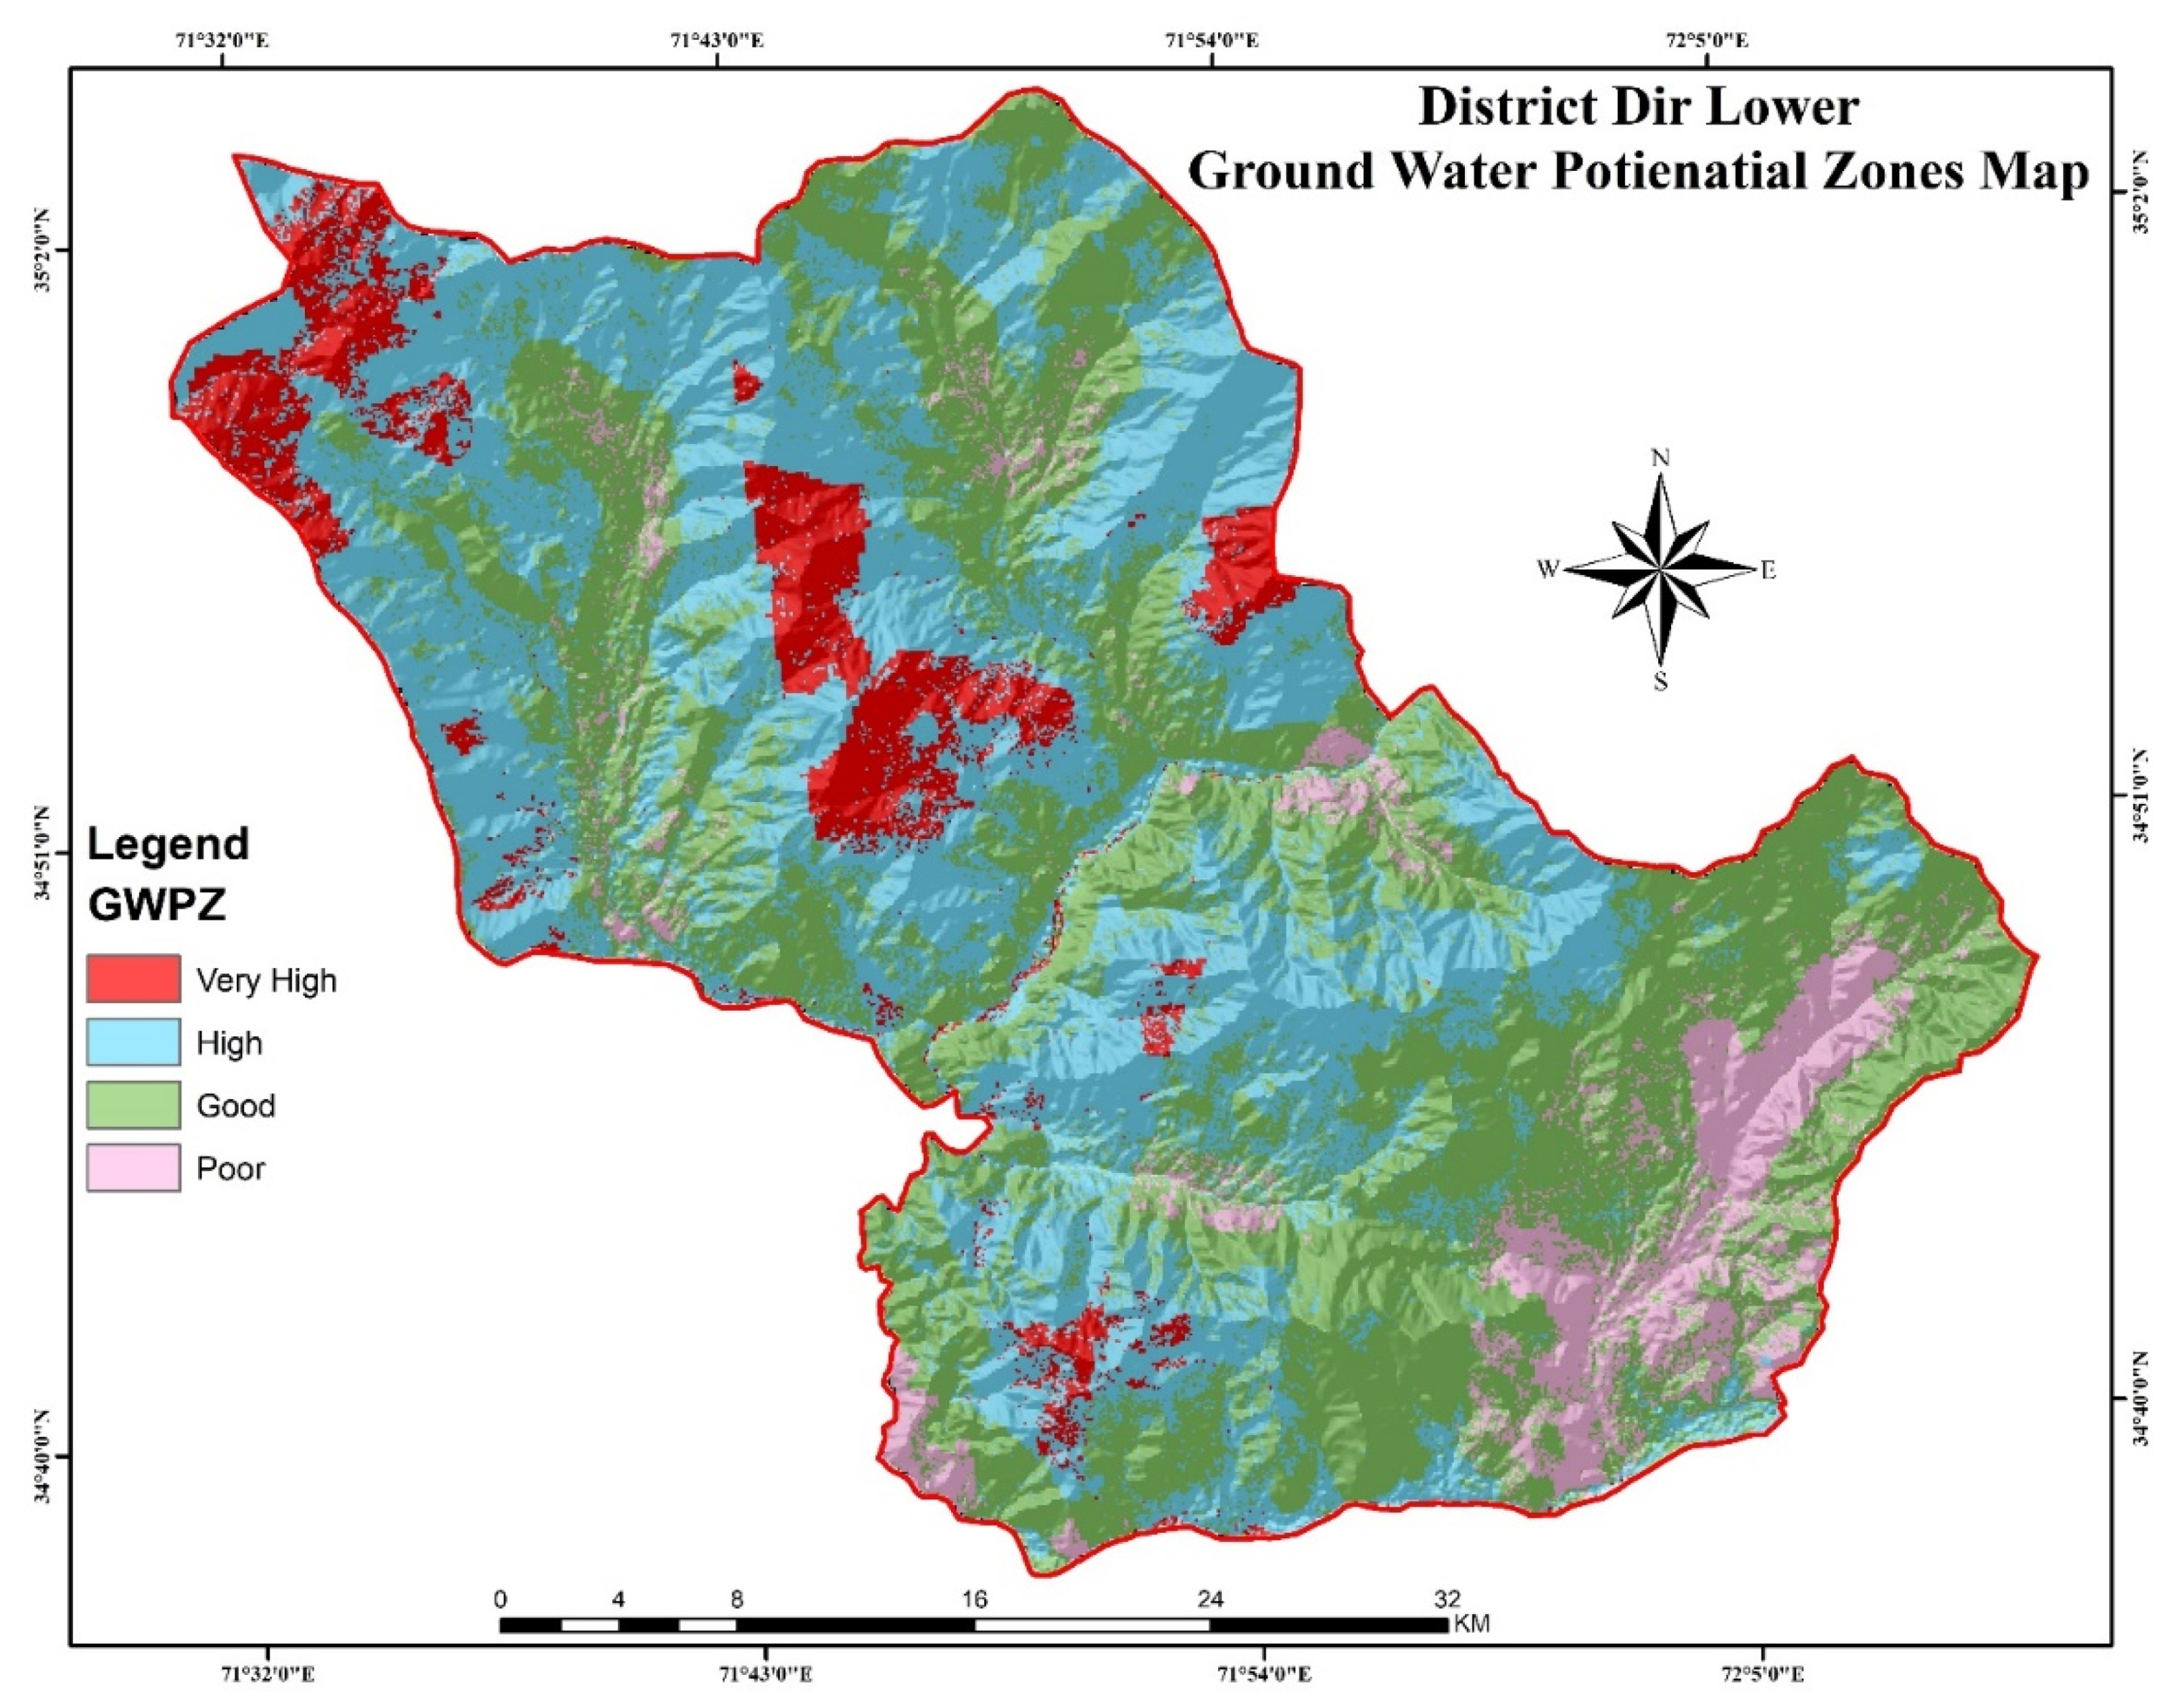
3. Results and Discussion

3.1. Land Cover Change (1996–2018)

Table 3 showed the classification results in area percentage. The land cover map is shown in Figure 4. Temporal changes in land cover observed between 1996–2018, indicated that area green cover, vegetation, and forest cover dominated (>60% of total area) the study area (Table 3). Vegetation cover showed a decreasing trend (22.32% reduction); however, a significant rise (34.34% increase) in forest cover from 20.27% (1996) to 27.23% (2018) was recorded. The maximum change (161.1% increase) was observed in urban area from 7% (1996) to 20% (2018). However, an almost similar area was recorded for barren land. Water bodies had decreased from 10.84% to2.52% (76.75% reduction) in the past 22 years.
The increase in forest area can be partially attributed to afforestation campaigns of provincial and national governments, e.g., Mega-Carbon Sequestration project, reducing emissions from deforestation and forest degradation (UN-REDD) project, and the billion tree afforestation program (BTAP) [51,52]. These results are in accordance with an earlier report [36], who opined that GIS technology remained superior in assessing the changes taking place in water while calibration of model for data interpretation was described to be of critical significance to accurately assess the changes. Similarly, the average and the maximum surface area of water bodies, with significant seasonal variation, were observed in Huai River Basin, China, from 1989–2017 [53].

3.2. Geology

Geology of a region plays a vital part in the distribution and zoning of groundwater resources [45]. In the present study, the area was dominated by igneous and metamorphic rocks (Figure 5a). The type, composition, and permeability of rock and soil significantly affect water infiltration and groundwater recharge. Metamorphic and igneous rocks dominant in the studied area, are characterized with low-permeability, therefore regions these two types of rocks are dominant, have limited water infiltration. Moreover, clayey soil and shallow soil with rocky outcrop have low permeability, restricting underground water percolation and aquifer recharge. Contrarily, loamy soil and sedimentary rocks with high porosity and permeability are important for the recharge of the groundwater aquifer. Moreover, terrains with joints or fractures allow infiltration [54].

3.3. Drainage Density

The underground and ground formations of any terrain regulate its drainage pattern, and therefore are considered a significant indicator of water runoff and groundwater infiltration in an area [55]. The regions were classified as very low (0–11.34), low (11.34–32.46), moderate (32.46–55.93), and high (55.93–99.74) drainage density zones (Figure 4a). Areas with low drainage density indicates comparatively lower infiltration and low runoff and vice versa [54]. The zones with low values of moderate drainage density have better groundwater potential zones, therefore they were allocated a higher weightage value. Figure 5b depicts a drainage density zones map of the studied area. Our results are in agreement with those of [56], who inferred that GIS and remote sensor technologies could be developed to identify water retention areas for the development of agriculture under changing climate.

3.4. Rainfall

For groundwater recharge rainfall is one of the most major sources. The annual rainfall data from 2005–2018 were collected from the station situated in the area and nearby areas: meteorological stations are located at Kalam, Saidu Sharif, Malam Jabba Drosh, and Dir. Rainfall data were collected from the regional metrological office in Peshawar. The analysis of rainfall data and interpolation surface were classified into five zones like classes 107–116 mm, 116–121 mm, 121–125 mm, 125–129 mm, and 129–133 mm. The appropriate weightage was allocated for each class. The resulting data were reclassified using reclassify tool in arc map into five higher weight values allocated to high rainfall class because of its potential to recharge the acquirers (Figure 5c). Rainfall distribution and slope gradient easily influence the infiltration of runoff water, and consequently enhance the chances of groundwater potential zones [27,36].

3.5. Lineament Density

Lineaments and their intersections significantly contribute to the occurrence and movement of groundwater resources. Lineaments may serve as a channel for the movement of groundwater, leading to enhanced secondary porosity. The presence of lineaments is an indicator of permeable zone and high lineament density shows sufficient groundwater potential [36,49]. A lineament density map of Lower Dir is shown in Figure 5e. The region was classified into four classes: very low (0–0.16), low (0.16–0.41), moderate (0.41–0.75), and high (0.75–1.66). The zone with high lineament density was categorized as high groundwater potential and assigned a higher weightage value.

3.6. Land Cover

Land cover plays a critical role in the recharge of groundwater through water percolation and leaching. Supervised classification method was put into use through Arc GIS 10.4, which took into consideration five different classes: vegetation, barren land, urban regions, water levels, and forest cover (Figure 5e). The image classification of study area showed that settlement was overlayed over the studied area especially near the water bodies and vegetation area. As water bodies constitute continuous source of groundwater recharge water bodies were given a higher weightage (Figure 5e).

3.7. Soil Type

Soil texture regulates soil water holding capacity, permeability, and water transport (both vertical and horizontal) processing including infiltration, and therefore, groundwater recharge potential of an area. Macropores, dominate in coarse-textured soils (sandy), facilitate water infiltration. Contrarily, micropores dominate in fine-textured soils (clayey), with restricted water infiltration. The thematic layer of the soil for the study area revealed three soil classes including loamy shallow, loamy and clayey soil, and very shallow loamy rock outcrop soil. Weights were assigned based on the composition and soil water holding capacity. Rocky outcrops with shallow soil and clayey sand tend to have poor permeability and were given a low weightage (Figure 5f). Mainly loamy soils were given high weight value because of high porosity and permeability [25].

3.8. Slope

The slope of an area directly influences water infiltration as steeper slopes induce significantly lesser recharge owing to rapid surface runoff that allow inadequate time for water infiltration and subsequent groundwater recharge. The slope of the studied area was classified into four distinct groups of very low (0–50.62), low (50.62–71.72), moderate (71.72–83.32), and high (83.32–89.65) (Figure 5g).
Thematic layers transformed into raster datasets for weighted overlay analysis and further processes using ArcGIS spatial analyst tools. The map of groundwater potential zones displaying the groundwater scenario of the study area was produced (Figure 6). The result of weighted overlay analysis depicted groundwater availability into four classes (very high, high, good, and poor). The results revealed that that the area 113.106 km2 had very high, 659.387 km2 high, 674.686 km2 good, and 124.177191 km2 fell into poor groundwater potential class. GIS technology accurately indicated areas having higher underground water based on water table depth and other factors like slope and geography of the area [25].

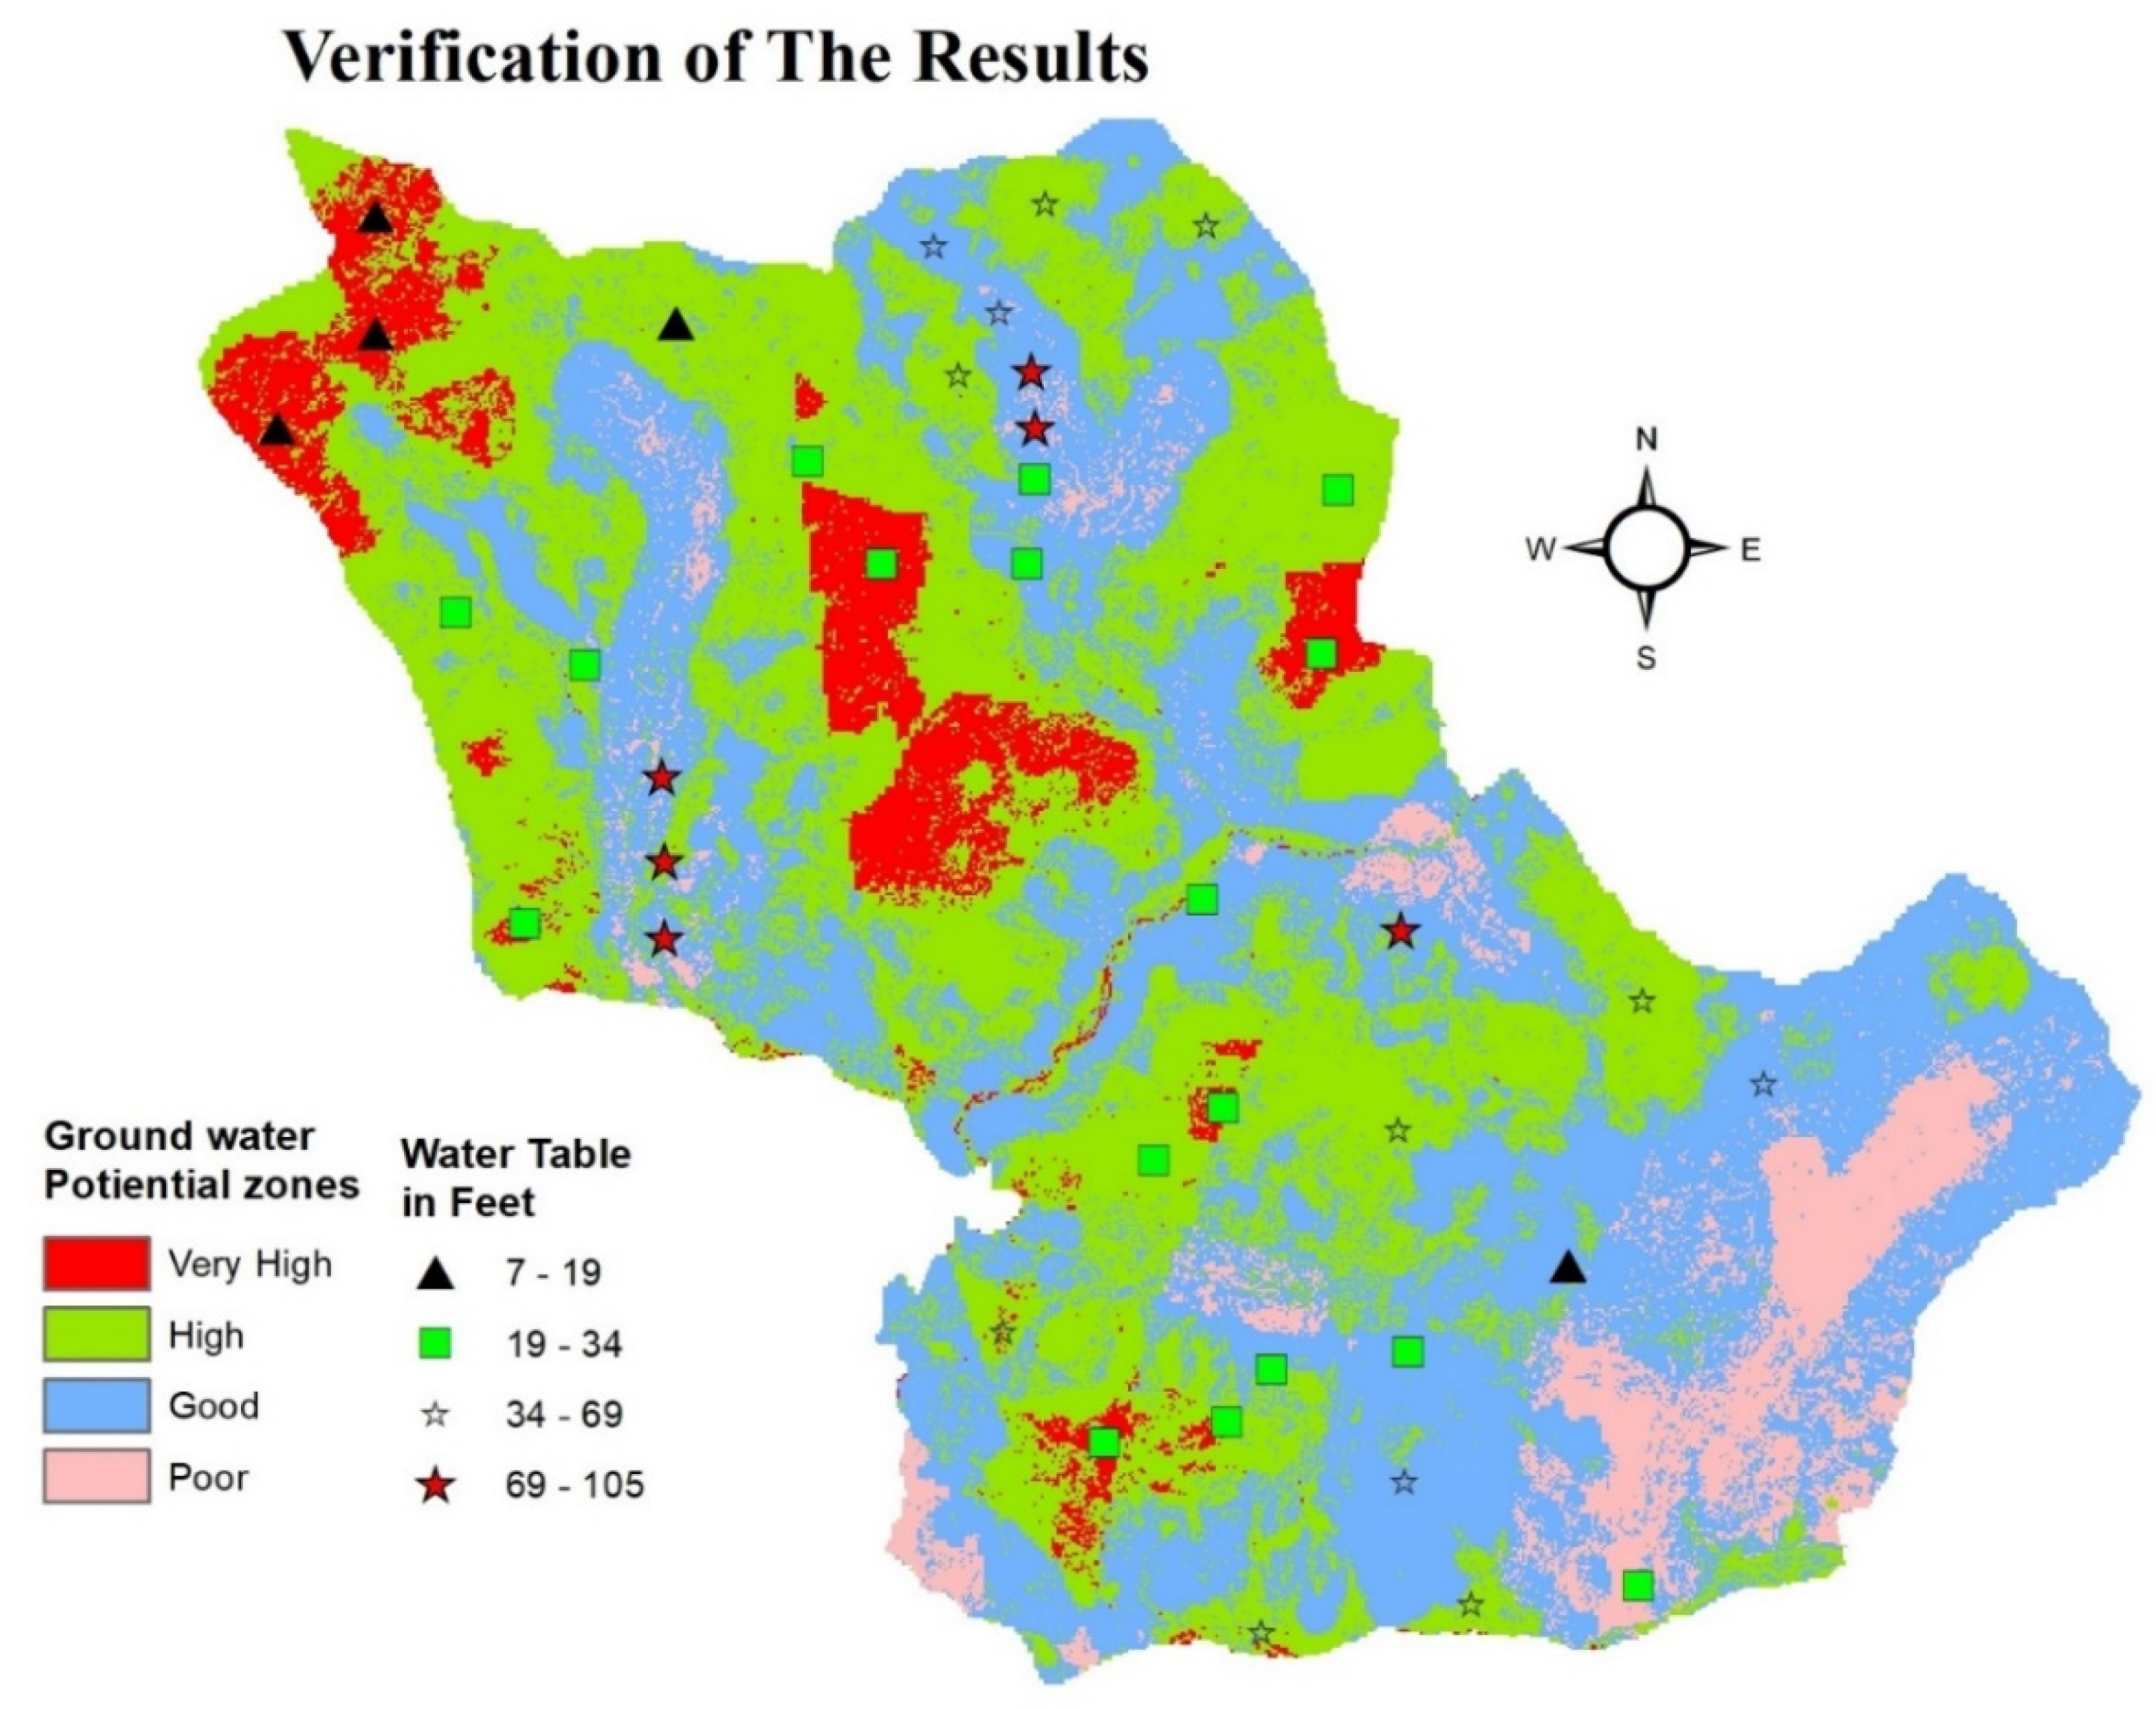
3.9. Results Verification

A field survey was conducted to determine the water table depth throughout the study area. A handheld GPS was used to collect the coordinates of 40 different wells, tube wells, and hand pumps, and their depth (in feet) was noted. According to our survey, the water depth ranged from very high (7 feet; 2.13 m) to very low (105 feet; 32 m). Based on well depth, wells were divided into three classes: shallow (0–24 feet or 0–7.31 m), moderate (25–53 feet or 7.62–16.15 m), and deep (54–105 feet or 16.45–32 m). The well data was overlaid on top of delineated groundwater potential zones layer (Figure 6). This well data was used as reference point to calculate the accuracy of groundwater depths. The cross-verification method was used to check the accuracy of weighted overlay results. According to the depth of wells in study area, the groundwater potentiality was high in those areas where the table was quite shallow. Few areas (Union councils Kotkay and Lalqila) had very high groundwater potential zones owing to having very shallow water table, and other areas (Zimdara, Khal and Talash) were classified as very poor groundwater potential zones as the water table was very deep. The overlay analysis disclosed that most of the wells having shallow or moderate groundwater depth had very high and high groundwater potential zones (Figure 7). These findings are in line with those of Aykut (2021) [57], who reported that GIS technology effectively validated the ground truths regarding water available in Turkey and inferred that this technology might be developed as a potent tool to estimate underground water availability leading to the formulation of strategies to exploit the water resource for advancement of agriculture in the region.

4. Conclusions

Defining the groundwater potential zones for development of the agriculture sector in North Pakistan using Lower Dir District as case study by utilizing remote sensing, GIS, and MIF techniques were the objectives of the study which were duly achieved. The preparation of thematic layers of geology, drainage density, land-use, lineament density, rainfall, slope, and soil characteristics were done using GPS, satellite imageries, and topographic maps. The result of weighted overlay analysis classified the study area based on the availability of groundwater into four classes very high, high, good, and poor. From the result of classification, it has been found that the area 113.106 km−2 has very high potential of groundwater, whereas 659.387 km−2 has high, 674.686 km−2 has good, and 124.177 km−2 has poor potential of groundwater. These techniques remained time, labor, and finance efficient to delineate potential areas of groundwater in Lower Dir, Northern province of Pakistan, and can potentially assist in quick decision-making for sustainable water resources management in Northern Pakistan, and development of agriculture in the region leading to creation of robust economic activity along with supplementing agricultural produce supplies for the local community as well as the adjacent regions.

Author Contributions

Conceptualization, A.S., S.R.A. and M.I.A.R.; methodology, A.S., S.R.A., M.A.J., S.G., M.I.A.R., J.S.D. and M.A.S.; analysis and validation, A.S., S.R.A., M.A.J. and S.G.; writing—original draft preparation, A.S., M.I.A.R. and M.A.S.; writing—review and editing, M.H.U.R., M.A.S., M.I.A.R., M.A.I., M.B., M.S., A.B., J.S.D. and A.E.S.; funding acquisition, A.B., M.B., M.S. and A.E.S.; supervision, S.R.A. and M.I.A.R. All authors have read and agreed to the published version of the manuscript.

Funding

The authors are also very highly grateful to Taif University Researchers Supporting Project number (TURSP-2020/295), Saudi Arabia.

Institutional Review Board Statement

Not Applicable.

Informed Consent Statement

Not Applicable.

Data Availability Statement

Not Applicable.

Acknowledgments

The authors are highly grateful to Taif University Researchers Supporting Project number (TURSP-2020/295), Saudi Arabia.

Conflicts of Interest

The authors declare no conflict of interest.

References

  1. Liu, J.; Yang, W. Water sustainability for China and beyond. Science 2012, 337, 649–650. [Google Scholar] [CrossRef]
  2. Boltz, F.; LeRoy Poff, N.; Folke, C.; Kete, N.; Brown, C.M.; Freeman, S.S.G.; Matthews, J.H.; Martinez, A.; Rockström, J. Water is a master variable: Solving for resilience in the modern era. Water Secur. 2019, 8, 100048. [Google Scholar] [CrossRef]
  3. Moumen, Z.; El Idrissi, N.E.A.; Tvaronavičienė, M.; Lahrach, A. Water security and sustainable development. Insights Reg. Dev. 2019, 1, 301–317. [Google Scholar] [CrossRef]
  4. Singh, S.K.; Zeddies, M.; Shankar, U.; Griffiths, G.A. Potential groundwater recharge zones within New Zealand. Geosci. Front. 2019, 10, 1065–1072. [Google Scholar] [CrossRef]
  5. Yousefi, S.; Sadhasivam, N.; Pourghasemi, H.R.; Ghaffari Nazarlou, H.; Golkar, F.; Tavangar, S.; Santosh, M. Groundwater spring potential assessment using new ensemble data mining techniques. Measurement 2020, 157, 107652. [Google Scholar] [CrossRef]
  6. Senanayake, I.P.; Dissanayake, D.M.D.O.K.; Mayadunna, B.B.; Weerasekera, W.L. An approach to delineate groundwater recharge potential sites in Ambalantota, Sri Lanka using GIS techniques. Geosci. Front. 2016, 7, 115–124. [Google Scholar] [CrossRef] [Green Version]
  7. Khair, S.M.; Mushtaq, S.; Culas, R.J.; Hafeez, M. Groundwater markets under the water scarcity and declining watertable conditions: The upland Balochistan Region of Pakistan. Agric. Syst. 2012, 107, 21–32. [Google Scholar] [CrossRef] [Green Version]
  8. Mikosch, N.; Becker, R.; Schelter, L.; Berger, M.; Usman, M.; Finkbeiner, M. High resolution water scarcity analysis for cotton cultivation areas in Punjab, Pakistan. Ecol. Indic. 2020, 109, 105852. [Google Scholar] [CrossRef]
  9. Bashir, A.; Shehzad, M.A.; Hussain, I.; Rehmani, M.I.A.; Bhatti, S.H. Reservoir inflow prediction by ensembling wavelet and bootstrap techniques to multiple linear regression model. Water Resour. Manag. 2019, 33, 5121–5136. [Google Scholar] [CrossRef]
  10. Chang, F.-J.; Huang, C.-W.; Cheng, S.-T.; Chang, L.-C. Conservation of groundwater from over-exploitation—Scientific analyses for groundwater resources management. Sci. Total Environ. 2017, 598, 828–838. [Google Scholar] [CrossRef]
  11. Xiang, Z.; Bailey, R.T.; Nozari, S.; Husain, Z.; Kisekka, I.; Sharda, V.; Gowda, P. DSSAT-MODFLOW: A new modeling framework for exploring groundwater conservation strategies in irrigated areas. Agric. Water Manag. 2020, 232, 106033. [Google Scholar] [CrossRef]
  12. Dar, I.A.; Sankar, K.; Dar, M.A. Deciphering groundwater potential zones in hard rock terrain using geospatial technology. Environ. Monit. Assess. 2011, 173, 597–610. [Google Scholar] [CrossRef]
  13. Magesh, N.S.; Chandrasekar, N.; Soundranayagam, J.P. Morphometric evaluation of Papanasam and Manimuthar watersheds, parts of Western Ghats, Tirunelveli district, Tamil Nadu, India: A GIS approach. Environ. Earth Sci. 2011, 64, 373–381. [Google Scholar] [CrossRef]
  14. Zhu, Q.; Abdelkareem, M. Mapping Groundwater Potential Zones Using a Knowledge-Driven Approach and GIS Analysis. Water 2021, 13, 579. [Google Scholar] [CrossRef]
  15. Berhanu, K.G.; Hatiye, S.D. Identification of Groundwater Potential Zones Using Proxy Data: Case study of Megech Watershed, Ethiopia. J. Hydrol. Reg. Stud. 2020, 28, 100676. [Google Scholar] [CrossRef]
  16. Díaz-Alcaide, S.; Martínez-Santos, P. Advances in groundwater potential mapping. Hydrogeol. J. 2019, 27, 2307–2324. [Google Scholar] [CrossRef]
  17. Hao, Q.; Xiao, Y.; Chen, K.; Zhu, Y.; Li, J. Comprehensive understanding of groundwater geochemistry and suitability for sustainable drinking purposes in confined aquifers of the Wuyi Region, Central North China Plain. Water 2020, 12, 3052. [Google Scholar] [CrossRef]
  18. Çelik, R. Evaluation of groundwater potential by GIS-based multicriteria decision making as a spatial prediction tool: Case study in the Tigris River Batman-Hasankeyf Sub-Basin, Turkey. Water 2019, 11, 2630. [Google Scholar] [CrossRef] [Green Version]
  19. Yeh, H.-F.; Cheng, Y.-S.; Lin, H.-I.; Lee, C.-H. Mapping groundwater recharge potential zone using a GIS approach in Hualian River, Taiwan. Sustain. Environ. Res. 2016, 26, 33–43. [Google Scholar] [CrossRef] [Green Version]
  20. Arulbalaji, P.; Padmalal, D.; Sreelash, K. GIS and AHP Techniques based delineation of groundwater potential zones: A case study from Southern Western Ghats, India. Sci. Rep. 2019, 9, 2082. [Google Scholar] [CrossRef]
  21. Bayewu, O.O.; Oloruntola, M.O.; Mosuro, G.O.; Laniyan, T.A.; Ariyo, S.O.; Fatoba, J.O. Geophysical evaluation of groundwater potential in part of southwestern Basement Complex terrain of Nigeria. Appl. Water Sci. 2017, 7, 4615–4632. [Google Scholar] [CrossRef] [Green Version]
  22. Pradhan, R.M.; Guru, B.; Pradhan, B.; Biswal, T.K. Integrated multi-criteria analysis for groundwater potential mapping in Precambrian hard rock terranes (North Gujarat), India. Hydrol. Sci. J. 2021, 1–18. [Google Scholar] [CrossRef]
  23. Sendrós, A.; Urruela, A.; Himi, M.; Alonso, C.; Lovera, R.; Tapias, J.C.; Rivero, L.; Garcia-Artigas, R.; Casas, A. Characterization of a shallow coastal aquifer in the framework of a subsurface storage and soil aquifer treatment project using electrical resistivity tomography (Port de la Selva, Spain). Appl. Sci. 2021, 11, 2448. [Google Scholar] [CrossRef]
  24. Sendrós, A.; Himi, M.; Lovera, R.; Rivero, L.; Garcia-Artigas, R.; Urruela, A.; Casas, A. Geophysical characterization of hydraulic properties around a managed aquifer recharge system over the Llobregat River Alluvial Aquifer (Barcelona Metropolitan Area). Water 2020, 12, 3455. [Google Scholar] [CrossRef]
  25. Andualem, T.G.; Demeke, G.G. Groundwater potential assessment using GIS and remote sensing: A case study of Guna tana landscape, upper blue Nile Basin, Ethiopia. J. Hydrol. Reg. Stud. 2019, 24, 100610. [Google Scholar] [CrossRef]
  26. Oh, H.-J.; Kim, Y.-S.; Choi, J.-K.; Park, E.; Lee, S. GIS mapping of regional probabilistic groundwater potential in the area of Pohang City, Korea. J. Hydrol. 2011, 399, 158–172. [Google Scholar] [CrossRef]
  27. Ahirwar, S.; Malik, M.S.; Ahirwar, R.; Shukla, J.P. Application of Remote Sensing and GIS for Groundwater Recharge Potential Zone Mapping in Upper Betwa Watershed. J. Geol. Soc. India 2020, 95, 308–314. [Google Scholar] [CrossRef]
  28. Selvam, S.; Magesh, N.S.; Chidambaram, S.; Rajamanickam, M.; Sashikkumar, M.C. A GIS based identification of groundwater recharge potential zones using RS and IF technique: A case study in Ottapidaram taluk, Tuticorin district, Tamil Nadu. Environ. Earth Sci. 2015, 73, 3785–3799. [Google Scholar] [CrossRef]
  29. Khan, U.; Faheem, H.; Jiang, Z.; Wajid, M.; Younas, M.; Zhang, B. Integrating a GIS-based multi-influence factors model with hydro-geophysical exploration for groundwater potential and hydrogeological assessment: A case study in the Karak Watershed, Northern Pakistan. Water 2021, 13, 1255. [Google Scholar] [CrossRef]
  30. Anbazhagan, S.; Jothibasu, A. Geoinformatics in groundwater potential mapping and sustainable development: A case study from southern India. Hydrol. Sci. J. 2016, 61, 1109–1123. [Google Scholar] [CrossRef] [Green Version]
  31. Arefin, R. Groundwater potential zone identification at Plio-Pleistocene elevated tract, Bangladesh: AHP-GIS and remote sensing approach. Groundw. Sustain. Dev. 2020, 10, 100340. [Google Scholar] [CrossRef]
  32. Omolaiye, G.E.; Oladapo, I.M.; Ayolabi, A.E.; Akinwale, R.P.; Akinola, A.A.; Omolaye, K.L.; Sanuade, O.A. Integration of remote sensing, GIS and 2D resistivity methods in groundwater development. Appl. Water Sci. 2020, 10, 129. [Google Scholar] [CrossRef]
  33. Nag, S.K.; Ray, S. Deciphering groundwater potential zones using geospatial technology: A study in Bankura Block I and Block II, Bankura District, West Bengal. Arab. J. Sci. Eng. 2015, 40, 205–214. [Google Scholar] [CrossRef]
  34. Singh, P.; Gupta, A.; Singh, M. Hydrological inferences from watershed analysis for water resource management using remote sensing and GIS techniques. Egypt. J. Remote Sens. Space Sci. 2014, 17, 111–121. [Google Scholar] [CrossRef] [Green Version]
  35. Pathak, D.; Maharjan, R.; Maharjan, N.; Shrestha, S.R.; Timilsina, P. Evaluation of parameter sensitivity for groundwater potential mapping in the mountainous region of Nepal Himalaya. Groundw. Sustain. Dev. 2021, 13, 100562. [Google Scholar] [CrossRef]
  36. Magesh, N.S.; Chandrasekar, N.; Soundranayagam, J.P. Delineation of groundwater potential zones in Theni district, Tamil Nadu, using remote sensing, GIS and MIF techniques. Geosci. Front. 2012, 3, 189–196. [Google Scholar] [CrossRef] [Green Version]
  37. Dabral, S.; Sharma, N.; Bhatt, B.; Joshi, J.P. A geospatial technique for demarcating ground water recharge potential zones: A study of Mahi-Narmada Inter stream region, Gujarat. Int. J. Geomat. Geosci. 2013, 4, 177. [Google Scholar]
  38. Rassam, D.W.; Pagendam, D.E.; Hunter, H.M. Conceptualisation and application of models for groundwater–surface water interactions and nitrate attenuation potential in riparian zones. Environ. Model. Softw. 2008, 23, 859–875. [Google Scholar] [CrossRef]
  39. Pham, B.T.; Jaafari, A.; Prakash, I.; Singh, S.K.; Quoc, N.K.; Bui, D.T. Hybrid computational intelligence models for groundwater potential mapping. CATENA 2019, 182, 104101. [Google Scholar] [CrossRef]
  40. DCR. District Census Report of Lower Dir, Population Census Organization Statistics Division, Government of Pakistan, Islamabad, Pakistan; Pakistan Bureau of Statistics: Islamabad, Pakistan, 1998. [Google Scholar]
  41. Rashid, A.; Guan, D.-X.; Farooqi, A.; Khan, S.; Zahir, S.; Jehan, S.; Khattak, S.A.; Khan, M.S.; Khan, R. Fluoride prevalence in groundwater around a fluorite mining area in the flood plain of the River Swat, Pakistan. Sci. Total Environ. 2018, 635, 203–215. [Google Scholar] [CrossRef] [Green Version]
  42. Ahmed, T.H.; Al-Manmi, D.A.M. Delineation of groundwater productivity zones with the integration of GIS and remote sensing methods, Bazian Basin, Sulaymaniyah, Kurdistan Region, Iraq. J. Basrah Res. Sci. 2019, 45, 289–300. [Google Scholar]
  43. Anbarasu, S.; Brindha, K.; Elango, L. Multi-influencing factor method for delineation of groundwater potential zones using remote sensing and GIS techniques in the western part of Perambalur district, southern India. Earth Sci. Inform. 2019, 13, 1–16. [Google Scholar] [CrossRef]
  44. Thapa, R.; Gupta, S.; Guin, S.; Kaur, H. Assessment of groundwater potential zones using multi-influencing factor (MIF) and GIS: A case study from Birbhum district, West Bengal. Appl. Water Sci. 2017, 7, 4117–4131. [Google Scholar] [CrossRef]
  45. Nasir, M.J.; Khan, S.; Zahid, H.; Khan, A. Delineation of groundwater potential zones using GIS and multi influence factor (MIF) techniques: A study of district Swat, Khyber Pakhtunkhwa, Pakistan. Environ. Earth Sci. 2018, 77, 367. [Google Scholar] [CrossRef]
  46. Sarwar, A.; Saifullah; Gulzar, S.; Sohail, M.; Nadia, Q.; Khurshid, T.; Nawaz, R.; Rehmani, M.I.A. Land use land cover change analysis (2000–2018) of tehsil Katlang, district Mardan, Pakistan, using GIS and remote sensing. J. Environ. Agric. Sci. 2019, 20, 21–27. [Google Scholar]
  47. Adham, M.I.; Jahan, C.S.; Mazumder, Q.H.; Hossain, M.M.A.; Haque, A.-M. Study on groundwater recharge potentiality of Barind Tract, Rajshahi District, Bangladesh using GIS and Remote Sensing technique. J. Geol. Soc. India 2010, 75, 432–438. [Google Scholar] [CrossRef]
  48. Arunbose, S.; Srinivas, Y.; Rajkumar, S.; Nair, N.C.; Kaliraj, S. Remote sensing, GIS and AHP techniques based investigation of groundwater potential zones in the Karumeniyar river basin, Tamil Nadu, southern India. Groundw. Sustain. Dev. 2021, 14, 100586. [Google Scholar] [CrossRef]
  49. Fashae, O.A.; Tijani, M.N.; Talabi, A.O.; Adedeji, O.I. Delineation of groundwater potential zones in the crystalline basement terrain of SW-Nigeria: An integrated GIS and remote sensing approach. Appl. Water Sci. 2014, 4, 19–38. [Google Scholar] [CrossRef] [Green Version]
  50. Mokadem, N.; Boughariou, E.; Mudarra, M.; Ben Brahim, F.; Andreo, B.; Hamed, Y.; Bouri, S. Mapping potential zones for groundwater recharge and its evaluation in arid environments using a GIS approach: Case study of North Gafsa Basin (Central Tunisia). J. Afr. Earth Sci. 2018, 141, 107–117. [Google Scholar] [CrossRef]
  51. Khan, N.; Shah, S.J.; Rauf, T.; Zada, M.; Yukun, C.; Harbi, J. Socioeconomic Impacts of the Billion Trees Afforestation Program in Khyber Pakhtunkhwa Province (KPK), Pakistan. Forests 2019, 10, 703. [Google Scholar] [CrossRef] [Green Version]
  52. Rauf, T.; Khan, N.; Shah, S.J.; Zada, M.; Malik, S.Y.; Yukun, C.; Sadique, A. Poverty and Prosperity: Impact on Livelihood Assets of Billion Trees Afforestation Program in Khyber Pakhtunkhwa (KPK), Pakistan. Forests 2019, 10, 916. [Google Scholar] [CrossRef] [Green Version]
  53. Xia, H.; Zhao, J.; Qin, Y.; Yang, J.; Cui, Y.; Song, H.; Ma, L.; Jin, N.; Meng, Q. Changes in Water Surface Area during 1989–2017 in the Huai River Basin using Landsat Data and Google Earth Engine. Remote Sens. 2019, 11, 1824. [Google Scholar] [CrossRef] [Green Version]
  54. Avinash, K.; Deepika, B.; Jayappa, K.S. Basin geomorphology and drainage morphometry parameters used as indicators for groundwater prospect: Insight from geographical information system (GIS) technique. J. Earth Sci. 2014, 25, 1018–1032. [Google Scholar] [CrossRef]
  55. Gnanachandrasamy, G.; Zhou, Y.; Bagyaraj, M.; Venkatramanan, S.; Ramkumar, T.; Wang, S. Remote Sensing and GIS Based Groundwater Potential Zone Mapping in Ariyalur District, Tamil Nadu. J. Geol. Soc. India 2018, 92, 484–490. [Google Scholar] [CrossRef]
  56. Singha, S.; Das, P.; Singha, S.S. A fuzzy geospatial approach for delineation of groundwater potential zones in Raipur district, India. Groundw. Sustain. Dev. 2021, 12, 100529. [Google Scholar] [CrossRef]
  57. Aykut, T. Determination of groundwater potential zones using Geographical Information Systems (GIS) and Analytic Hierarchy Process (AHP) between Edirne-Kalkansogut (northwestern Turkey). Groundw. Sustain. Dev. 2021, 12, 100545. [Google Scholar] [CrossRef]
Figure 1. Map showing the location of study area, district Lower Dir.
Atmosphere 12 00669 g001
Figure 2. Flowchart showing methodology adapted for delineating the groundwater potential zones.
Atmosphere 12 00669 g002
Figure 3. Interrelationship between the multi influencing factors concerning the groundwater potential zone.
Atmosphere 12 00669 g003
Figure 4. Temporal changes in land cover from (a) 1998 to (b) 2018.
Atmosphere 12 00669 g004
Figure 5. The thematic maps of (MIF) used for Identification of groundwater potential zones in Lower Dir: (a) geology; (b) drainage density; (c) rainfall; (d) lineament density; (e) land cover; (f) soil type; and (g) slope.
Atmosphere 12 00669 g005aAtmosphere 12 00669 g005bAtmosphere 12 00669 g005cAtmosphere 12 00669 g005d
Figure 6. Delineated groundwater potential zones in Lower Dir District, Khyber Pakhtunkhwa, Pakistan.
Atmosphere 12 00669 g006
Figure 7. Map shows the groundwater potential zones in Lower Dir, Khyber Pakhtunkhwa, Pakistan overlay by water depth.
Atmosphere 12 00669 g007
Table 1. Relative rates and score of each influencing factor (Major and Minor).
Influencing Factor(High) Major Effect (A)(Low) Minor Effect (B)Proposed Relative Rates (A + B)Proposed Score of Each Influencing Factor (MIF)
Land cover2 + 2 + 21 + 1820
Lineament density2 + 21 + 1615
Topography (Slope)2 + 21 + 1615
Drainage density2 + 21 + 1615
Soil type21 + 1410
Geology1125
Rainfall2 + 2 + 21 + 1820
∑40∑100
MIF, multiple influencing factor, as calculated by Equation (1).
Table 2. The weight and ranks assigned of each influencing parameters the groundwater recharge within a thematic layer.
Selected Layers (Parameters)Sub Classes within Influencing Parameter(Qualitative Rank)Weight of Respectively Influencing LayerGroundwater Prospects (Quantitative Rank)
GeologyMetamorphic + Igneous rocksHigh53
Moderate2
Sedimentary rockLow1
Drainage density (km/km2)0–11.34High157
11.34–32.46Moderate5
32.46–55.93Low2
55.93–99.94Very Low1
Rainfall (mm)107–116High208
116–121Good5
121–125Moderate4
125–129Low2
129–132Very low1
Lineament Density (km/km2)0–0.16High157
0.16–0.41Moderate5
0.41–0.75Low2
0.75–1.66Very Low1
Land coverWater bodiesVery high208
Agriculture landHigh5
Forest coverModerate4
Urban areaLow2
Barren landVery low1
Soil TypeLoamy Shallow SoilHigh 5
Loamy and Clayey soilModerate 3
Thin loamy soil with rocky outcropVery low 2
Slope0o–50.62oHigh157
50.62o–71.72oModerate5
71.72o–83.32oLow2
83.32o–89.65oVery low1
Table 3. Temporal changes in land use classes between 1996 and 2018 (expressed in%).
Land Use Classes1996 (%)2018 (%)% Change
Vegetation44.8534.84−22.32
Forest cover20.2727.2334.34
Barren land16.1816.914.51
Water bodies10.842.52−76.75
Urban area 7.8420.47161.10
Publisher’s Note: MDPI stays neutral with regard to jurisdictional claims in published maps and institutional affiliations.

