
Effects of Densification on Urban Microclimate—A Case Study for the City of Vienna

 ,
,  ,
,
Abstract
:1. Introduction
2. Background
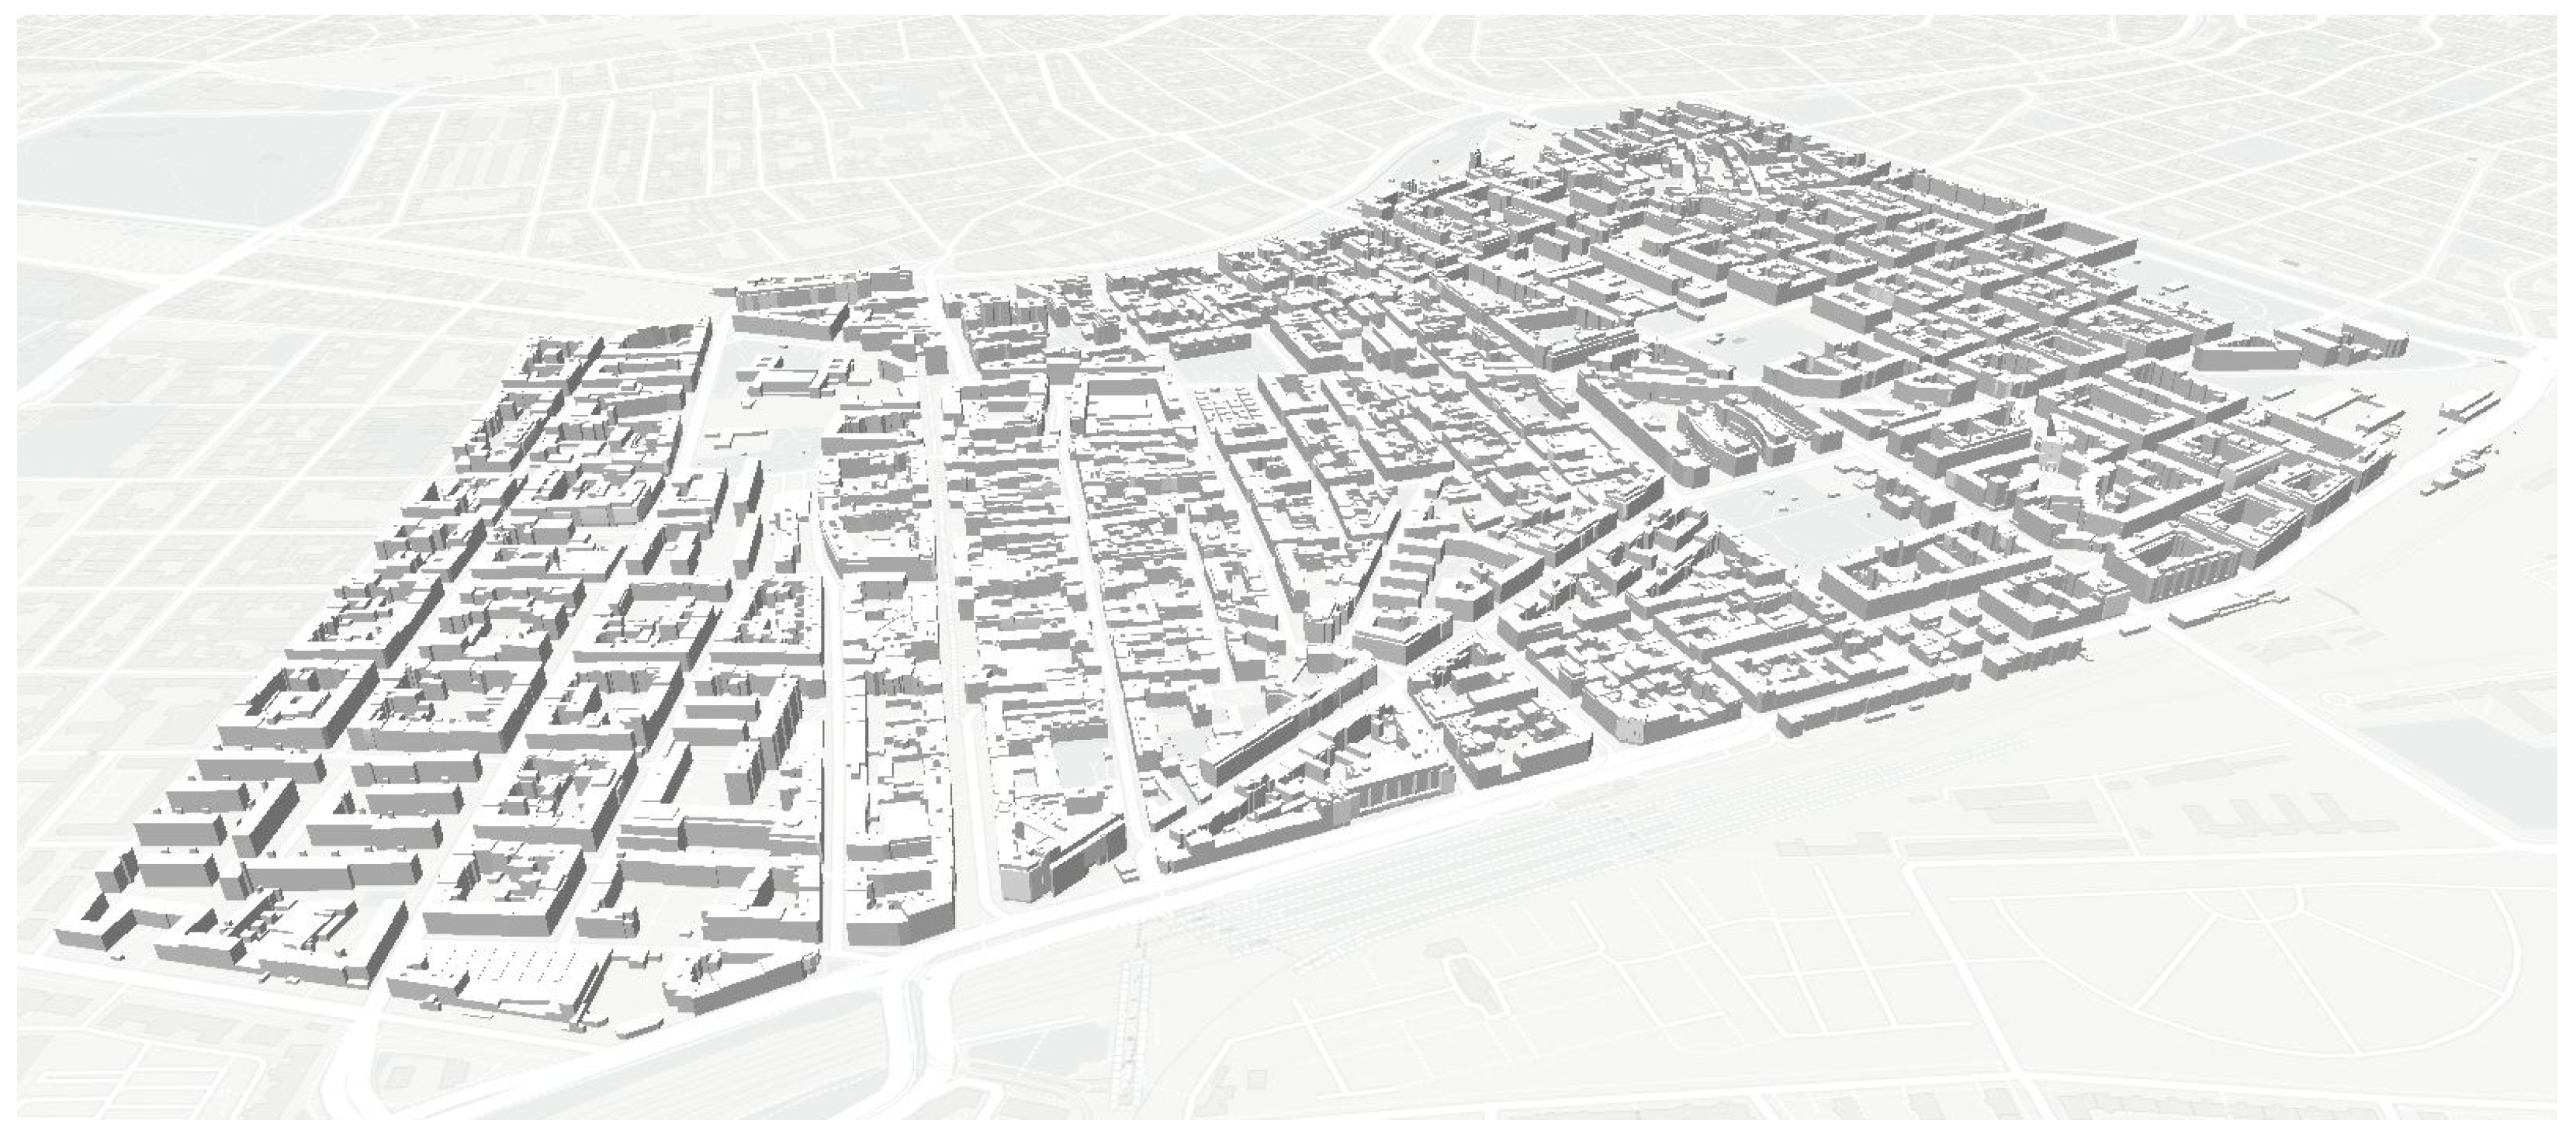
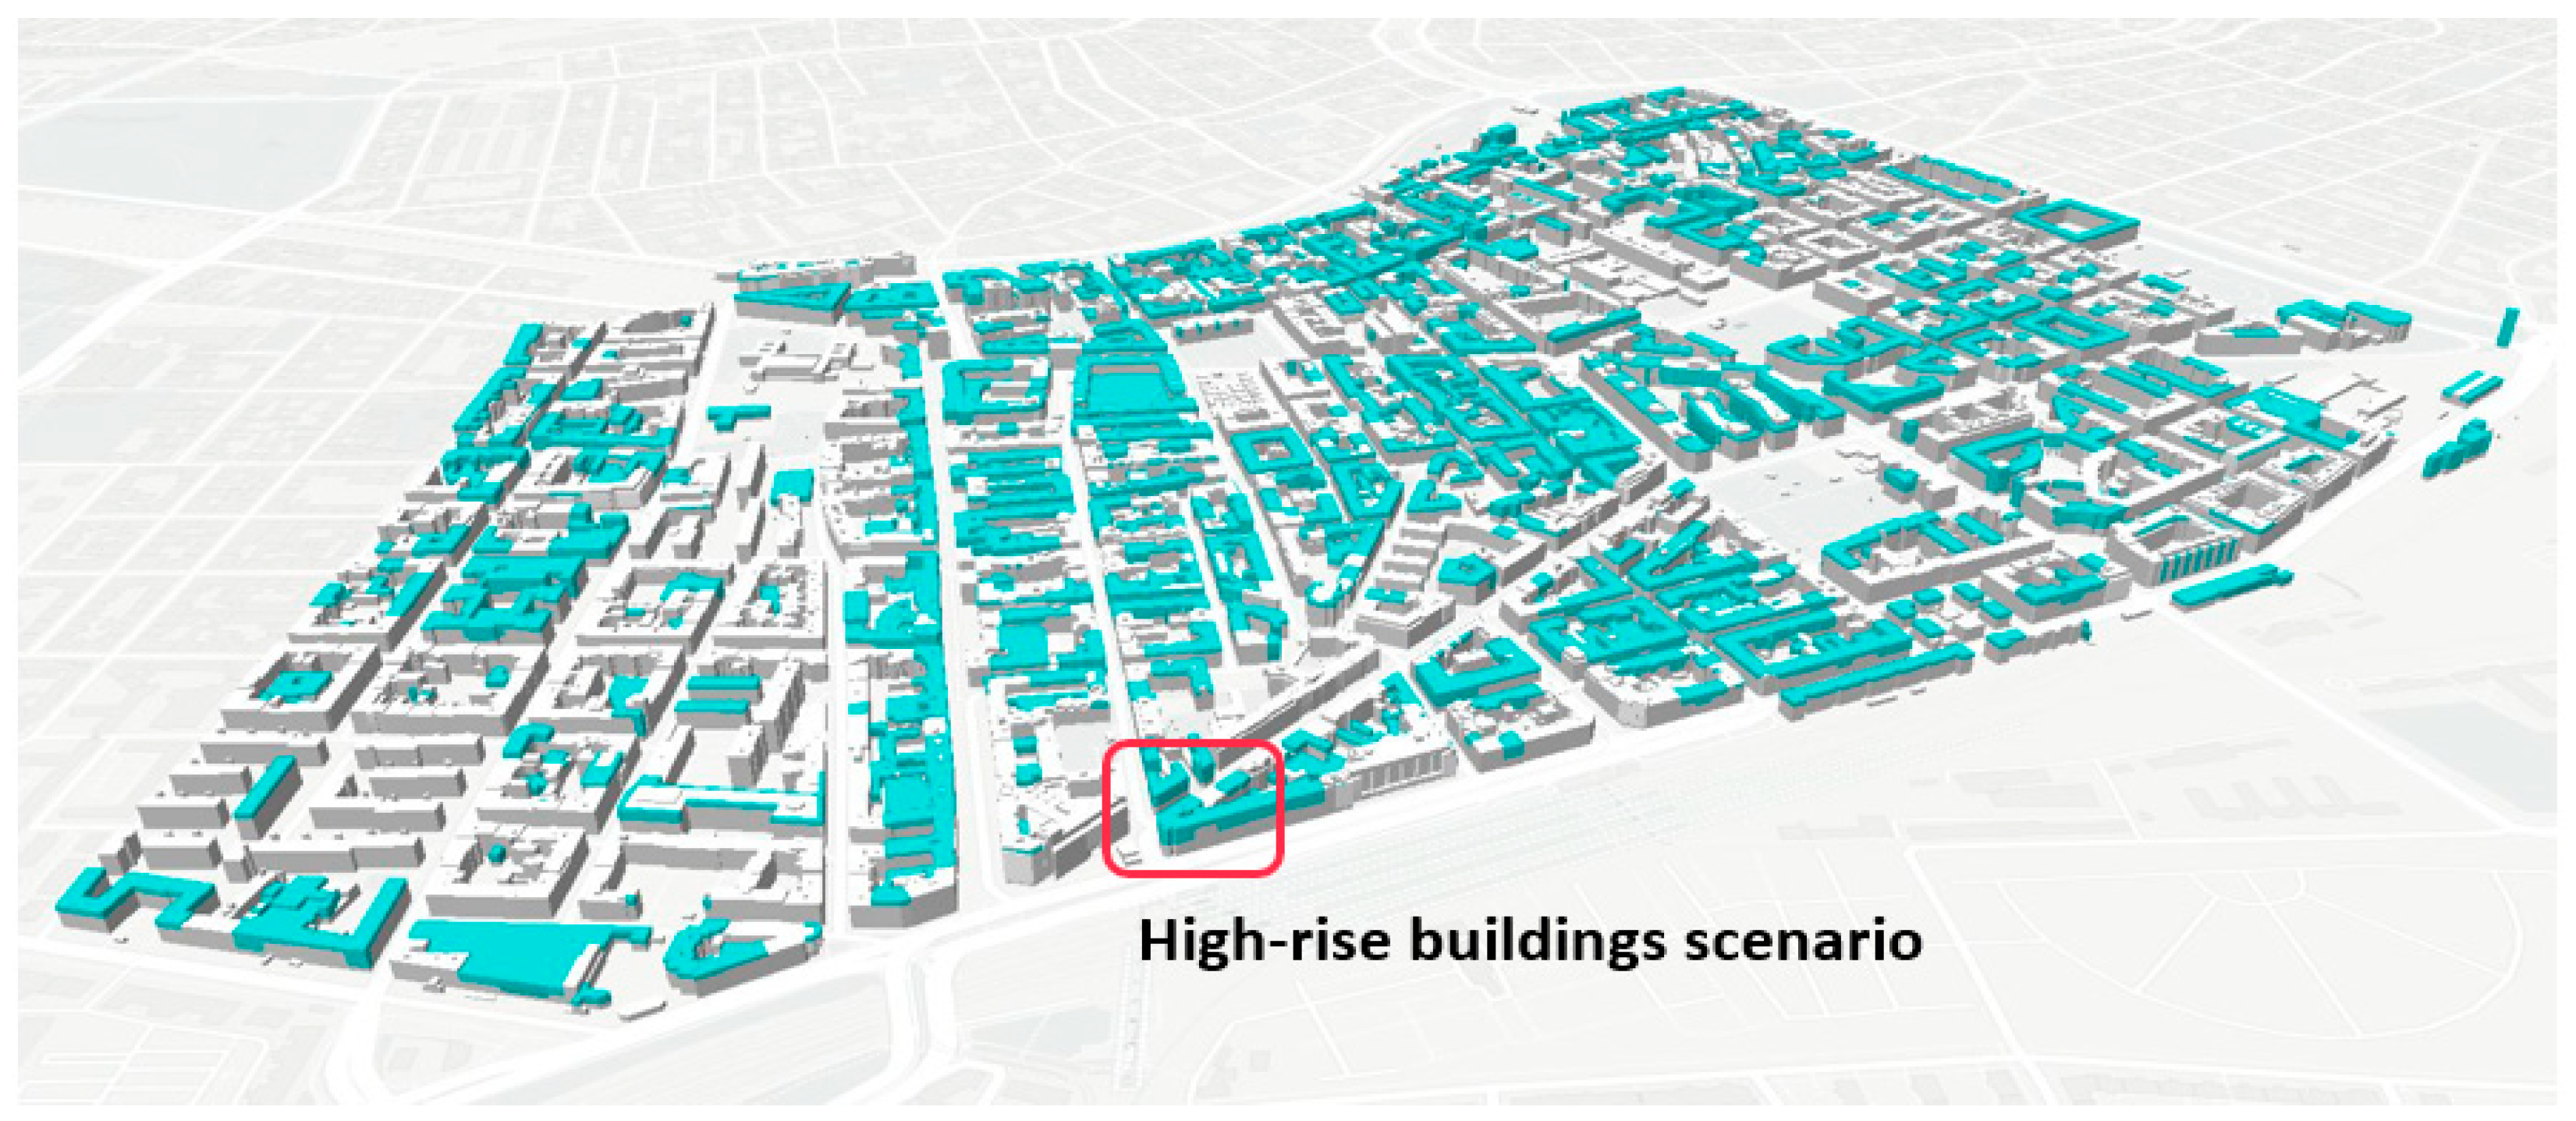
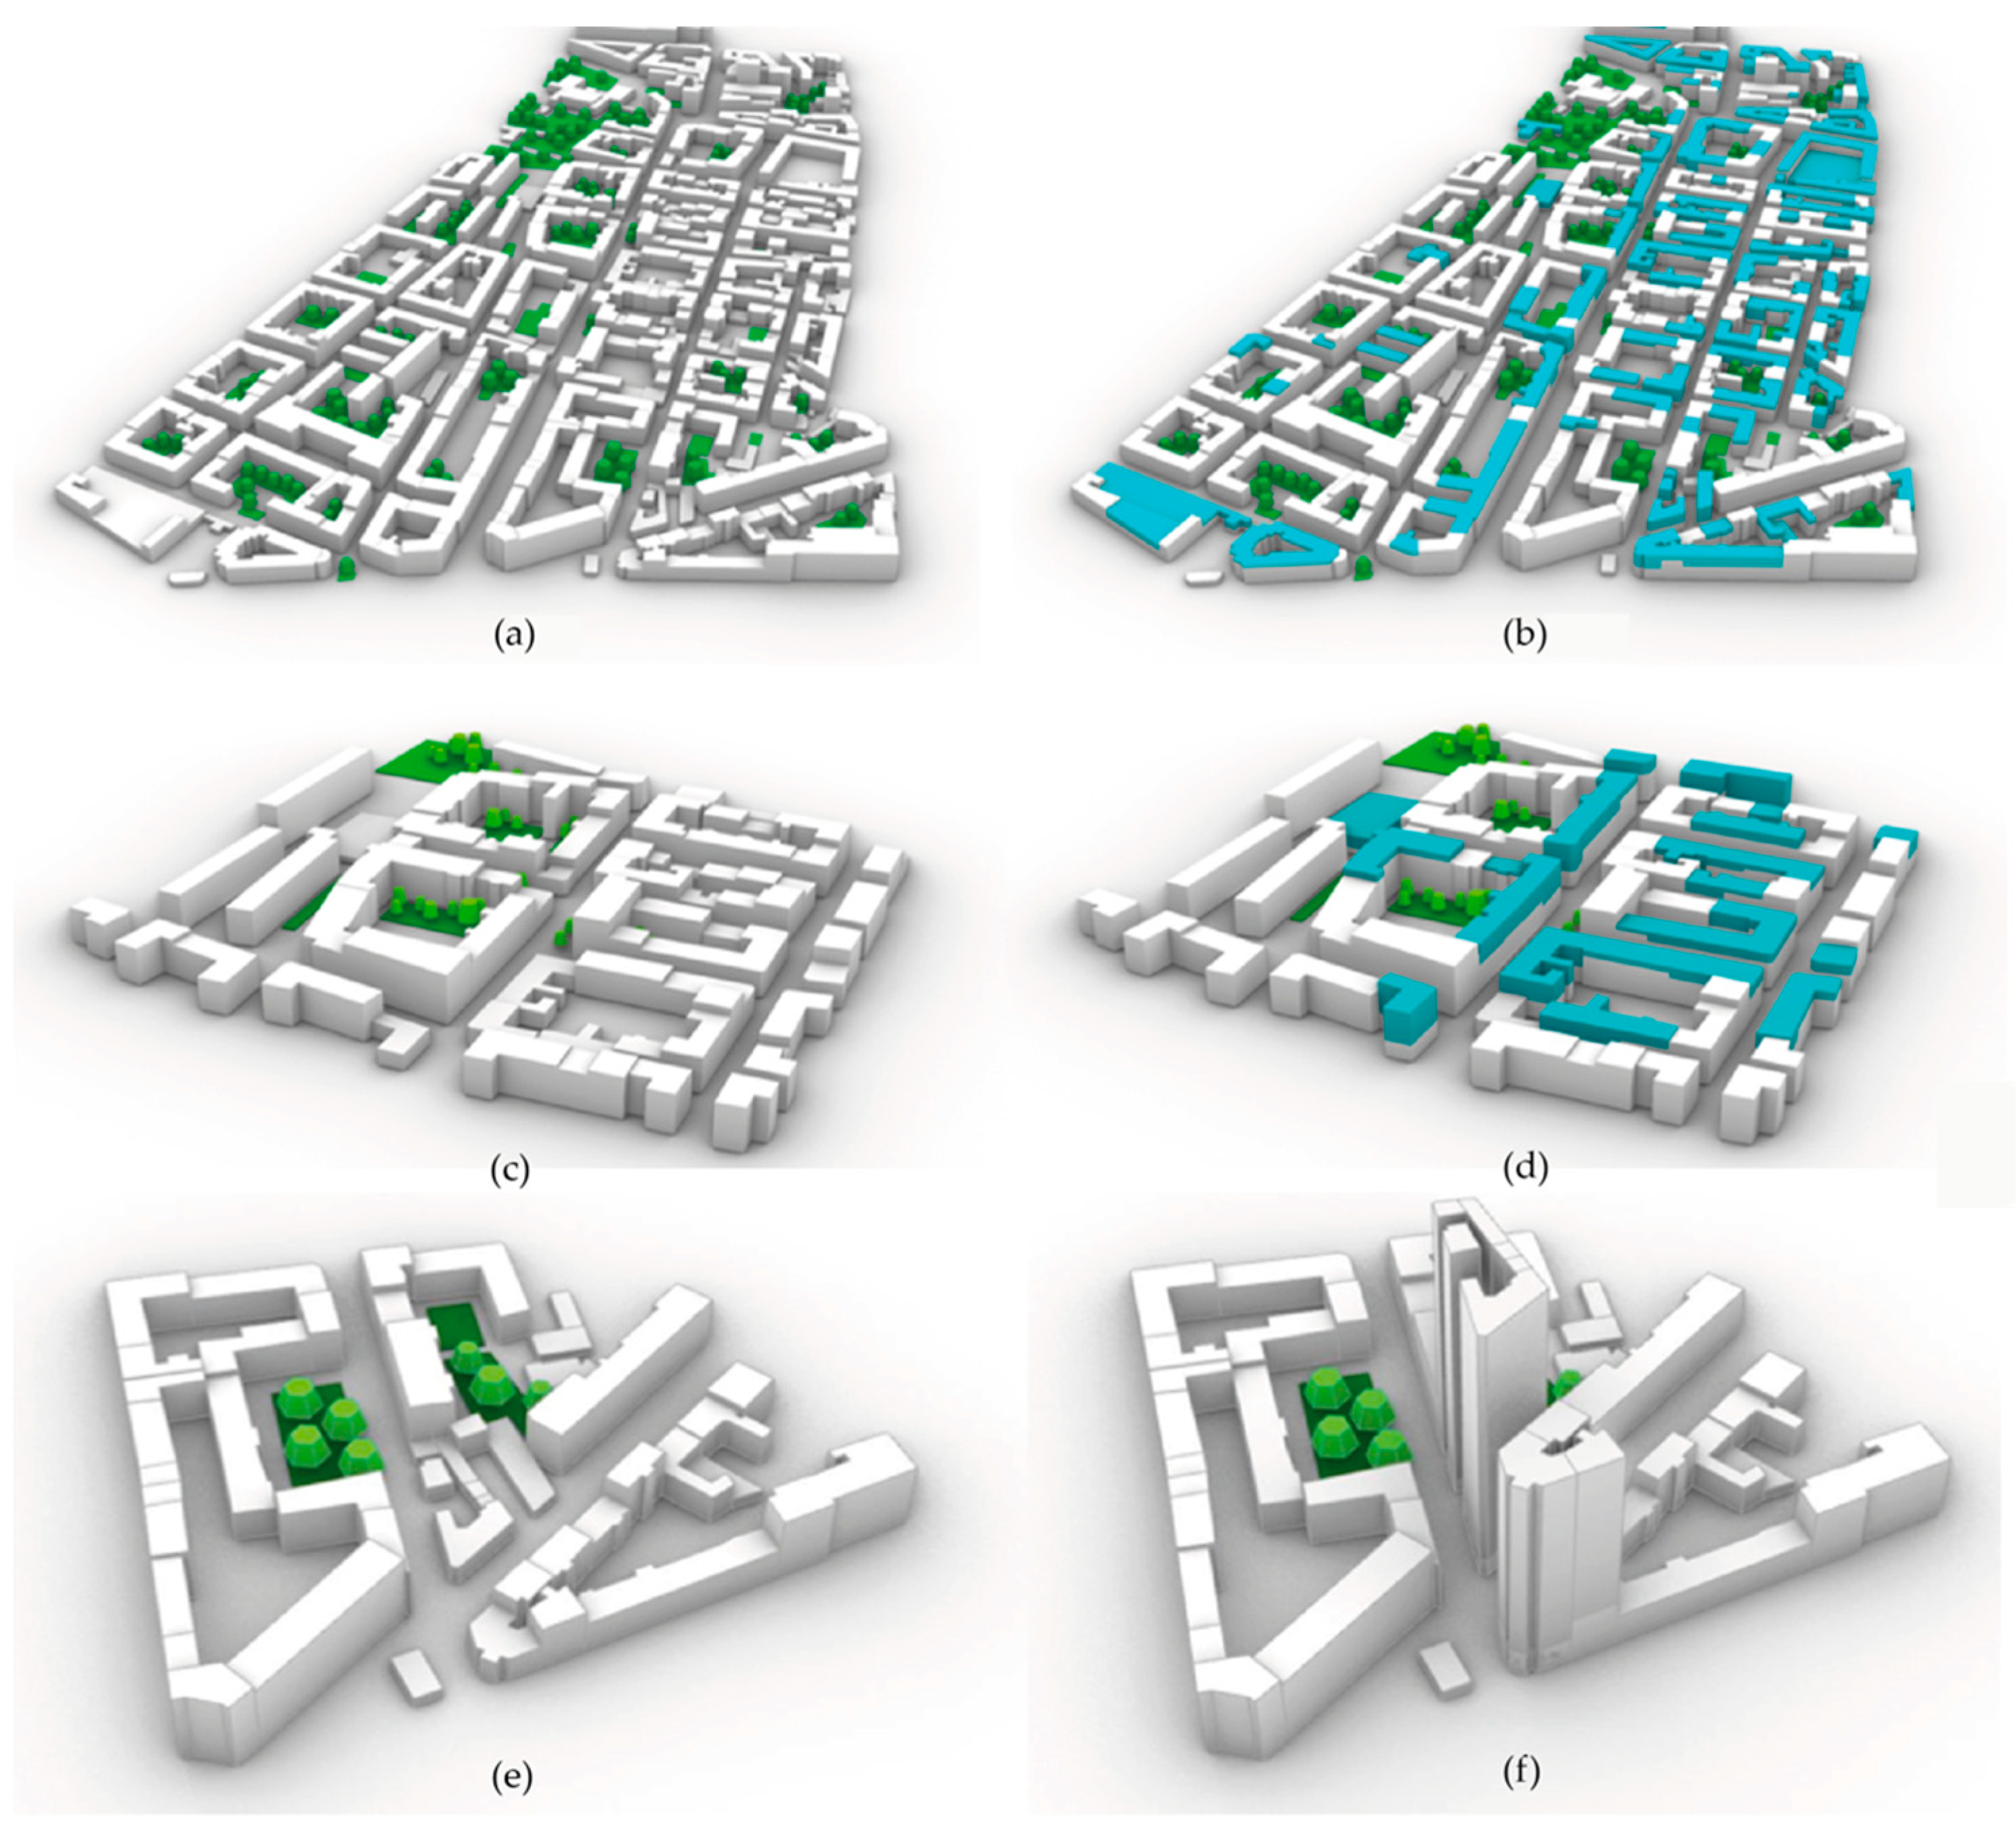
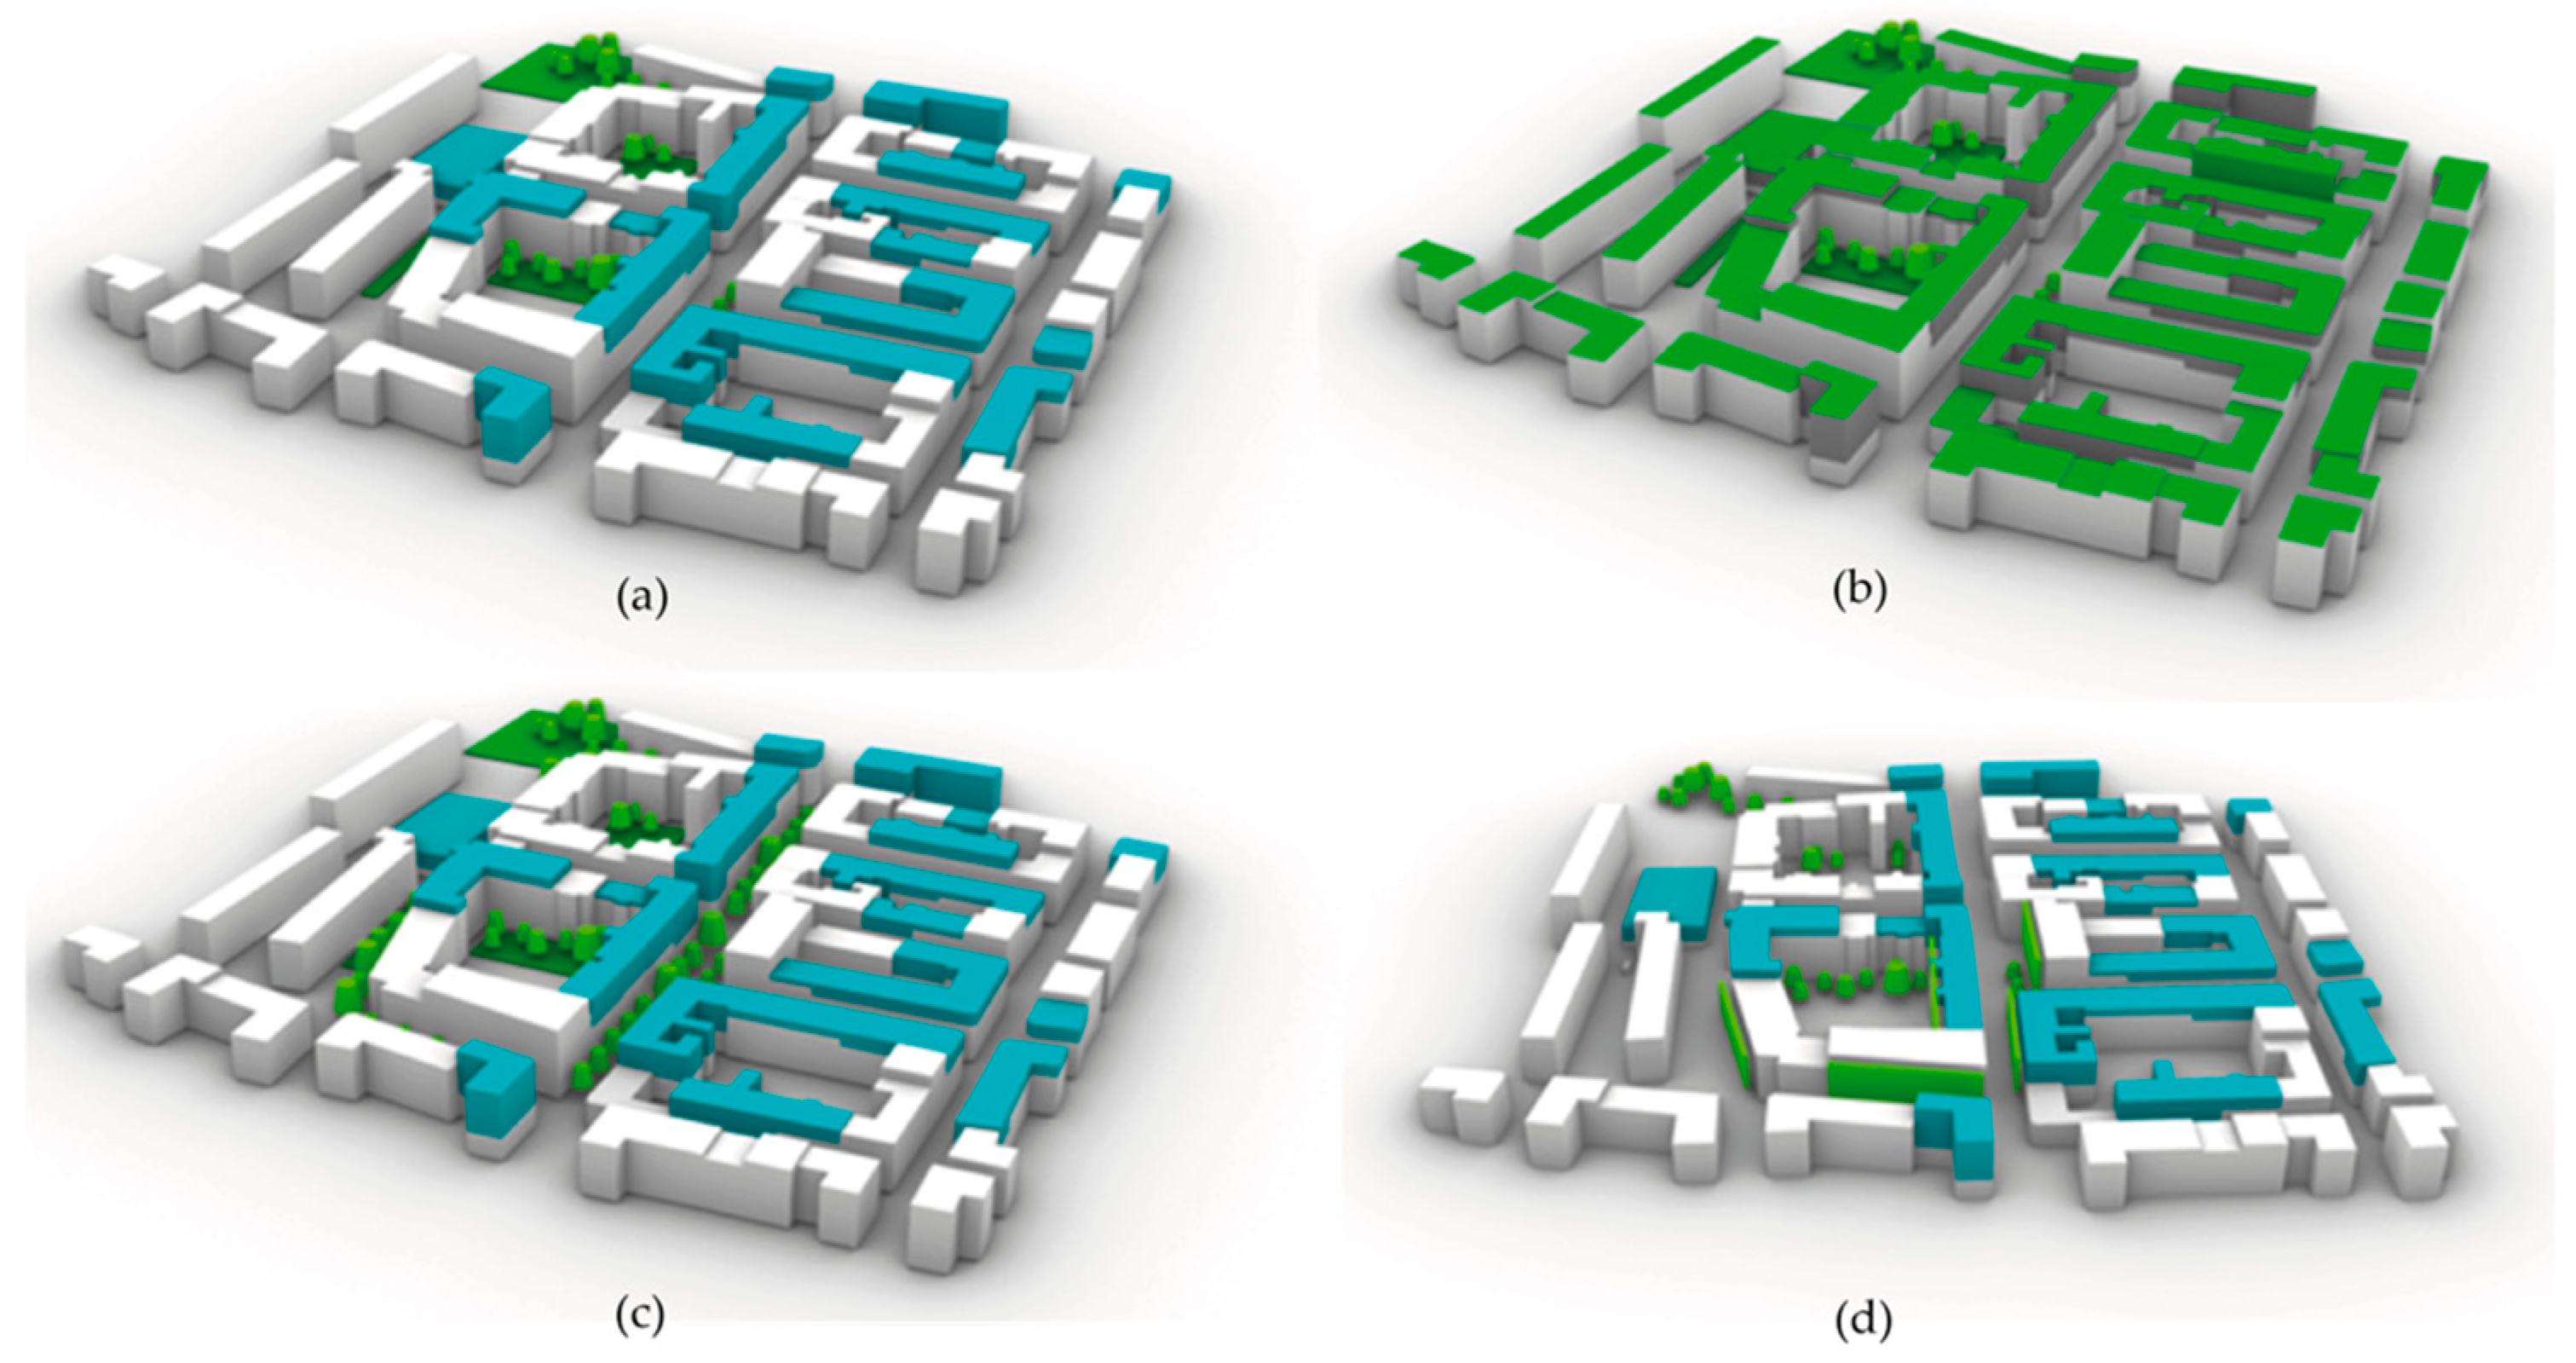
3. Methods
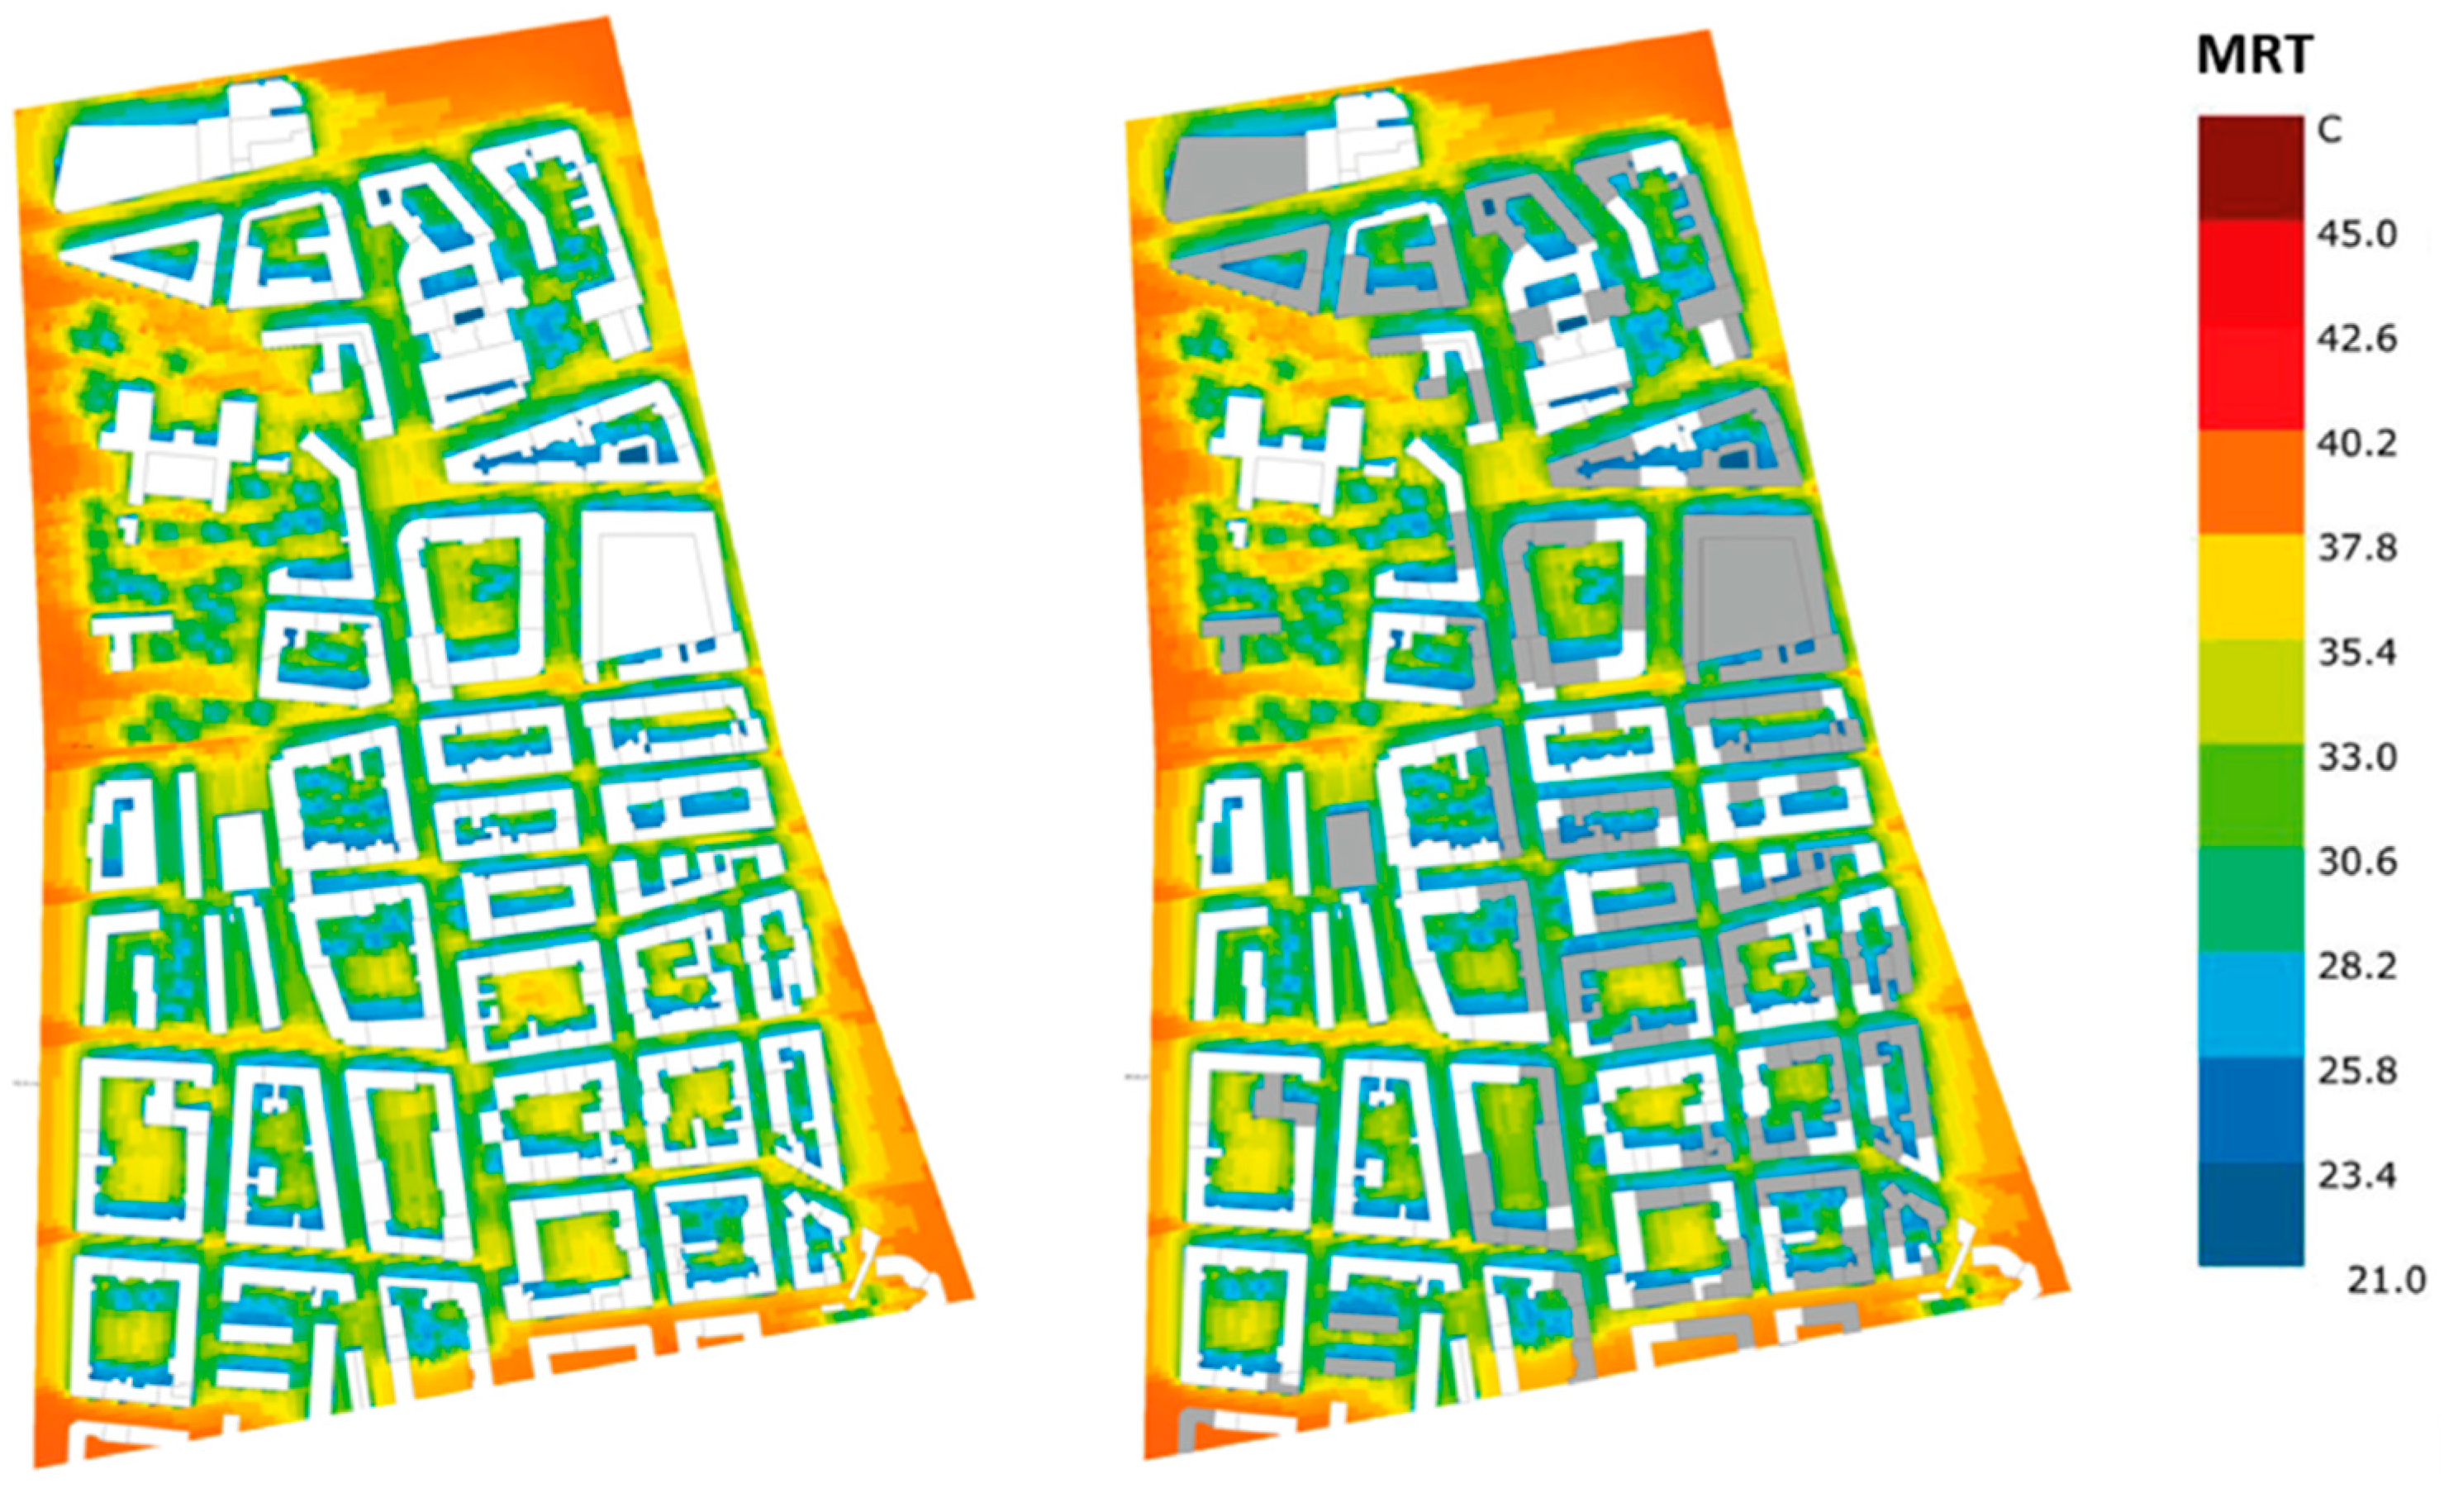
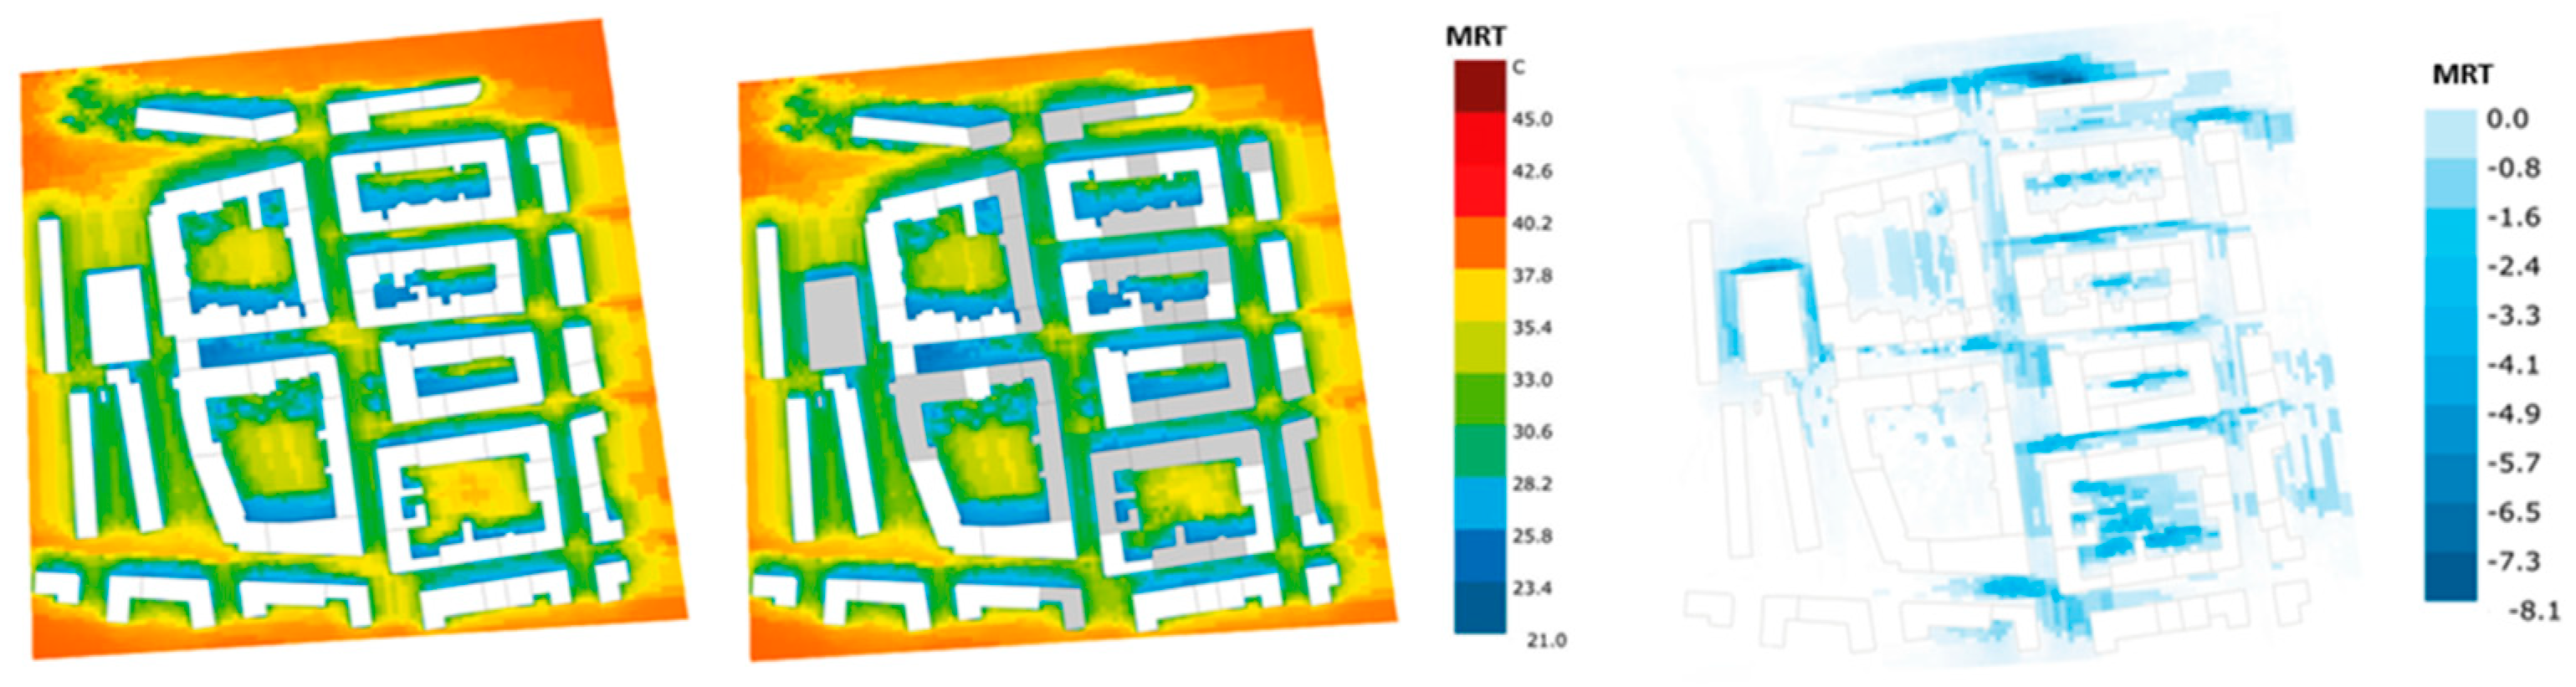
3.1. Microclimate Analysis
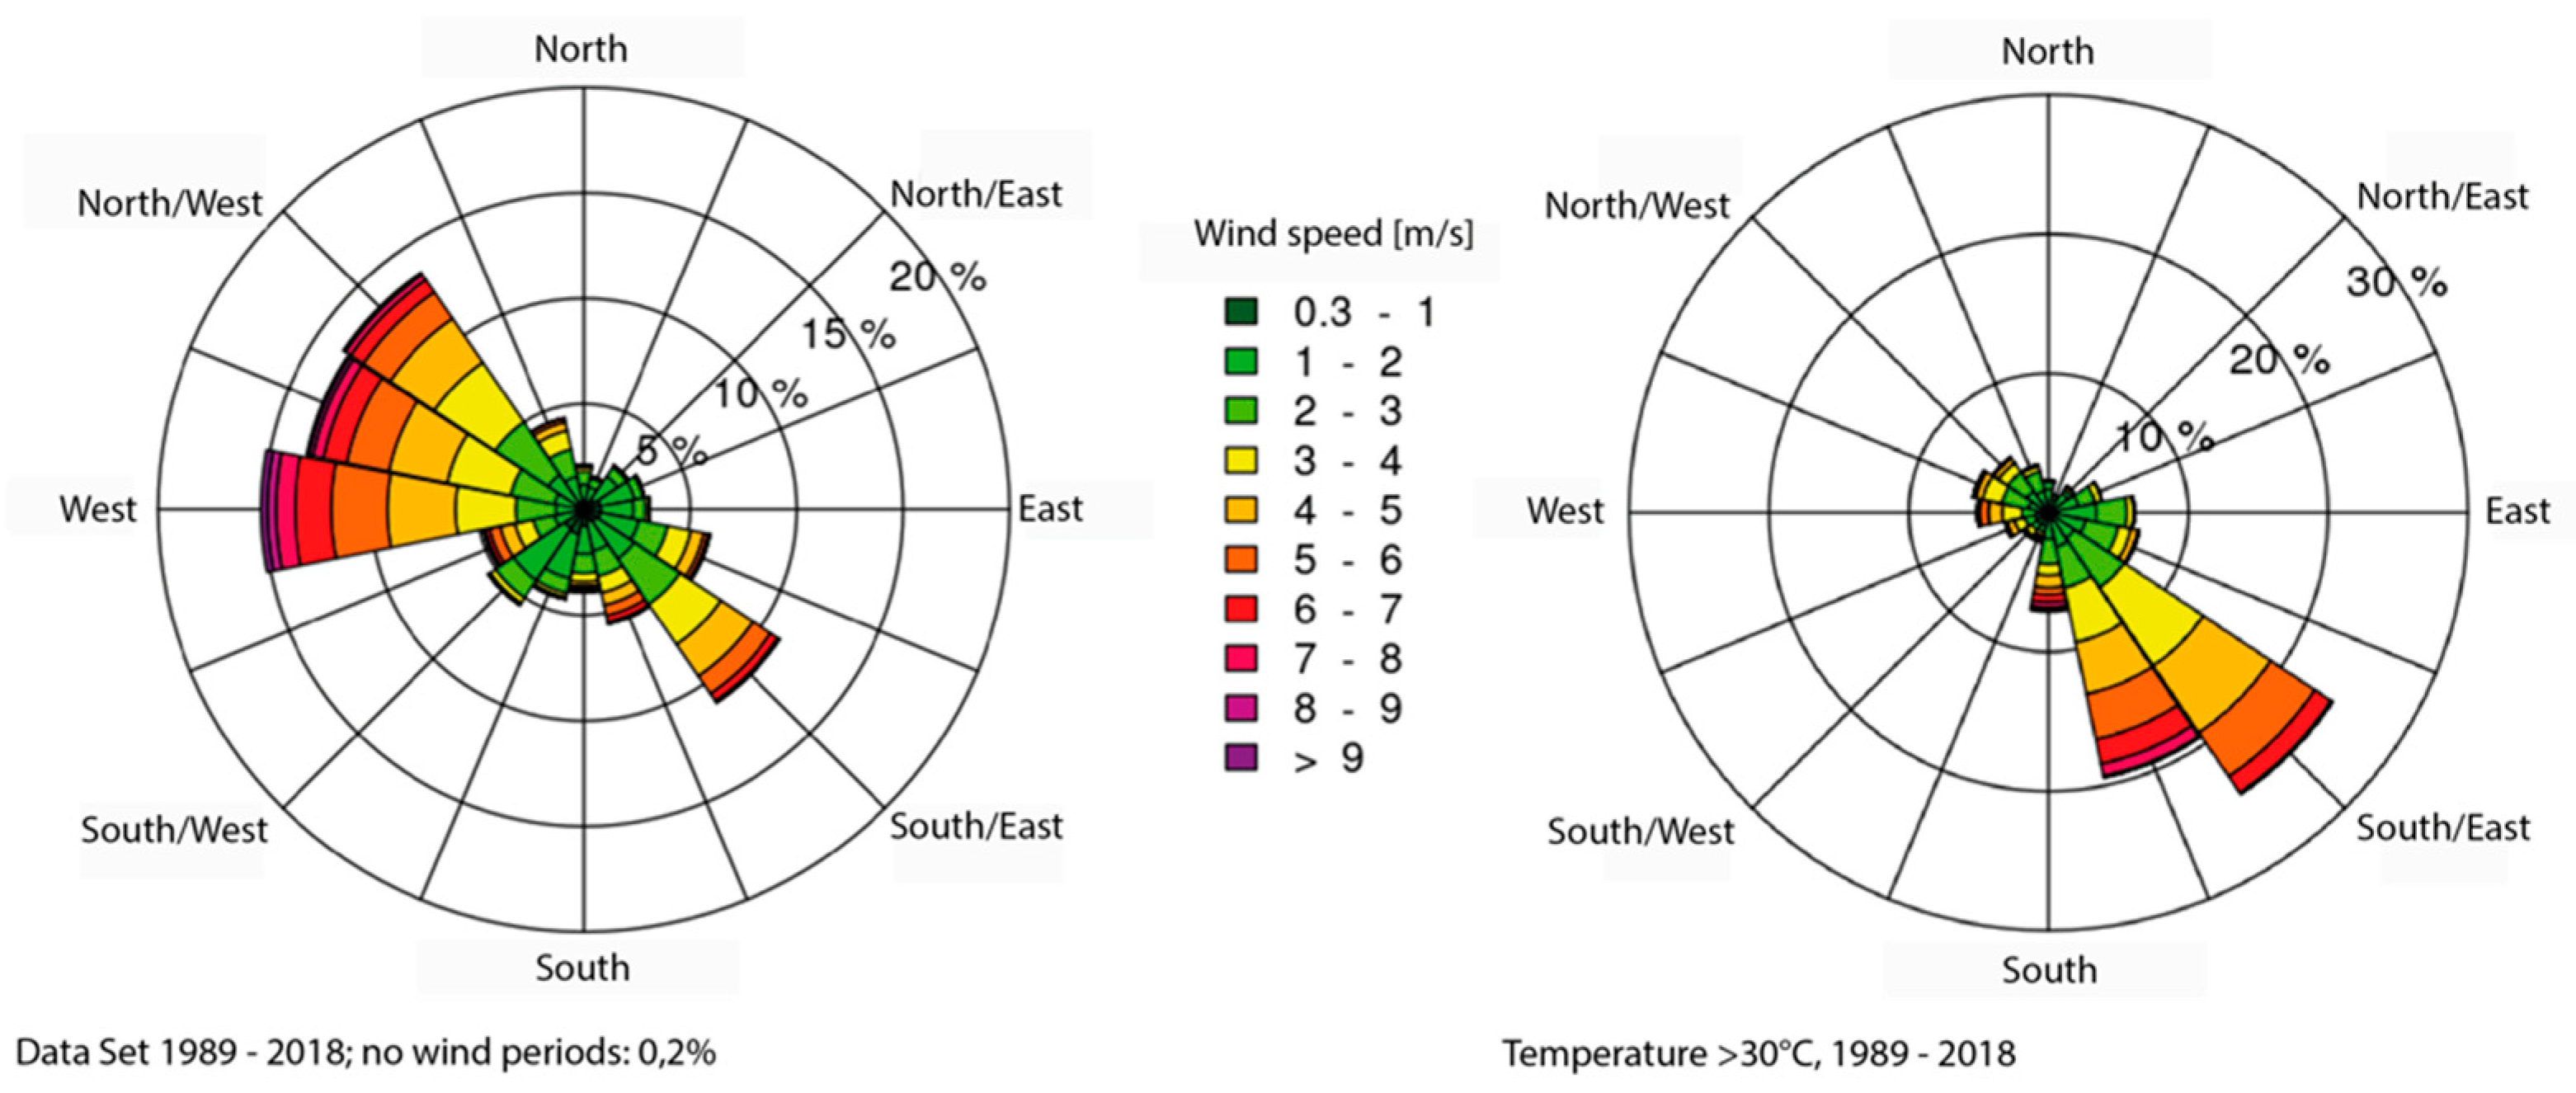
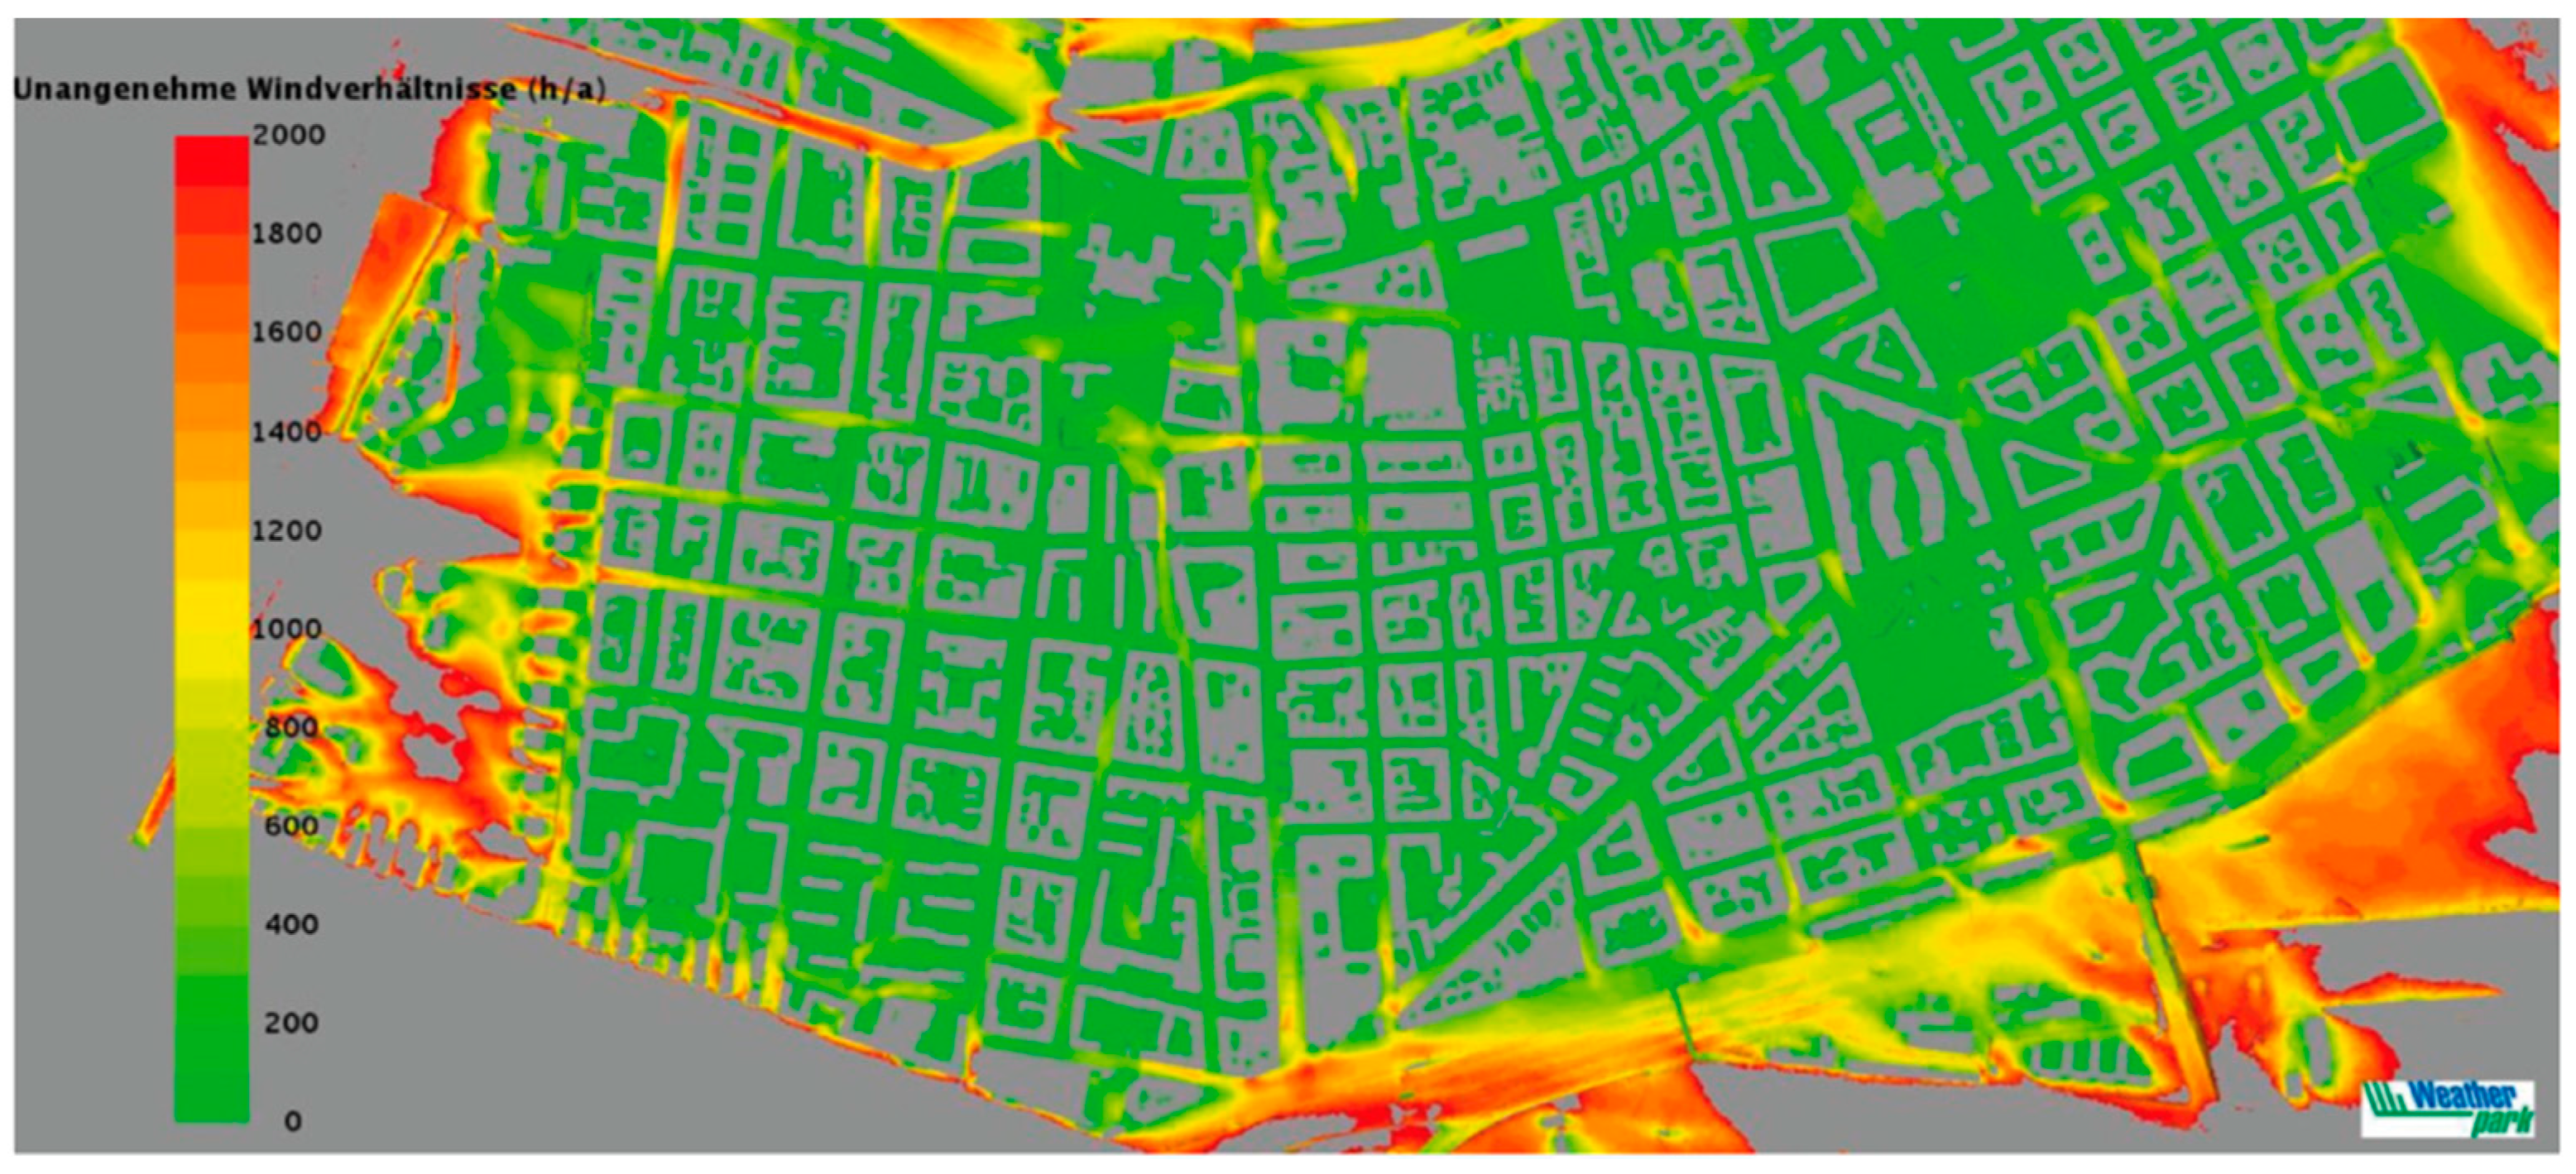
3.2. Wind Analysis
3.3. Indoor Climate Analysis
4. Results
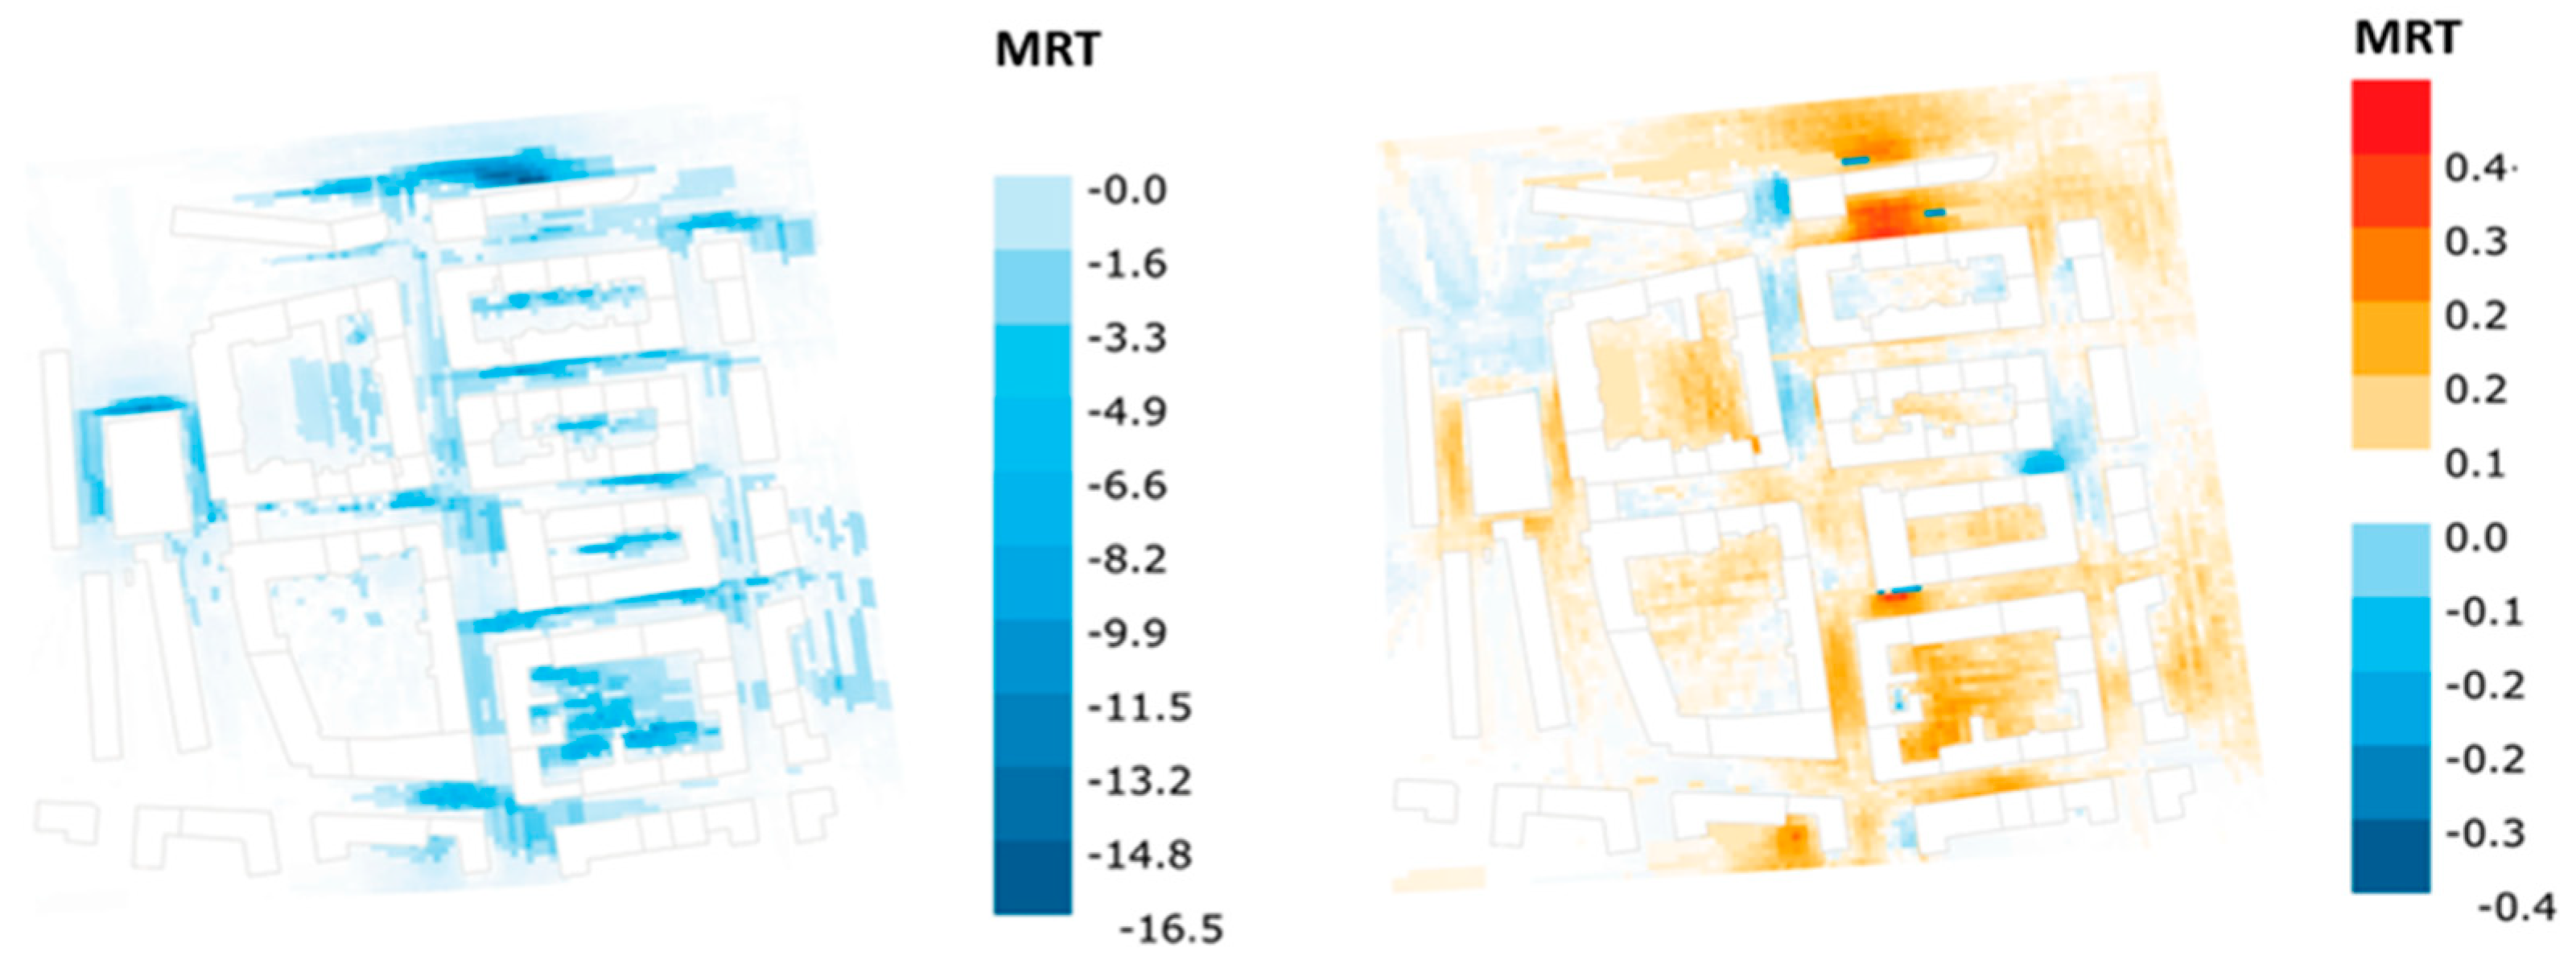
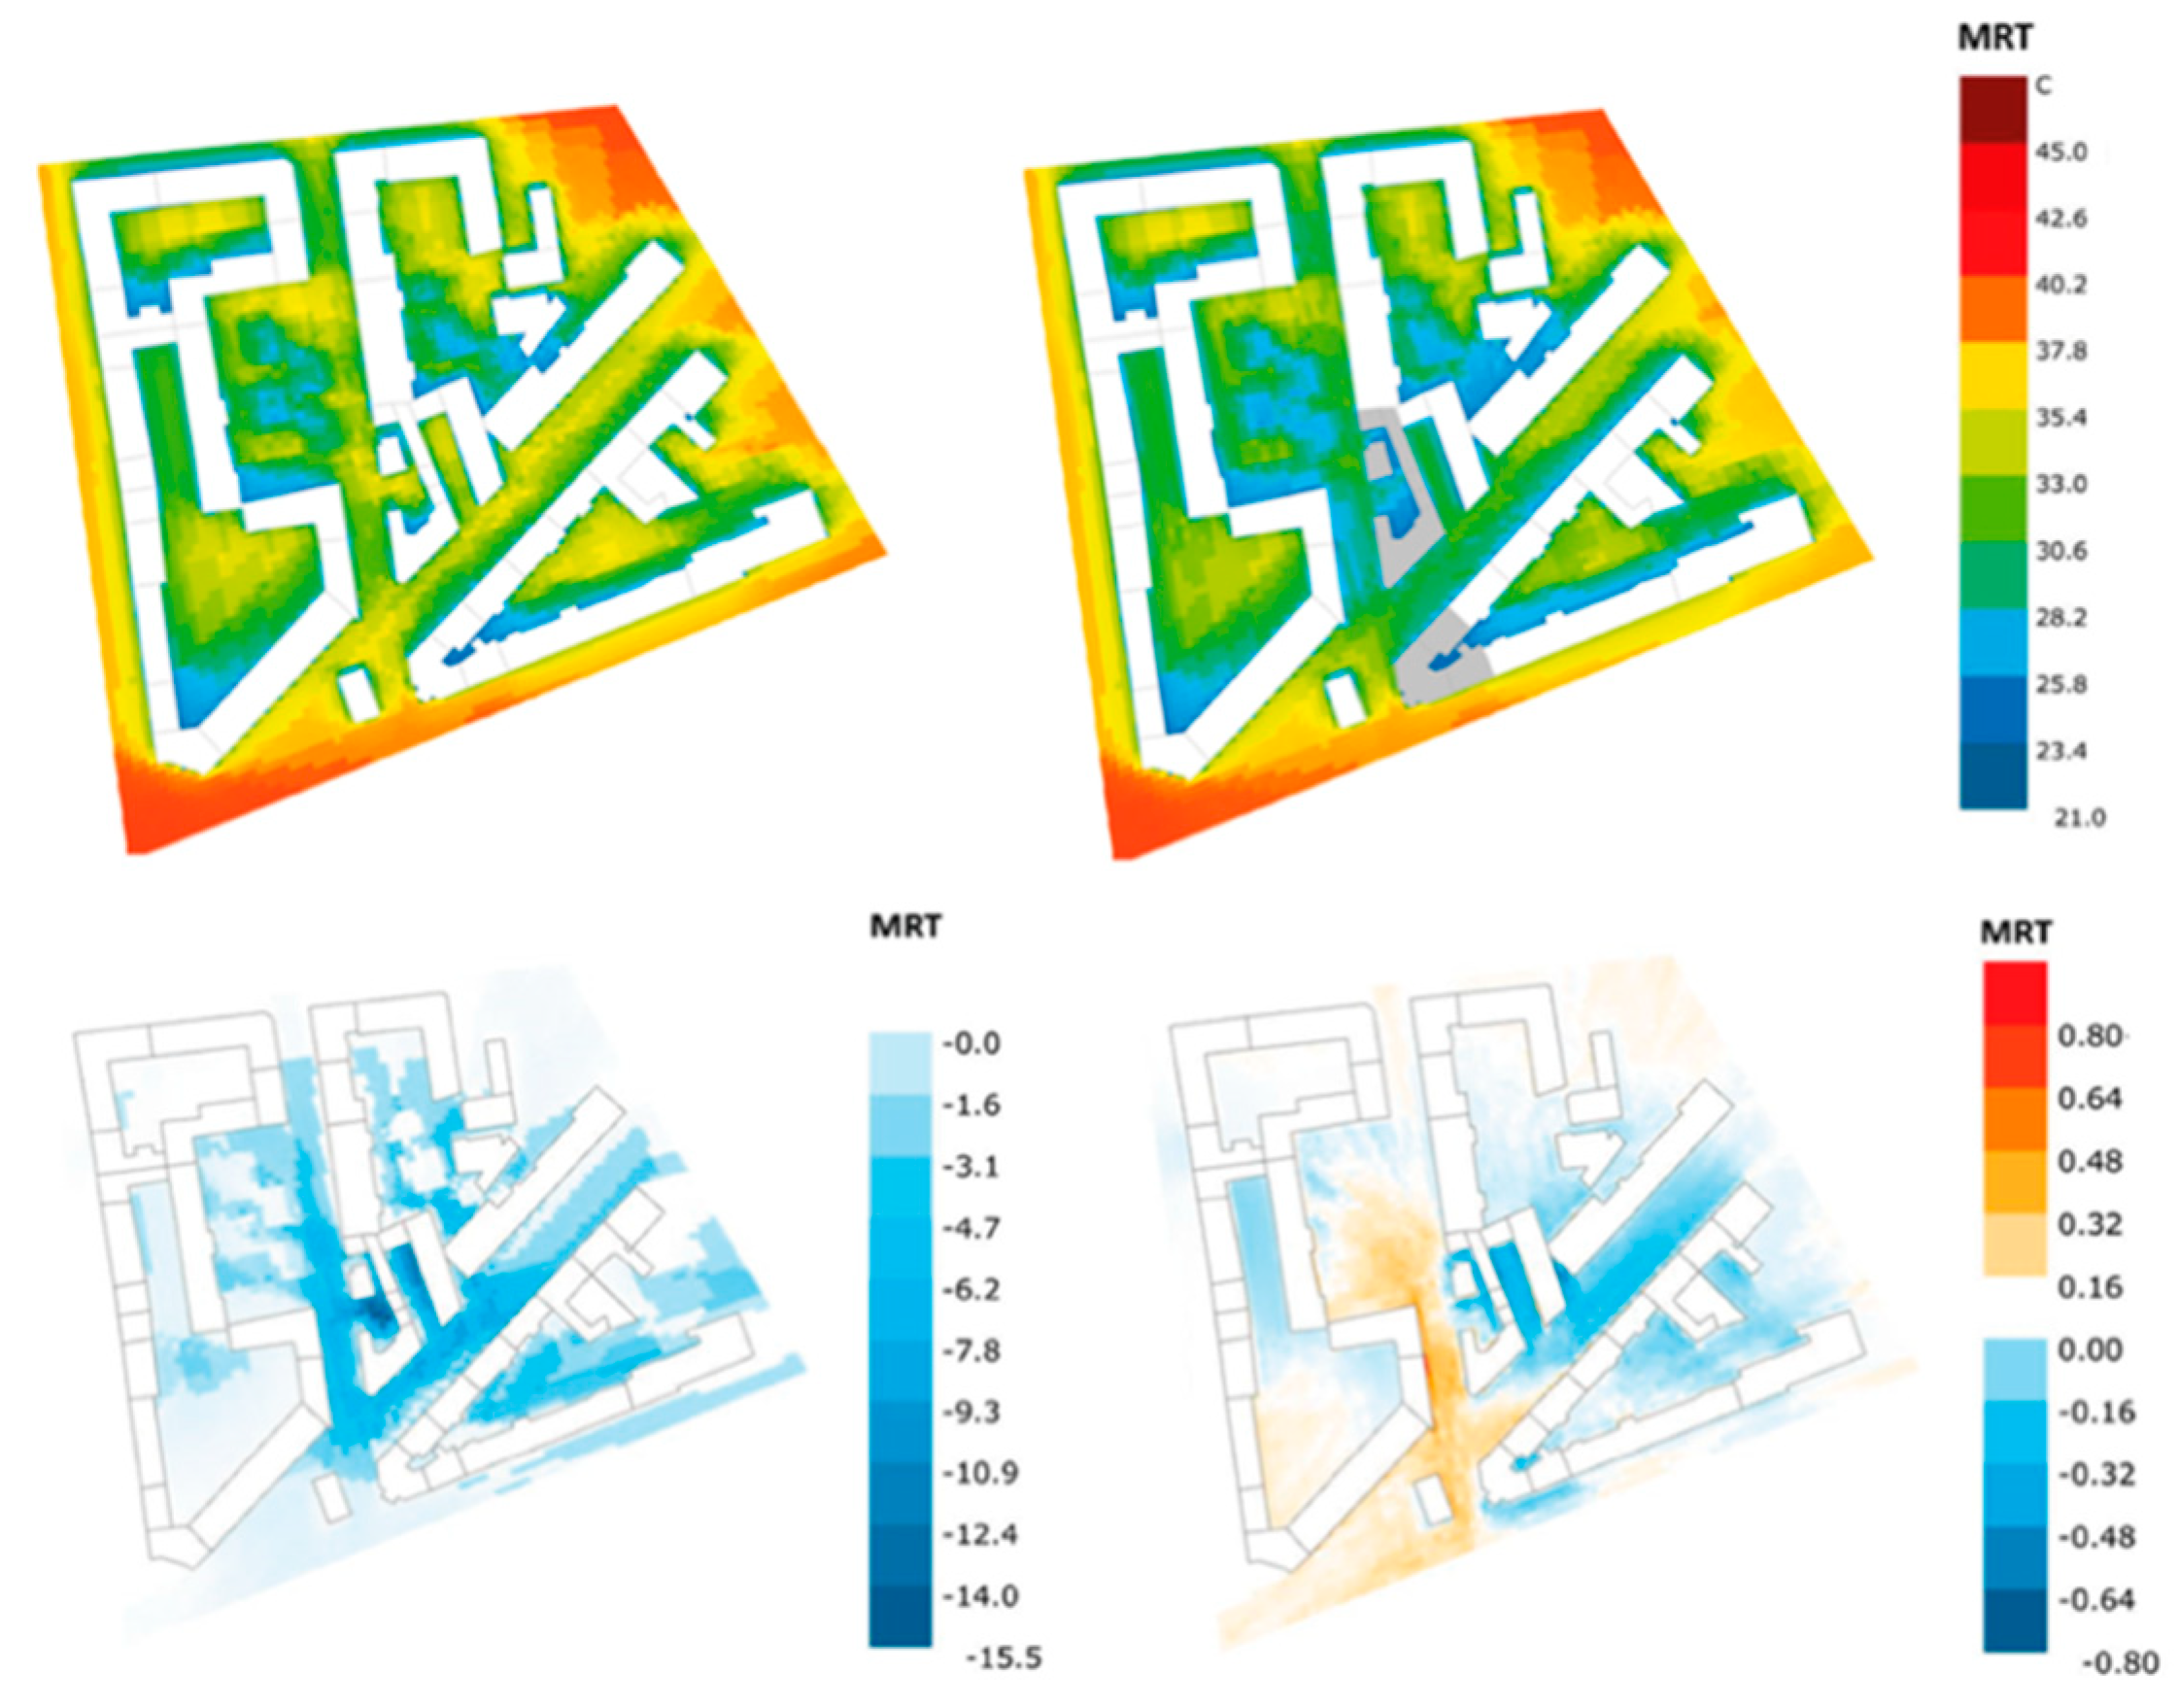
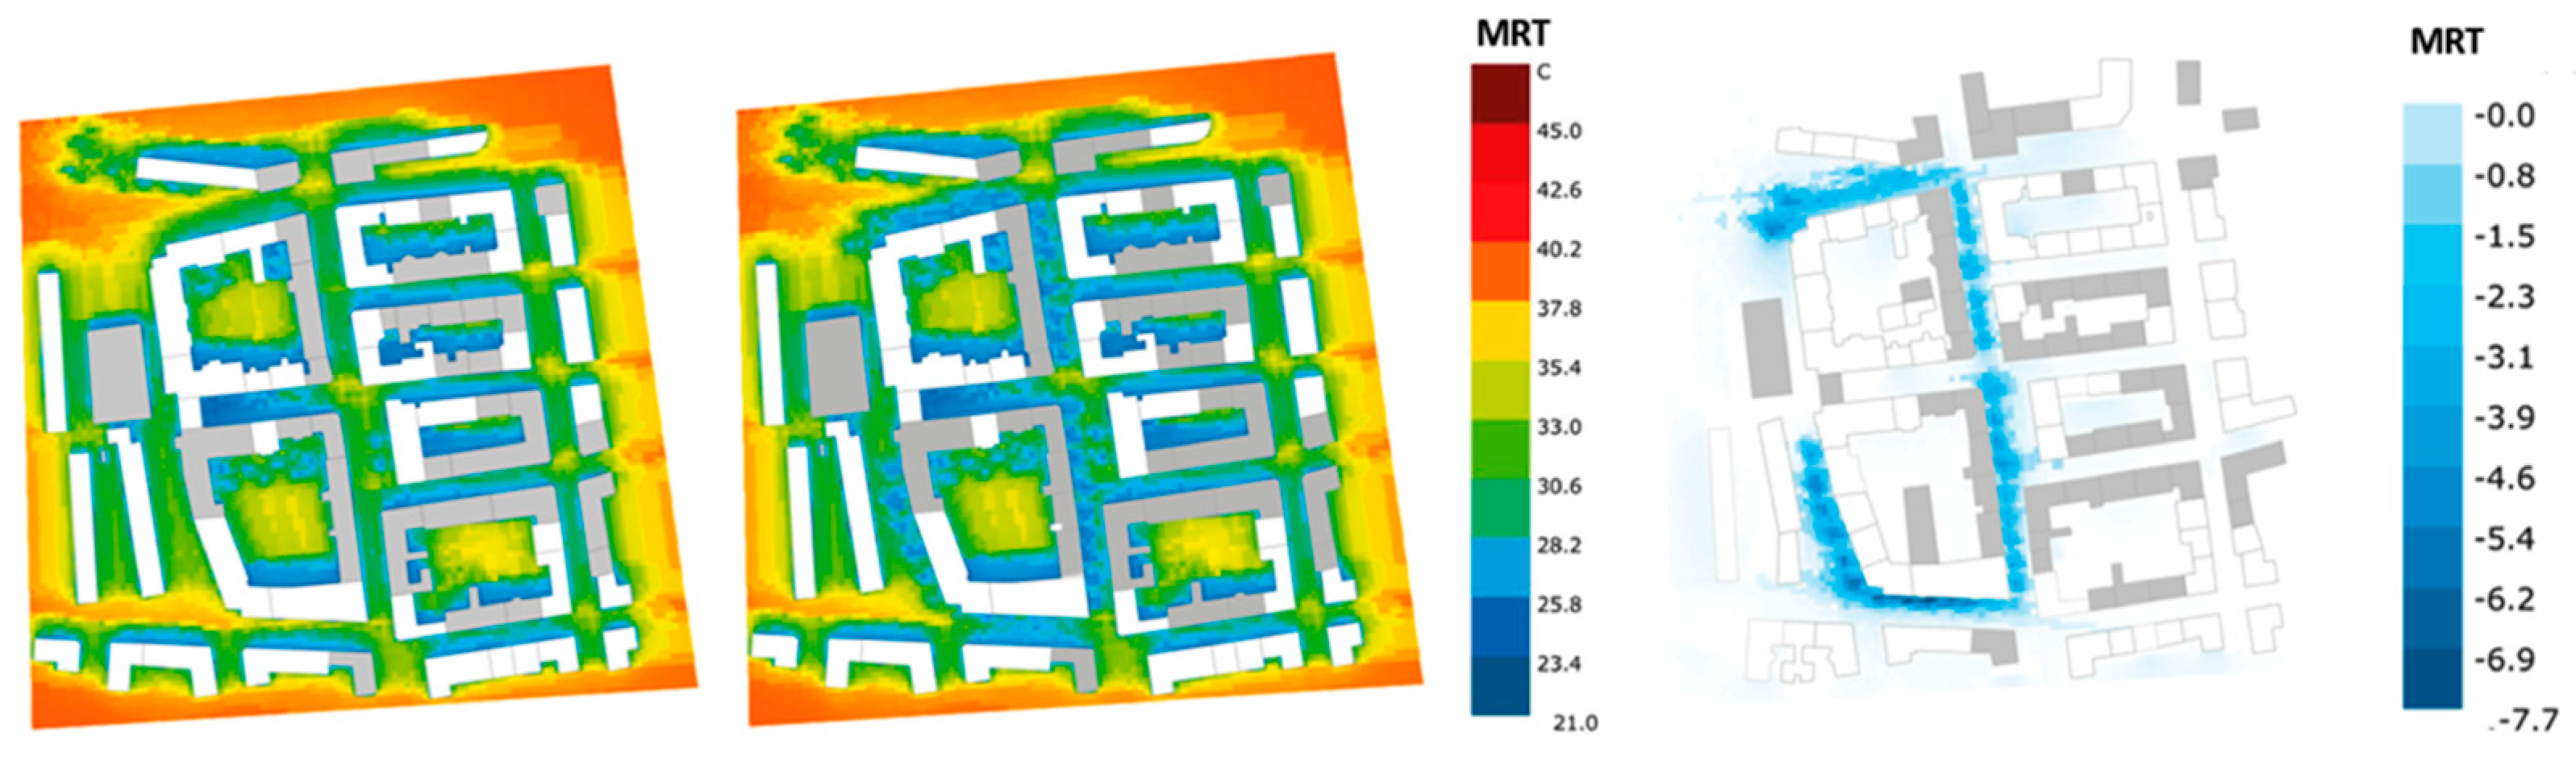
4.1. Microclimate Analysis: Key Results
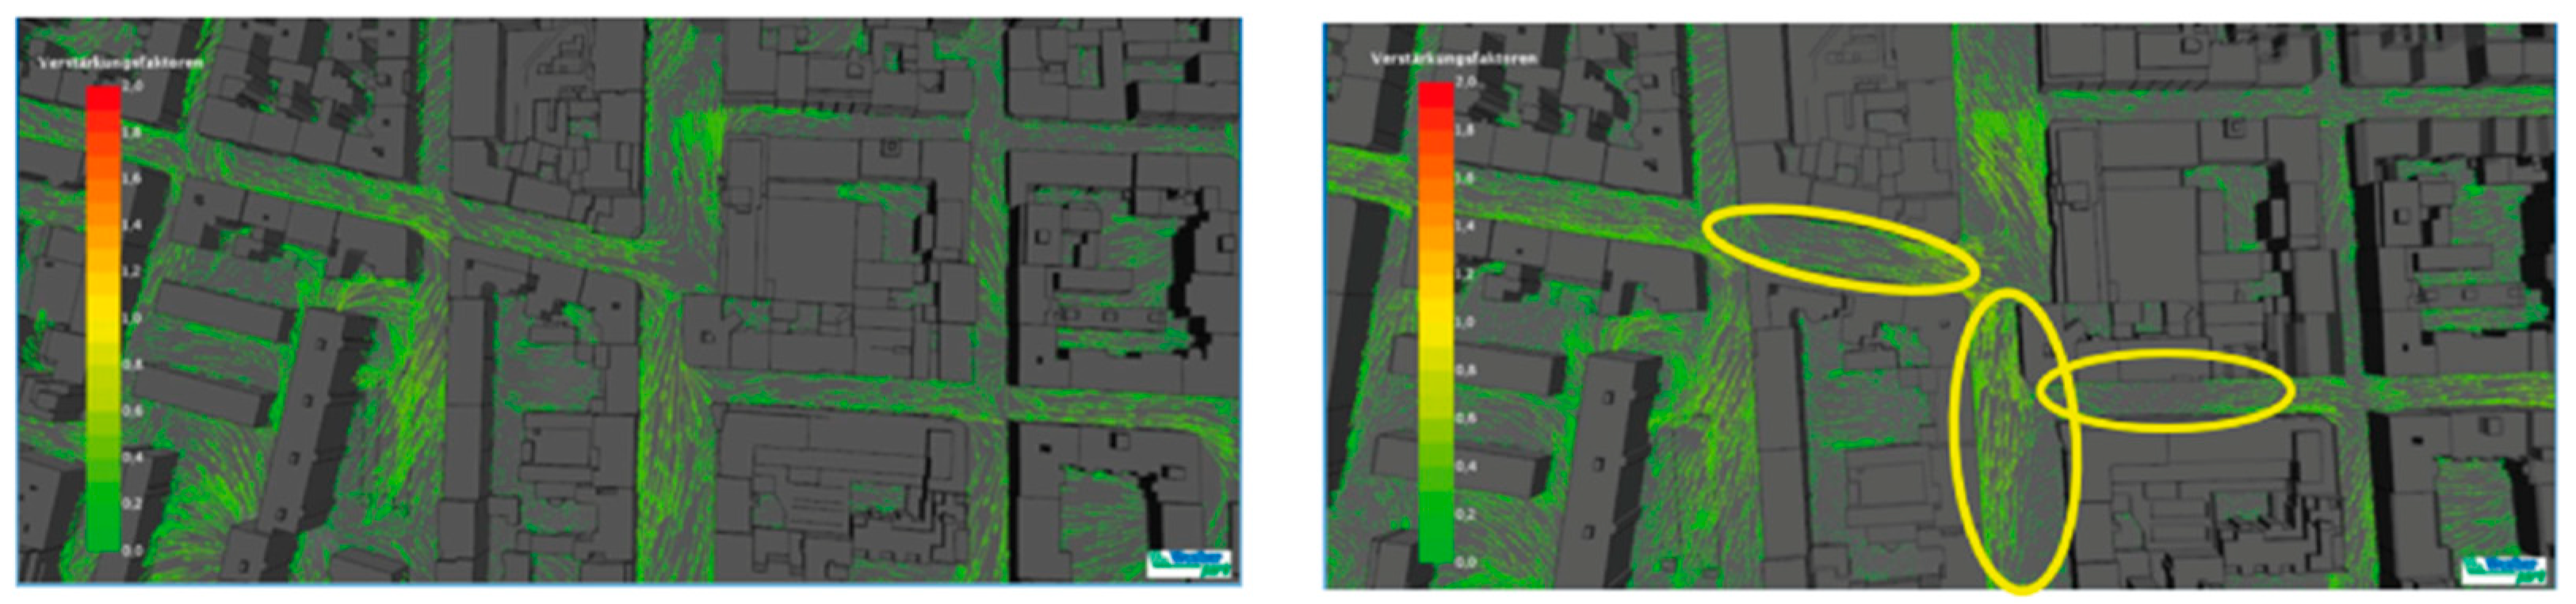
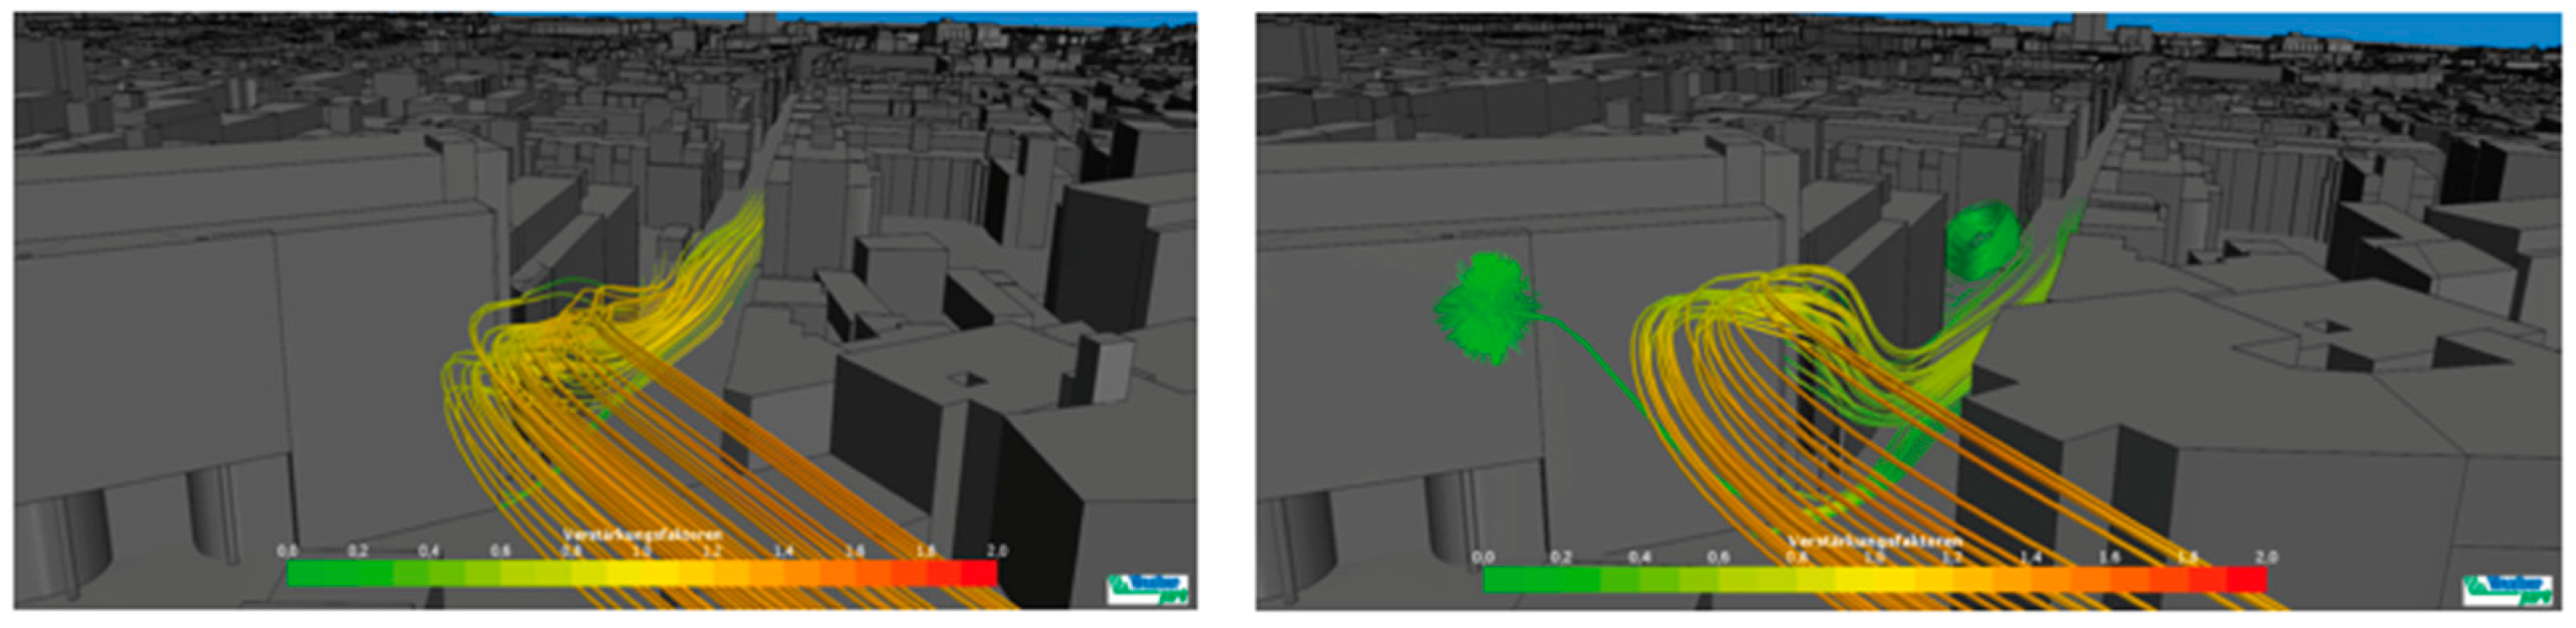
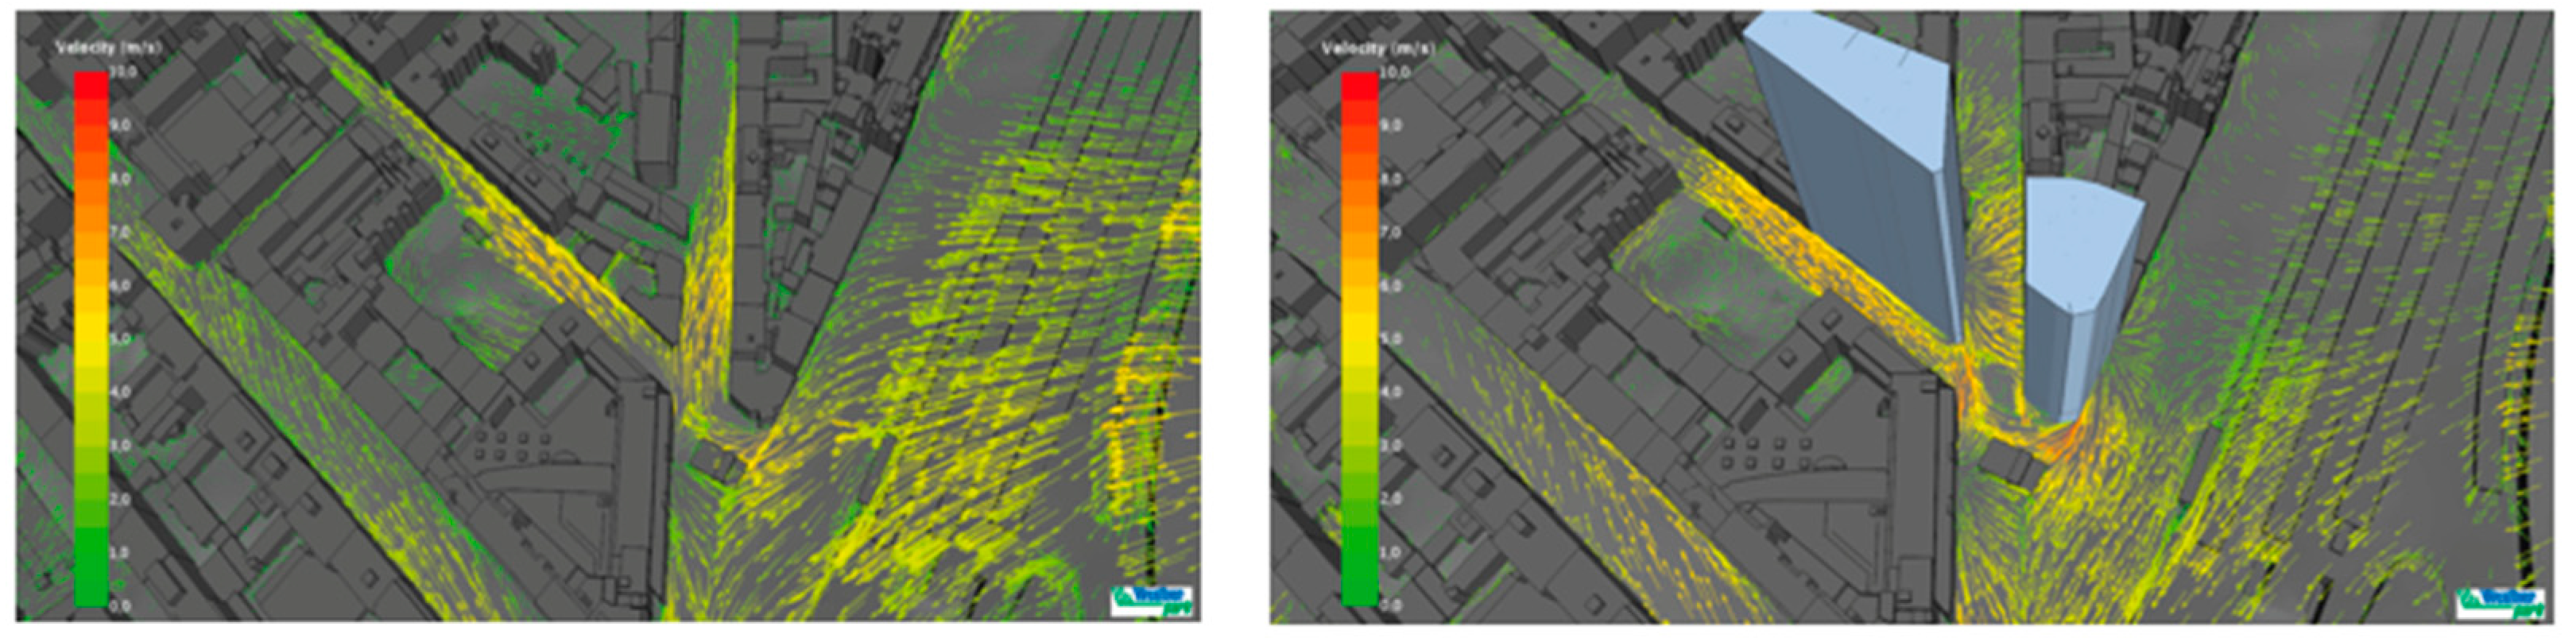
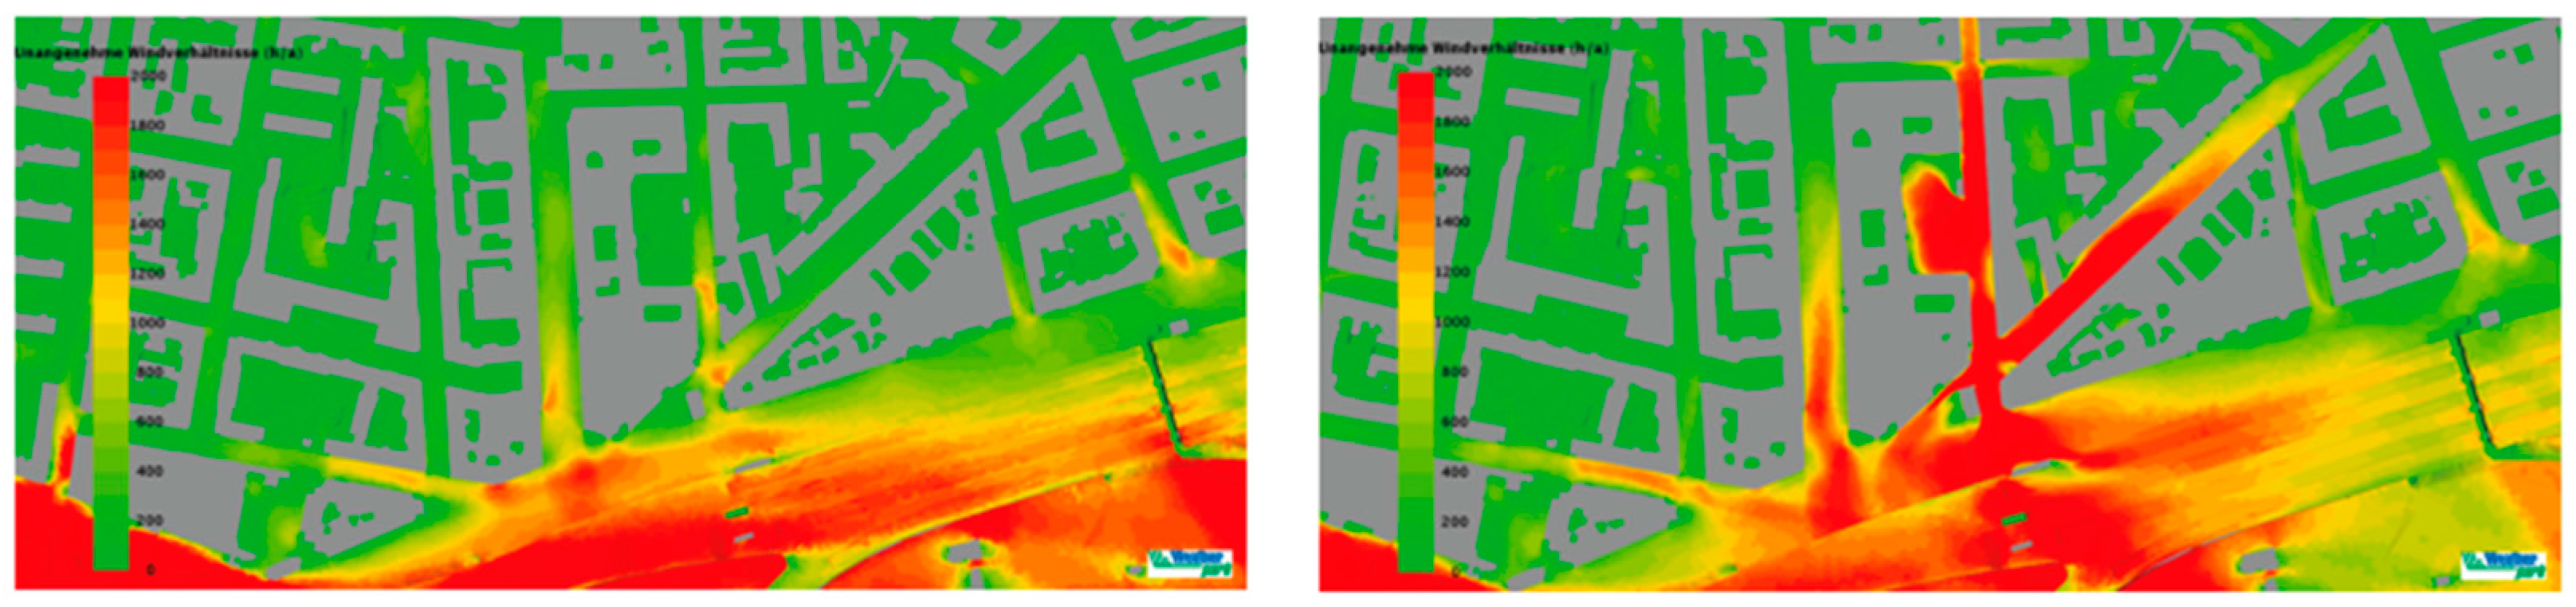
4.2. Wind Analysis: Key Results
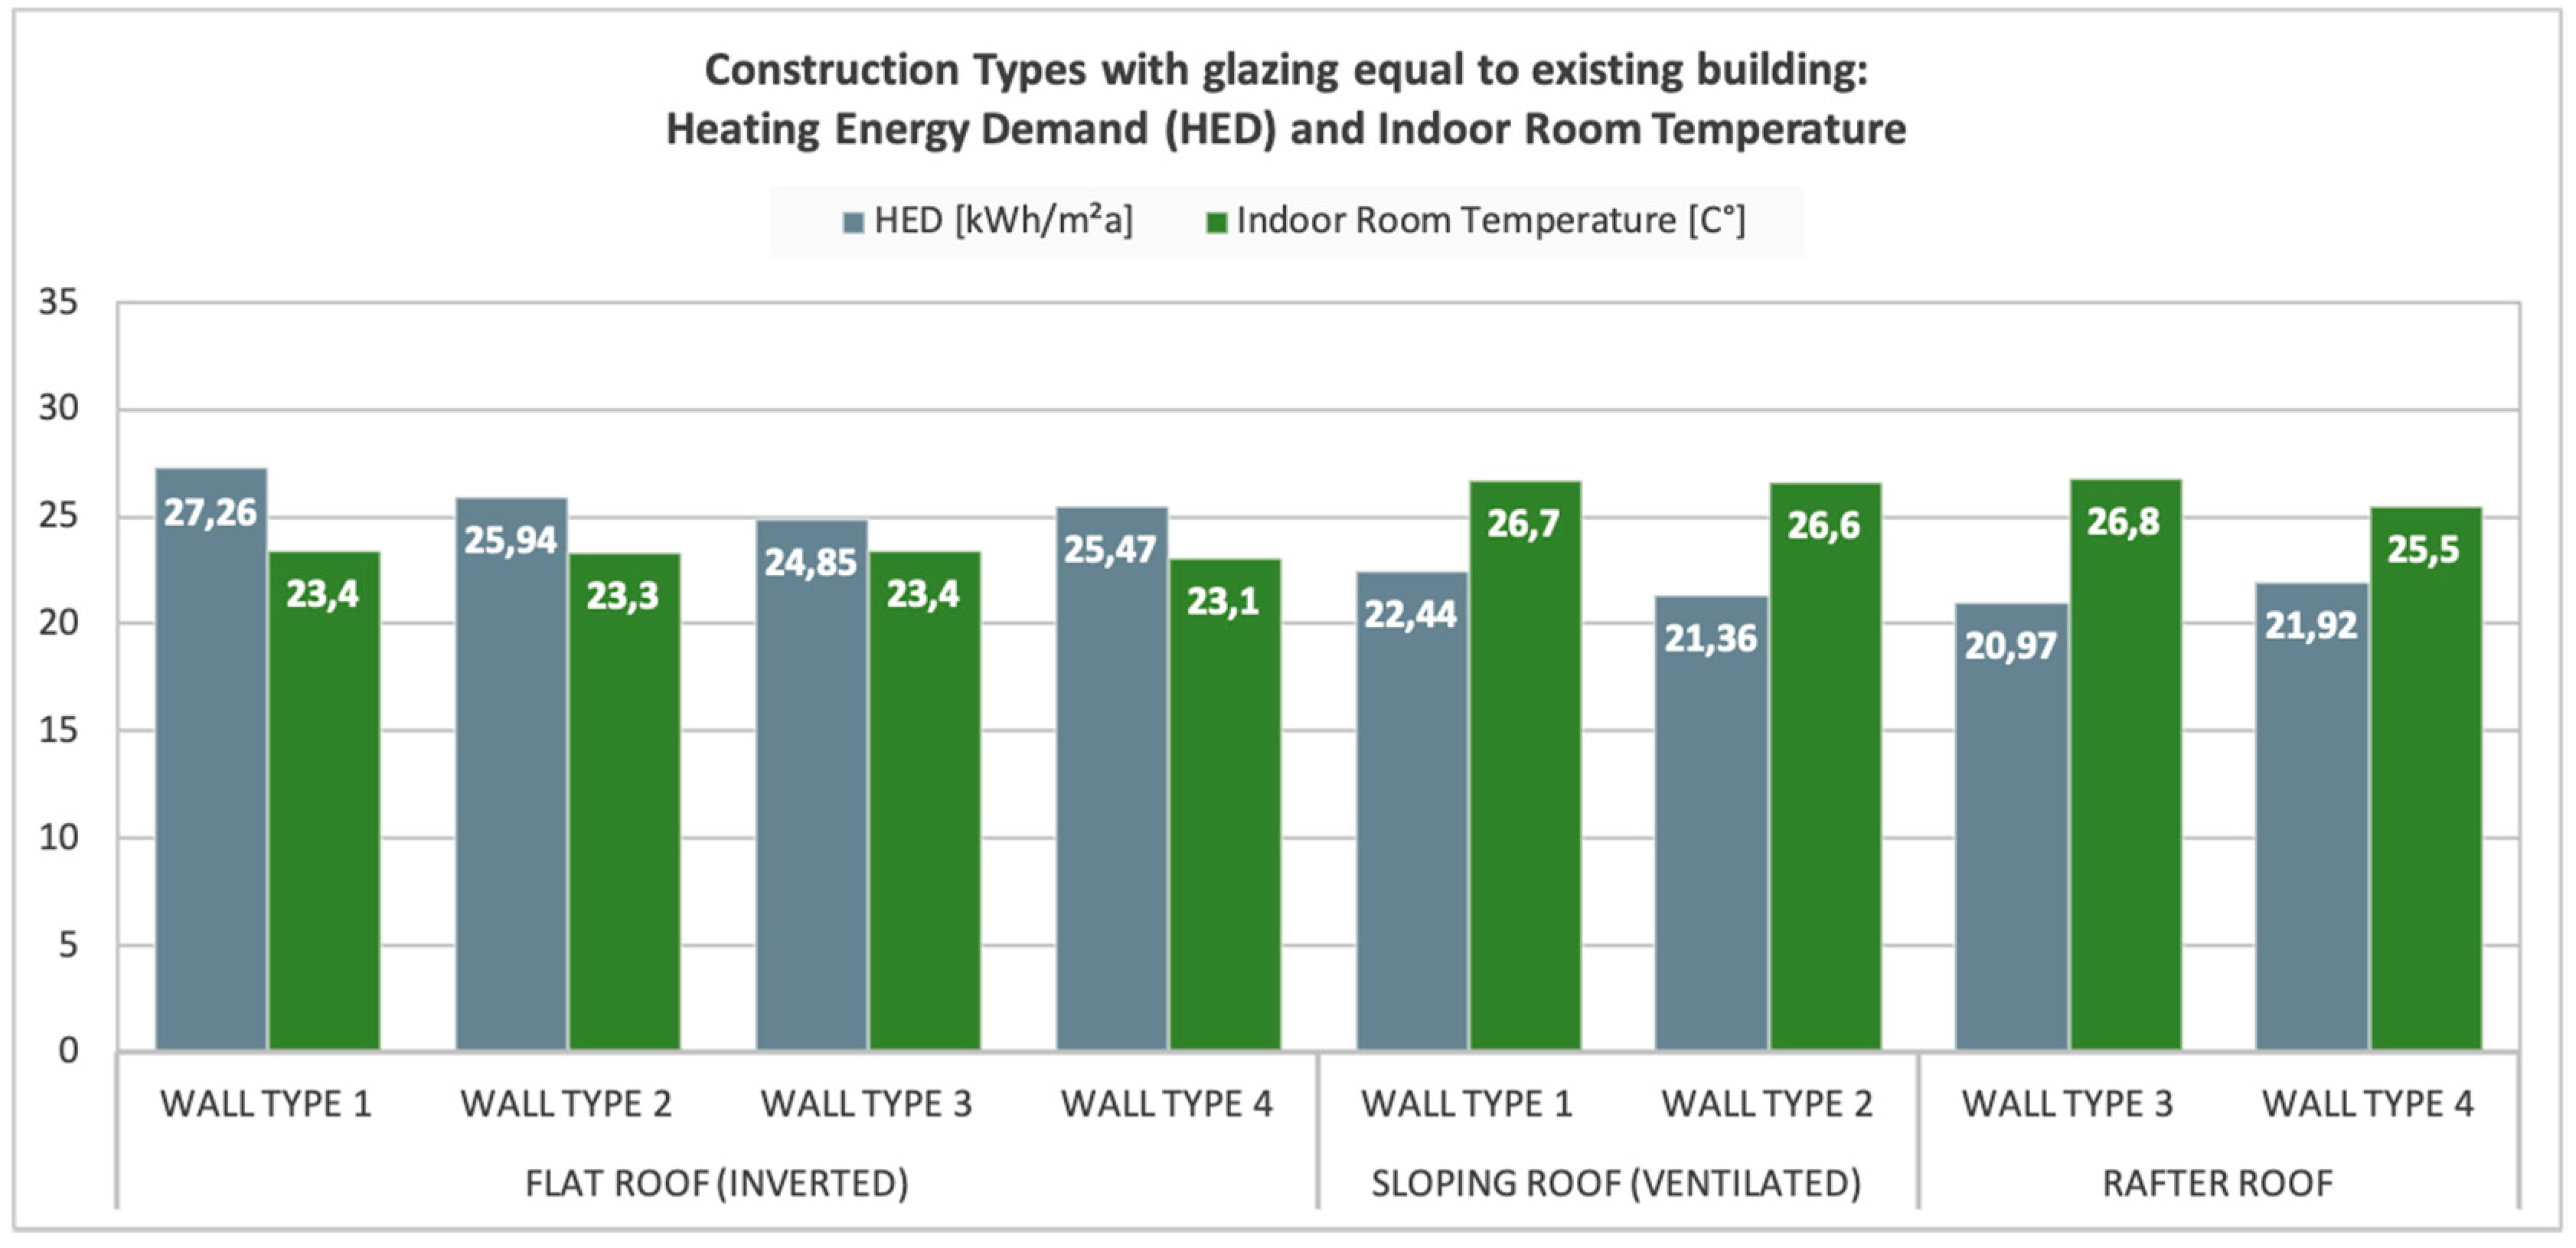
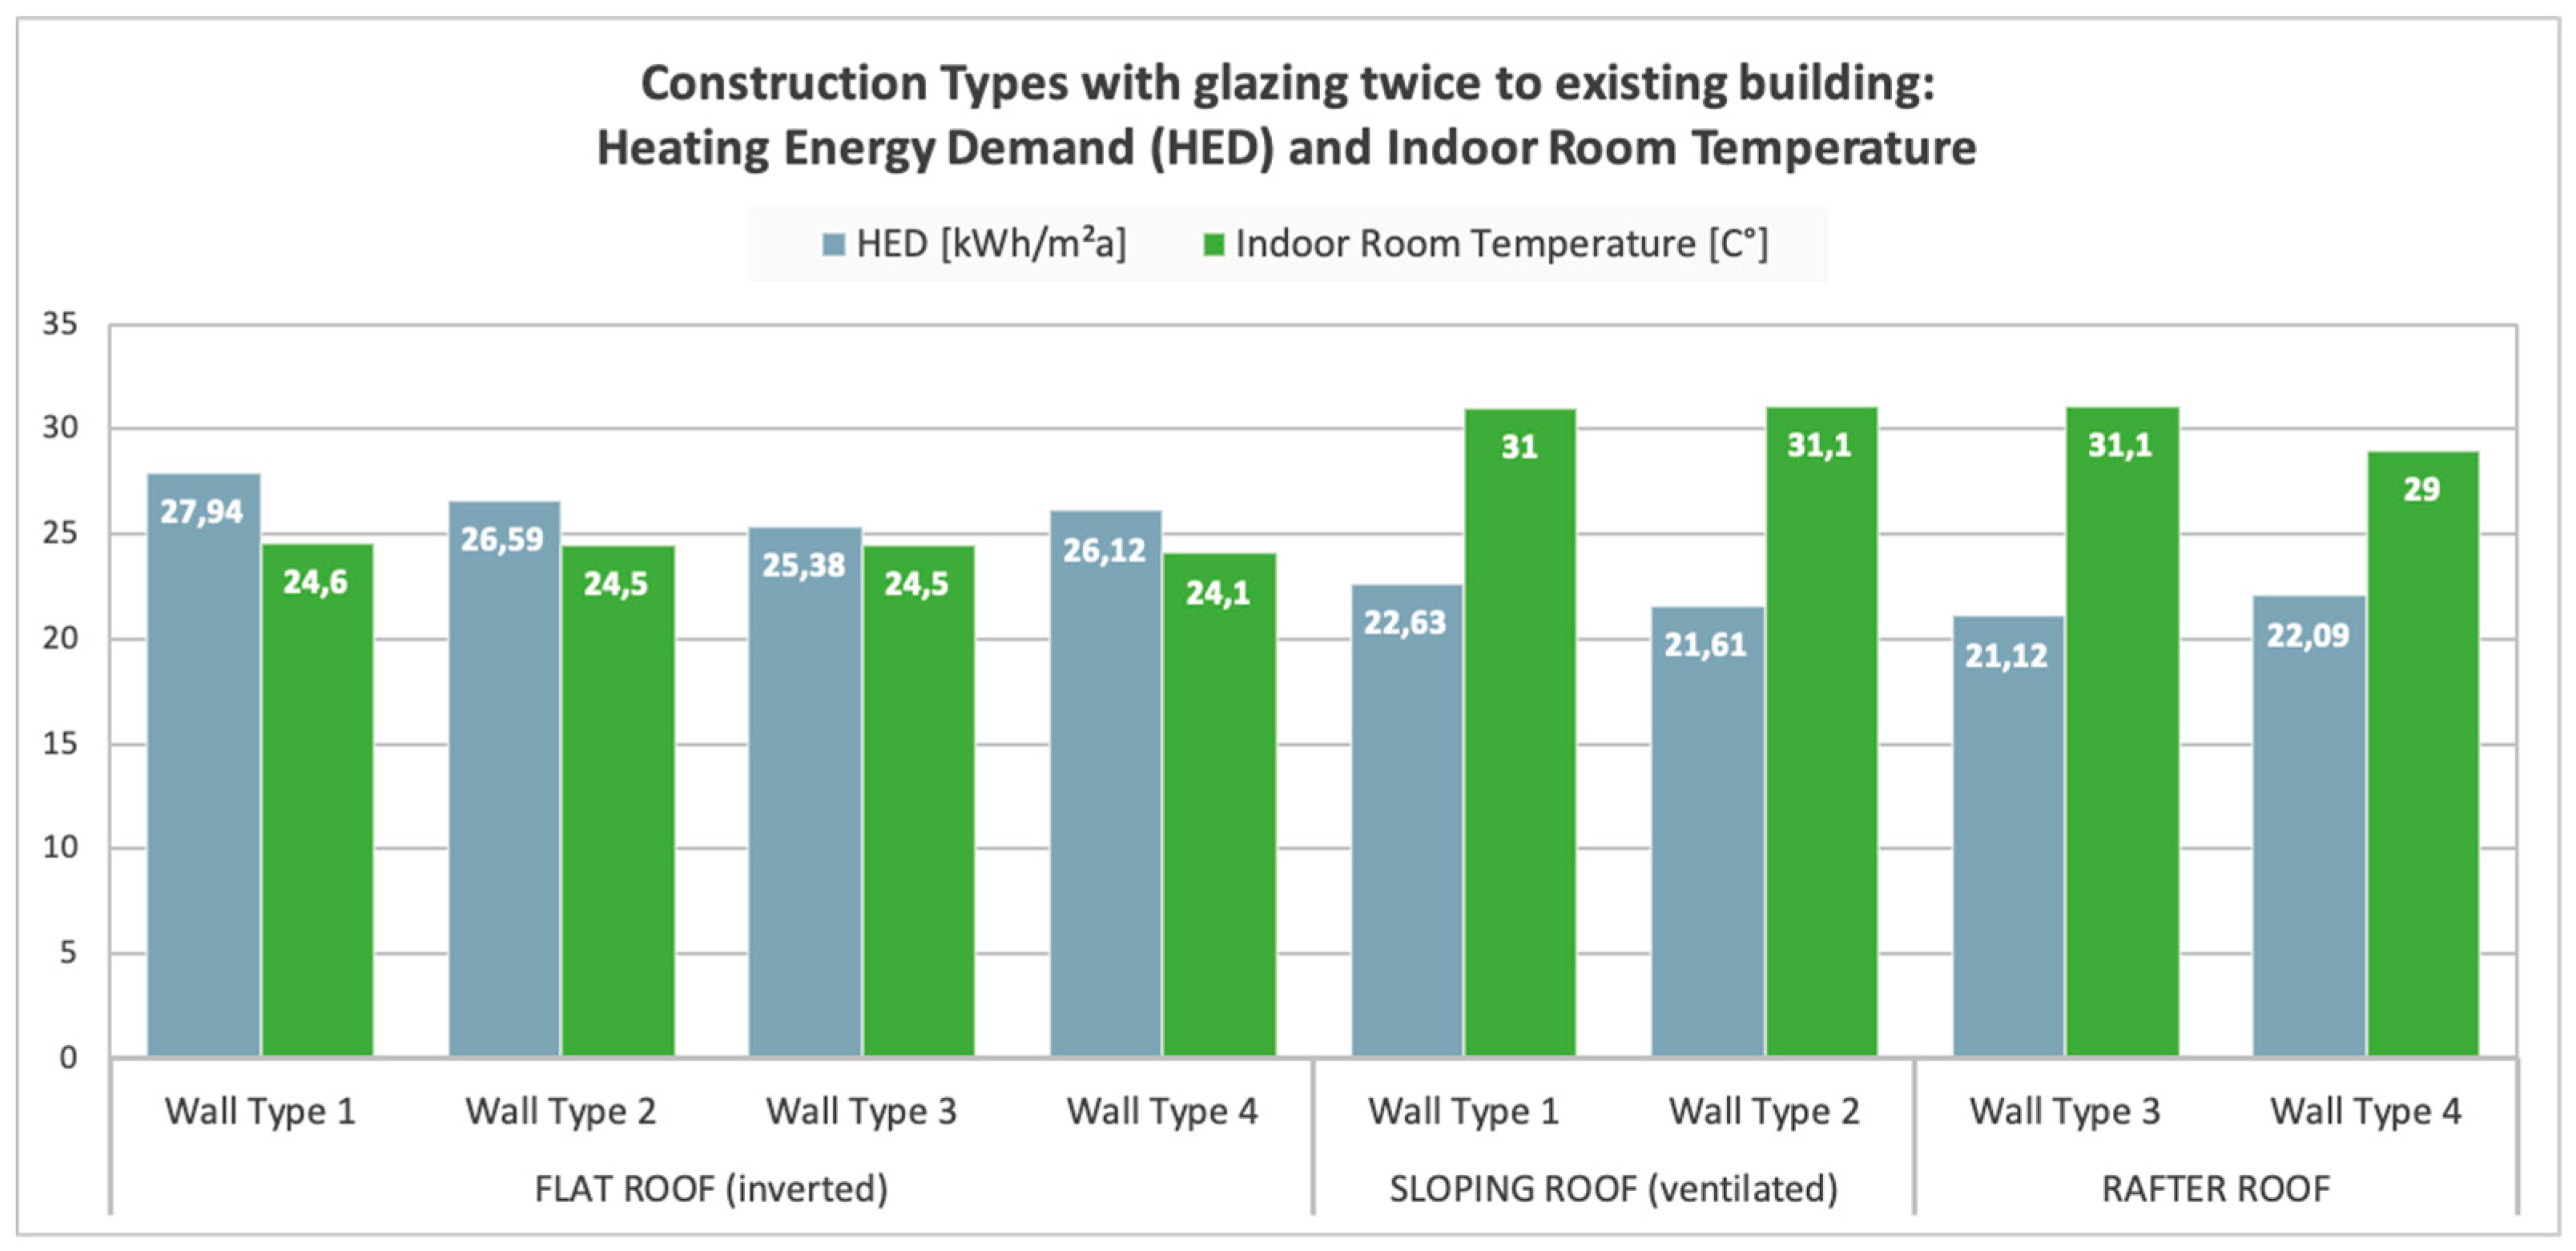
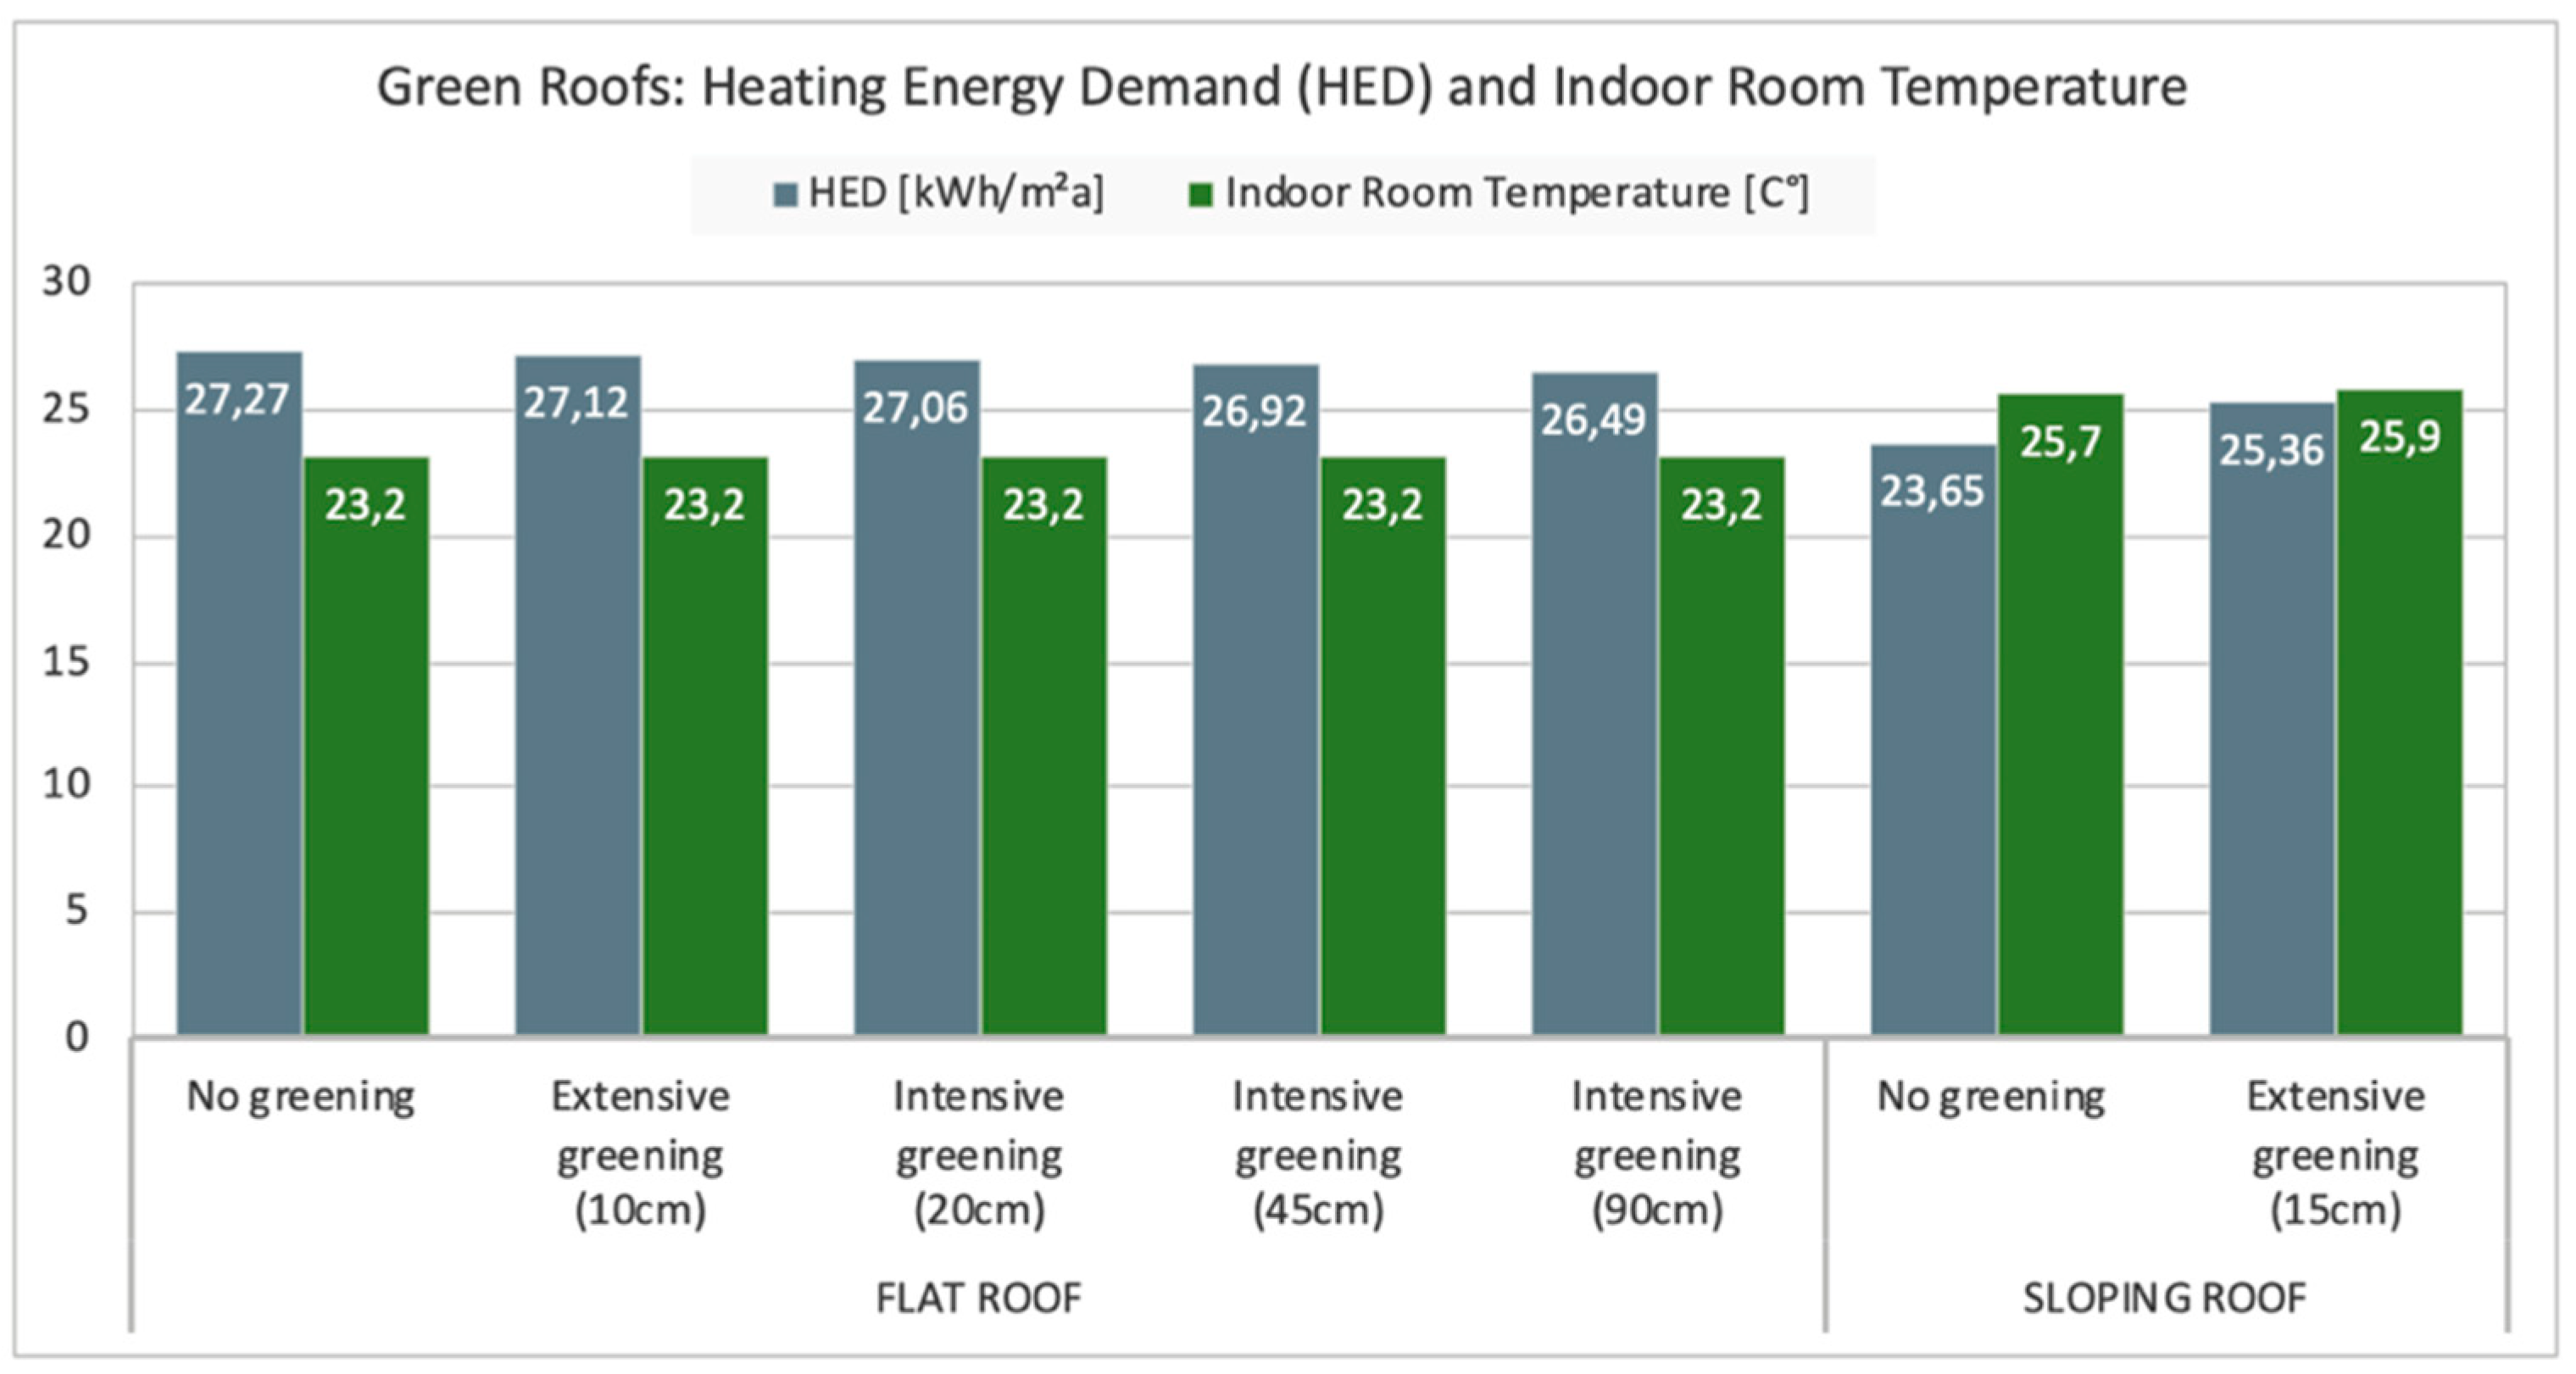
4.3. Energy and Indoor Climate Comfort Analysis: Key Results
5. Discussion
- (1)
- Large scale densification with a moderate increase in building height should consider the shading of south and west oriented facades through facade greening and trees, the shading of rooftop extensions, and proper orientation of buildings and streets to reduce solar irradiance and improve natural ventilation. Vertical densification should be linked to specific requirements related to external shading and ventilation measures (e.g., cross and night ventilation);
- (2)
- For high-rise densification, the building design and orientation should be planned in consideration of main wind-directions and reflections of glass facades. These aspects must be evaluated by means of mandatory individual microclimate and wind-comfort assessments;
- (3)
- Urban greening should focus on the street levels in order to increase evaporation and humidity, as well as decrease heat exposure through shading. Trees should be planted along the northern and eastern street sides, exposed to the sun during the hours with highest sun radiation. Soil sealing should be reduced including in private yards and large public places to increase evaporation. Greening on street level should be mandatory on both the plot area (courtyard areas) and on public areas (private and public sector);
- (4)
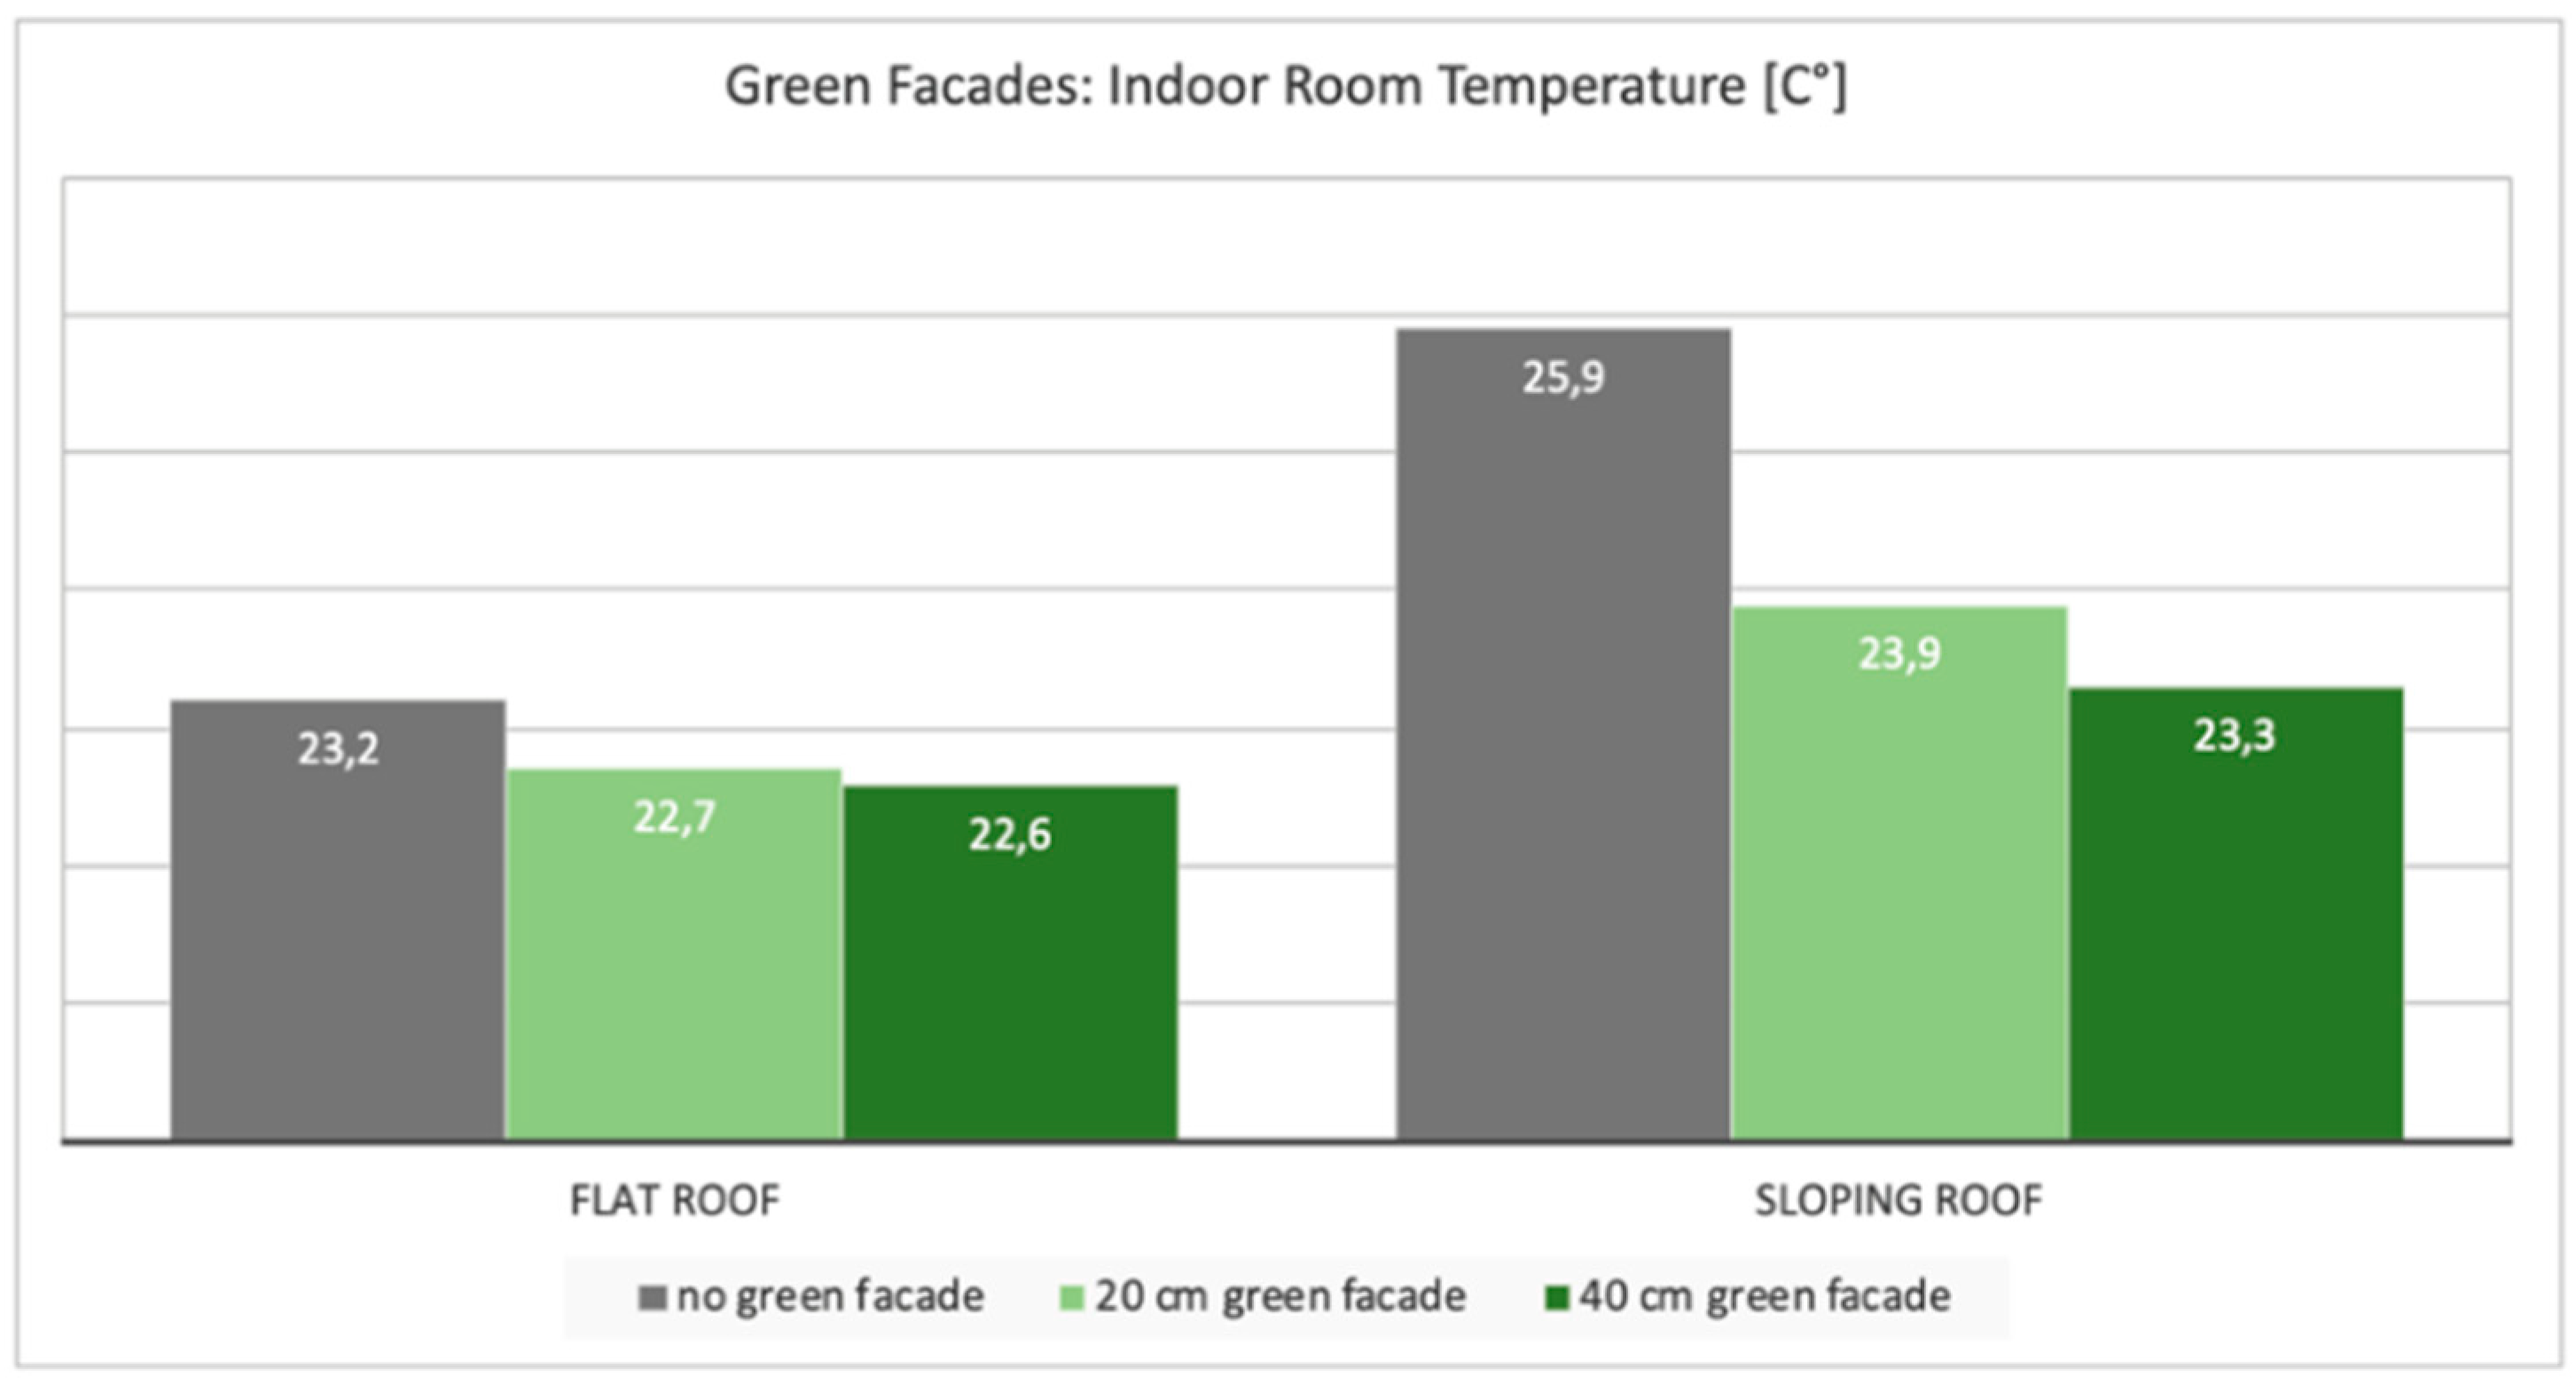
- Building greening on facades should be considered in conjunction with the use of renewable energy systems, since an increase in indoor comfort in summer is achieved primarily through shading during hot periods. Facade greening should also be primarily be implemented at street level, since the evaporation and shading effect can reduce the radiation temperature and the perceived temperature at street level. Rooftop greening has hardly an influence on microclimate at street level. (Extensive) green roofs act primarily as thermal insulation for the buildings; however, the better the insulation of the roof underneath, the smaller the effect of the green roof on the energy demand and indoor temperatures of the building.
6. Conclusions
Author Contributions
Funding
Institutional Review Board Statement
Informed Consent Statement
Data Availability Statement
Conflicts of Interest
References
- IPCC. Climate Change Synthesis Report. Contribution of Working Groups I, II and III to the Fifth Assessment Report of the Intergovernmental Panel on Climate Change; Core Writing Team, Pachauri, R.K., Meyer, L.A., Eds.; IPCC: Geneva, Switzerland, 2014. [Google Scholar]
- United Nations Climate Change. The Paris Agreements, 4th November 2016. Available online: https://unfccc.int/files/essential_background/convention/application/pdf/english_paris_agreement.pdf (accessed on 16 June 2020).
- Seto, K.C.; Fragkias, M.; Guneralp, B.; Reilly, M.K. A Meta-Analysis of Global Urban Land Expansion. PLoS ONE 2011, 6, 9. [Google Scholar] [CrossRef] [PubMed]
- United Nations, Department of Economic and Social Affairs, News. 68% of the World Population Projected to Live in Urban Areas by 2050, Says UN. Available online: https://www.un.org/development/desa/en/news/population/2018-revision-of-world-urbanization-prospects.html (accessed on 22 July 2020).
- Bradbury, M.; Peterson, M.N.; Liu, J. Long-term dynamics of household size and their environmental implications. Popul. Environ. 2014, 36, 73–84. [Google Scholar] [CrossRef]
- Carneiro Freire, S.; Corban, C.; Ehrlich, D.; Florczyk, A.; Kemper, T.; Maffenini, L.; Melchiorri, M.; Pesaresi, M.; Schiavina, M.; Tommasi, P. Atlas of the Human Planet; Publications Office of the European Union: Luxembourg, 2019; ISBN 978-92-76-14132-7. [Google Scholar] [CrossRef]
- Stadt Wien, Magistratsabteilung 23–Wirtschaft, Arbeit und Statistik, Wien in Zahlen, Bevölkerungsprognose. 2018. Available online: https://www.wien.gv.at/statistik/pdf/bev-prog-2018.pdf (accessed on 16 June 2020).
- Stadt Wien, Wiener Umweltschutzabteilung (MA22). Öffentlich Zugängliche Grünflächen–Analyse. Stadt Wien. 2020. Available online: https://www.wien.gv.at/umweltschutz/umweltgut/oeffentlich.html (accessed on 10 May 2020).
- Zuvela-Aloise, M. Future of Climatic Urban Heat Stress Impacts—Adaption and Mitigation of the Climate Change Impact on Urban Heat Stress Based on Model Runs Derived with an Urban Climate Model; Endbericht zum Projekt FOCUS I, Klima- und Energiefonds: Wien, Austria, 2013; Available online: https://www.klimafonds.gv.at/wp-content/uploads/sites/6/03032015FOCUSZuvela-AloiseEBACRP2B060373.pdf (accessed on 10 May 2020).
- Fokaides, P.A.; Kylili, A.; Nicolaou, L.; Ioannou, B. The effect of soil sealing on the urban heat island phenomenon. Indoor Built Environ. 2016, 25, 1136–1147. [Google Scholar] [CrossRef]
- Kottmeier, C.; Biegert, C.; Corsmeier, U. Effects of urban land use on surface temperature in Berlin: Case study. J. Urban Plan. Dev. 2007, 133, 128–137. [Google Scholar] [CrossRef]
- Conticelli, E.; Proli, S.; Tondelli, S. Integrating energy efficiency and urban densification policies: Two Italian case studies. Energy Build. 2017, 155, 308–323. [Google Scholar] [CrossRef]
- McEvoy, D.; Lindley, S.; Handley, J. Adaptation and mitigation in urban areas: Synergies and conflicts. Proc. Inst. Civil Eng. Munic. Eng. 2006, 159, 185–191. [Google Scholar] [CrossRef]
- Loibl, W.; Vuckovics, M.; Etminan, G.; Österreicher, D.; Ratheiser, M.; Tschannett, S. Climate Change and Urban Densification Impact Exploration—Heat Exposure Reduction Through Roof Scape Adaptation—A Large Scale Case Study; Project Number: B769976, ACRP Final Report–Activity Report; AIT Austrian Institute of Technology: Vienna, Austria, 2020. [Google Scholar]
- Mahtta, R.; Mahendra, A.; Seto, K.C. Building up or spreading out? Typologies of urban growth across 478 cities of 1 million+. Environ. Res. Lett. 2019, 14, 13. [Google Scholar] [CrossRef] [Green Version]
- Jaksch, S.; Franke, A.; Österreicher, D.; Treberspurg, M. A systematic approach to sustainable urban densification using prefabricated timber-based attic extension modules. In Energy Procedia, Proceedings of the SBE16 Tallinn and Helsinki Conference; Build Green and Renovate Deep, Tallinn, Estonia, 5–7 October 2016; Elsevier Ltd.: Amsterdam, The Netherlands, 2016; ISBN 1876-6102. [Google Scholar] [CrossRef] [Green Version]
- Ghofrani, Z.; Sposito, V.; Faggian, R. A Comprehensive Review of Blue-Green Infrastructure Concepts. Int. J. Environ. Sustain. 2017, 6, 15–36. [Google Scholar] [CrossRef]
- Alves, A.; Vojinovic, Z.; Kapelan, Z.; Sanchez, A.; Gersonius, B. Exploring trade-offs among the multiple benefits of green-blue-grey infrastructure for urban flood mitigation. Sci. Total Environ. 2020, 703, 14. [Google Scholar] [CrossRef]
- Belcakova, I.; Swiader, M.; Bartyna-Zielinska, M. The Green Infrastructure in Cities as a Tool for Climate Change Adaptation and Mitigation: Slovakian and Polish Experiences. Atmosphere 2019, 10, 552. [Google Scholar] [CrossRef] [Green Version]
- Brandenburg, C.; Damyanovic, D.; Reinwald, F.; Allex, B.; Gantner, B.; Czachs, C. Urban. Heat Islands Strategieplan; Magistrat der Stadt Wien; Wiener Umweltschutzabteilung (MA 21): Vienna, Austria, 2015. [Google Scholar]
- Virk, G.; Jansz, A.; Mavrogianni, A.; Mylona, A.; Stocker, J.; Davies, M. The effectiveness of retrofitted green and cool roofs at reducing overheating in a naturally ventilated office in London: Direct and indirect effects in current and future climates. Indoor Built Environ. 2014, 23, 504–520. [Google Scholar] [CrossRef]
- Sharma, A.; Woodruff, S.; Budhathoki, M.; Hamlet, A.F.; Chen, F.; Fernando, H.J.S. Role of green roofs in reducing heat stress in vulnerable urban communities-a multidisciplinary approach. Environ. Res. Lett. 2018, 13, 13. [Google Scholar] [CrossRef]
- Treberspurg, M.; Streicher, W.; Reim, T.H. Sommertauglichkeit im Gebäudebestand. Wohnbauforschung des Bundes; F1494; Smart CityWien: Vienna, Austria, 2011. [Google Scholar]
- Chun, B.; Guldmann, J.M. Impact of greening on the urban heat island: Seasonal variations and mitigation strategies. Comput. Environ. Urban. Syst. 2018, 71, 165–176. [Google Scholar] [CrossRef]
- Ciriminna, R.; Meneguzzo, F.; Pecoraino, M.; Pagliaro, M. Solar Green Roofs: A Unified Outlook 20 Years On. Energy Technol. 2019, 7, 7. [Google Scholar] [CrossRef] [Green Version]
- Sattler, S.; Zluwa, I.; Österreicher, D. The “PV Rooftop Garden”: Providing Recreational Green Roofs and Renewable Energy as a Multifunctional System within One Surface Area. Appl. Sci. 2020, 10, 1791. [Google Scholar] [CrossRef] [Green Version]
- Skelhorn, C.P.; Levermore, G.; Lindley, S.J. Impacts on cooling energy consumption due to the UHI and vegetation changes in Manchester, UK. Energy Build. 2016, 122, 150–159. [Google Scholar] [CrossRef] [Green Version]
- Duan, S.P.; Luo, Z.W.; Yang, X.Y.; Li, Y.G. The impact of building operations on urban heat/cool islands under urban densification: A comparison between naturally-ventilated and air-conditioned buildings. Appl. Energy 2019, 235, 129–138. [Google Scholar] [CrossRef]
- Bevilacqua, P.; Mazzeo, D.; Arcuri, N. Thermal inertia assessment of an experimental extensive green roof in summer conditions. Build. Environ. 2018, 131, 264–276. [Google Scholar] [CrossRef]
- Gupta, R.; Gregg, M. Assessing energy use and overheating risk in net zero energy dwellings in UK. Energy Build. 2018, 158, 897–905. [Google Scholar] [CrossRef] [Green Version]
- McLeod, R.S.; Hopfe, C.J.; Kwan, A. An investigation into future performance and overheating risks in Passivhaus dwellings. Build. Environ. 2013, 70, 189–209. [Google Scholar] [CrossRef] [Green Version]
- Oikonomou, E.; Davies, M.; Mavrogianni, A.; Biddulph, P.; Wilkinson, P.; Kolokotroni, M. Modelling the relative importance of the urban heat island and the thermal quality of dwellings for overheating in London. Build. Environ. 2012, 57, 223–238. [Google Scholar] [CrossRef]
- Handler, S.; Korjenic, A.; Bednar, T. The influence of external thermal insulation composite systems on the summer performance of buildings. Bauphysik 2011, 33, 225–233. [Google Scholar] [CrossRef]
- Österreicher, D.; Sattler, S. Maintaining Comfortable Summertime Indoor Temperatures by Means of Passive Design Measures to Mitigate the Urban Heat Island Effect—A Sensitivity Analysis for Residential Buildings in the City of Vienna. Urban. Sci. 2018, 2, 66. [Google Scholar] [CrossRef] [Green Version]
- Mlakar, J.; Strancar, J. Overheating in residential passive house: Solution strategies revealed and confirmed through data analysis and simulations. Energy Build. 2011, 43, 1443–1451. [Google Scholar] [CrossRef]
- Stazi, F.; Tomassoni, E.; Di Perna, C. Super-insulated wooden envelopes in Mediterranean climate: Summer overheating, thermal comfort optimization, environmental impact on an Italian case study. Energy Build. 2017, 138, 716–732. [Google Scholar] [CrossRef]
- Sameni, S.M.T.; Gaterell, M.; Montazami, A.; Ahmed, A. Overheating investigation in UK social housing flats built to the Passivhaus standard. Building Environ. 2015, 92, 222–235. [Google Scholar] [CrossRef] [Green Version]
- Adekunle, T.O.; Nikolopoulou, M. Thermal comfort, summertime temperatures and overheating in prefabricated timber housing. Building Environ. 2016, 103, 21–35. [Google Scholar] [CrossRef]
- Austrian Standards. ÖNORM B 8110-3. Wärmeschutz im Hochbau—Teil 3: Vermeidung Sommerlicher Überwärmung; Austrian Standards: Vienna, Austria, 2020. [Google Scholar]
- Kim, H.; Anderson, K. Energy Modeling System Using Building Information Modeling Open Standards. J. Comput. Civ. Eng. 2013, 27, 203–211. [Google Scholar] [CrossRef]
- Perez, D.; Robinson, D. Urban Energy Flow Modelling: A Data-Aware Approach. In Digital Urban Modeling and Simulation. Communications in Computer and Information Science; Arisona, S.M., Aschwanden, G., Halatsch, J., Wonka, P., Eds.; Springer: Berlin/Heidelberg, Germany, 2012; Volume 242. [Google Scholar]
- Groger, G.; Plumer, L. CityGML—Interoperable semantic 3D city models. ISPRS J. Photogramm. Remote Sens. 2012, 71, 12–33. [Google Scholar] [CrossRef]
- Agugiaro, G. First steps towards an integrated CityGML-based 3D model of Vienna. In Proceedings of the XXIII ISPRS Congress, Commission, Prague, Czech Republic, 12–19 July 2016. [Google Scholar] [CrossRef] [Green Version]
- Biljecki, F.; Ledoux, H.; Stoter, J. Does a finer level of detail of a 3D city model bring an improvement for estimating shadows? In Advances in 3D Geoinformation; Springer International Publishing: Cham, Switzerland, 2016. [Google Scholar]
- Rhinoceros, G. Available online: https://www.rhino3d.com (accessed on 24 July 2020).
- City of Vienna, MA21. Land Use and Zoning Plan. 2020. Available online: https://www.wien.gv.at/flaechenwidmung/public/ (accessed on 24 July 2020).
- Loibl, W.; Etminan, G.; Österreicher, D.; Ratheiser, M.; Stollnberger, R.; Tschannett, S.; Tötzer, T.; Vuckovic, M.; Walal, K. Urban densification and urban climate change–assessing interaction through densification scenarios and climate simulations. In Proceedings of the 24th International Conference on Urban Planning and Regional Development in the Information Society, GeoMultimedia, Karlsruhe, Germany, 2–4 April 2019; Available online: https://conference.corp.at/index.php?id=38&L=0 (accessed on 19 August 2020).
- Food4Rhino. Available online: https://www.food4rhino.com/app/ladybug-tools (accessed on 24 July 2020).
- Vuckovic, M.; Loibl, W.; Tötzer, T.; Stollnberger, R. Potential of Urban Densification to Mitigate the Effects of Heat Island in Vienna, Austria. Environments 2019, 6, 82. Available online: https://doi.org/10.3390/environments6070082/ (accessed on 19 August 2020). [CrossRef] [Green Version]
- Loibl, W.; Züger, H.; Köstl, M. Reclip:century-Entwicklung eines Basisdatensatzes regionaler Klimaszenarien. Proceedings of 11. Österreichischen Klimatag “Klima im Wandel, Auswirkungen und Strategien” 2010. Available online: http://www.austroclim.at/fileadmin/user_upload/ppt_11.Klimatag/Tagungsband_upload.pdf (accessed on 19 August 2020).
- STAR-CCM+. 2020. Available online: https://www.plm.automation.siemens.com/global/en/products/simcenter/STAR-CCM.html (accessed on 19 August 2020).
- Yuan, C.; Rena, C.; Ng, E. GIS-based surface roughness evaluation in the urban planning system to improve the wind environment–A study in Wuhan, China. Urban. Clim. 2014, 10, 585–593. Available online: https://doi.org/10.1016/j.uclim.2014.06.005 (accessed on 19 August 2020). [CrossRef]
- Zwirschitz, S. Energetische Analyse von Nachverdichtungsvarianten im Urbanen Wohnbau am Beispiel eines dicht Bebauten Wiener Stadtviertels. Master’s Thesis, University of Natural Resources and Life Sciences, Vienna, Austria, 2020. [Google Scholar]
- Vansco, D. Auswirkung der Gebäudebegrünung auf den Innenraumkomfort im Urbanen Wohnbau am Beispiel eines dicht bebauten Wiener Stadtviertels. Master’s Thesis, University of Natural Resources and Life Sciences, Vienna, Austria, 2020. [Google Scholar]
- ArchiPhysik. 2020. Available online: https://archiphysik.at/ (accessed on 24 July 2020).
- Thesim3d. 2020. Available online: http://www.thesim.at (accessed on 24 July 2020).
- Lindberg, F.; Holmer, B.; Thorsson, S.; Rayner, D. Characteristics of the mean radiant temperature in high latitude cities—implications for sensitive climate planning applications. Int. J. Biometeorol. 2014, 58, 613–627. [Google Scholar] [CrossRef] [PubMed]


| A. Roof Type | B. Glazing | C. Light-Weight Construction | D. Heavy-Weight Construction |
|---|---|---|---|
| Flat roof | Equal to existing building | Wall with cellulose insulation and inverted roof | Solid wood wall with intermediate insulation and inverted roof |
| Ventilated wall with wooden paneling and inverted roof | Concrete wall with external insulation and inverted roof | ||
| Twice that of existing building in last floor | Wall with cellulose insulation and inverted roof | Solid wood wall with intermediate insulation and inverted roof | |
| Ventilated wall with wooden paneling and inverted roof | Concrete wall with external insulation and inverted roof | ||
| Sloping roof | Equal to existing building | Wall with cellulose insulation and ventilated rafter roof | Solid wood wall with intermediate insulation and rafter roof |
| Ventilated wall with wooden paneling and ventilated rafter roof | Concrete wall and roof with external insulation | ||
| Twice that of existing building in last floor | Wall with cellulose insulation and ventilated rafter roof | Solid wood wall with intermediate insulation and rafter roof | |
| Ventilated wall with wooden paneling and ventilated rafter roof | Concrete wall and roof with external insulation |
| Construction Type Wall | U-Value [W/m2K] | Construction Type Roof | U-Value [W/m2K] |
|---|---|---|---|
| Wall with cellulose insulation | 0.190 | Inverted roof | 0.196 |
| Ventilated wall with wooden paneling | 0.162 | Ventilated rafter roof | 0.104 |
| Solid wood wall with intermediate insulation | 0.194 | Rafter roof | 0.115 |
| Concrete wall with external insulation | 0.152 | Roof with external insulation | 0.129 |
| A. Roof Type | B. Greening of the Roof | U-Value [W/m2K] |
|---|---|---|
| Flat Roof | No greening (no substrate layer) | 0.186 |
| Extensive greening (10 cm) | 0.181 | |
| Intensive greening (20 cm) | 0.179 | |
| Intensive greening (45 cm) | 0.174 | |
| Intensive greening (90 cm) | 0.159 | |
| Sloping roof | No greening (no substrate layer) | 0.111 |
| Extensive greening (15 cm) | 0.161 |
| Wall Type Number | Wall Type Description |
|---|---|
| Wall type 1 | Wall with cellulose insulation |
| Wall type 2 | Ventilated wall with wooden paneling |
| Wall type 3 | Solid wood wall with intermediate insulation |
| Wall type 4 | Concrete wall with external insulation |
Publisher’s Note: MDPI stays neutral with regard to jurisdictional claims in published maps and institutional affiliations. |
© 2021 by the authors. Licensee MDPI, Basel, Switzerland. This article is an open access article distributed under the terms and conditions of the Creative Commons Attribution (CC BY) license (https://creativecommons.org/licenses/by/4.0/).
Share and Cite
Loibl, W.; Vuckovic, M.; Etminan, G.; Ratheiser, M.; Tschannett, S.; Österreicher, D. Effects of Densification on Urban Microclimate—A Case Study for the City of Vienna. Atmosphere 2021, 12, 511. https://doi.org/10.3390/atmos12040511
Loibl W, Vuckovic M, Etminan G, Ratheiser M, Tschannett S, Österreicher D. Effects of Densification on Urban Microclimate—A Case Study for the City of Vienna. Atmosphere. 2021; 12(4):511. https://doi.org/10.3390/atmos12040511
Chicago/Turabian StyleLoibl, Wolfgang, Milena Vuckovic, Ghazal Etminan, Matthias Ratheiser, Simon Tschannett, and Doris Österreicher. 2021. "Effects of Densification on Urban Microclimate—A Case Study for the City of Vienna" Atmosphere 12, no. 4: 511. https://doi.org/10.3390/atmos12040511