Article

Seasonal Variations of Carbonyls and Their Contributions to the Ozone Formation in Urban Atmosphere of Taiyuan, China

1
School of Environment and Safety, Taiyuan University of Science and Technology, No. 66 Waliu Road Wanbailin District, Taiyuan 030024, China
2
School of Environmental and Chemical Engineering, Shanghai University, Shanghai 200444, China
3
School of Earth and Atmospheric Science, Georgia Institute of Technology, Atlanta, GA 30332, USA
4
State Key Laboratory of Organic Geochemistry, Guangzhou Institute of Geochemistry, Chinese Academy of Sciences, Guangzhou 510640, China
*
Author to whom correspondence should be addressed.
Atmosphere 2021, 12(4), 510; https://doi.org/10.3390/atmos12040510
Submission received: 9 March 2021 / Revised: 5 April 2021 / Accepted: 13 April 2021 / Published: 17 April 2021
(This article belongs to the Section Air Quality)

Abstract

:
Ambient carbonyls are critical precursors of ozone (O3) and secondary organic aerosols (SOA). To better understand the pollution characteristics of carbonyls in Taiyuan, field samplings were conducted, and 13 carbonyls were detected in an urban site of Taiyuan for the four seasons. The total concentration of carbonyls in the atmosphere was 19.67 ± 8.56 μg/m3. Formaldehyde (7.70 ± 4.78 μg/m3), acetaldehyde (2.95 ± 1.20 μg/m3) and acetone (5.57 ± 2.41 μg/m3) were the dominant carbonyl compounds, accounting for more than 85% of the total carbonyls. The highest values for formaldehyde and acetone occurred in summer and autumn, respectively, and the lowest occurred in winter. The variations for acetaldehyde were not distinct in the four seasons. Formaldehyde and acetone levels increased obviously in the daytime and decreased at night, while acetaldehyde did not show significant diurnal variations. Higher temperature and stronger sunlight intensity could facilitate the photochemical reaction of volatile organic compounds (VOCs) and enhance the O3 levels in summer. Formaldehyde and acetaldehyde contributed 70–95% of carbonyls’ ozone formation potential (OFP) caused by carbonyls with the highest totals of 268.62 μg/m3 and 38.14 μg/m3, respectively. The highest concentrations of carbonyls from south and southwest winds in summer suggest that the coke industries in the southern Taiyuan Basin should be, firstly, controlled for the alleviation of ozone pollution.

1. Introduction

Carbonyls play an essential role in atmospheric chemistry. They are critical precursors of various oxidative radicals, ozone (O3), peroxyacetyl nitrate (PAN) and secondary organic aerosols (SOA) in the atmosphere. The sources of carbonyls in the atmosphere are complex, including incomplete combustion of fossil fuel and biomass, direct emission from vegetation and intermediate products of the photochemical oxidation of volatile organic compounds (VOCs) from natural and anthropogenic sources [1,2,3]. Some carbonyls also have potential carcinogenic and mutagenic properties [4,5,6]. According to the report from the World Health Organization’s International Agency for Research on Cancer, formaldehyde is classified as a Group I human carcinogen for its carcinogenicity and acetaldehyde is a Group II carcinogen for its suspected carcinogenicity.
Many studies on carbonyls were firstly conducted in the United States and European countries. The results in Los Angeles, Rome and Orleans indicated that the levels of carbonyls were much higher in urban areas than those in rural and background areas [7,8,9,10]. The levels of carbonyls in southern China (e.g., Shanghai (62.70 μg/m3), Guangzhou (43.55 μg/m3)) were generally higher than those in northern cities (e.g., Beijing (21.05 μg/m3), Zhengzhou (16.82 μg/m3)) (Table 1) [11,12,13,14]. Formaldehyde, acetaldehyde and acetone were the most abundant carbonyls in the atmosphere, and different energy and industrial structures resulted in the different composition proportions of carbonyls in those cities. For example, formaldehyde was the most abundant species in the atmosphere in Beijing [13], while acetaldehyde and acetone were the highest in Nanning and Wuhan, respectively [15,16]. Due to the effects of primary and secondary emissions, carbonyl levels have shown significant seasonal variations. Qian et al. (2019) reported that carbonyls exhibited the highest concentrations in summer, and primary anthropogenic emissions contributed 61% and 69% of total carbonyls in summer and winter, respectively [17]. A previous study in Shenzhen found that carbonyl levels were relatively higher in summer and autumn than those in spring and winter, and biogenic sources and secondary formation contributed 41% and 38% of formaldehyde in summer, respectively [18]. The study in Wuhan indicated that formaldehyde was the dominant carbonyl species. Additionally, 73.5% of formaldehyde in winter was contributed by primary sources, while secondary sources contributed 67.2% of formaldehyde in summer [16]. The difference in industrial structure, vegetational coverage, transportation and meteorological conditions could result in distinct characteristics of carbonyls in different areas and seasons [19,20].
Due to the large coke output and coal consumption, Taiyuan suffered from heavy air pollution for a long period of time. Compared with other cities in China, the levels of polycyclic aromatic hydrocarbons (PAHs) and water-soluble ions (WSIs) in Taiyuan were relatively higher, especially in winter when the increased coal combustion was used for heating [21,22]. Residential coal combustion for household heating still exists in some rural areas of Taiyuan in winter. Additionally, coal is also used for power generation and thermal power plants are also the source of central heating in winter. With the implementation of a series of emissions reduction measures, the air quality in Taiyuan has been greatly improved and the annual PM2.5 concentrations decreased 13% from 2016 to 2020 [23]. It is worth noting that the annual O3–8h levels increased by 33% and its level was 214 μg/m3 with the highest value of 298 μg/m3 in the summer of 2019 [23]. As the important precursors of O3, our previous study mainly focused on the characteristics and sources of hydrocarbon VOCs, such as alkanes, alkenes, aromatics, halocarbons and acetylene [24]. However, as an important subset of VOCs, atmospheric carbonyls and their contribution to O3 formation have not been reported. To understand ambient carbonyls in Taiyuan, four intensive sampling campaigns in four seasons were conducted in an urban site. This is the first observation data of carbonyls reported in Taiyuan. The levels and variations of carbonyls were reported, and their ozone formation potential (OFP) and sources were estimated and discussed, which could help the government to find the cause of ozone pollution episodes and facilitate the development of control strategies.

2. Materials and Methods

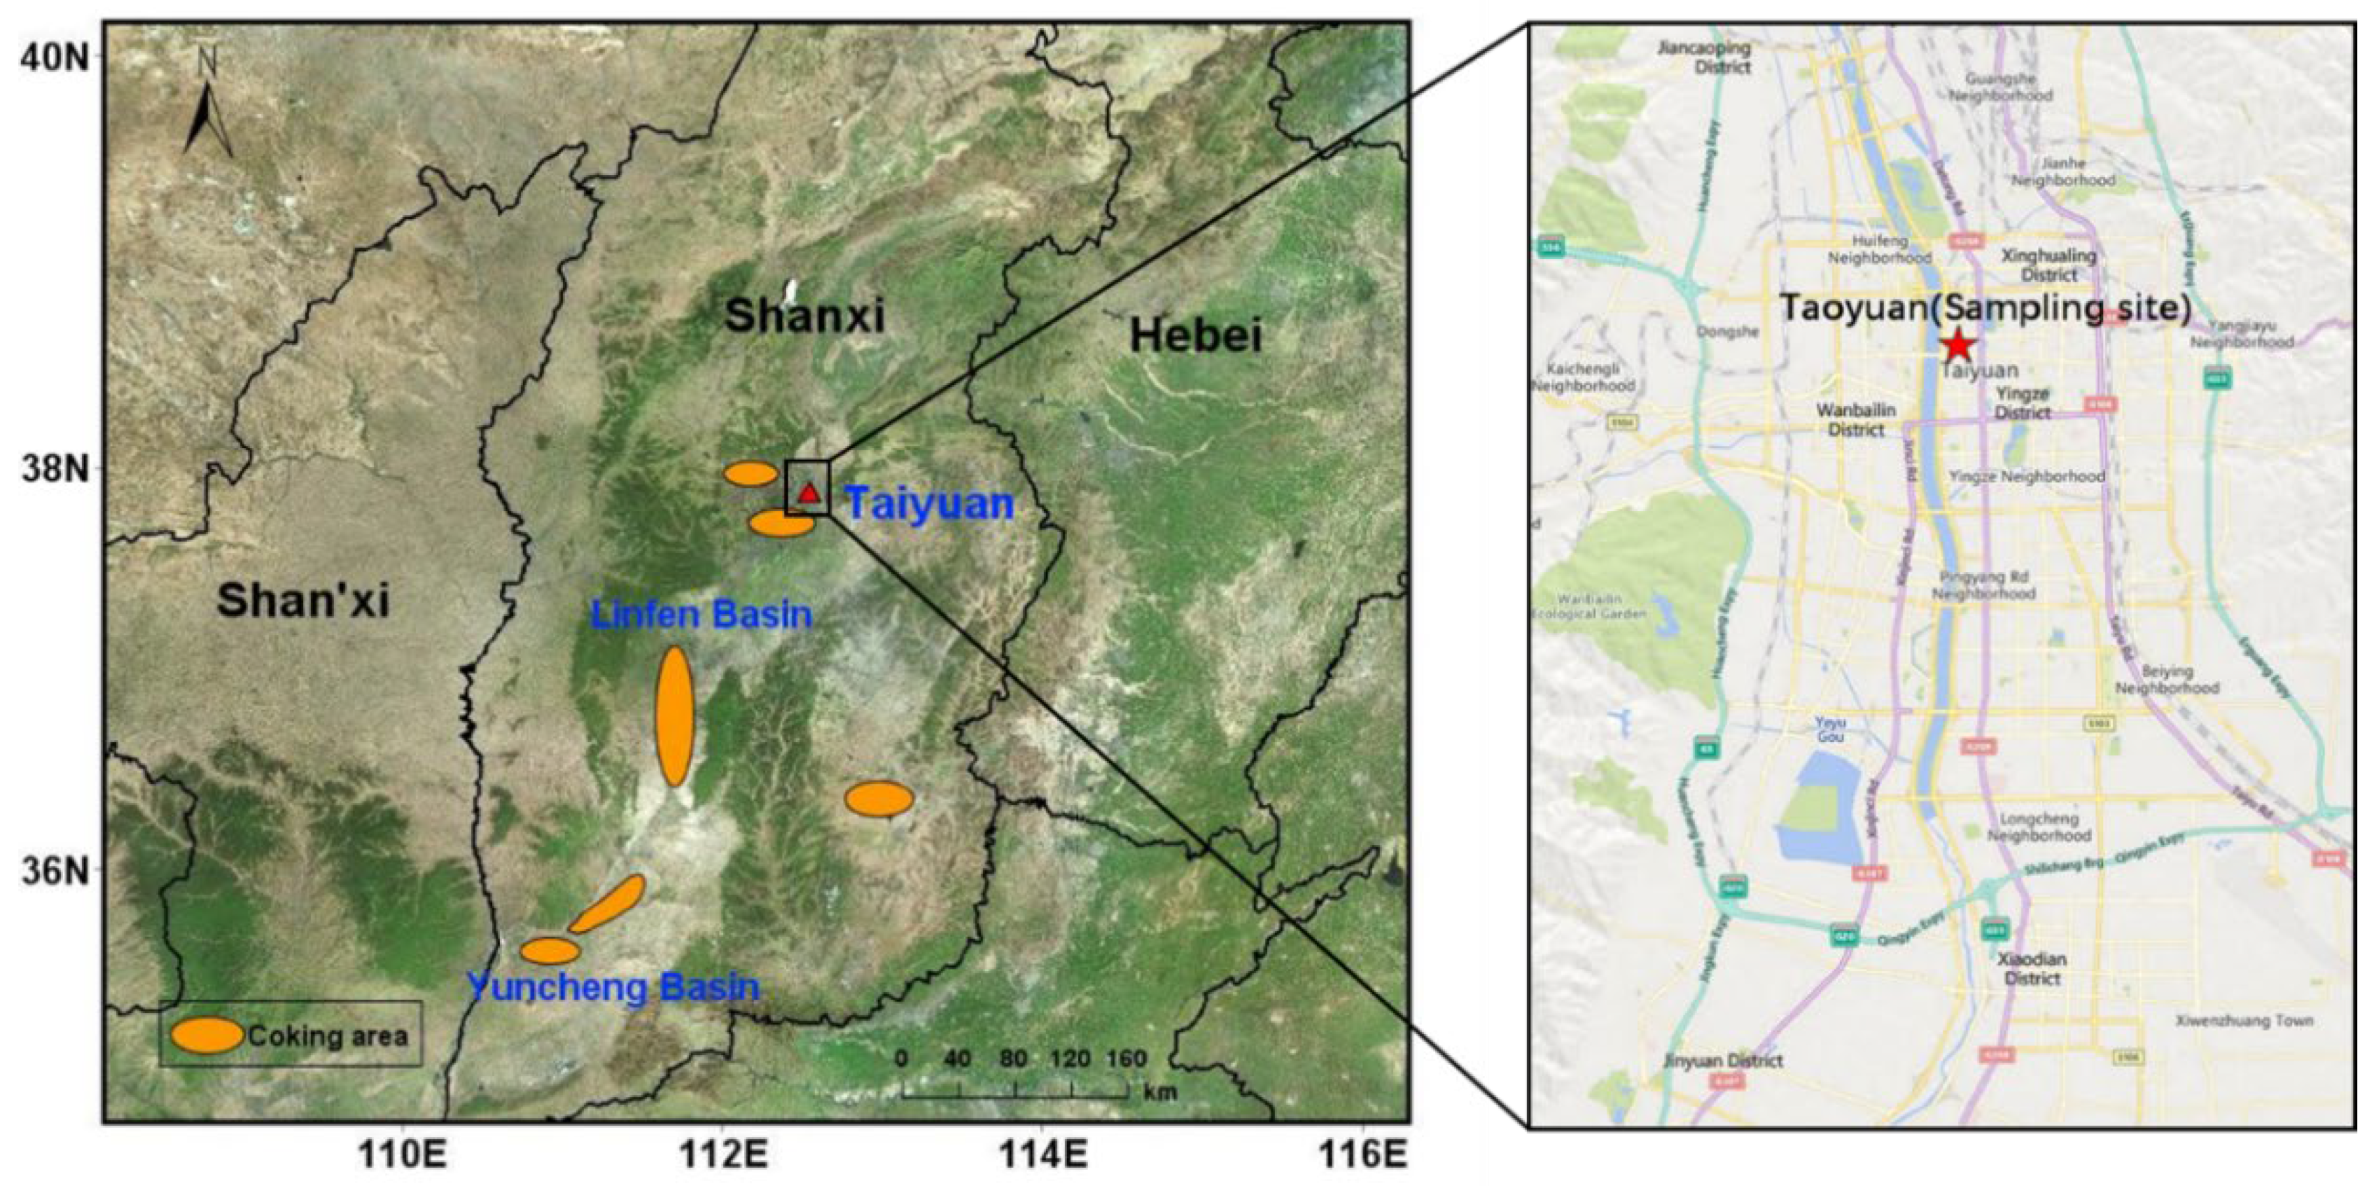
2.1. Sampling Description

The distributions of industrial enterprises in Taiyuan have been described by Li et al. and He et al. [21,22]. The industrial structure of Taiyuan is dominated by coking and steel plants, with Taiyuan Iron and Steel located in the northern region and many coking and coal chemical plants located in the southwest regions of Taiyuan. The coke output in the Taiyuan Basin (including Taiyuan and Jinzhong) was 23.42 million tons in 2019, which accounted for 24.00% of the total production of Shanxi (http://tjj.shanxi.gov.cn/, accessed on 9 March 2020). According to the China Ecological Environment Announcement of 2019, the pollution days (AQI > 100) reached 162 in Taiyuan (http://www.mee.gov.cn/, accessed on 2 June 2020). Large amounts of pollutants from coking processes and the semi-closed topography could aggravate the accumulation of pollutants in this region [21,22].
The sampling campaigns were conducted in the downtown area of Taiyuan (Figure 1) from 1 to 11 October 2018 (autumn), 9 to 20 December 2018 (winter), 1 to 8 and 15 to 17 April 2019 (spring) and 1 to 31 August 2019 (summer). Five samples were collected at a flow rate of 1.0 L/min each day at 7:00–10:00, 10:00–13:00, 13:00–16:00, 16:00–19:00 and 19:00–7:00 (the next day). Finally, a total of 236 samples were collected in our study, including 220 ambient air samples, 8 blank samples and 8 cartridges for the breakthrough experiment. The meteorological data (temperature, pressure, relative humidity, wind speed and direction) and air pollutants, such as SO2, CO, NO2 and O3, during the sampling period were also collected from the Environmental Monitoring Center Station of Taiyuan simultaneously.
Carbonyls were collected by a 2,4-dinitrophenylhydrazine (DNPH)-coated silica cartridge (Sep-Pak DNPH-Silica Cartridges, 350 mg, Waters). A scrubber filled with potassium iodide was used to remove atmospheric O3 before the cartridge. After sampling, the cartridge was removed immediately, caps closed at both ends, wrapped in aluminum foil and then stored in a Teflon bag in the refrigerator at 4 °C for further analysis. A soap film flow meter was used to adjust the flow rate and the deviation of the flow rate did not exceed 5% before and after sampling [11,15,25].

2.2. Chemical Analysis

The analytical procedures were conducted according to the previous literature [25]. All samples were eluted with 5 mL acetonitrile (ACN) into a 5 mL volumetric flask and then the elution was injected into the high-performance liquid chromatography-ultraviolet detector (HPLC-UV) system (HP1260, Agilent, USA) (C18 reverse column: 250 mm × 4.6 mm × 5 μm; UV at 360 nm). The analytical conditions of LC were as follows: Agilent C18 reverse column worked at 42 °C; detector: UV at 360 nm; gradient mobile phase: 20–40% ACN and 20–15% tetrahydrofuran (THF) for 25 min, 40–85% ACN and 15% THF for 8 min, 85–60% ACN and 15–20% THF for 1 min, 20% ACN and 20% THF water solution for 8 min, mobile-phase flow rate: 1.2 mL/min. An individual carbonyl was identified based on the comparison of retention times and quantified by integration of peak areas. In our study, 13 carbonyls were detected including formaldehyde, acetaldehyde, acetone, acrolein, propionaldehyde, crotonaldehyde, butanone, methacrolein (MACR), butanal, benzaldehyde, valeraldehyde, m/p-tolualdehyde and hexanal. Five standard concentrations (0.1–2 μg/mL) covering the concentration of interest were used to calibrate the HPLC-UV system. A strong linear relationship (R2 > 0.9995) was found between concentrations and responses for all target carbonyls. It is noted that m-tolualdehyde and p-tolualdehyde could not be separated and the total concentration of the two compounds was used in this study. The method detection limits (MDLs) of different carbonyls in this study ranged from 0.06 to 0.32 μg/m3 (Table A1). The relative standard deviation (RSD) for duplicate analysis was lower than 5% and the relative percent deviations of replicates were within 5%. Eight blank cartridges were analyzed to confirm the negative effects. The effects were mainly from the laboratory and the sampling site, such as the formaldehyde or acetone solvent in the laboratory and the potential cooking emission from the residential areas nearby. The blank result was lower than the MDLs, which could meet the blank criteria of USEPA. The breakthrough experiment was conducted with two cartridges in series at a flow rate of 1 L/min for 3 h. The samples at night (19:00–7:00) were collected with high-capacity cartridges (800 mg), and there was no breakthrough of these samples and more than 95% of the total carbonyls in the front cartridge.

2.3. O3 Formation Potential

In this study, the maximum incremental reactivity (MIR) was used to calculate the ozone production potential (OFP) of different carbonyl species. For species i, the OFP calculation equation [12,15] is as follows:
O F P i = M I R i × [ V O C s ] i
where [VOCs]i is the average concentration of VOC species i expressed in μg/m3.
MIRi represents the maximum incremental reactivity (gO3/gVOCs) of VOC species i, taken from [26,27], though there was an update of MIR values in Carter (2010), so most of the target carbonyls used the new values to calculate the OFP, including formaldehyde, acetaldehyde and acetone.

3. Results and Discussion

3.1. Atmospheric Carbonyl Levels

Table 1 shows the formaldehyde, acetaldehyde and acetone levels in Taiyuan (other carbonyls are listed in Table A1 and other cities in the world. The total concentration of carbonyls in this study ranged from 3.30 to 53.61 μg/m3, with an average of 19.67 ± 8.56 μg/m3. Formaldehyde, acetaldehyde and acetone were the three most abundant carbonyls in the atmosphere, with average concentrations of 7.70 ± 4.78 μg/m3 (39%), 2.95 ± 1.20 μg/m3 (15%) and 5.57 ± 2.41 μg/m3 (28%), respectively. The concentrations of carbonyls in Taiyuan were significantly lower than those in Shanghai and Nanning [11,15]. The atmospheric carbonyls in Shanghai were greatly affected by the large number of vehicles, while industrial processes, vegetation emission and biomass combustion were the main sources for the higher carbonyl concentrations in Nanning. Carbonyls in our study were similar to those in Beijing during summer, while the concentration of formaldehyde was two times higher than that in Beijing [17]. Formaldehyde in Taiyuan was comparable to that in Xi’an and Wuhan, while the concentrations of acetaldehyde and acetone were relatively low [16,28].

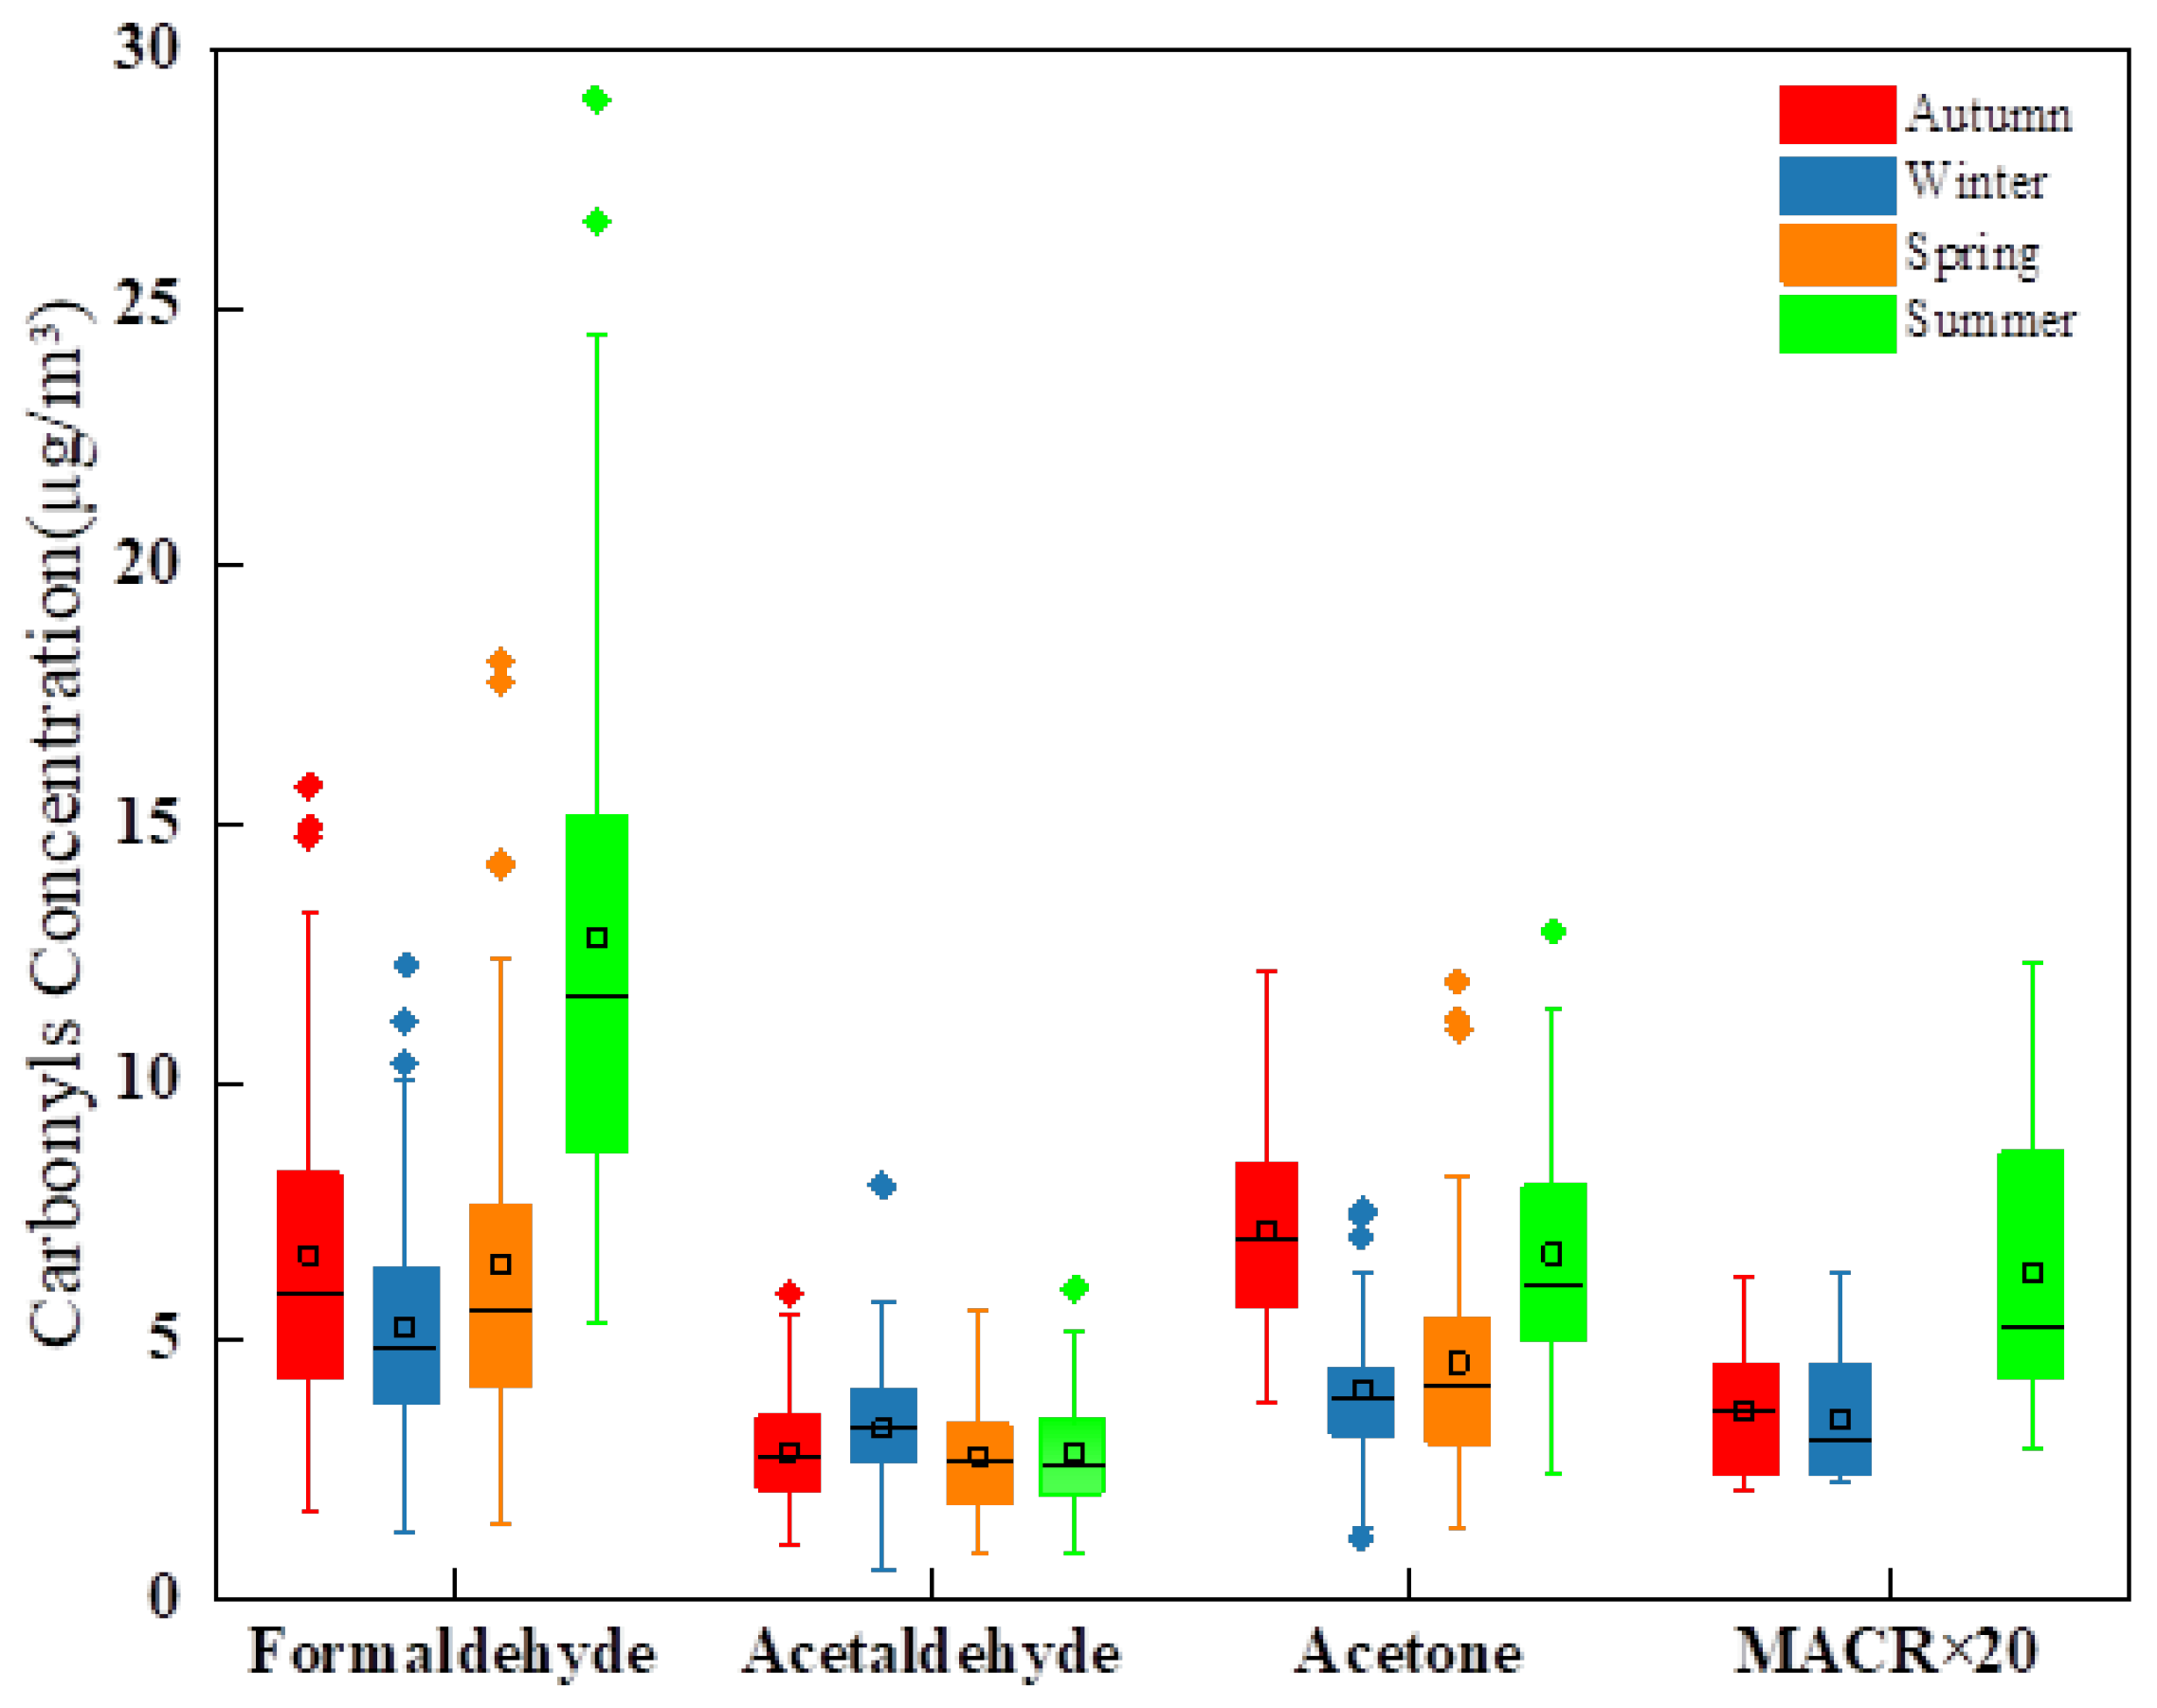
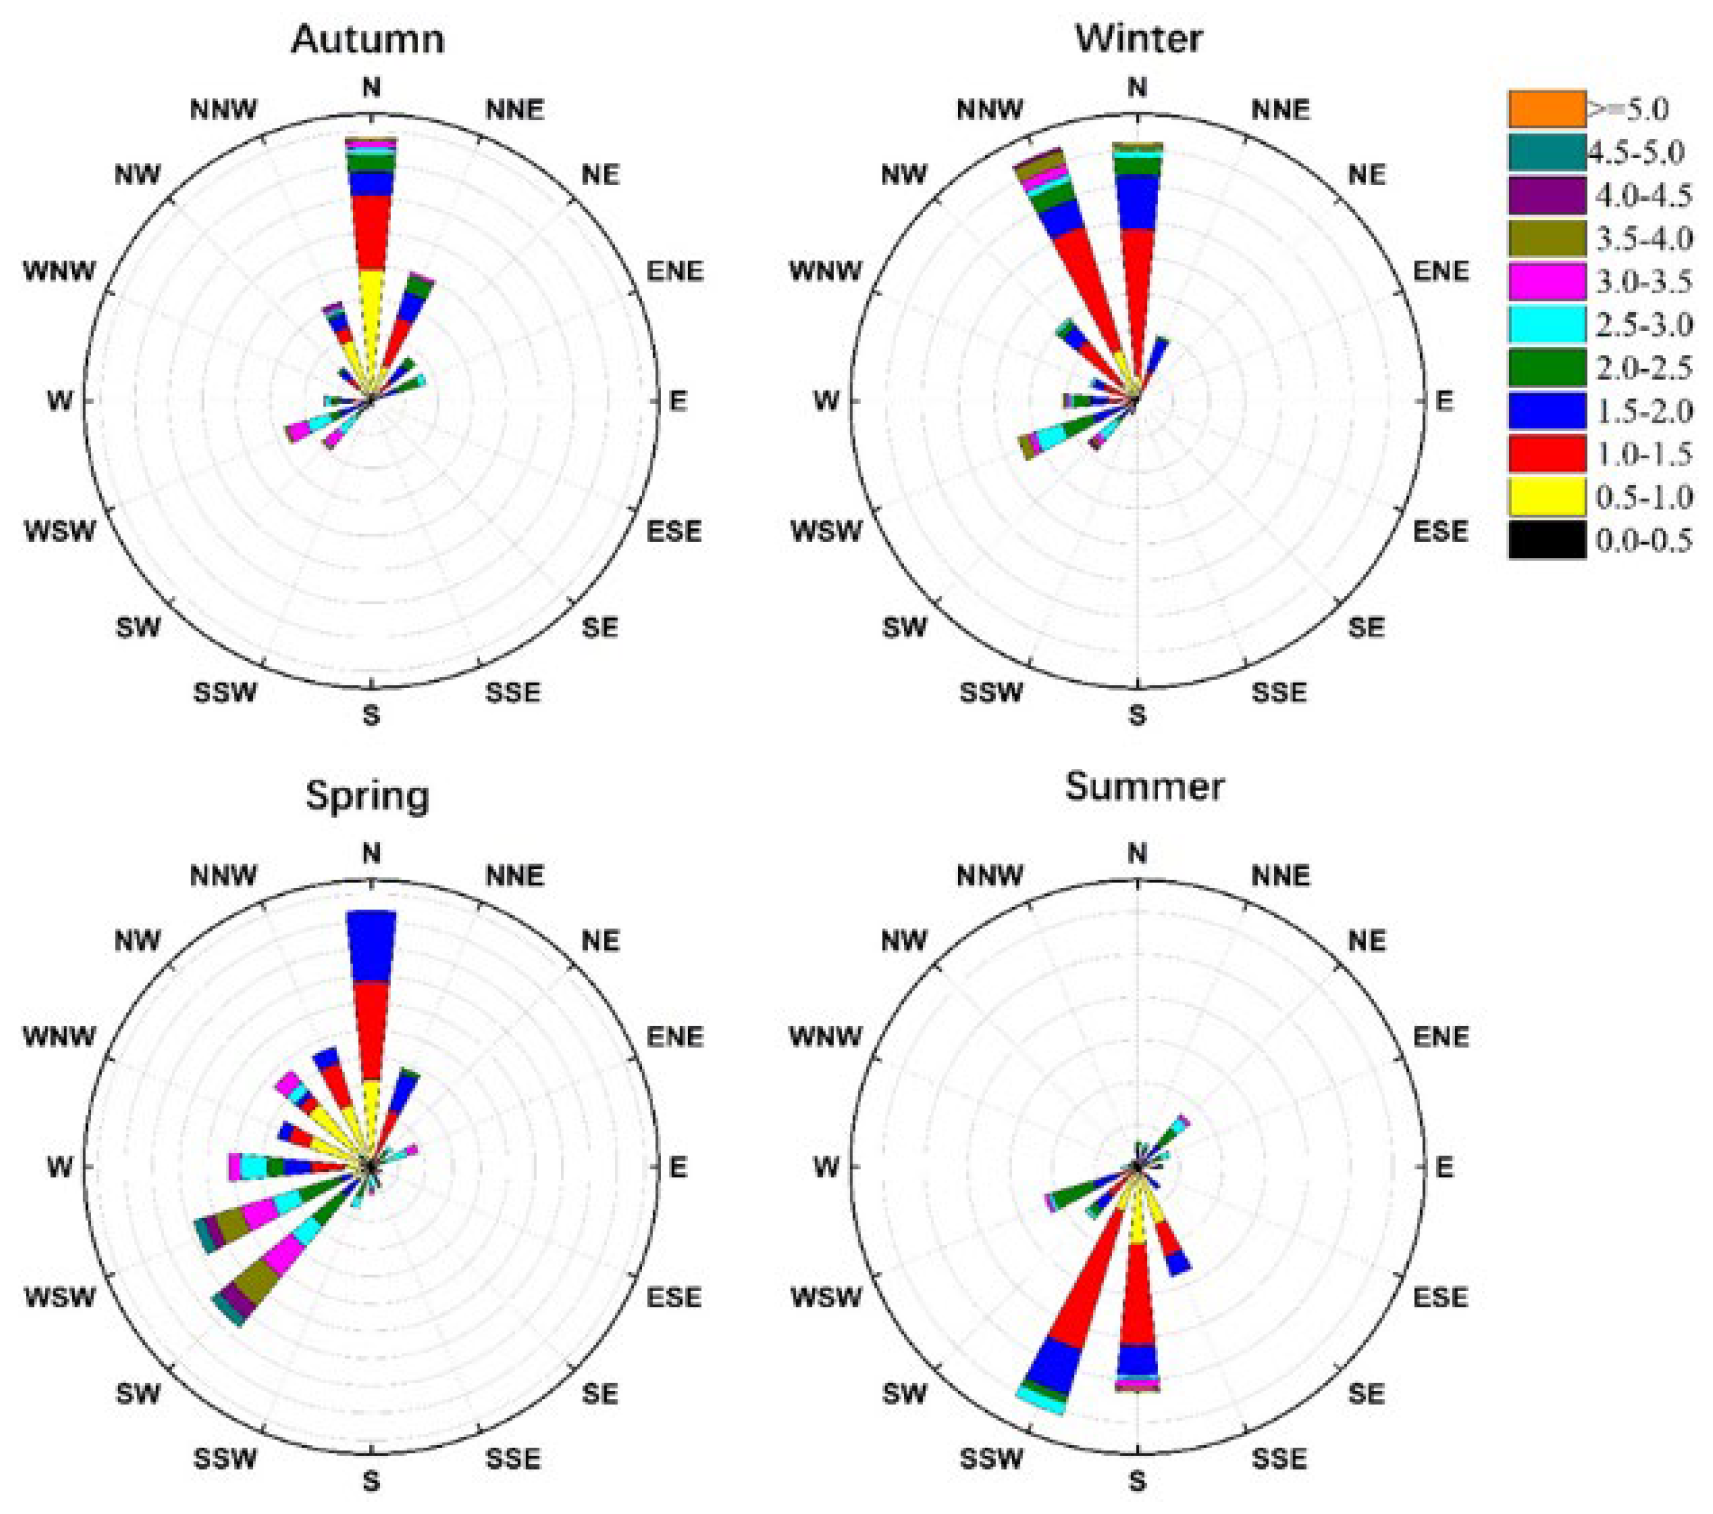
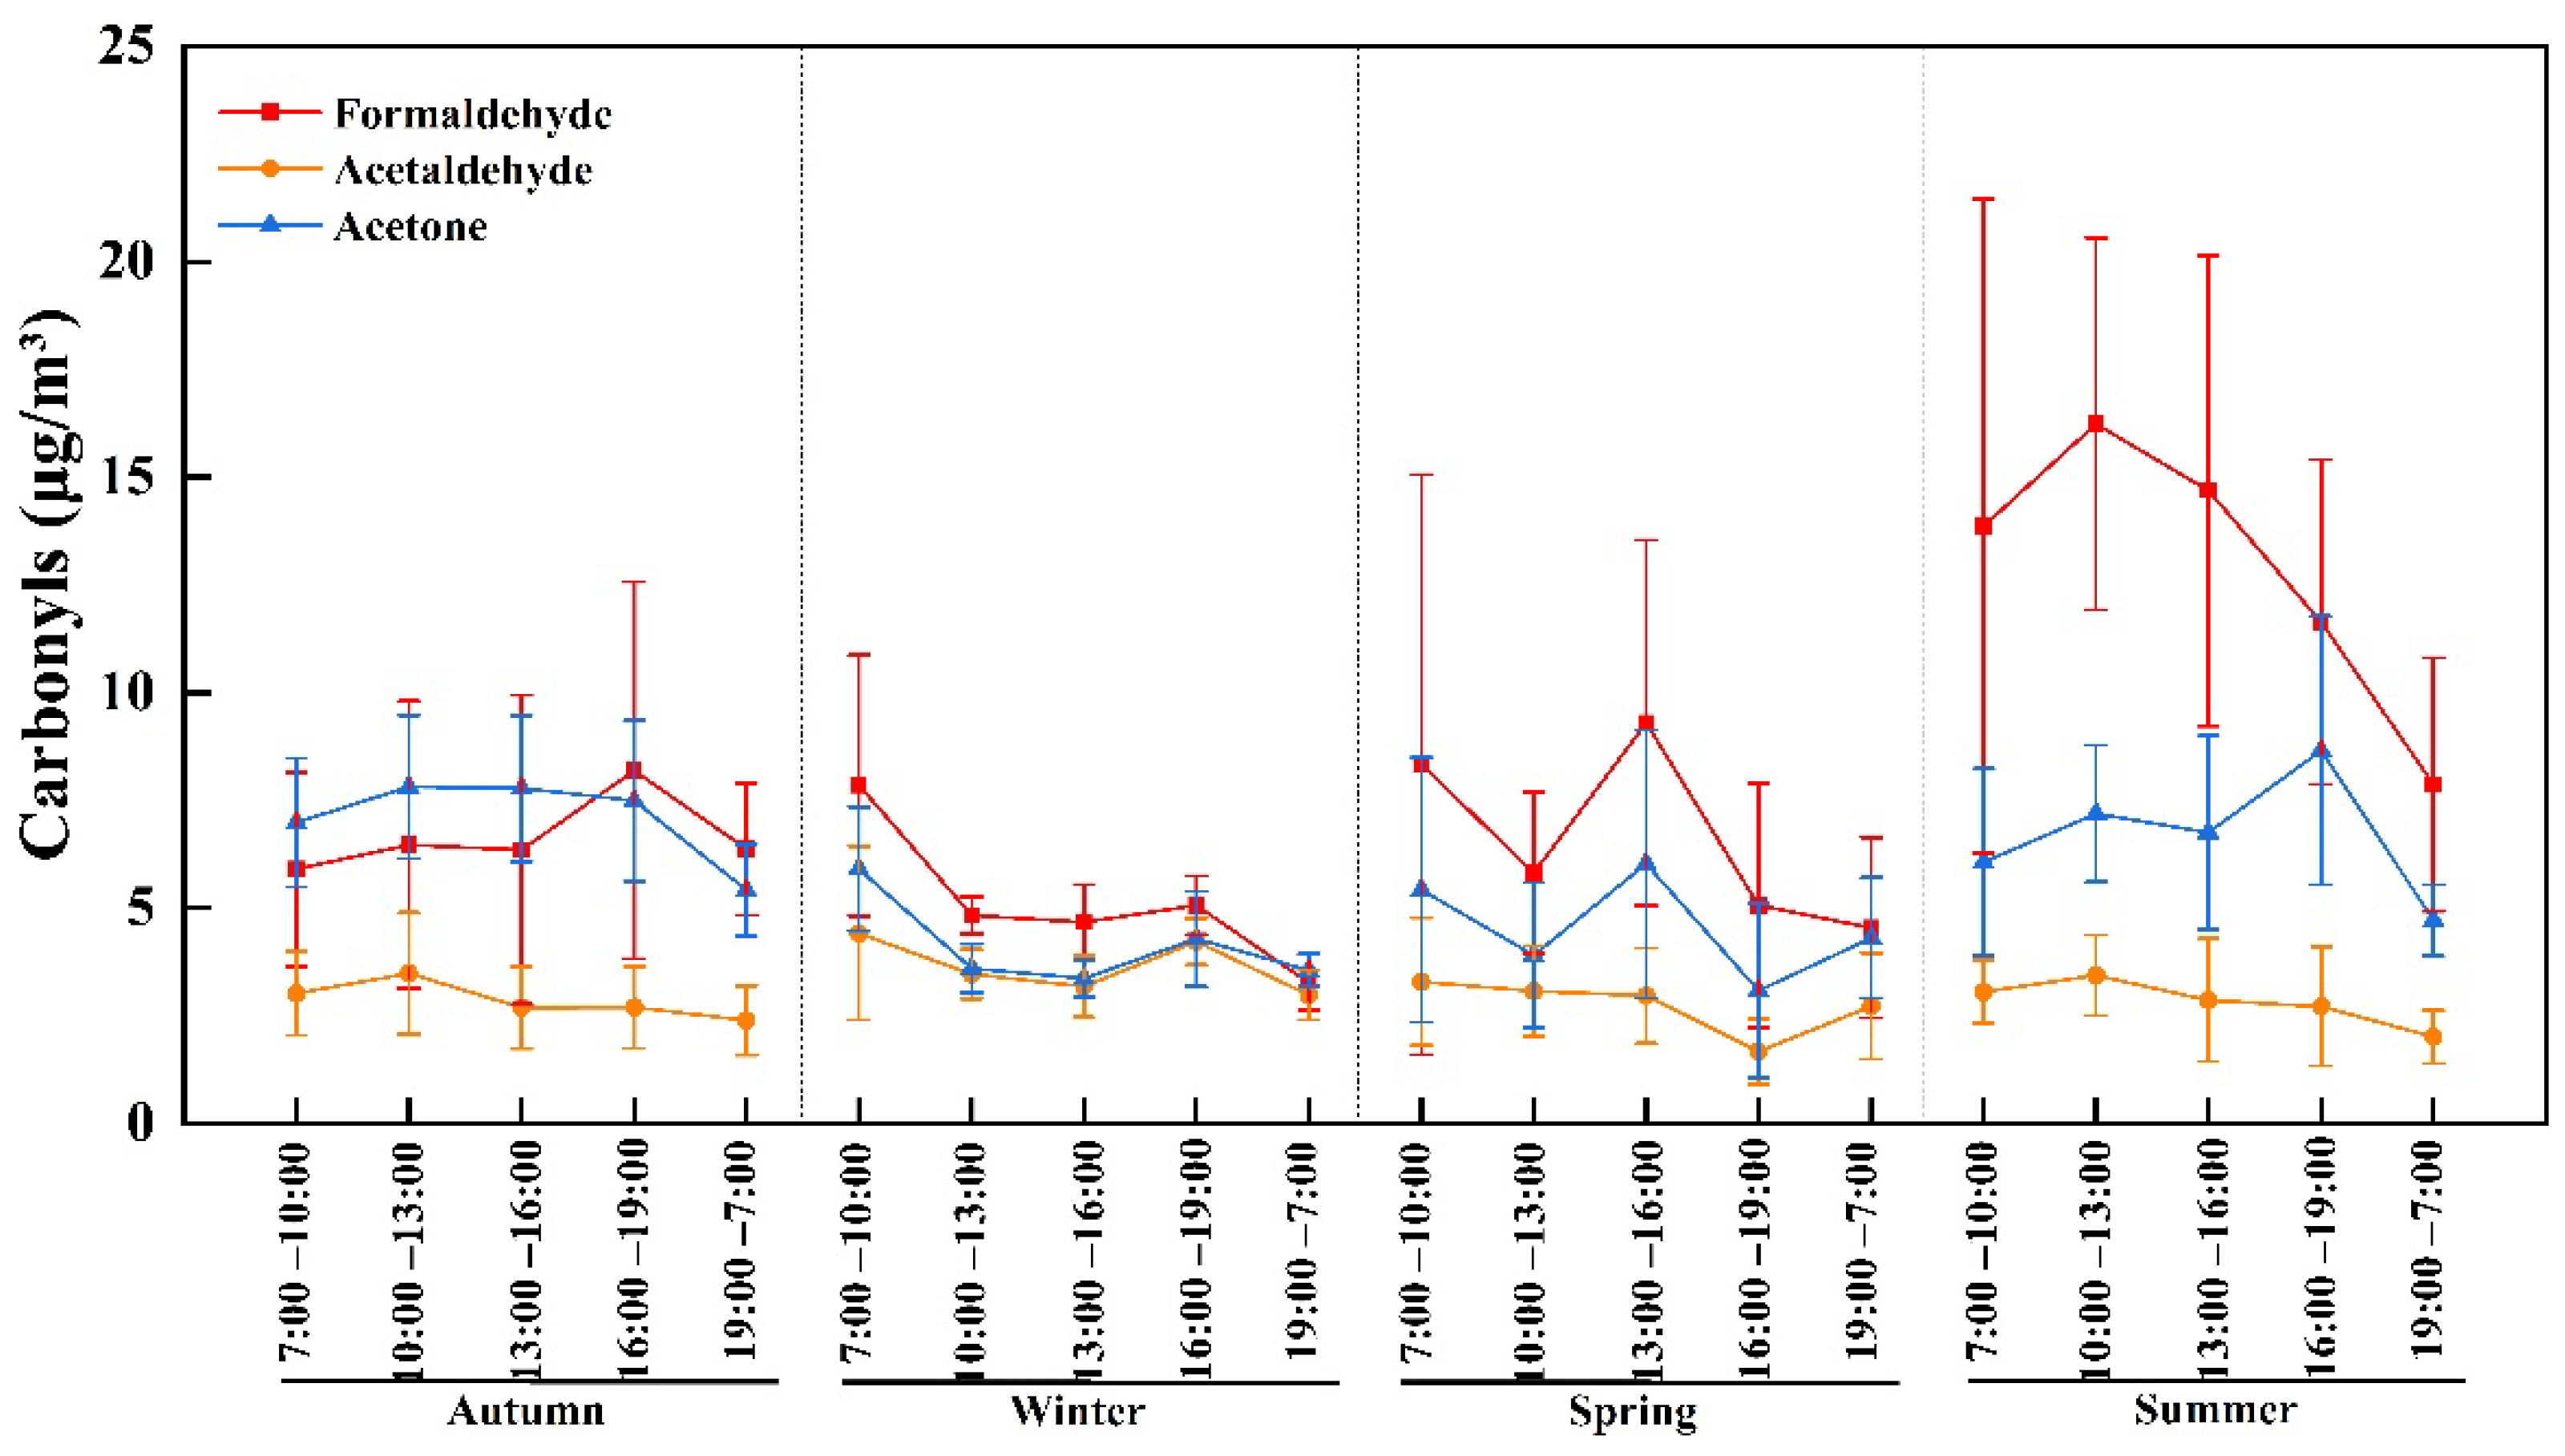
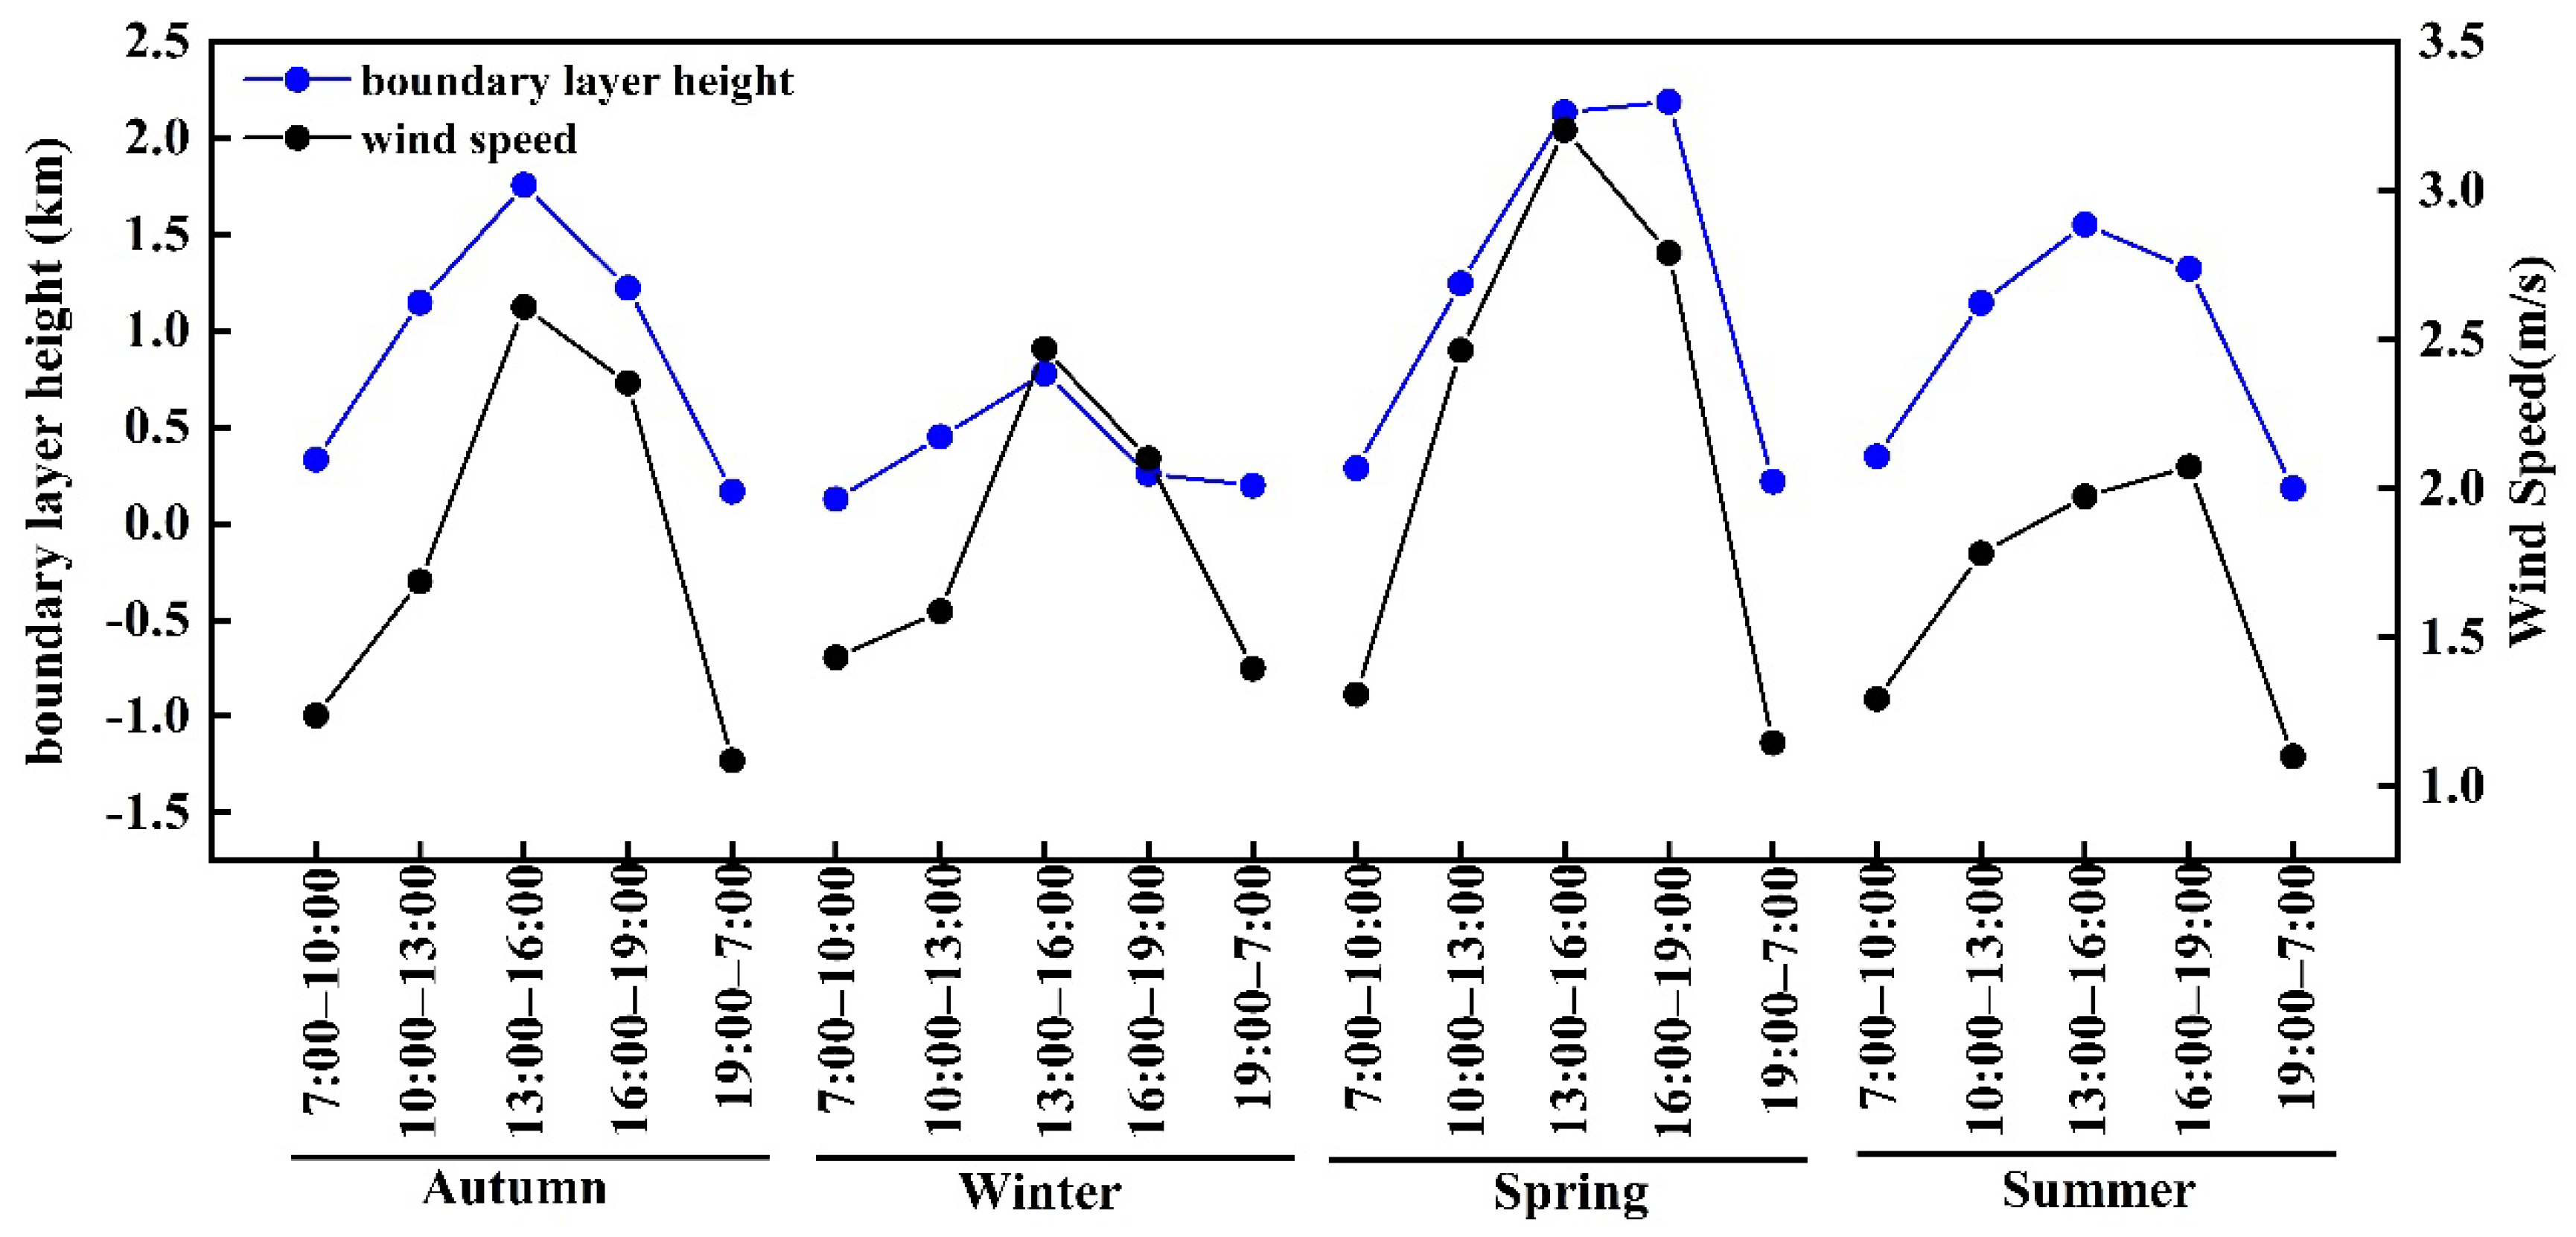
3.2. Seasonal and Diurnal Variations

Due to their sources, sinks and chemical properties, carbonyls showed different characteristics. Figure 2 presents the seasonal variations of formaldehyde, acetaldehyde, acetone and MACR in Taiyuan. The levels of carbonyls showed significant seasonal variations and were the highest in summer (26.40 ± 9.71 μg/m3), followed by autumn (20.28 ± 6.30 μg/m3), spring (17.05 ± 7.88 μg/m3) and winter (15.59 ± 6.12 μg/m3). The result was similar to that in other cities of China, such as Guangzhou, Nanning and Beijing [12,13,31]. Compared with total carbonyl concentrations in Linfen in Shanxi province, the concentrations of total carbonyls in winter in Taiyuan were especially similar [29]. Formaldehyde presented the highest levels in summer (12.82 ± 5.68 μg/m3), the lowest in winter (5.28 ± 2.42 μg/m3) and similar levels in autumn (6.66 ± 3.16 μg/m3) and spring (6.50 ± 3.66 μg/m3). The Kruskal–Wallis H test showed that there were significant differences for formaldehyde during the four seasons (H = 69.864, df = 3, p < 0.05). Strong seasonal variability was found for formaldehyde as compared with acetaldehyde and acetone. These findings suggest that photochemical reactions contributed to formaldehyde significantly in summer. The higher temperature and relative humidity in summer (Table A2) could favor the photochemical reaction [8,25]. In our previous study, only non-methane hydrocarbons and halocarbon species (including alkanes, alkenes, aromatics, halocarbons and acetylene) were measured, and the result of source apportionment by the PMF model analysis indicated that coal coking processes contributed 32.56% of these VOC species [24]. According to Atkinson’s study, the reactions with O3 and the NO3 radical were the main loss paths of alkenes in polluted areas [2]. During the process of reactions for alkenes with O3 and the NO3 radical, abundant carbonyls could be produced. A previous study in Beijing suggested that alkenes were the main precursors of formaldehyde and acetaldehyde [31], and our previous study also showed that the concentrations (5.79 ppbv) of alkenes and their proportion (15.06%) in total hydrocarbon VOCs were relatively higher [24]. As shown in Figure 3, the prevailing wind directions were south and southwest in summer in Taiyuan. The air mass from southwest areas passed through the coal coking areas in the Taiyuan Basin, and the abundant VOCs from the coal coking areas would be the critical precursors of photochemical reactions and contributors of carbonyls in the atmosphere. The average values of the boundary layer height (https://ready.arl.noaa.gov/READYamet.php, accessed on 2 September 2019) in spring, summer, autumn and winter were 833.81 m, 637.61 m, 654.60 m and 287.36 m, respectively. The lower boundary layer height in winter could induce accumulation, leading to the elevation in formaldehyde levels [15,16]. In winter, the lower temperature, decreased sunlight intensity and weaker activeness of photochemical reactions indicate that the primary emissions could be the main sources of formaldehyde in winter. The lowest boundary layer height and elevated emissions could enhance the levels of formaldehyde. However, the lowest concentration of formaldehyde occurred in winter, which indicates that the contribution of elevated emissions to formaldehyde was relatively lower. Acetaldehyde exhibited the highest concentration in winter (3.29 ± 1.40 μg/m3), followed by autumn (2.86 ± 1.06 μg/m3), summer (2.82 ± 1.12 μg/m3) and spring (2.77 ± 1.13 μg/m3), and there were no significant differences for acetaldehyde in the different seasons (H = 7.026, df = 3, p > 0.05). The stable levels of the acetaldehyde concentration suggest that primary emissions were the dominant sources of acetaldehyde during the four seasons, such as vehicle emissions and coal combustion in coking processes and power plants. Vehicular emissions are a major source of carbonyls in Taiyuan, and there were approximately 1.72 million motor vehicles in Taiyuan in 2019, including 1.68 million cars, 0.013 million motorcycles and 0.014 million trailers [32]. Gasoline is the main fuel used for these motor vehicles. Acetone showed the highest concentration in autumn (7.10 ± 1.77 μg/m3), followed by summer (6.68 ± 2.43 μg/m3), spring (4.57 ± 2.37 μg/m3) and winter (4.07 ± 1.47 μg/m3) (H = 78.660, df = 3, p < 0.05). The acetone concentrations in summer and autumn showed no significant difference (p > 0.05), suggesting that the sources of acetone in autumn and summer might be similar. The higher concentrations in summer and autumn might be attributed to the strong activeness of the photochemical reactions and solvent volatilization at high temperature (23.5 °C). According to some previous studies, acetone was often used as a solvent in some construction materials and mechanical activities, and the high ambient temperature was in favor of the volatility of the solvent [15,33]. MACR is one of the specific products from isoprene photo-oxidation, which can be roughly used to estimate the biogenic source of carbonyls. The concentration of MACR was the highest in summer (0.32 ± 0.14 μg/m3), lowest in winter (0.19 ± 0.08 μg/m3) and autumn (0.18 ± 0.06 μg/m3) (H = 23.246, df = 2, p < 0.05) and was not detected in spring. The highest concentration in summer might be associated with the photochemical reactions of hydrocarbon VOCs. The MACR concentrations in autumn and winter had no significant difference (p > 0.05), indicating that primary sources such as vehicle emissions were the major contributors of MACR in these seasons [29,34]. This could be explained by the lower vegetation activities and weaker photochemical reaction in autumn and winter.
In summary, formaldehyde in Taiyuan mainly came from the secondary generation of photochemical reactions in summer and primary emissions in winter. Primary emissions were the dominant sources of acetaldehyde in the four seasons. Acetone was mainly affected by photochemical reactions and solvent volatilization. The main sources of MACR were photochemical reactions in summer and primary emissions in winter.
Figure 4 shows the diurnal variations of formaldehyde, acetaldehyde and acetone. Figure A1 shows the diurnal variations of ratios of formaldehyde, acetaldehyde and acetone to carbon monoxide (CO). They exhibited similar profiles, implying that primary sources had an important contribution to ambient carbonyls. As shown in Figure 4, formaldehyde (H = 12.085, df = 4, p < 0.05), acetaldehyde (H = 10.124, df = 4, p < 0.05) and acetone (H = 10.667, df = 4, p < 0.05) all showed the significant differences during five time periods in spring. Peak values of formaldehyde occurred at 7:00–10:00 and 13:00–16:00 in spring. The first peak might be related to primary emissions (including vehicle emissions and coal combustion) during the traffic rush hours, and CO also showed the highest concentration (1.49 mg/m3) at 7:00–10:00. The second peak in the afternoon suggests the significant influence of photochemical reactions. Except for a decrease at 16:00–19:00, ambient acetaldehyde levels were relatively stable during the other time periods. The concentrations of formaldehyde and acetone also decreased at 16:00–19:00. Primary emissions (coal combustion and traffic emissions) could also significantly contribute to acetaldehyde. Thus, the decreased levels of formaldehyde, acetaldehyde and acetone at 16:00–19:00 were related to the higher wind speed (2.73 m/s) and boundary layer height (2.19 km) (Figure A2). Acetone presented elevated concentrations at 7:00–10:00, 13:00–16:00 and 19:00–7:00, indicating that primary emissions and photochemical reactions all had important contributions to acetone. Solvent usage might also enhance the acetone concentration, apart from secondary emissions, and some previous studies had shown that acetone usage for industrial solvents was the possible reason for the higher levels of acetone at noon [15,25,35], and the increased ambient temperature at daytime was in favor of the volatility of solvents. In summer, there were significant differences of formaldehyde (H = 17.447, df = 4, p < 0.05), acetaldehyde (H = 11.145, df = 4, p < 0.05) and acetone (H = 16.285, df = 4, p < 0.05) in different time periods of each day. An obvious increased level of formaldehyde was observed at 10:00–13:00, which was similar to that in Changsha and Beijing [20,35], indicating that the higher concentration of formaldehyde was related to the enhanced photochemical reactions of VOCs under high temperature and solar intensity at noon in summer [15,36]. Similar to some previous studies in other urban areas, the broad peak in the afternoon in summer suggests the significant influence of photochemical reactions. Acetaldehyde had a small peak at 10:00–13:00 and showed a decreased trend during other time periods, indicating that acetaldehyde was also influenced by photochemical reactions. The elevated concentration of acetone at 10:00–13:00 suggests the contribution of photochemical reactions, while the relatively high peak values at 16:00–19:00 might be associated with the vehicle emissions during the traffic rush hours. It is noted that the decreased concentrations of all three carbonyls were observed at night (19:00–7:00), which could be attributed to removal processes such as dry deposition or reaction with O3 and the NO3 radical [8,19]. In autumn, formaldehyde (H = 1.965, df = 4, p > 0.05) and acetaldehyde (H = 5.343, df = 4, p > 0.05) showed no significant differences during different time periods, unlike acetone (H = 15.283, df = 4, p < 0.05). Formaldehyde and acetaldehyde showed elevated concentrations at 10:00–13:00, indicating that the photochemical reactions were the important sources of formaldehyde and acetaldehyde. Additionally, formaldehyde also exhibited a peak value at 16:00–19:00 and the acetaldehyde level was stable during other time periods, indicating that vehicle emissions and primary emissions (mainly including coal combustion) were also the important sources of formaldehyde and acetaldehyde, respectively. Acetone showed a broad peak in the daytime (7:00–19:00), which suggests the significant influence of photochemical reactions on acetone [16]. In winter, formaldehyde (H = 23.169, df = 4, p < 0.05) and acetone (H = 12.808, df = 4, p < 0.05) had significant differences during the five time periods on diurnal variations, implying that the sources of formaldehyde and acetone varied at different time periods. Formaldehyde and acetone both showed the highest levels at 7:00–10:00 and a small peak at 16:00–19:00, which were similar to those in Wuhan and Linfen [16,29], and the primary emissions during traffic rush hours could be responsible for the fluctuations. Photochemical reactions might also influence the local formaldehyde and acetone partly due to the small elevation in the daytime. Acetaldehyde (H = 5.215, df = 4, p > 0.05) showed no significant differences during the different time periods, indicating that the contributions of sources to acetaldehyde were relatively stable, and vehicle emissions and coal combustion were the dominant sources of acetaldehyde. Adverse meteorological conditions (such as low wind speed and temperature inversion) could also facilitate the accumulation of acetaldehyde levels.

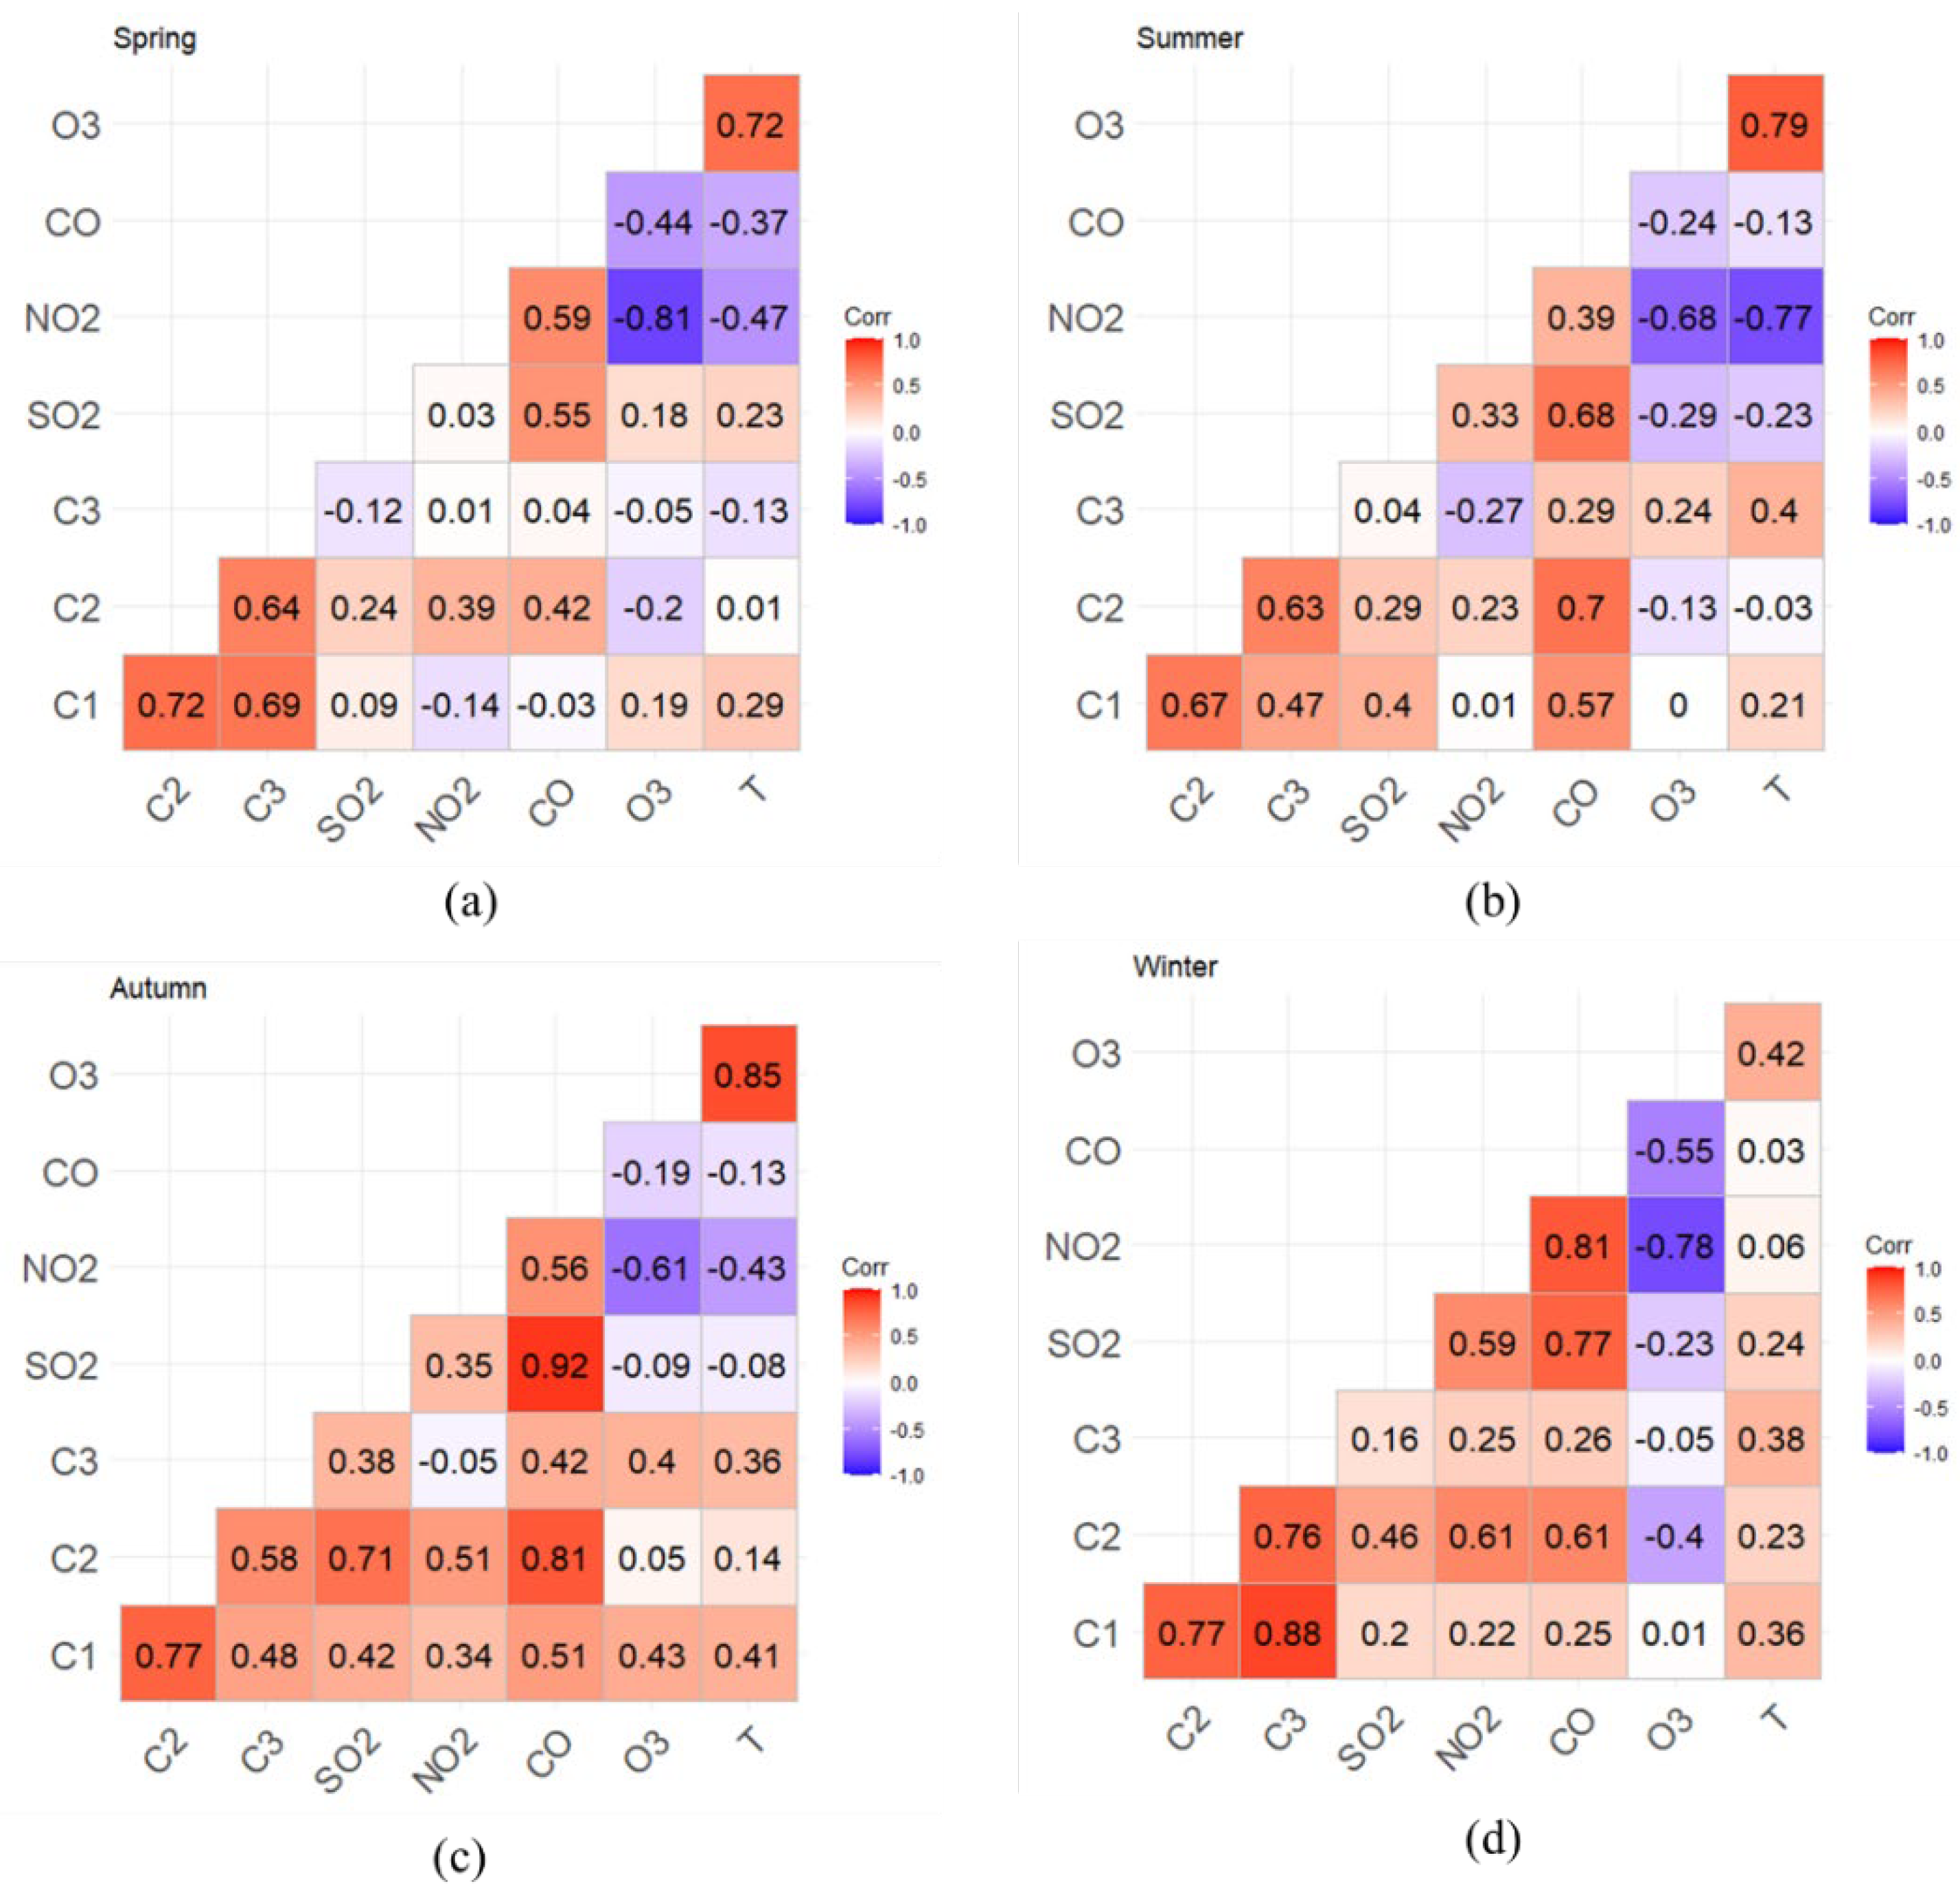
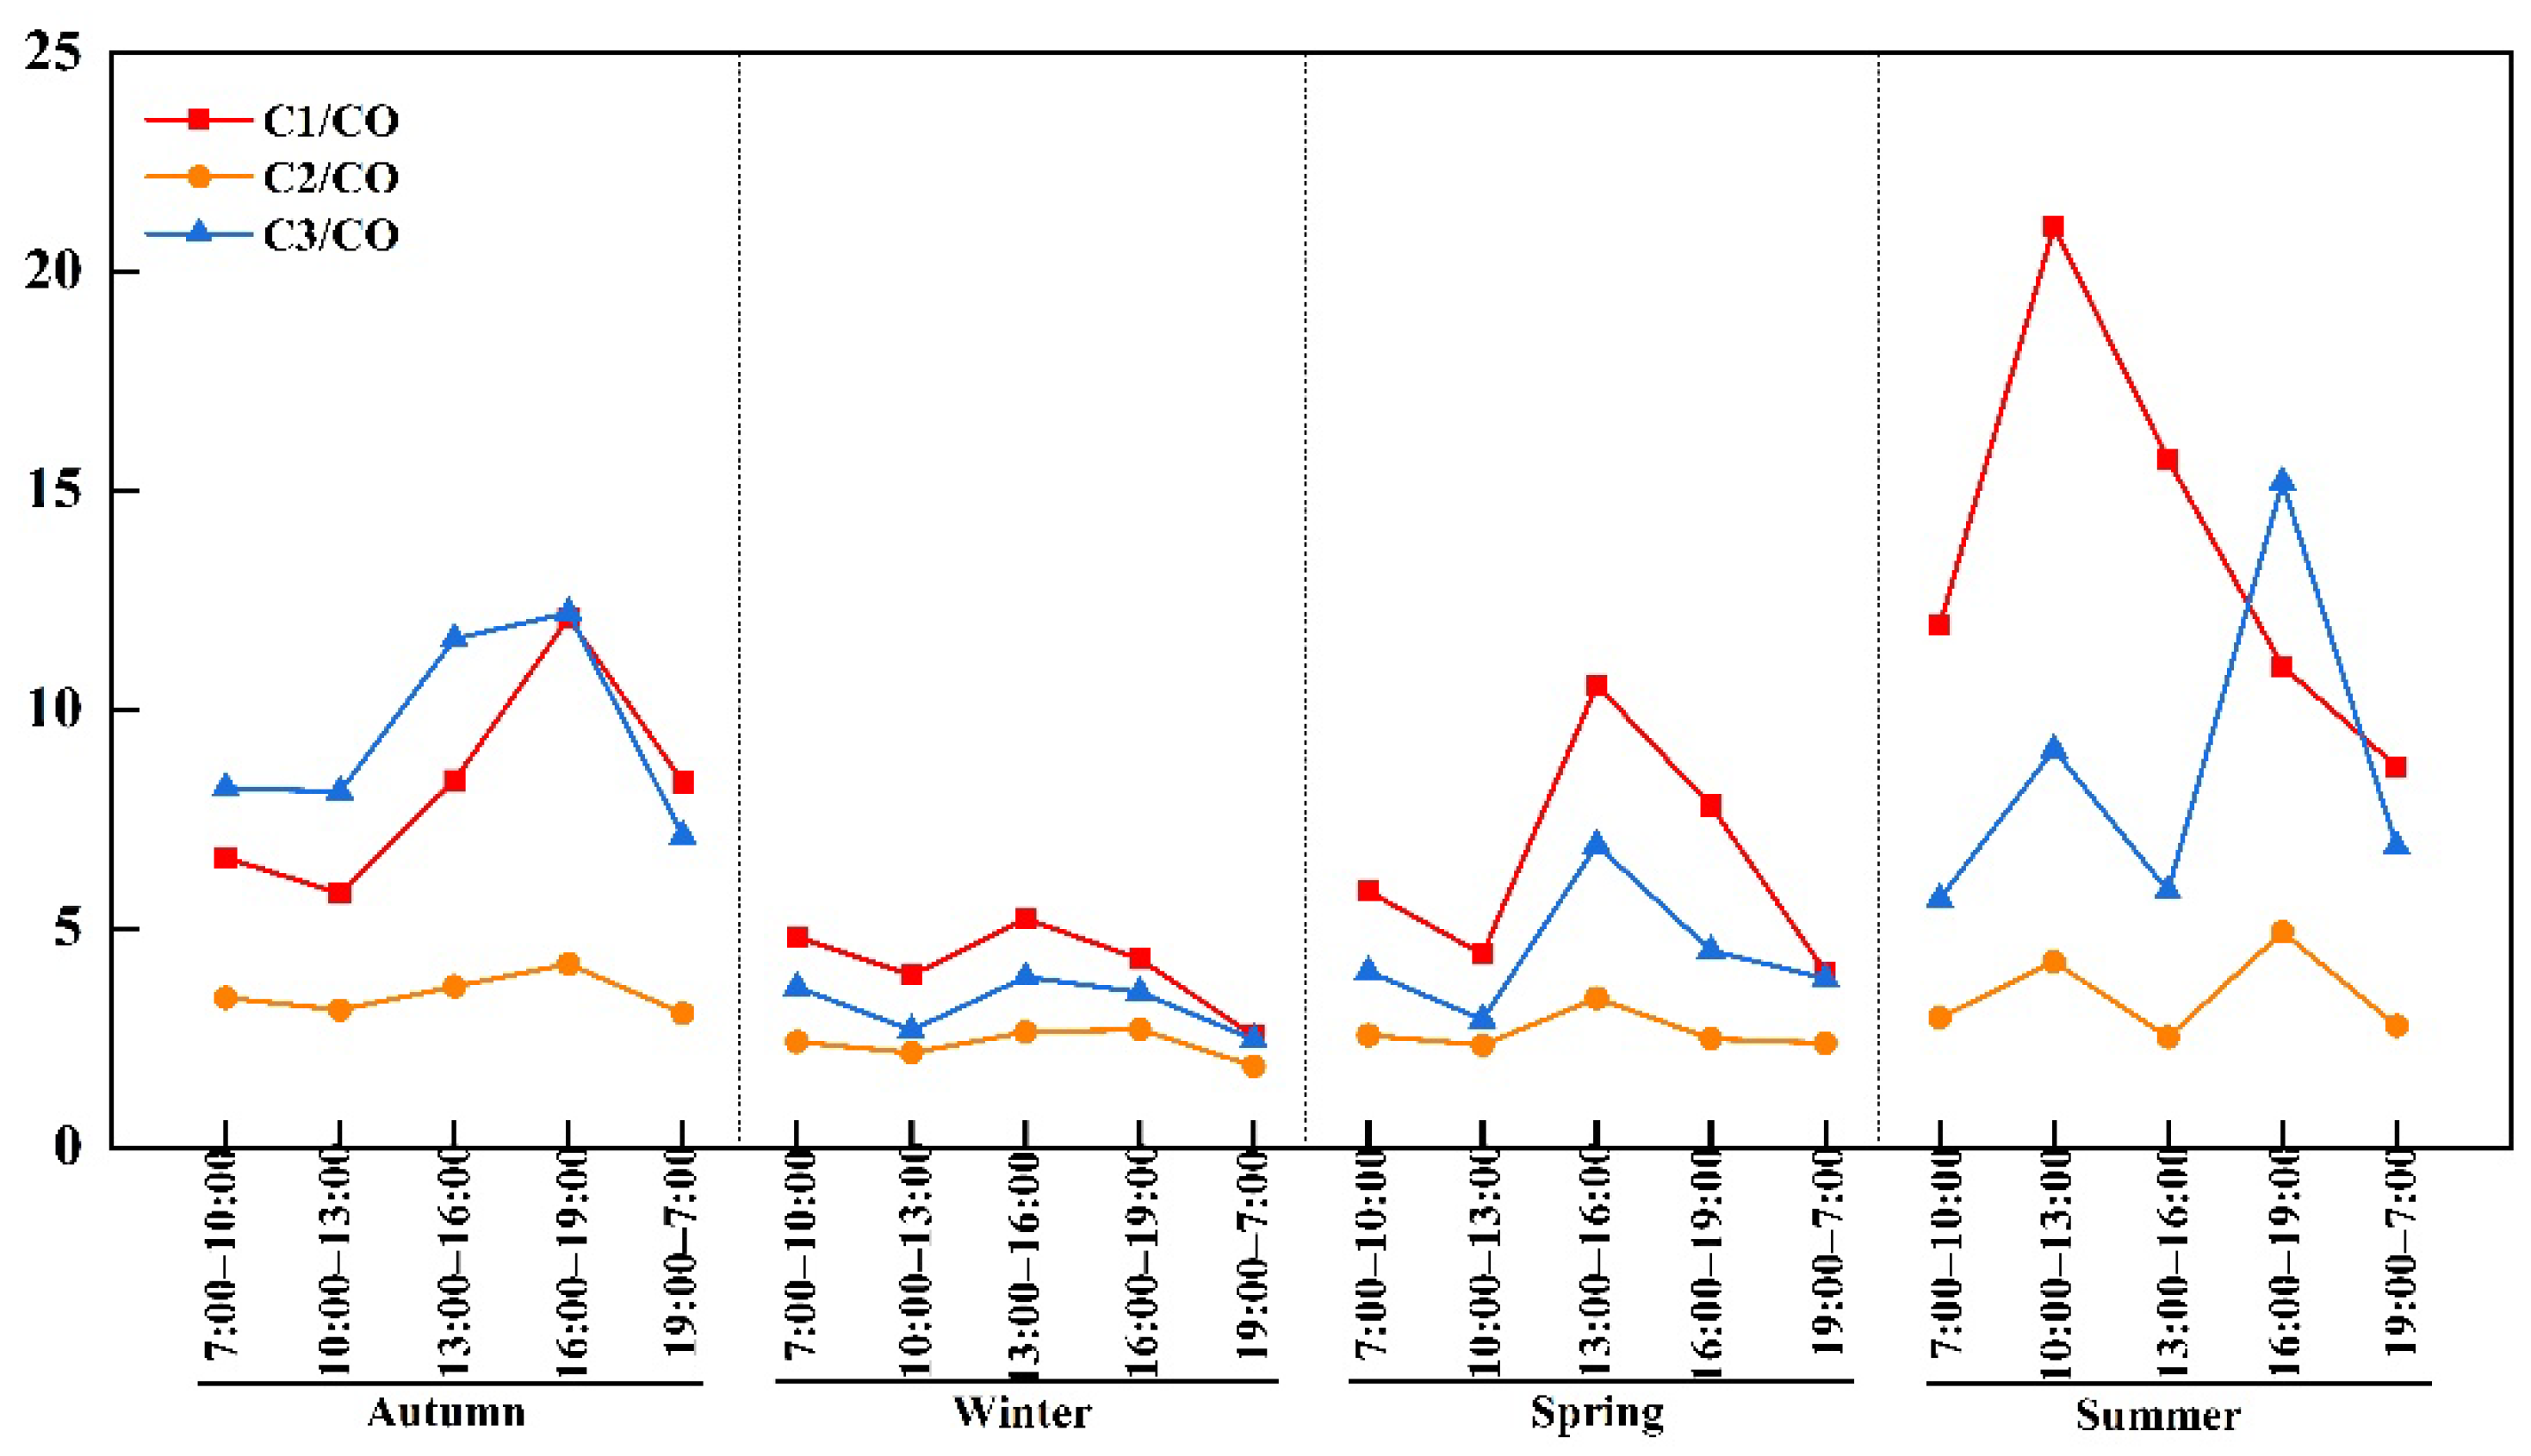
3.3. Ratios and Correlation Analysis

Many studies in the literature used the concentration ratios of formaldehyde/acetaldehyde (C1/C2) and acetaldehyde/propionaldehyde (C2/C3) to identify the potential sources of ambient carbonyls [16]. The C1/C2 ratio usually ranges from 1 to 2 in urban areas with the impact of anthropogenic emissions and is about 10 in forested rural areas, indicating the biogenic source of formaldehyde [20,37]. Propionaldehyde is considered only to be associated with anthropogenic sources, while other carbonyls can be from both natural and anthropogenic sources. The C2/C3 ratio is generally low in polluted urban air and high in rural and forested atmospheres, which was proposed as an indicator of anthropogenic sources for aldehydes in the atmosphere [8,25].
The average ratios of C1/C2 and C2/C3 during the four seasons in Taiyuan are shown in Table 2. The highest ratio of C1/C2 was in summer (4.68), followed by spring (2.39), autumn (2.34) and winter (1.68). The C1/C2 ratios in Taiyuan were similar to those in Wuhan, except for winter. The ratio of C1/C2 in winter is in good agreement with the range from 1 to 2 in urban areas, indicating the significant emission from anthropogenic sources. The highest C1/C2 ratio in summer indicates that intensive photochemical reactivity led to the formation of ambient carbonyls in summer compared to the other seasons. Previous studies showed that the photochemical reactions of active hydrocarbons were favorable for the formation of carbonyls [20,38], and compared with acetaldehyde and acetone, formaldehyde was the main product in the photochemistry of VOCs [39]. Unlike the large fluctuation of C2/C3 ratios in different seasons in some other cities, the average ratios of C2/C3 in this study did not show significant fluctuations in the four seasons (5.63–6.34). The stable C2/C3 ratios (5.63–6.34) suggest that the seasonal variations had little influence on acetaldehyde and propionaldehyde and primary emissions were the dominant sources of them. The C2/C3 ratios were similar to those in haze days in Beijing [20] and in summer in Guangzhou [12], and much lower than those in Nanning [15]. The urban sites in Beijing and Guangzhou were influenced by primary emissions obviously, and C2/C3 was also a significant indicator of primary emissions of acetaldehyde and propionaldehyde. Previous research also showed that high-molecular weight carbonyls were more reactive than low-molecular weight carbonyls, so acetaldehyde had a longer lifetime than propionaldehyde, and the higher average C2/C3 ratio was also related to the photochemical reactions of natural precursors [15,40]. The low C2/C3 ratios in Taiyuan suggest that photochemical reactions only contributed to acetaldehyde partly.
Figure 5 shows the Pearson correlation coefficients between the main carbonyls and air pollutants during the four seasons. In this study, we defined the four levels of correlation, and they are poor correlation (r < 0.3), weak correlation (0.3 ≤ r < 0.6), good correlation (0.6 ≤ r < 0.8) and strong correlation (r ≥ 0.8). It had been reported that atmospheric SO2 is mainly emitted from coal combustion [24,42] and CO is mainly from vehicle emissions [16,31,32], while NO2 is mainly from vehicle emissions and coal combustion [43]. Additionally, O3 is mainly formed by photochemical reactions. In spring, formaldehyde, acetaldehyde and acetone showed good correlations (r = 0.64–0.72, p < 0.01) with each other, indicating that these three carbonyls shared similar sources, and primary emissions could be the main sources. Formaldehyde had poor correlations with O3 (r = 0.19, p < 0.01) and temperature (r = 0.29, p < 0.01), suggesting that the photochemical reactions contributed to formaldehyde partly in spring. Acetaldehyde had weak correlations with NO2 (r = 0.39, p < 0.01) and CO (r = 0.42, p < 0.01), suggesting that vehicle emissions and coal combustion made important contributions to it. No correlations were observed between acetone and inorganic gas, implying that acetone might have other significant sources such as solvent usage or background sources. In summer, acetaldehyde showed good correlations with formaldehyde (r = 0.67, p < 0.01) and acetone (r = 0.63, p < 0.01), but formaldehyde and acetone had a weak correlation with each other (r = 0.47, p < 0.01), and the complex photochemical reactions in summer might reduce the correlations of carbonyls [8,25]. Formaldehyde showed weak correlations with SO2 (r = 0.40, p < 0.01) and CO (r = 0.57, p < 0.01), indicating that the contributions of primary sources (including coal combustion and vehicle emissions) were important in summer. Compared with acetaldehyde and acetone, formaldehyde was often the dominant product of the photochemistry reaction of VOCs in summer [15]. O3 is used as the tracer of secondary sources in this study. As shown in Figure 5, there were no correlations between formaldehyde with O3 in summer. The peak value of formaldehyde was ahead of O3 for about 3 h (Figure 6). A previous study in Beijing also indicated that the peak value of formaldehyde was ahead of O3 for about 2–4 h and the peak of formaldehyde might be the result of the struggle of photochemical formation and photochemical loss [44]. Acetaldehyde correlated well with CO (r = 0.70, p < 0.01), implying that vehicle emissions made an important contribution to ambient acetaldehyde. Acetone showed a weak correlation (r = 0.40, p < 0.01) with temperature and poorly correlated with CO (r = 0.29, p < 0.01) and O3 (r = 0.24, p < 0.01), suggesting that the influence of temperature variations on acetone was more significant compared with vehicle emissions and photochemical reactions. These results indicate that the evaporation of solvents from industry or construction made critical contributions to acetone. In autumn, formaldehyde and acetaldehyde had a good correlation (r = 0.77, p < 0.01) with each other, but acetone just showed weak correlations with formaldehyde (r = 0.48, p < 0.01) and acetaldehyde (r = 0.58, p < 0.01), suggesting that formaldehyde and acetaldehyde shared more sources. Acetaldehyde strongly correlated with SO2 (r = 0.71, p < 0.01) and CO (r = 0.81, p < 0.01) and had a weak correlation with NO2 (r = 0.51, p < 0.01), indicating that vehicle emissions and coal combustion were the significant contributors of acetaldehyde. Formaldehyde and acetone showed weak correlations with SO2, NO2 and CO (r = 0.34–0.51, p < 0.01), and they also weakly correlated with O3 and temperature (r = 0.36–0.43, p < 0.01), suggesting that the sources of formaldehyde and acetone were not clear and primary sources (such as vehicle emissions and coal combustion) and photochemical reactions both made contributions to them. The weak correlations between formaldehyde and acetone (r = 0.48, p < 0.01) indicate that the main sources of them were not clear. In winter, formaldehyde, acetaldehyde and acetone showed strong correlations (r = 0.76–0.88, p < 0.01), indicating that primary emissions might be the main sources of carbonyls. Previous studies showed that carbonyls usually correlated well each other in winter and poorly in summer because they mainly discharged from primary sources in winter compared with photochemical reactions in summer [8]. However, only acetaldehyde correlated well with NO2 (r = 0.61, p < 0.01) and CO (r = 0.61, p < 0.01), and just a weak correlation was observed between acetaldehyde and SO2 (r = 0.46, p < 0.01), implying that the local vehicle emissions might be the dominant sources of acetaldehyde. Formaldehyde and acetone only showed poor correlations with SO2, NO2 and CO (r = 0.16–0.26, p < 0.05), suggesting that the transportation of the aged air mass and that mixed with local air might influence the carbonyls. Formaldehyde and acetone also showed weak correlations with temperature (r = 0.36–0.38, p < 0.01), implying that photochemical reactions contributed to formaldehyde and acetone partly. The carbonyls did not show significant positive correlations with O3, which could be ascribed to the fact that the complex photochemical processes in the atmosphere were not considered in this study.

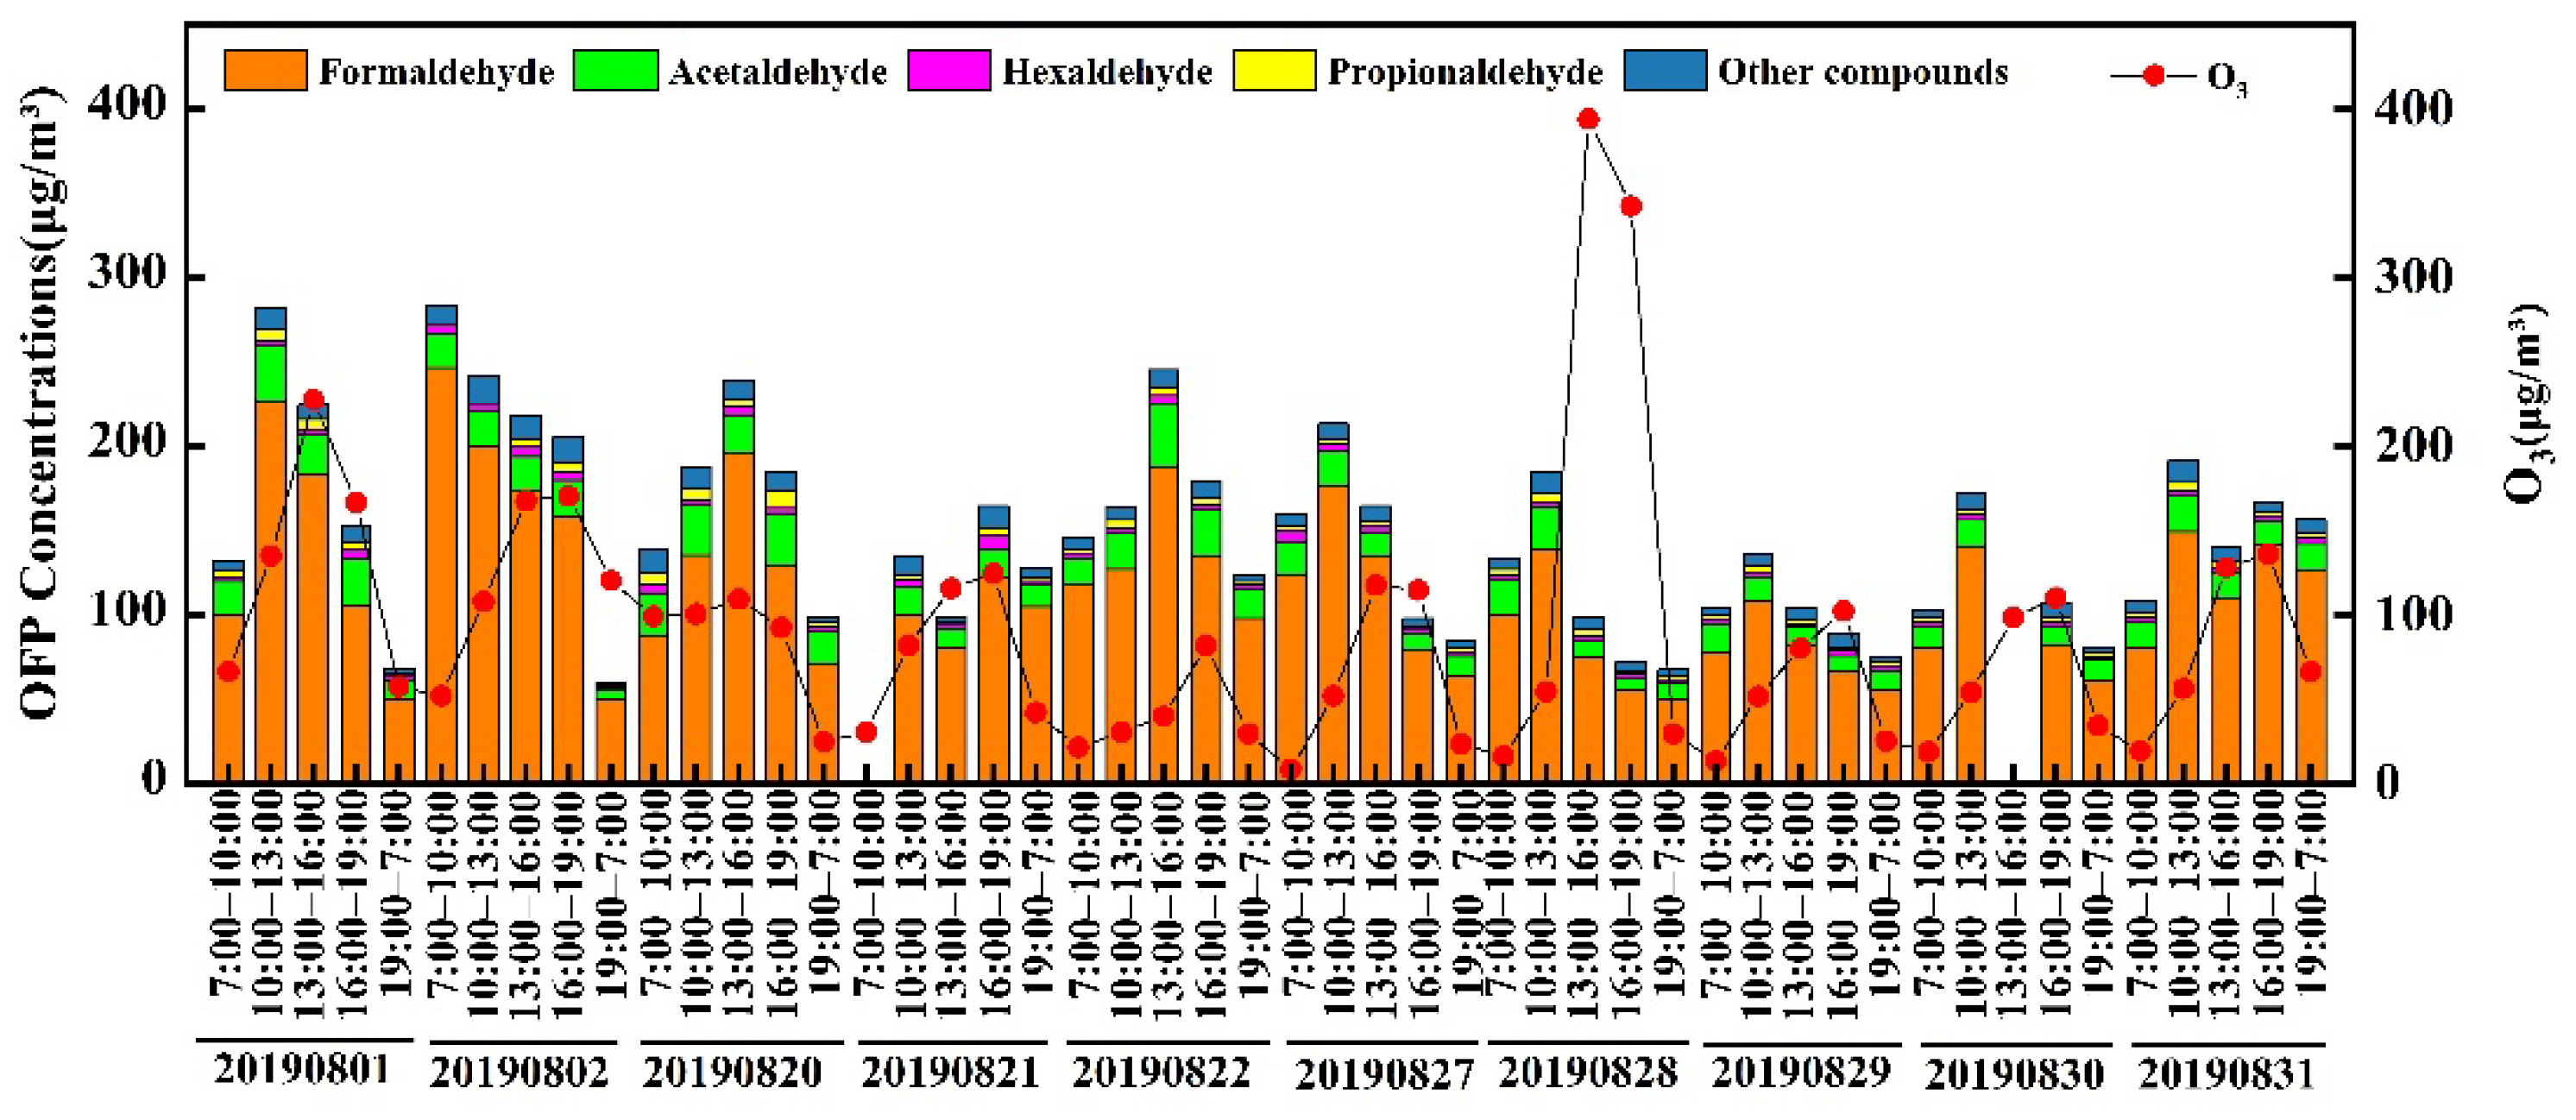
3.4. Ozone Formation Potential

Maximum incremental reactivity (MIR) was applied to evaluate the contributions of individual carbonyls to O3 formation in the photochemical reaction [26]. It is noted that the OFP was calculated by the Carter method [26,27]. This method is based on a model scenario in which carbonyls yield a maximum ozone formation, represented by maximum incremental reactivity (MIR, g O3/g VOCs). The OFP is just used to estimate the maximum potential of different VOC species to the ozone formation under the optimum conditions. Additionally, the reactions that VOCs converted into carbonyls are not considered in this method. Here, ambient concentrations of carbonyls were used to calculate the OFP values of different carbonyl species during the specific time period. The details of the OFP calculation for carbonyls are provided in Appendix A (Table A3). The total OFP of carbonyls ranged from 17.19 to 325.83 μg/m3, with an average of 102.02 ± 52.30 μg/m3. The average OFP was the highest in summer (151.78 ± 62.24 μg/m3), followed by autumn (93.71 ± 37.30 μg/m3), spring (89.00 ± 43.93 μg/m3) and winter (78.58 ± 30.62 μg/m3). Due to the higher ambient concentrations and MIR coefficients, formaldehyde and acetaldehyde were the dominant contributors of the OFP, and their OFPs were 70.92 ± 44.16 μg/m3 and 18.58 ± 7.27 μg/m3, respectively, which accounted for about 70–95% of the total OFP. The OFP of formaldehyde during summer in Taiyuan was similar to that in Guangzhou, while the OFP of acetaldehyde in Taiyuan was only about 30% of that in Guangzhou [12]. Compared with Beijing, the summer OFP of formaldehyde in Taiyuan was about twice that in Beijing, while the OFP of acetaldehyde was about half of that in Beijing [13].
The formation of O3 is influenced by many factors, including ambient temperature, relative humidity and their precursors. Figure 6 presents the OFP of carbonyls and O3 for all samples in summer. The OFP and O3 showed similar variations, although they did not show a significant positive correlation, and the peak value of O3 lagged behind the OFP peak. The OFP values and O3 levels varied diurnally and increased with air temperature and relative humidity (23.53 °C, 59.20%RH), with the peak level at 10:00–13:00. On August 28, the concentrations of O3 increased sharply at 2:00 p.m., and the OFP decreased at the same time. As shown in Figure 2, the prevailing wind direction in Taiyuan was southwest in summer. The air mass from the southwest passed through most of the coal coking areas (Figure A3), and the abundant VOCs from the transported air mass were the direct sources of carbonyl formation and significant precursors of photochemical reactions in the atmosphere. The coal gas released during the coking processes was the main source of VOCs in Taiyuan and the main components of coal gas were alkanes, alkenes and aromatic hydrocarbons [24]. Except for its use for residential and industrial activities, coal gas was also the main material for methanol production. There are several methanol plants distributed in the coal coking areas, and five of them have an annual output exceeding 500,000 tons. Abundant methanol leaks out during production processes, and it can react with the OH radical to form formaldehyde [2]. The levels and sources of methanol in the atmosphere need further research in the future.

4. Conclusions

As the three dominant carbonyls, formaldehyde, acetone and acetaldehyde accounted for more than 85% of the total carbonyls in the atmosphere of Taiyuan. The seasonal variations of total carbonyls were distinct, with the highest level in summer and the lowest level in winter, except for acetaldehyde. Additionally, the diurnal variations suggested that photochemical reactions, coal combustion, vehicle emissions and solvent usage were significant sources of ambient carbonyls. Based on the analysis of the diagnosed ratios and correlation analysis, primary emissions (such as coal combustion, coking and vehicle emissions) might be the main sources of carbonyls in winter, and the photochemical reaction of VOCs was the dominant source of ambient carbonyls in summer, with a partial contribution from primary sources. Carbonyl compounds did not show good correlations with O3 and presented higher levels hours ahead of O3. Given that carbonyl compounds were the precursors of O3, the secondary formation of O3 could lead to a reduction in carbonyl concentrations. The OFPs of carbonyls in summer were significantly higher than those in the other seasons, and formaldehyde and acetaldehyde were two critical contributors. In addition to carbonyls, other unknown VOCs could also contribute to generating O3 in the atmosphere of Taiyuan. The simultaneous measurement of carbonyls and other VOCs (alkanes, alkenes, aromatics, etc.) should be conducted in further study to better understand the contributions of different VOC species to the OFP.

Author Contributions

Conceptualization, Z.L., Y.C. and Q.H.; formal analysis, Z.L. and Y.C.; funding acquisition, Q.H.; investigation, Z.L., L.G. and X.G.; methodology, Z.L., Y.C. and X.G.; supervision, Q.H., L.G. and X.G.; validation, Q.H.; writing—original draft, Z.L., Y.C. and Q.H.; writing—review and editing, Z.L., Y.C., Q.H., Y.F., Y.W. and X.W. All authors have read and agreed to the published version of the manuscript.

Funding

The research was funded by the National Natural Science Foundation of China (42077201, 41728008), Doctoral Scientific Research Foundation of TYUST (20202072).

Institutional Review Board Statement

Not applicable.

Informed Consent Statement

Not applicable.

Data Availability Statement

Not applicable.

Acknowledgments

We are grateful for the support from the Environmental Monitoring Center Station of Taiyuan, the National Natural Science Foundation of China (42077201, 41728008), Doctoral Scientific Research Foundation of TYUST (20202072).

Conflicts of Interest

The authors declare no conflict of interest.

Appendix A

Table A1. Average concentrations of carbonyls in each season in Taiyuan (μg/m3).
AutumnWinterSpringSummerWhole Year
Mean ± SDMean ± SDMean ± SDMean ± SDMean ± SDMDL
Formaldehyde6.66 ± 3.165.28 ± 2.426.50 ± 3.6612.82 ± 5.687.70 ± 4.780.06
Acetaldehyde2.86 ± 1.063.29 ± 1.402.77 ± 1.132.82 ± 1.122.95 ± 1.200.09
Acetone7.10 ± 1.774.07 ± 1.474.57 ± 2.376.68 ± 2.435.57 ± 2.410.07
Acrolein0.18 ± 0.050.24 ± 0.110.35 ± 0.150.30 ± 0.220.23 ± 0.120.13
Propionaldehyde0.49 ± 0.170.55 ± 0.210.47 ± 0.190.53 ± 0.260.51 ± 0.210.14
Crotonaldehyde0.28 ± 0.070.22 ± 0.02NDND0.24 ± 0.060.20
Butanone0.62 ± 0.250.71 ± 0.551.15 ± 0.581.13 ± 0.830.89 ± 0.620.11
Methacrolein0.18 ± 0.060.19 ± 0.08ND0.32 ± 0.140.23 ± 0.120.15
Butyraldehyde0.32 ± 0.150.31 ± 0.130.30 ± 0.170.33 ± 0.170.32 ± 0.150.11
Benzaldehyde0.63 ± 0.230.61 ± 0.400.44 ± 0.300.69 ± 0.450.59 ± 0.360.16
Valeraldehyde0.30 ± 0.080.28 ± 0.070.36 ± 0.140.54 ± 0.250.40 ± 0.200.21
m/p-Tolualdehyde0.73 ± 0.270.47 ± 0.130.41 ± 0.140.67 ± 0.470.64 ± 0.310.32
Hexaldehyde0.84 ± 0.340.50 ± 0.240.67 ± 0.410.84 ± 0.360.71 ± 0.370.16
Total carbonyls20.28 ± 6.3015.59 ± 6.1217.05 ± 7.8826.40 ± 9.7119.67 ± 8.56
Table A2. Meteorological conditions during the sampling periods in Taiyuan.
SeasonSampling PeriodTemperature (°C)Relative Humidity (%)Wind Speed (m/s)
RangeAverageRangeAverageRangeAverage
Autumn2018/10/1–10/114.40–23.1013.9619–7043.170.30–4.201.54
Winter2018/12/9–12/20−9.90–9.90−0.4819–5833.990.70–4.401.62
Spring2019/4/1–4/8, 4/15–4/184–3215.689–9632.150.30–4.901.78
Summer2019/8/1–8/2, 8/20–8/22, 8/27–8/3116.40–32.7023.5322–10059.200.30–3.701.46
Table A3. Average ozone formation potentials of carbonyls in different seasons (μg/m³).
MIR
(gO3/gVOCs)
AutumnWinterSpringSummer
Mean ± SDMean ± SDMean ± SDMean ± SD
Formaldehyde9.2462.51 ± 28.0447.72 ± 20.5460.01 ± 33.83118.48 ± 52.48
Acetaldehyde6.3418.30 ± 6.6720.32 ± 7.8917.56 ± 7.1617.91 ± 7.12
Acetone0.352.44 ± 0.661.41 ± 0.501.60 ± 0.832.34 ± 0.85
Acrolein7.241.25 ± 0.381.73 ± 0.772.50 ± 1.102.18 ± 1.59
Propionaldehyde6.833.40 ± 1.163.54 ± 1.463.20 ± 1.303.46 ± 1.88
Crotonaldehyde9.392.35 ± 1.041.86 ± 0.691.96 ± 0.000.00
Butanone1.180.73 ± 0.300.84 ± 0.651.36 ± 0.681.31 ± 0.99
Methacrolein5.841.05 ± 0.360.98 ± 0.370.001.84 ± 0.80
Butyraldehyde5.751.84 ± 0.871.70 ± 0.731.65 ± 1.001.89 ± 0.96
Benzaldehyde−0.67−0.42 ± 0.16−0.40 ± 0.27−0.30 ± 0.20−0.46 ± 030
Valeraldehyde4.891.41 ± 0.431.34 ± 0.401.76 ± 0.672.64 ± 1.24
m/p-Tolualdehyde−0.59−0.42 ± 0.16−0.27 ± 0.09−0.24 ± 0.09−0.39 ± 0.28
Hexaldehyde4.183.52 ± 1.452.03 ± 1.002.80 ± 1.733.51 ± 1.52
Total carbonyls 93.71 ± 37.3078.58 ± 30.6289.00 ± 43.93151.78 ± 62.24
Figure A1. The concentration ratios of formaldehyde/CO (C1/CO), acetaldehyde/CO (C2/CO) and acetone/CO (C3/CO).
Atmosphere 12 00510 g0a1
Figure A2. Diurnal variations of wind speed and boundary layer height in four seasons.
Atmosphere 12 00510 g0a2
Figure A3. The wind direction weighted carbonyls concentrations in summer.
Atmosphere 12 00510 g0a3

References

  1. Carlier, P.; Hannachi, H.; Mouvier, G. The chemistry of carbonyl compounds in the atmosphere—A review. Atmos. Environ. 1986, 20, 2079–2099. [Google Scholar] [CrossRef]
  2. Atkinson, R. Atmospheric chemistry of VOCs and NOx. Atmos. Environ. 2000, 34, 2063–2101. [Google Scholar] [CrossRef]
  3. Possanzini, M.; Di Palo, V.; Cecinato, A. Sources and photodecomposition of formaldehyde and acetaldehyde in Rome ambient air. Atmos. Environ. 2002, 36, 3195–3201. [Google Scholar] [CrossRef]
  4. NCR. Formaldehyde and Other Aldehydes; National Academy Press: Washington, DC, USA, 1981. [Google Scholar]
  5. CEPA. Acetaldehyde as a Toxic Air Contaminant; Part A: Exposure; Part B: Health Assessment; Air Resources Board, Stationary Source Division: Sacramento, CA, USA, 1993.
  6. WHO. Air Quality Guidelines for Europe; Regional Office for Europe: Copenhagen, Denmark, 1987. [Google Scholar]
  7. Grosjean, E.; Grosjean, D.; Fraser, M.P.; Cass, G.R. Air Quality Model Evaluation Data for Organics. 2. C1−C14 Carbonyls in Los Angeles Air. Environ. Sci. Technol. 1996, 30, 2687–2703. [Google Scholar] [CrossRef] [Green Version]
  8. Possanzini, M.; Di Palo, V.; Petricca, M.; Fratarcangeli, R.; Brocco, D. Measurements of lower carbonyls in Rome ambient air. Atmos. Environ. 1996, 30, 3757–3764. [Google Scholar] [CrossRef]
  9. Jiang, Z.; Grosselin, B.; Daële, V.; Mellouki, A.; Mu, Y. Seasonal, diurnal and nocturnal variations of carbonyl compounds in the semi-urban environment of Orléans, France. J. Environ. Sci. 2016, 40, 84–91. [Google Scholar] [CrossRef]
  10. Renzettj, N.A.; Bryan, R.J. Atmospheric Sampling for Aldehydes and Eye Irritation in Los Angeles Smog—1960. J. Air Pollut. Control Assoc. 1961, 11, 421–427. [Google Scholar] [CrossRef] [PubMed] [Green Version]
  11. Huang, J.; Feng, Y.; Li, J.; Xiong, B.; Feng, J.; Wen, S.; Sheng, G.; Fu, J.; Wu, M. Characteristics of carbonyl compounds in ambient air of Shanghai, China. J. Atmos. Chem. 2008, 61, 1–20. [Google Scholar] [CrossRef]
  12. Lü, H.; Cai, Q.-Y.; Wen, S.; Chi, Y.; Guo, S.; Sheng, G.; Fu, J. Seasonal and diurnal variations of carbonyl compounds in the urban atmosphere of Guangzhou, China. Sci. Total Environ. 2010, 408, 3523–3529. [Google Scholar] [CrossRef]
  13. Huang, X.-F.; Zhang, B.; Xia, S.-Y.; Han, Y.; Wang, C.; Yu, G.-H.; Feng, N. Sources of oxygenated volatile organic compounds (OVOCs) in urban atmospheres in North and South China. Environ. Pollut. 2020, 261, 114152. [Google Scholar] [CrossRef]
  14. Cui, J.; Sun, M.; Wang, L.; Guo, J.; Xie, G.; Zhang, J.; Zhang, R. Gas-particle partitioning of carbonyls and its influencing factors in the urban atmosphere of Zhengzhou, China. Sci. Total Environ. 2021, 751, 142027. [Google Scholar] [CrossRef] [PubMed]
  15. Guo, S.; Chen, M.; Tan, J. Seasonal and diurnal characteristics of atmospheric carbonyls in Nanning, China. Atmos. Res. 2016, 169, 46–53. [Google Scholar] [CrossRef]
  16. Yang, Z.; Cheng, H.; Wang, Z.; Peng, J.; Zhu, J.; Lyu, X.; Guo, H. Chemical characteristics of atmospheric carbonyl compounds and source identification of formaldehyde in Wuhan, Central China. Atmos. Res. 2019, 228, 95–106. [Google Scholar] [CrossRef]
  17. Qian, X.; Shen, H.; Chen, Z. Characterizing summer and winter carbonyl compounds in Beijing atmosphere. Atmos. Environ. 2019, 214, 116845. [Google Scholar] [CrossRef]
  18. Wang, C.; Huang, X.-F.; Han, Y.; Zhu, B.; He, L.-Y. Sources and Potential Photochemical Roles of Formaldehyde in an Urban Atmosphere in South China. J. Geophys. Res. Atmos. 2017, 122, 11934–11947. [Google Scholar] [CrossRef]
  19. Pang, X.; Mu, Y.; Lee, X.; Zhang, Y.; Xu, Z. Influences of characteristic meteorological conditions on atmospheric carbonyls in Beijing, China. Atmos. Res. 2009, 93, 913–919. [Google Scholar] [CrossRef]
  20. Duan, J.; Guo, S.; Tan, J.; Wang, S.; Chai, F. Characteristics of atmospheric carbonyls during haze days in Beijing, China. Atmos. Res. 2012, 114–115, 17–27. [Google Scholar] [CrossRef]
  21. Li, H.; Guo, L.; Cao, R.; Gao, B.; Yan, Y.; He, Q. A wintertime study of PM2.5-bound polycyclic aromatic hydrocarbons in Taiyuan during 2009–2013: Assessment of pollution control strategy in a typical basin region. Atmos. Environ. 2016, 140, 404–414. [Google Scholar] [CrossRef]
  22. He, Q.; Yan, Y.; Guo, L.; Zhang, Y.; Zhang, G.; Wang, X. Characterization and source analysis of water-soluble inorganic ionic species in PM2.5 in Taiyuan city, China. Atmos. Res. 2017, 184, 48–55. [Google Scholar] [CrossRef]
  23. TEEB. Bulletin of Environmental Status in Taiyuan City 2016–2020. Available online: http://hbj.taiyuan.gov.cn (accessed on 30 September 2020).
  24. Li, J.; Li, H.; He, Q.; Guo, L.; Zhang, H.; Yang, G.; Wang, Y.; Chai, F. Characteristics, sources and regional inter-transport of ambient volatile organic compounds in a city located downwind of several large coke production bases in China. Atmos. Environ. 2020, 233, 117573. [Google Scholar] [CrossRef]
  25. Feng, Y.; Wen, S.; Chen, Y.; Wang, X.; Lü, H.; Bi, X.; Sheng, G.; Fu, J. Ambient levels of carbonyl compounds and their sources in Guangzhou, China. Atmos. Environ. 2005, 39, 1789–1800. [Google Scholar] [CrossRef]
  26. Carter, W.P.L. Development of Ozone Reactivity Scales for Volatile Organic Compounds. Air Waste 1994, 44, 881–899. [Google Scholar] [CrossRef] [Green Version]
  27. Carter, W. Updated maximum incremental reactivity scale and hydrocarbon bin reactivities for regulatory applications. Calif. Air Resour. Board Contract 2010, 1, 307–339. [Google Scholar]
  28. Ho, K.F.; Ho, S.S.H.; Dai, W.T.; Cao, J.J.; Huang, R.-J.; Tian, L.; Deng, W.J. Seasonal variations of monocarbonyl and dicarbonyl in urban and sub-urban sites of Xi’an, China. Environ. Monit. Assess. 2014, 186, 2835–2849. [Google Scholar] [CrossRef]
  29. Li, F.; Wang, H.; Wang, X.; Xue, Z.; Duan, L.; Kou, Y.; Zhang, Y.; Chen, X. Pollution Characteristics of Atmospheric Carbonyls in Urban Linfen in Winter. Atmosphere 2020, 11, 685. [Google Scholar] [CrossRef]
  30. CWarneke, W.; de Gouw, J.A.; Holloway, J.S.; Peischl, J.; Ryerson, T.B.; Atlas, E.; Blake, D.; Trainer, M.; Parrish, D.D. Multiyear trends in volatile organic compounds in Los Angeles, California: Five decades of decreasing emissions. J. Geophys. Res. 2012. [Google Scholar] [CrossRef]
  31. Yang, X.; Xue, L.; Wang, T.; Wang, X.; Gao, J.; Lee, S.; Blake, D.R.; Chai, F.; Wang, W. Observations and Explicit Modeling of Summertime Carbonyl Formation in Beijing: Identification of Key Precursor Species and Their Impact on Atmospheric Oxidation Chemistry. J. Geophys. Res. Atmos. 2018, 123, 1426–1440. [Google Scholar] [CrossRef] [Green Version]
  32. Taiyuan Municipal Bureau of Statistics (TMBS). Taiyuan Statistical Yearbook of 2020. 2020. Available online: https://www.yearbookchina.com/ (accessed on 13 April 2020).
  33. Feng, Y.; Wen, S.; Wang, X.; Sheng, G.; He, Q.; Tang, J.; Fu, J. Indoor and outdoor carbonyl compounds in the hotel ballrooms in Guangzhou, China. Atmos. Environ. 2004, 38, 103–112. [Google Scholar] [CrossRef]
  34. Biesenthal, T.A.; Shepson, P.B. Observations of anthropogenic inputs of the isoprene oxidation products methyl vinyl ketone and methacrolein to the atmosphere. Geophys. Res. Lett. 1997, 24, 1375–1378. [Google Scholar] [CrossRef]
  35. Jiang, Z.; Zheng, X.; Zhai, H.; Wang, Y.; Wang, Q.; Yang, Z. Seasonal and diurnal characteristics of carbonyls in the urban atmosphere of Changsha, a mountainous city in south-central China. Environ. Pollut. 2019, 253, 259–267. [Google Scholar] [CrossRef]
  36. Pang, X.; Lee, X. Temporal variations of atmospheric carbonyls in urban ambient air and street canyons of a Mountainous city in Southwest China. Atmos. Environ. 2010, 44, 2098–2106. [Google Scholar] [CrossRef]
  37. Shepson, P.; Hastie, D.; Schiff, H.; Polizzi, M.; Bottenheim, J.; Anlauf, K.; Mackay, G.; Karecki, D. Atmospheric concentrations and temporal variations of C1▯C3 carbonyl compounds at two rural sites in central Ontario. Atmos. Environ. Part A Gen. Top. 1991, 25, 2001–2015. [Google Scholar] [CrossRef] [Green Version]
  38. Guo, S.; Wen, S.; Wang, X.; Sheng, G.; Fu, J.; Hu, P.; Yu, Y. Carbon isotope analysis for source identification of atmospheric formaldehyde and acetaldehyde in Dinghushan Biosphere Reserve in South China. Atmos. Environ. 2009, 43, 3489–3495. [Google Scholar] [CrossRef]
  39. Duane, M.; Poma, B.; Rembges, D.; Astorga, C.; Larsen, B. Isoprene and its degradation products as strong ozone precursors in Insubria, Northern Italy. Atmos. Environ. 2002, 36, 3867–3879. [Google Scholar] [CrossRef]
  40. Ji, Y.; Gao, Y.; Li, G.; An, T. Theoretical study of the reaction mechanism and kinetics of low-molecular-weight atmospheric aldehydes (C1–C4) with NO2. Atmos. Environ. 2012, 54, 288–295. [Google Scholar] [CrossRef]
  41. Moussa, S.G.; El-Fadel, M.; Saliba, N.A. Seasonal, diurnal and nocturnal behaviors of lower carbonyl compounds in the urban environment of Beirut, Lebanon. Atmos. Environ. 2006, 40, 2459–2468. [Google Scholar] [CrossRef]
  42. Zhang, Z.; Cui, Y.; He, Q.; Guo, L.; Tian, X.; Zhang, K.; Wang, X. Predominant effects of emission reduction by recording 8-year water-soluble ions in precipitation in Taiyuan, North China. Atmos. Pollut. Res. 2020, 11, 1922–1932. [Google Scholar] [CrossRef]
  43. Liu, H.; Wu, B.; Liu, S.; Shao, P.; Liu, X.; Zhu, C.; Wang, Y.; Wu, Y.; Xue, Y.; Gao, J.; et al. A regional high-resolution emission inventory of primary air pollutants in 2012 for Beijing and the surrounding five provinces of North China. Atmos. Environ. 2018, 181, 20–33. [Google Scholar] [CrossRef]
  44. Yuan, B.; Shao, M.; De Gouw, J.; Parrish, D.D.; Lu, S.; Wang, M.; Zeng, L.; Zhang, Q.; Song, Y.; Zhang, J.; et al. Volatile organic compounds (VOCs) in urban air: How chemistry affects the interpretation of positive matrix factorization (PMF) analysis. J. Geophys. Res. Space Phys. 2012, 117, 24302. [Google Scholar] [CrossRef]
Figure 1. The location of sampling site in Taiyuan and distribution of coking areas in Shanxi province.
Atmosphere 12 00510 g001
Figure 2. Seasonal variations of formaldehyde, acetaldehyde, acetone and MACR×20 in Taiyuan.
Atmosphere 12 00510 g002
Figure 3. Wind rose plots for four seasons.
Atmosphere 12 00510 g003
Figure 4. Diurnal variations of formaldehyde, acetaldehyde and acetone in the four seasons.
Atmosphere 12 00510 g004
Figure 5. Correlation coefficients in Taiyuan in spring (a), summer (b), autumn (c) and winter (d) (formaldehyde: C1, acetaldehyde: C2, acetone: C3, T: temperature).
Atmosphere 12 00510 g005
Figure 6. Time series of ozone formation potential (OFP) of carbonyls during the sampling period in summer.
Atmosphere 12 00510 g006
Table 1. Comparison of atmospheric formaldehyde, acetaldehyde, acetone and total carbonyls in Taiyuan and other cities in the world (μg/m3).
LocationSampling PeriodsFormaldehydeAcetaldehydeAcetoneTotalReferences
TaiyuanWhole year7.70 ± 4.782.95 ± 1.205.57 ± 2.4119.67 ± 8.56This study
Linfen2019.014.59 ± 2.644.47 ± 2.223.24 ± 1.8216.90 ± 7.65[29]
Beijing2018.088.49 ± 2.112.97 ± 0.796.72 ± 1.5821.05 ± 4.9[17]
2017.113.18 ± 2.402.50 ± 2.062.57 ± 1.629.56 ± 6.63
Xi’an2010.013.64 ± 1.403.45 ± 1.505.15 ± 2.9514.24 ± 6.83[28]
2010.074.62 ± 1.432.07 ± 0.720.69 ± 0.429.16 ± 3.67
Zhengzhou2019.014.874.133.8013.89[14]
2019.078.345.034.9920.03
Wuhan2017.02–116.574.637.4620.80[16]
Shanghai2007.01–1019.4015.911.8662.70[11]
Nanning2011.10–2012.076.79 ± 3.3915.81 ± 10.485.43 ± 6.9133.21 ± 15.12[15]
Guangzhou2005.01–117.497.6711.9543.55[12]
Los Angeles, USA2008–20107.947.4124.63/[30]
Rome, Italy1994.07–1995.0118.7315.0214.48/[8]
Blank means data were not available in the relative references.
Table 2. C1/C2 and C2/C3 ratios during the sampling periods in Taiyuan.
PeriodC1/C2C2/C3Reference
TaiyuanSpring2.39 6.03 This study
Summer4.68 5.63
Autumn2.34 5.91
Winter1.68 6.34
WuhanSummer4.3310.28[16]
Winter1.152.65
BeirutSummer2.302.00[41]
NanningSummer0.7524.49[15]
Winter0.4018.23
GuangzhouSummer1.325.90[12]
Winter1.047.70
BeijingSummer2.696.29[20]
Xi’anSummer2.32/[28]
Winter1.10/
Publisher’s Note: MDPI stays neutral with regard to jurisdictional claims in published maps and institutional affiliations.

