Article

Particle Size Analysis of African Dust Haze over the Last 20 Years: A Focus on the Extreme Event of June 2020

by
Lovely Euphrasie-Clotilde
1,
Thomas Plocoste
1,2,* and
France-Nor Brute
2
1
Department of Research in Geoscience, KaruSphère SASU, 97139 Abymes, Guadeloupe (F.W.I.), France
2
LaRGE Laboratoire de Recherche en Géosciences et Energies (EA 4539), Univ Antilles, 97100 Pointe-à-Pitre, France
*
Author to whom correspondence should be addressed.
Atmosphere 2021, 12(4), 502; https://doi.org/10.3390/atmos12040502
Submission received: 5 March 2021 / Revised: 2 April 2021 / Accepted: 9 April 2021 / Published: 15 April 2021
(This article belongs to the Special Issue Air Pollution Estimation)

Abstract

:
Over the last decades, the impact of mineral dust from African deserts on human health and climate has been of great interest to the scientific community. In this paper, the climatological analysis of dusty events of the past 20 years in the Caribbean area has been performed using a particulate approach. The focus is made on June 2020 extreme event dubbed “Godzilla”. To carry out this study, different types of data were used (ground-based, satellites, model, and soundings) on several sites in the Caribbean islands. First, the magnitude of June 2020 event was clearly highlighted using satellite imagery. During the peak of this event, the value of particulate matter with an aerodynamic diameter of less than 10 μ m ( P M 10 ) reached a value 9 times greater than the threshold recommended by the World Health Organization in one day. Thereafter, the P M 10 , the aerosol optical depth, and the volume particle size distribution analyses exhibited their maximum values for June 2020. We also highlighted the exceptional characteristics of the Saharan air layer in terms of thickness and wind speed for this period. Finally, our results showed that the more the proportion of particulate matter with an aerodynamic diameter of less than 2.5 μ m ( P M 2.5 ) in P M 10 increases, the more the influence of sea salt aerosols is significant.

1. Introduction

In the literature, it is well known that Africa is the world’s largest source of mineral dust [1,2]. Every year, millions of tons of mineral dust are transported from the African continent towards the Atlantic ocean in the Saharan Air Layer (SAL), i.e., dry and stable air masses confined between two inversion layers at an altitude of 1 to 5 km [3,4].
Dust particles play a significant role in the air quality and climate system [5,6]. Indeed, many epidemiological studies have already demonstrated their harmful effects on health. Respiratory and cardiovascular diseases are the most cited [5,7,8,9,10]. Recently, Domínguez-Rodríguez et al. [11] showed that an inhalation of desert dust may result in a 2% increase in cardiovascular mortality risk. Regarding the climate, dust particles influence Earth’s radiation budget directly by scattering, absorbing, and re-emitting radiation, and indirectly by impacting the atmospheric dynamics [12,13,14,15]. Recent research highlighted that African dust influences air temperature behavior in the atmospheric boundary layer [16,17]. Furthermore, dust particles may also inhibit the development of tropical cyclones [18,19].
In boreal summer, the Caribbean basin is frequently impacted by African dust outbreaks [20,21,22]. During this period, there is a continuous alternation between African Easterly Waves (AEWs) and dust plumes [23,24]. Recently, in June 2020, an extremely intense dust plume dubbed “Godzilla”, which reached the Atlantic ocean [11,25,26], aroused the attention of the scientific community. This event is the biggest dust storm in half a century [26]. The dust plume was so large that it covered the Caribbean Sea and darkened the skies in several states of the United States [11]. Thus, it is crucial to study the characteristics of this event in order to better understand its impact on the Caribbean basin.
In this work, the granulometric distribution of the dusty events that have occurred over the last 20 years in the Caribbean islands of Puerto Rico (PR), Guadeloupe (GPE), and Barbados (BAR) (see Figure 1) was studied and compared to the extreme event of June 2020. To carry out this study, different types of data were used (ground-based, satellites, model, and soundings) on several sites in order to describe the dust events in terms of seasonality, intensity, frequency, and particle size behavior. All these measures are complementary to each other and essential to fully analyze the magnitude of an event.
The remainder of this paper is organized as follows. Section 2 describes the databases used and the applied methods. Section 3 presents the achieved results and discuss them. Finally, a conclusion and an outlook for future studies are given in Section 4.

2. Material and Method

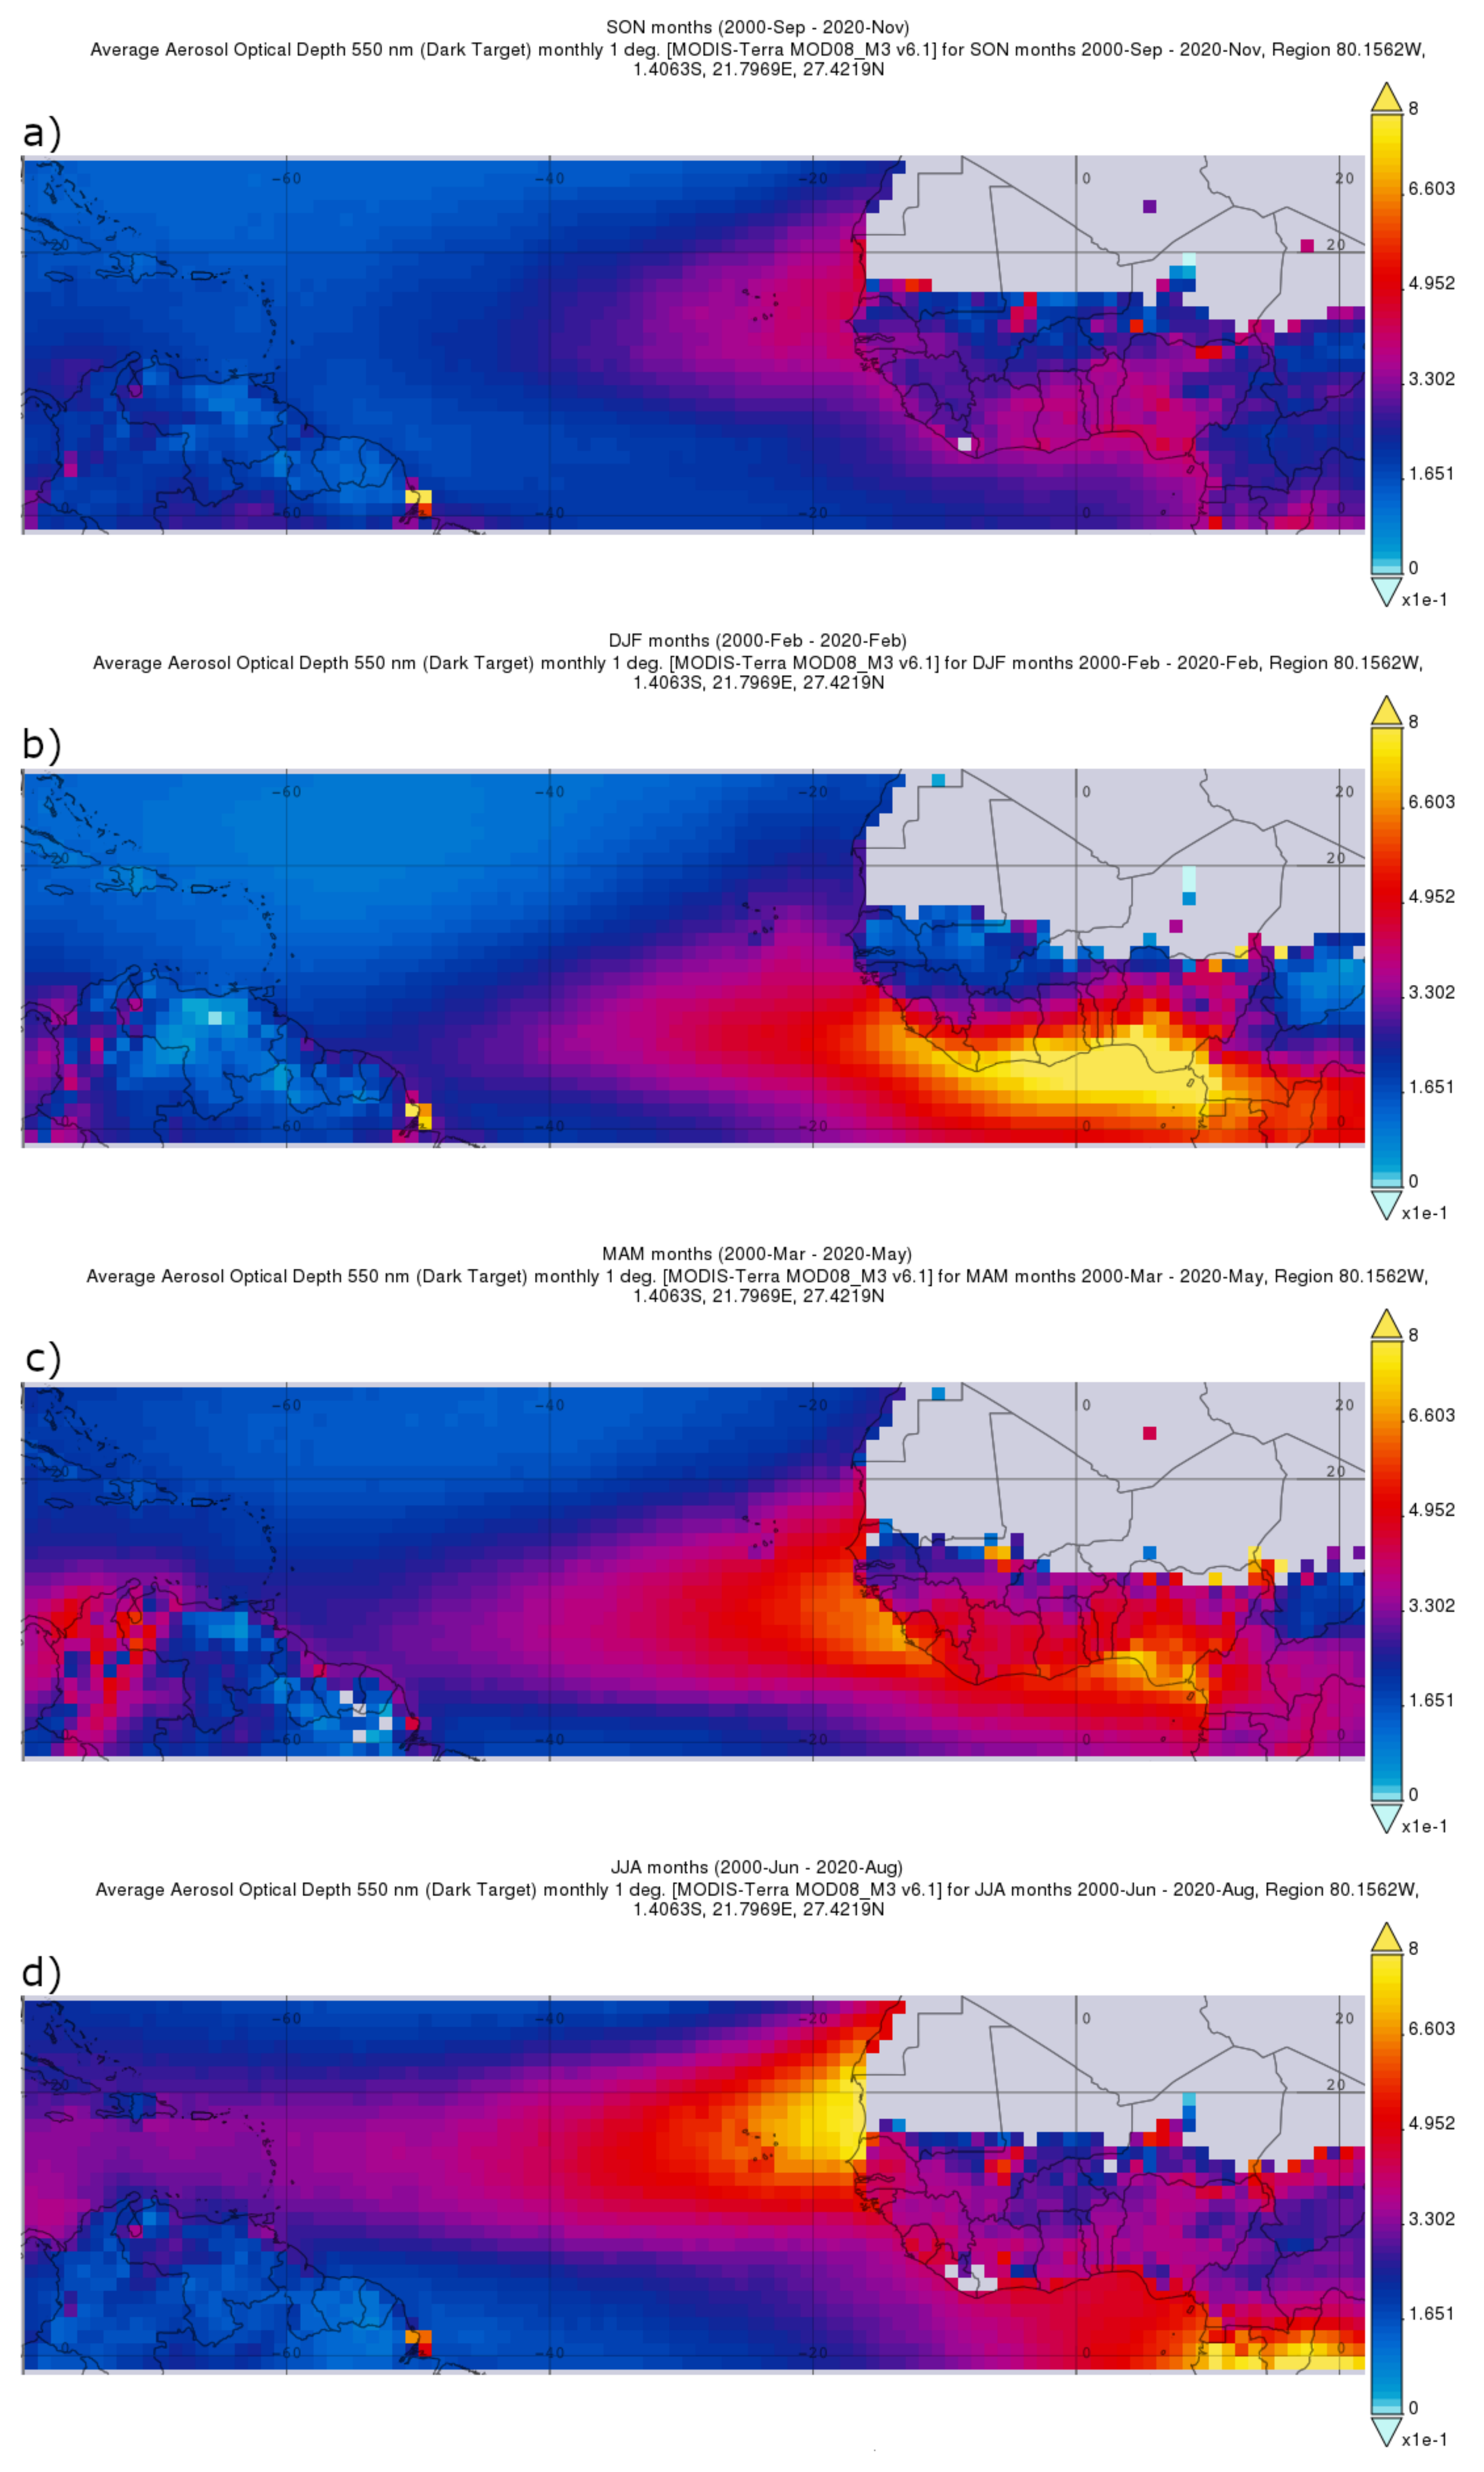
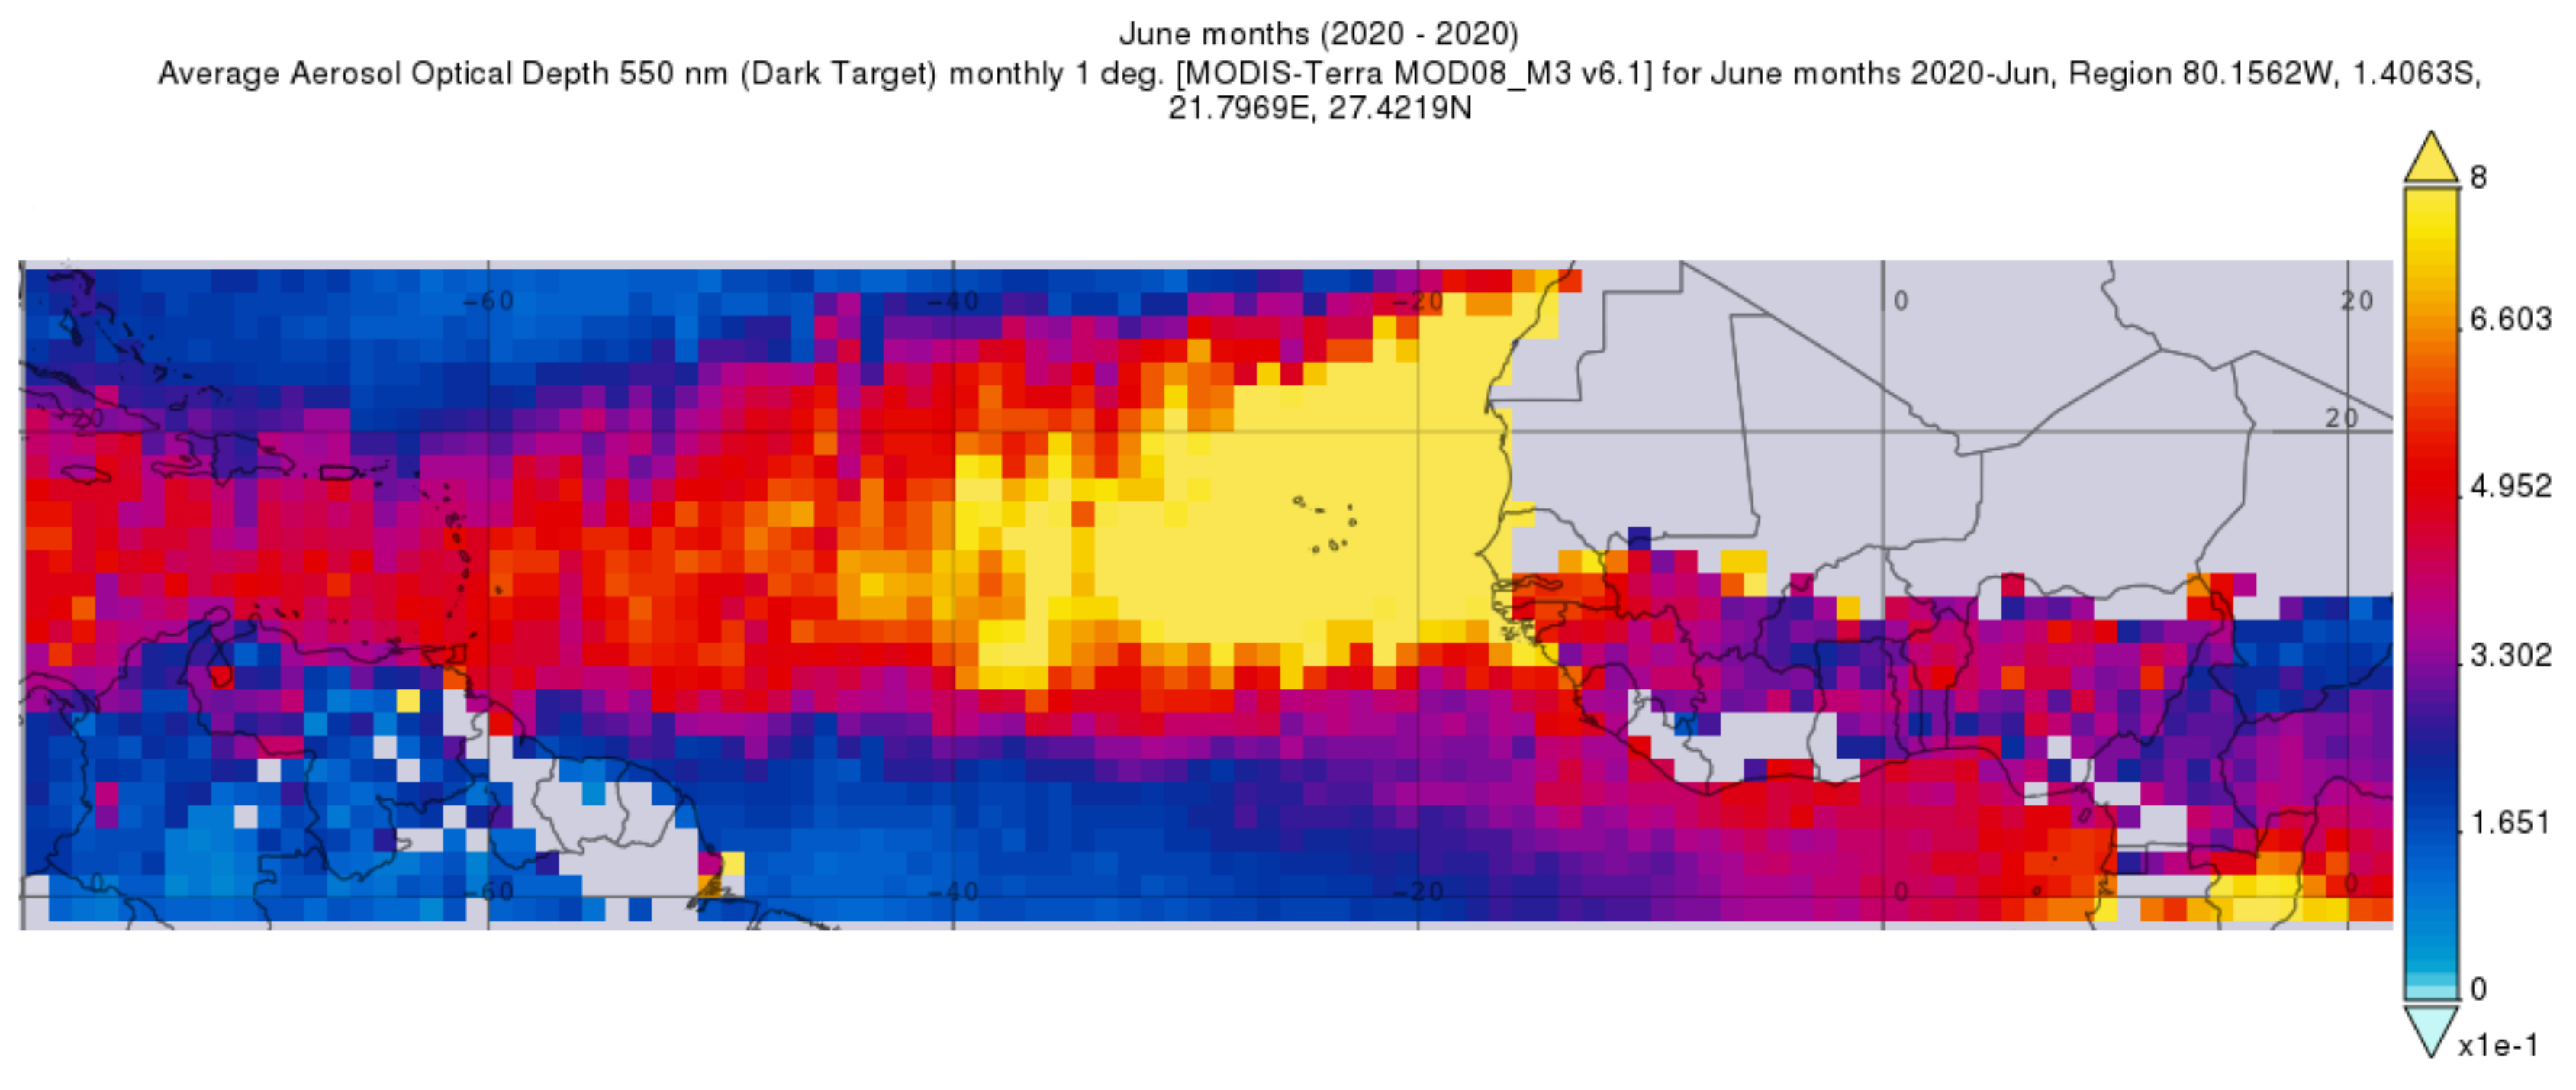
2.1. Satellites Images

Our analysis begins with a seasonal satellite overview of Aerosols Optical Depth (AOD) over the tropical North Atlantic. For this purpose, there is a wealth of product data derived from MODIS observations used to describe the characteristics of land, oceans, and atmosphere for local and global scales. In order to observe the seasonal behavior of mineral aerosols transported from African coast to the Caribbean basin, the AOD “Dark Target algorithm” satellite image processing is selected to improve AOD detection from MODIS on earth [27]: (i) spectral band at 550 nm, (ii) satellite mode Terra, and (iii) spatial resolution at 1°. Thus, the AOD monthly mean is computed from the daily averaged data. The AOD images have been generated for the monthly periods from 2000 to 2020 (data available on the GIOVANNI (NASA) website: https://giovanni.gsfc.nasa.gov/giovanni/ (accessed on 20 January 2021).

2.2. Optical Data

The particle size distribution is studied using optical data reflecting the state of the atmospheric column. Caribbean (PR, GPE, and BAR) and African (Capo Verde and Dakar) sites are equipped with CIMEL sun photometer model CE-318-1 and supplied AOD measurements (stored as 15 min averages) in wavelengths of 1020-870-675-440-936-500-340-380 nm [28]. Sun photometer radiance measurements can be inverted to determine aerosol optical properties. This study is based on AERONET data at wavelength 440 nm:
  • AOD: measure of the extinction of the solar beam by particles in the atmosphere.
  • Ångström Exponent (AE) (440–870 nm): basically, referring to the particle size: the smaller the particle, the larger the value.
  • The Volume Particle Size Distribution (VPSD), corresponding to the daily concentration [ d V ( r ) / d l n ( r ) ( μ m 3 μ m 2 ) ] retrieved for 22 logarithmically equidistant radius (r) in the range of sizes 0.05 r 15 μ m. VPSD is an inversion product derivative of direct and diffuse radiation measurements [29,30].
To analyze the most data possible, only measurements at 1.5 quality level (cloud free) are selected. Table 1 presents the number of daily data used for this study. The uncertainty on data provided by AERONET is ± 0.01 for optical thickness measurements [31].

2.3. PM10 and PM2.5 Data

The surface concentration of particulate matter with an aerodynamic diameter of less than 10 and 2.5 μ m, typically termed P M 10 and P M 2.5 , respectively, is measured by the Thermo-scientific Tapered Element Oscillating Microbalance (TEOM) particle monitors 1400ab and 1400-FDMS (Filter Dynamics Measurement System). French territories (GPE) and the United States (PR) use the same instrument. Continuous measurement of P M 10 and P M 2.5 is reported to 15 min averages, the latter being used to compute hourly and then daily data. The measurement accuracy is ± 1.5 μ g / m 3 for 1 h and ± 0.5 μ g / m 3 for 24 h. The reliability of the measurements carried out in GPE is controlled by the Central Air Quality Monitoring Laboratory (LCSQA), and The Environmental Protection Agency (EPA) is in charge of controlling data from PR. Data from P M 10 and P M 2.5 are used to quantify air quality level, while characterizing the spatial and temporal dimension of natural or anthropogenic pollution events. Regarding BAR, surface dust concentration measurements are collected on a ground base. These data, not used in our work, are comparable to P M 10 [24]. Table 2 presents the P M database considered for this study.
A recent study demonstrated the consistency of data from several sites in the Caribbean area [21]. Indeed, dust events deteriorate air quality of the islands in the same way. Here, data from PR have been selected due to the regularity and completeness of P M 10 and P M 2.5 database between 2000 and 2020.

2.4. Visibility Data

Classically, visibility is defined as the greatest horizontal distance at which a black object of suitable dimensions and located near the ground can be seen and recognized when observed against a background scattering of hydrometeors (rain, snow, fog, and mist) or lithometeors (dust processes) [32]. In order to quantify the impact of the extreme event of June 2020 on visibility, data from the Meteorological Office of GPE (Météo France) are used. This measurement is made on the international airport of Pôle Caraïbes at Abymes ( 16.263 ° N, 61.515 ° E). Measured at hourly basis, these data are converted into daily data.

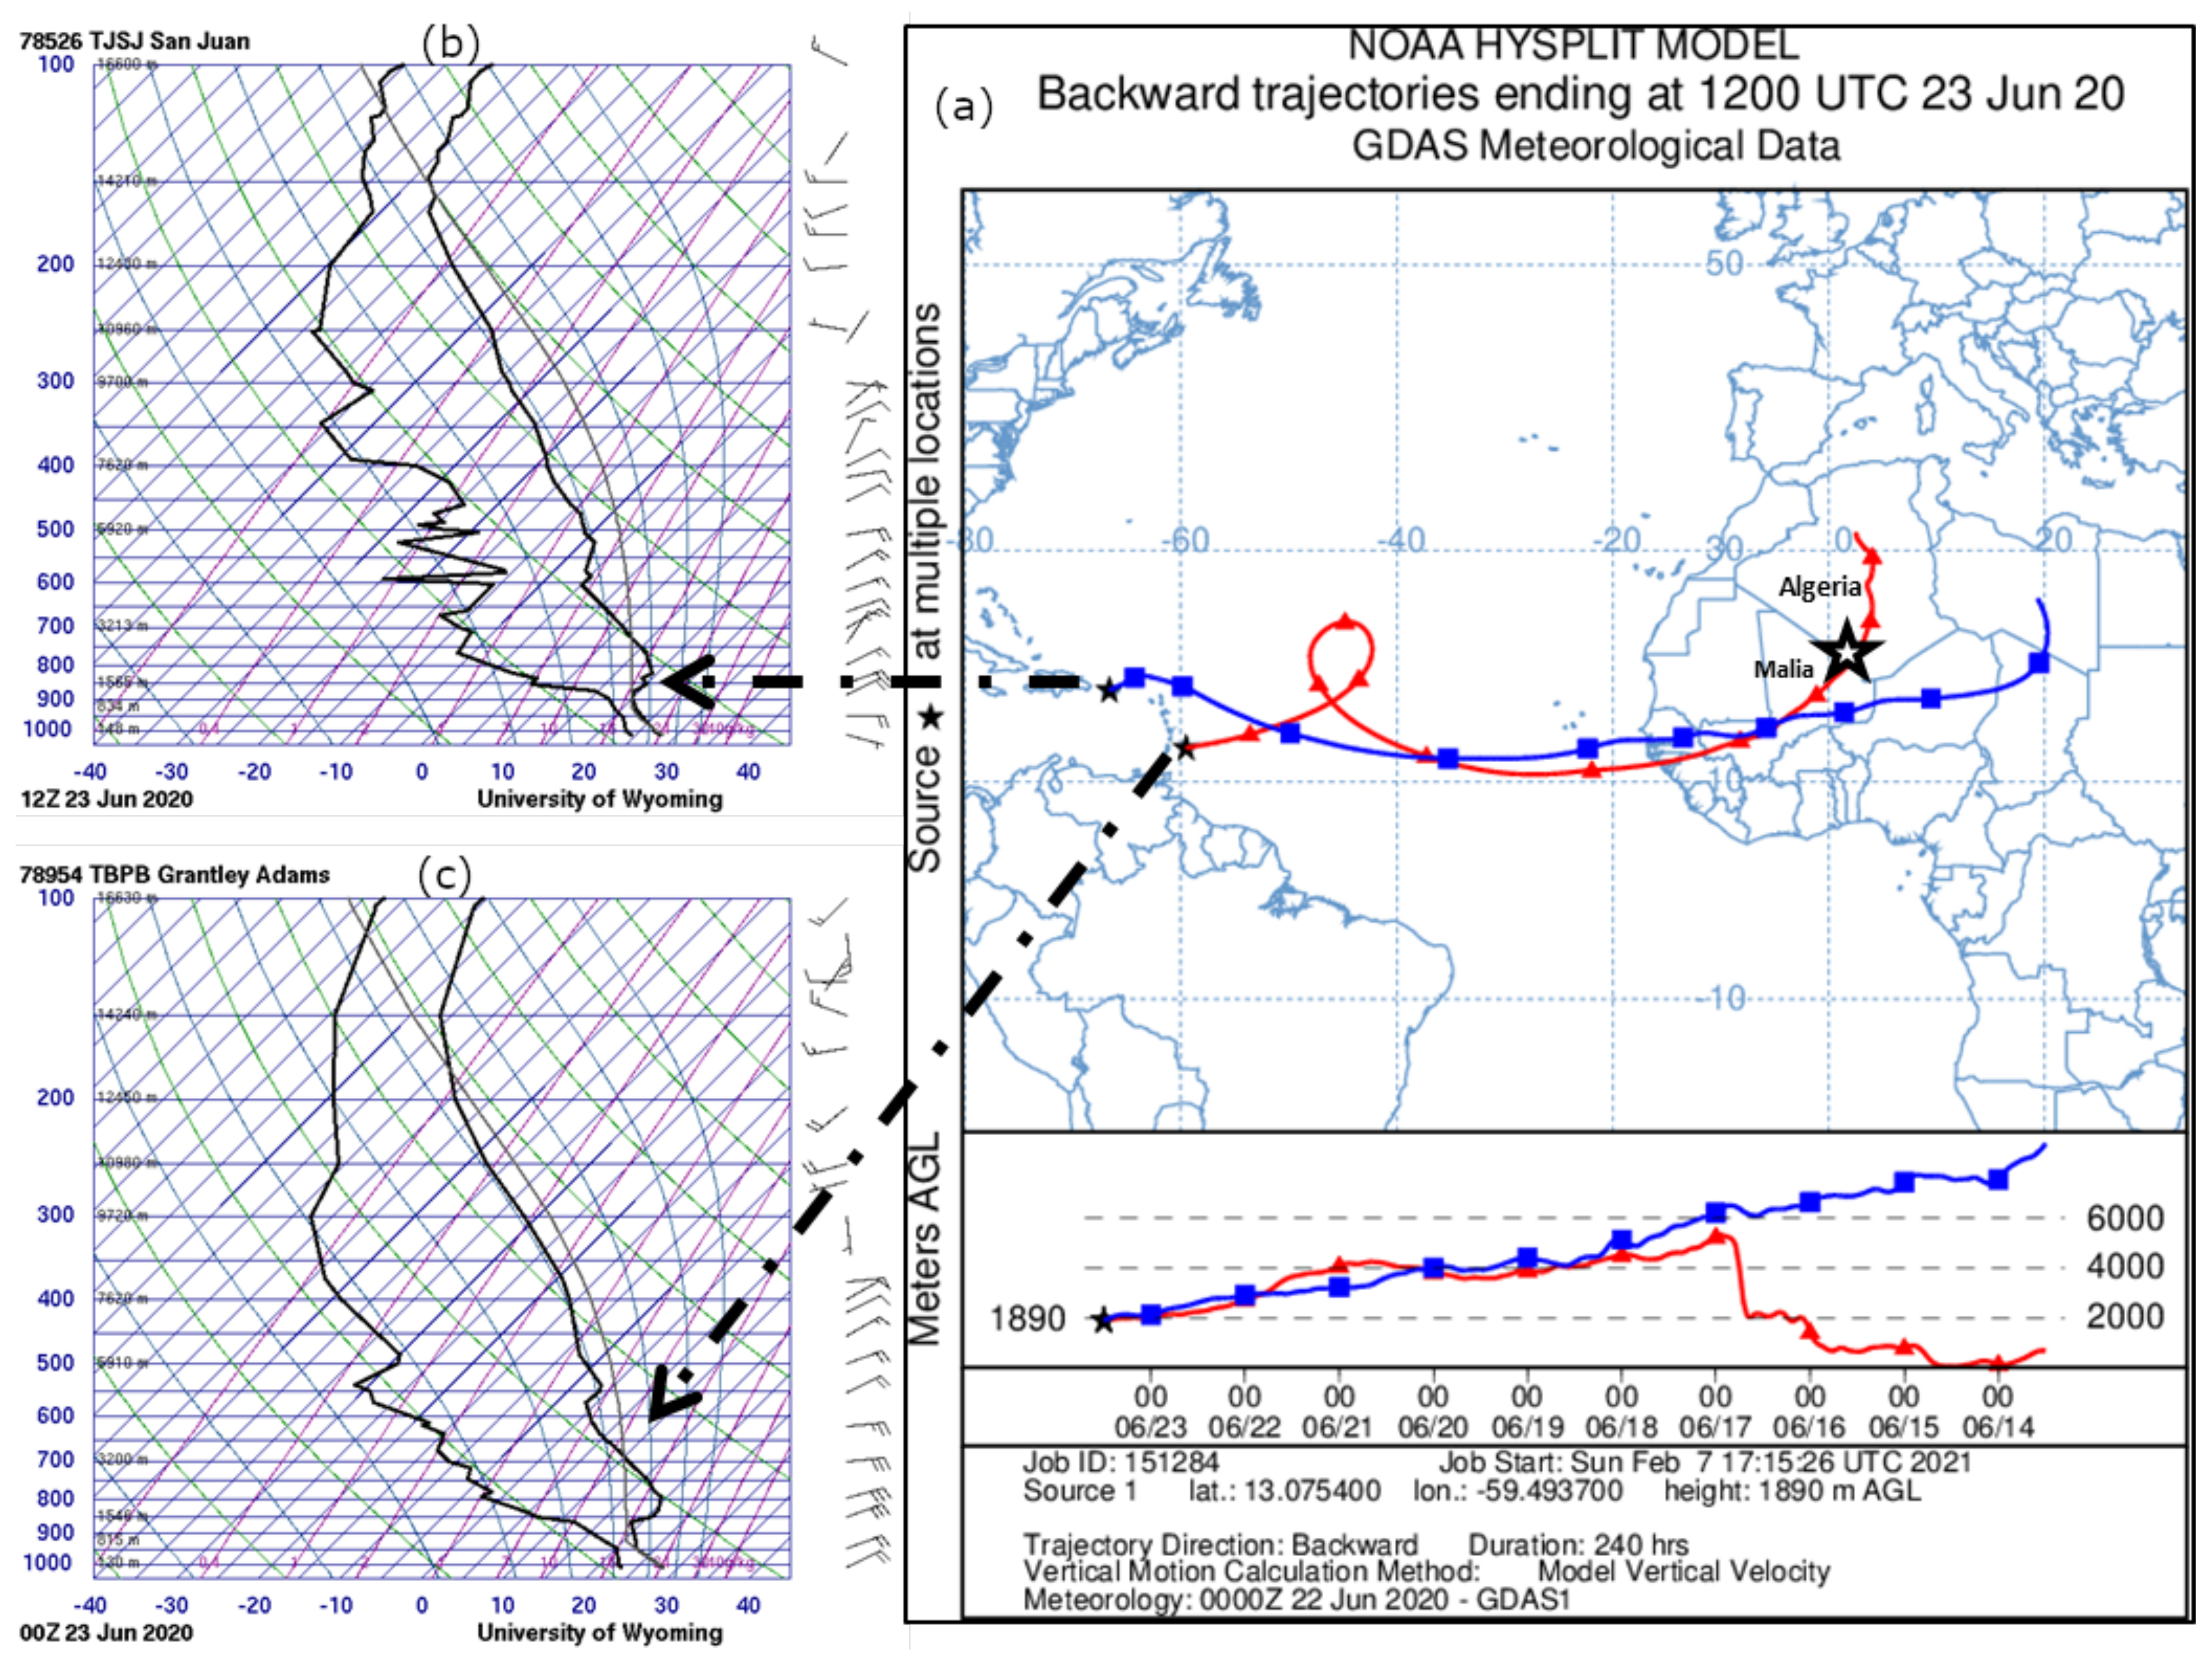
2.5. Back Trajectories

The Hybrid Single Particle Lagrangian Integrated Trajectory (HYSPLIT) version 4 (PC Windows-based HYSPLIT, Unregistered Version Download) [33,34] has been used to determine the origin of dusty air masses, analogously to studies carried out in Europe and the Caribbean [35,36,37,38]. Kalnay et al. [39] explained the Meteorological database used as input for HYSPLIT:
  • Considering the characteristics of SAL, the altitude of 1890 m.
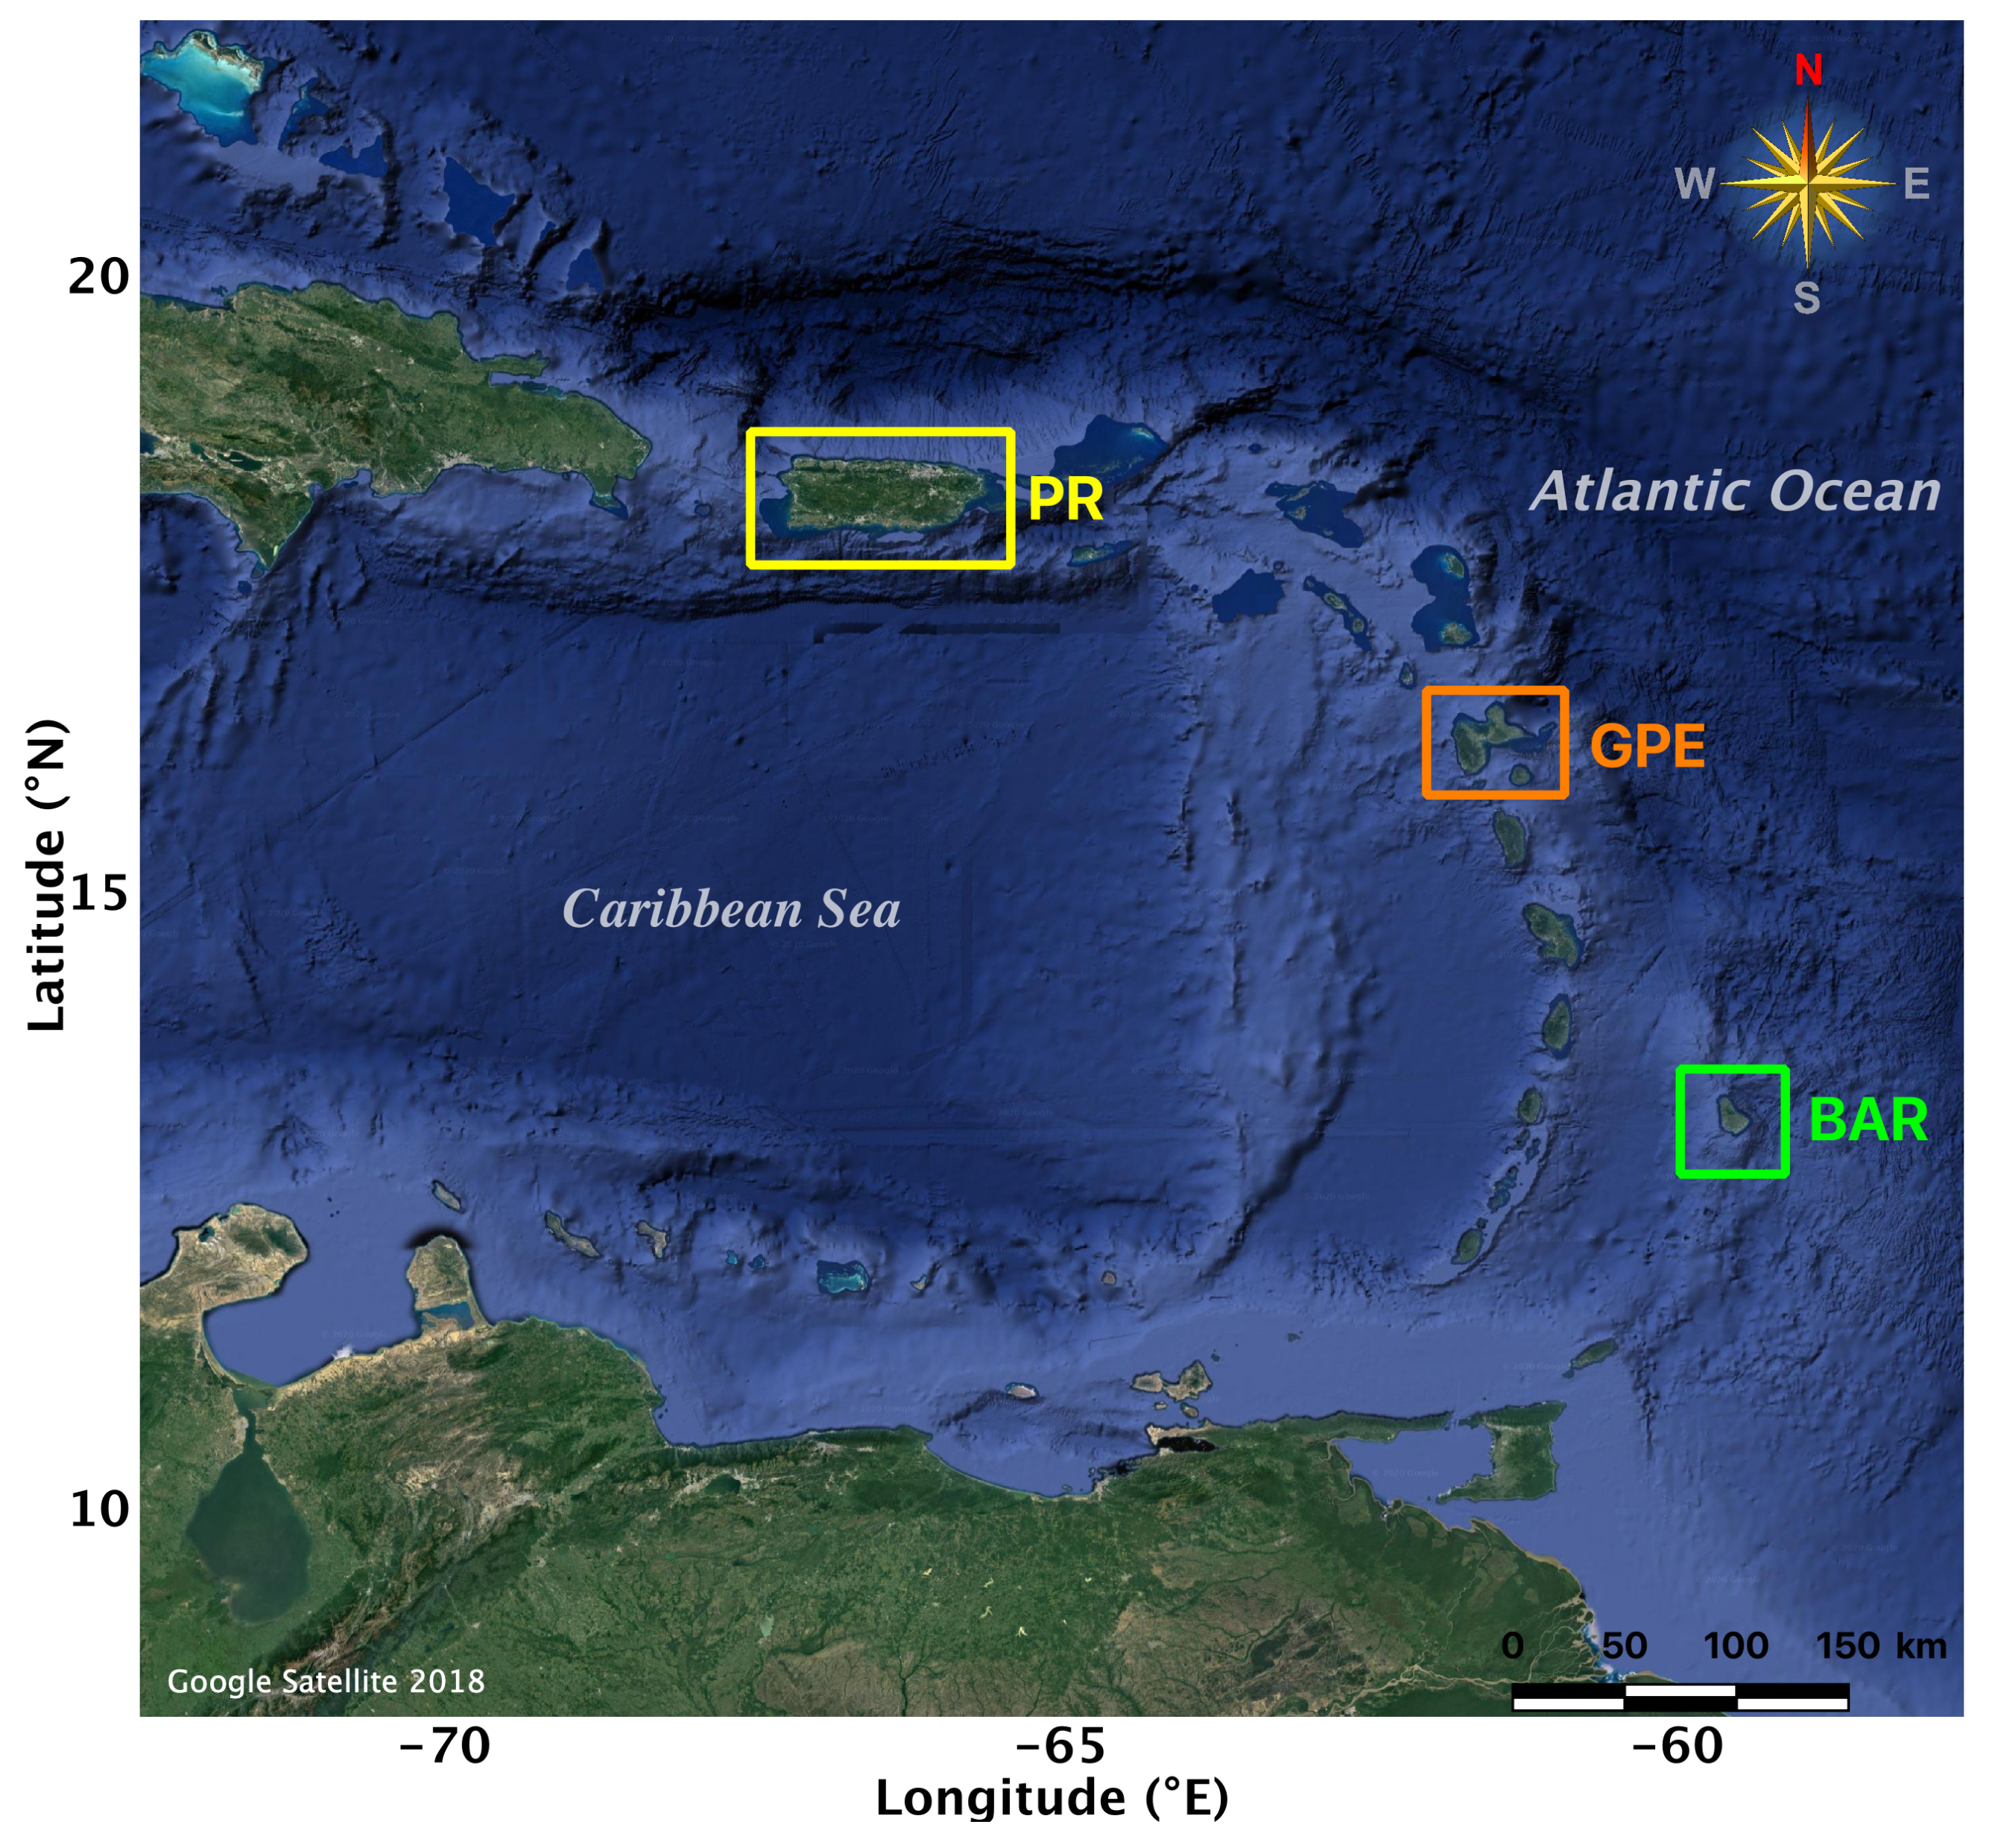
  • The starting locations are PR (18.43 ° N; −66.14 ° E) and BAR (13.08 ° N; −59.50 ° E).
  • At the time 12 UTC (8 a.m. local time).
  • The duration is 10 days (240 h).
This model was used to identify the origin of the air mass responsible for the June 2020 event.

2.6. Soundings

The thermodynamic structure of air is represented by the type of Skew-T diagram showing the description of humidity as a function of temperature, wind speed, and direction. Thus, the vertical profiles of temperature and humidity (mixing ratio) are shown at the following standard pressures: 1000, 925, 850, 700, 500, 400, and 300 hPa using atmospheric radiosonde measurements. The atmospheric soundings are measured daily at 00 UTC (8 p.m., local time) and 12 UTC (8 a.m., local time) at the meteorological stations of PR (code: 78526 TJSJ, San Juan) and BAR (code: 78954 TBPB, Grantley Adams). These soundings are available on Wyoming website (http://weather.uwyo.edu/upperair/sounding.html) (accessed on 15 December 2020). They are used to determine the characteristics of the SAL (thickness and wind) during the extreme event of June 2020.

3. Results and Discussion

3.1. Atmospheric Context of Caribbean Zone
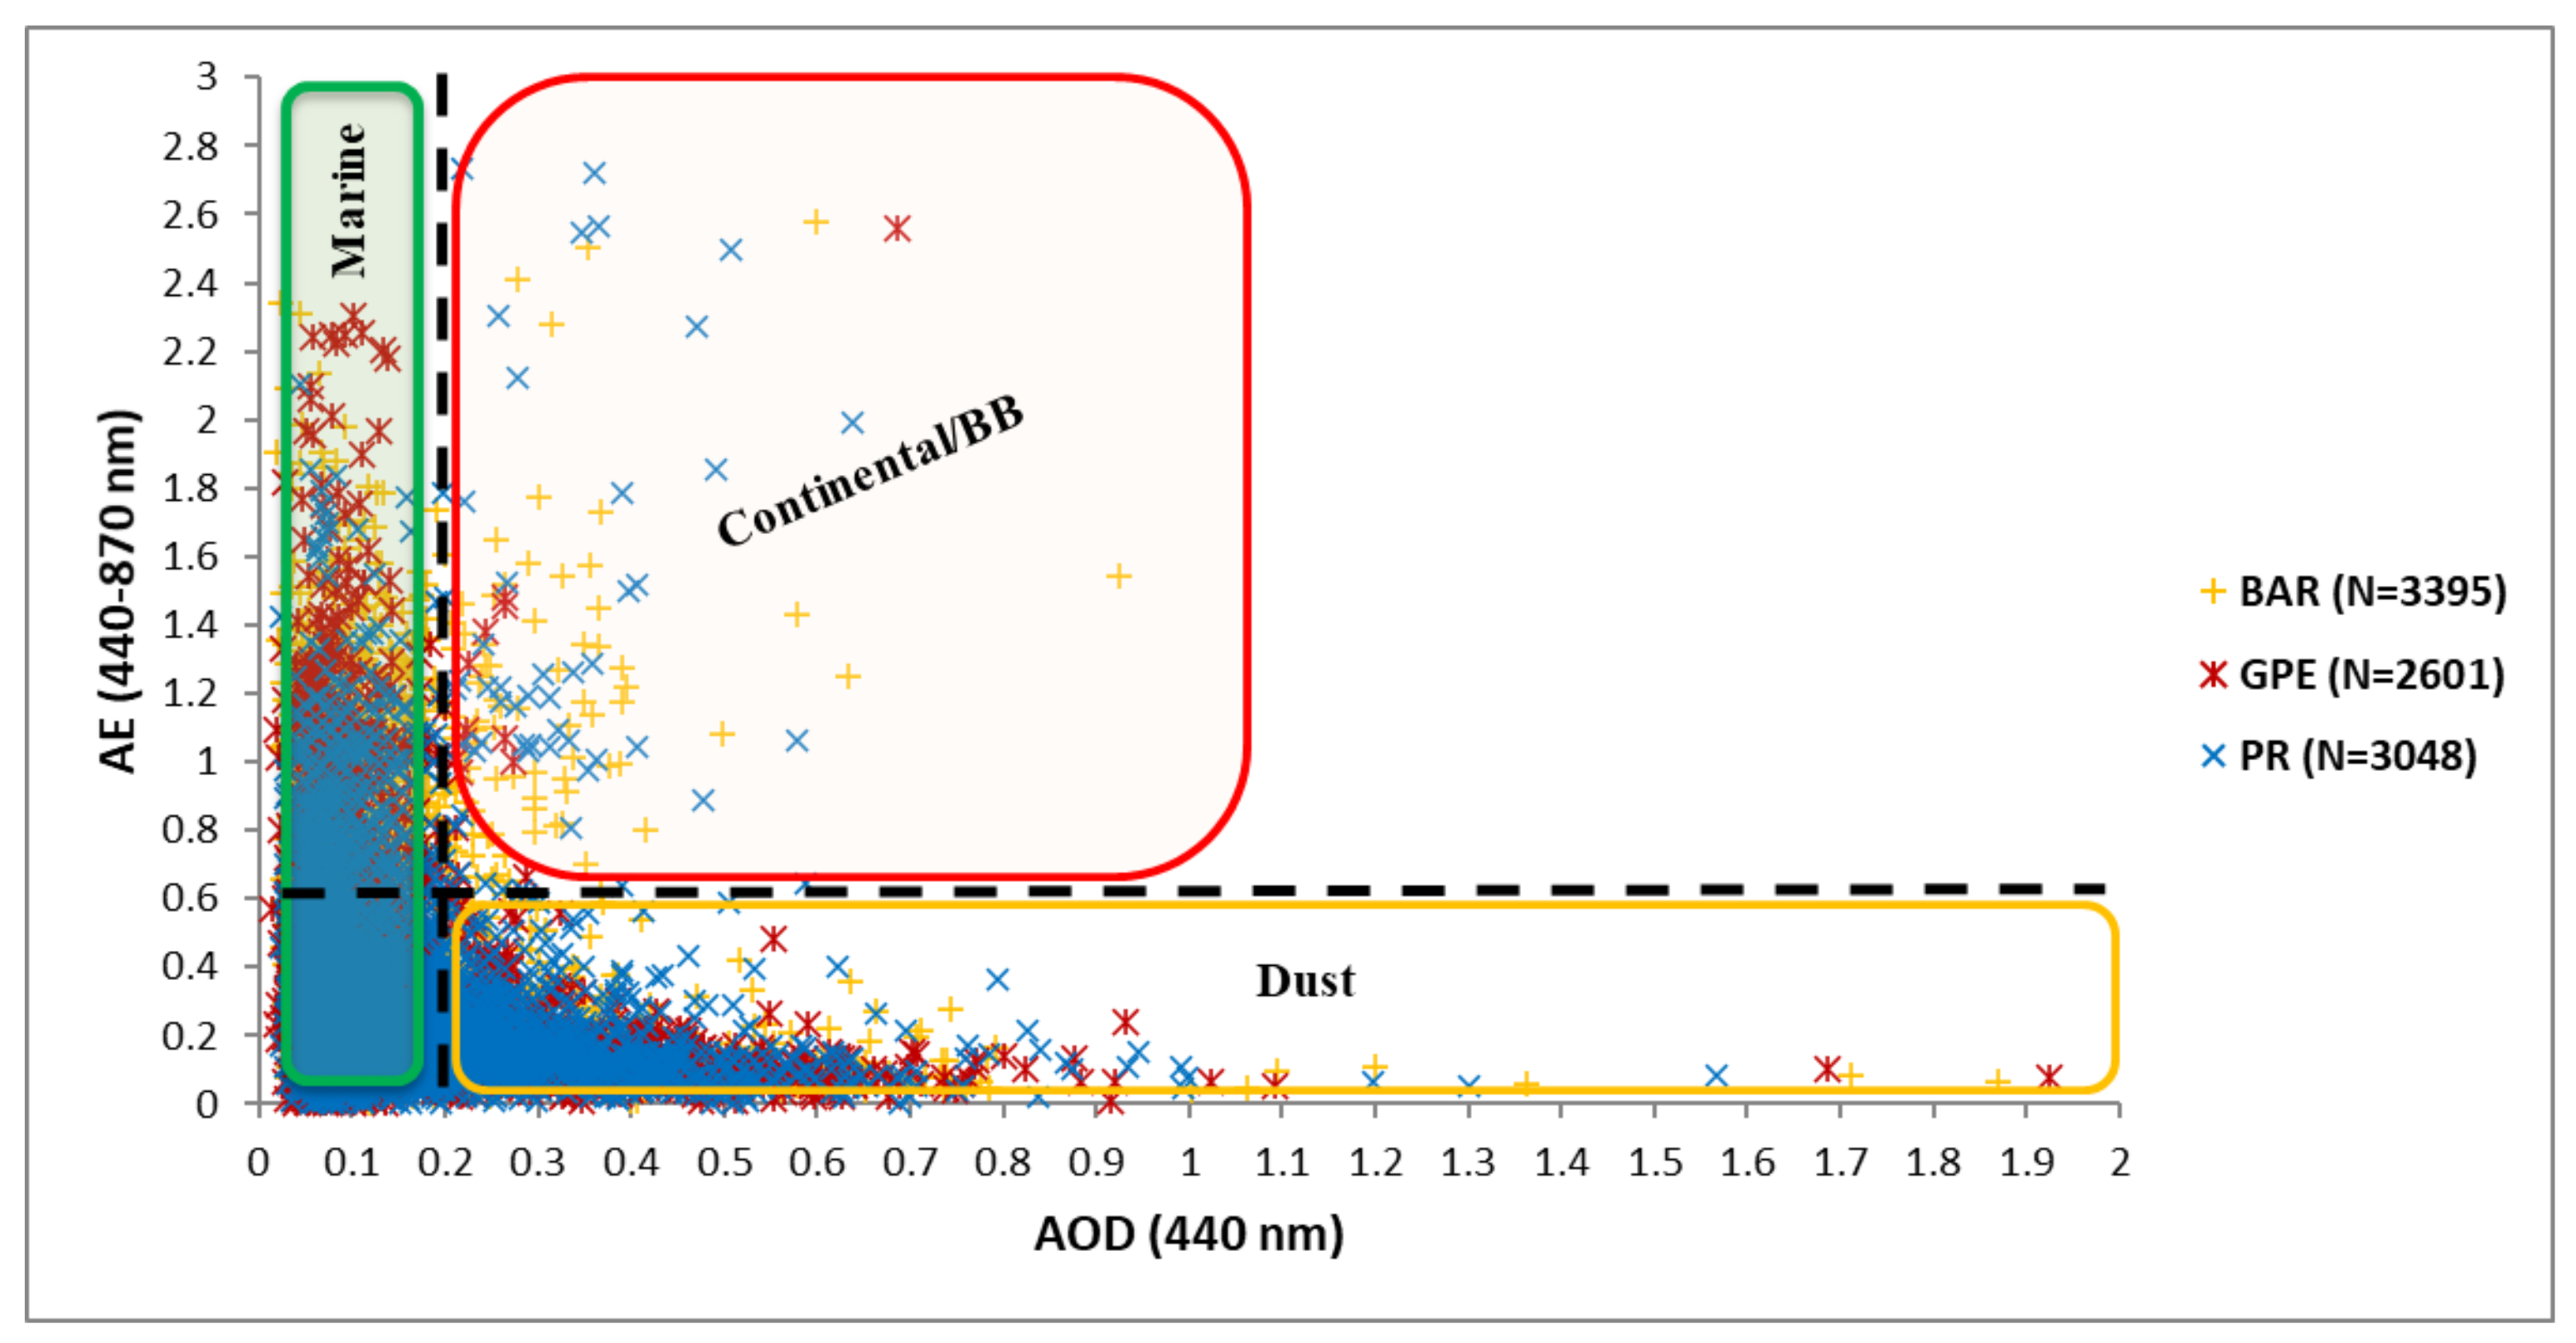
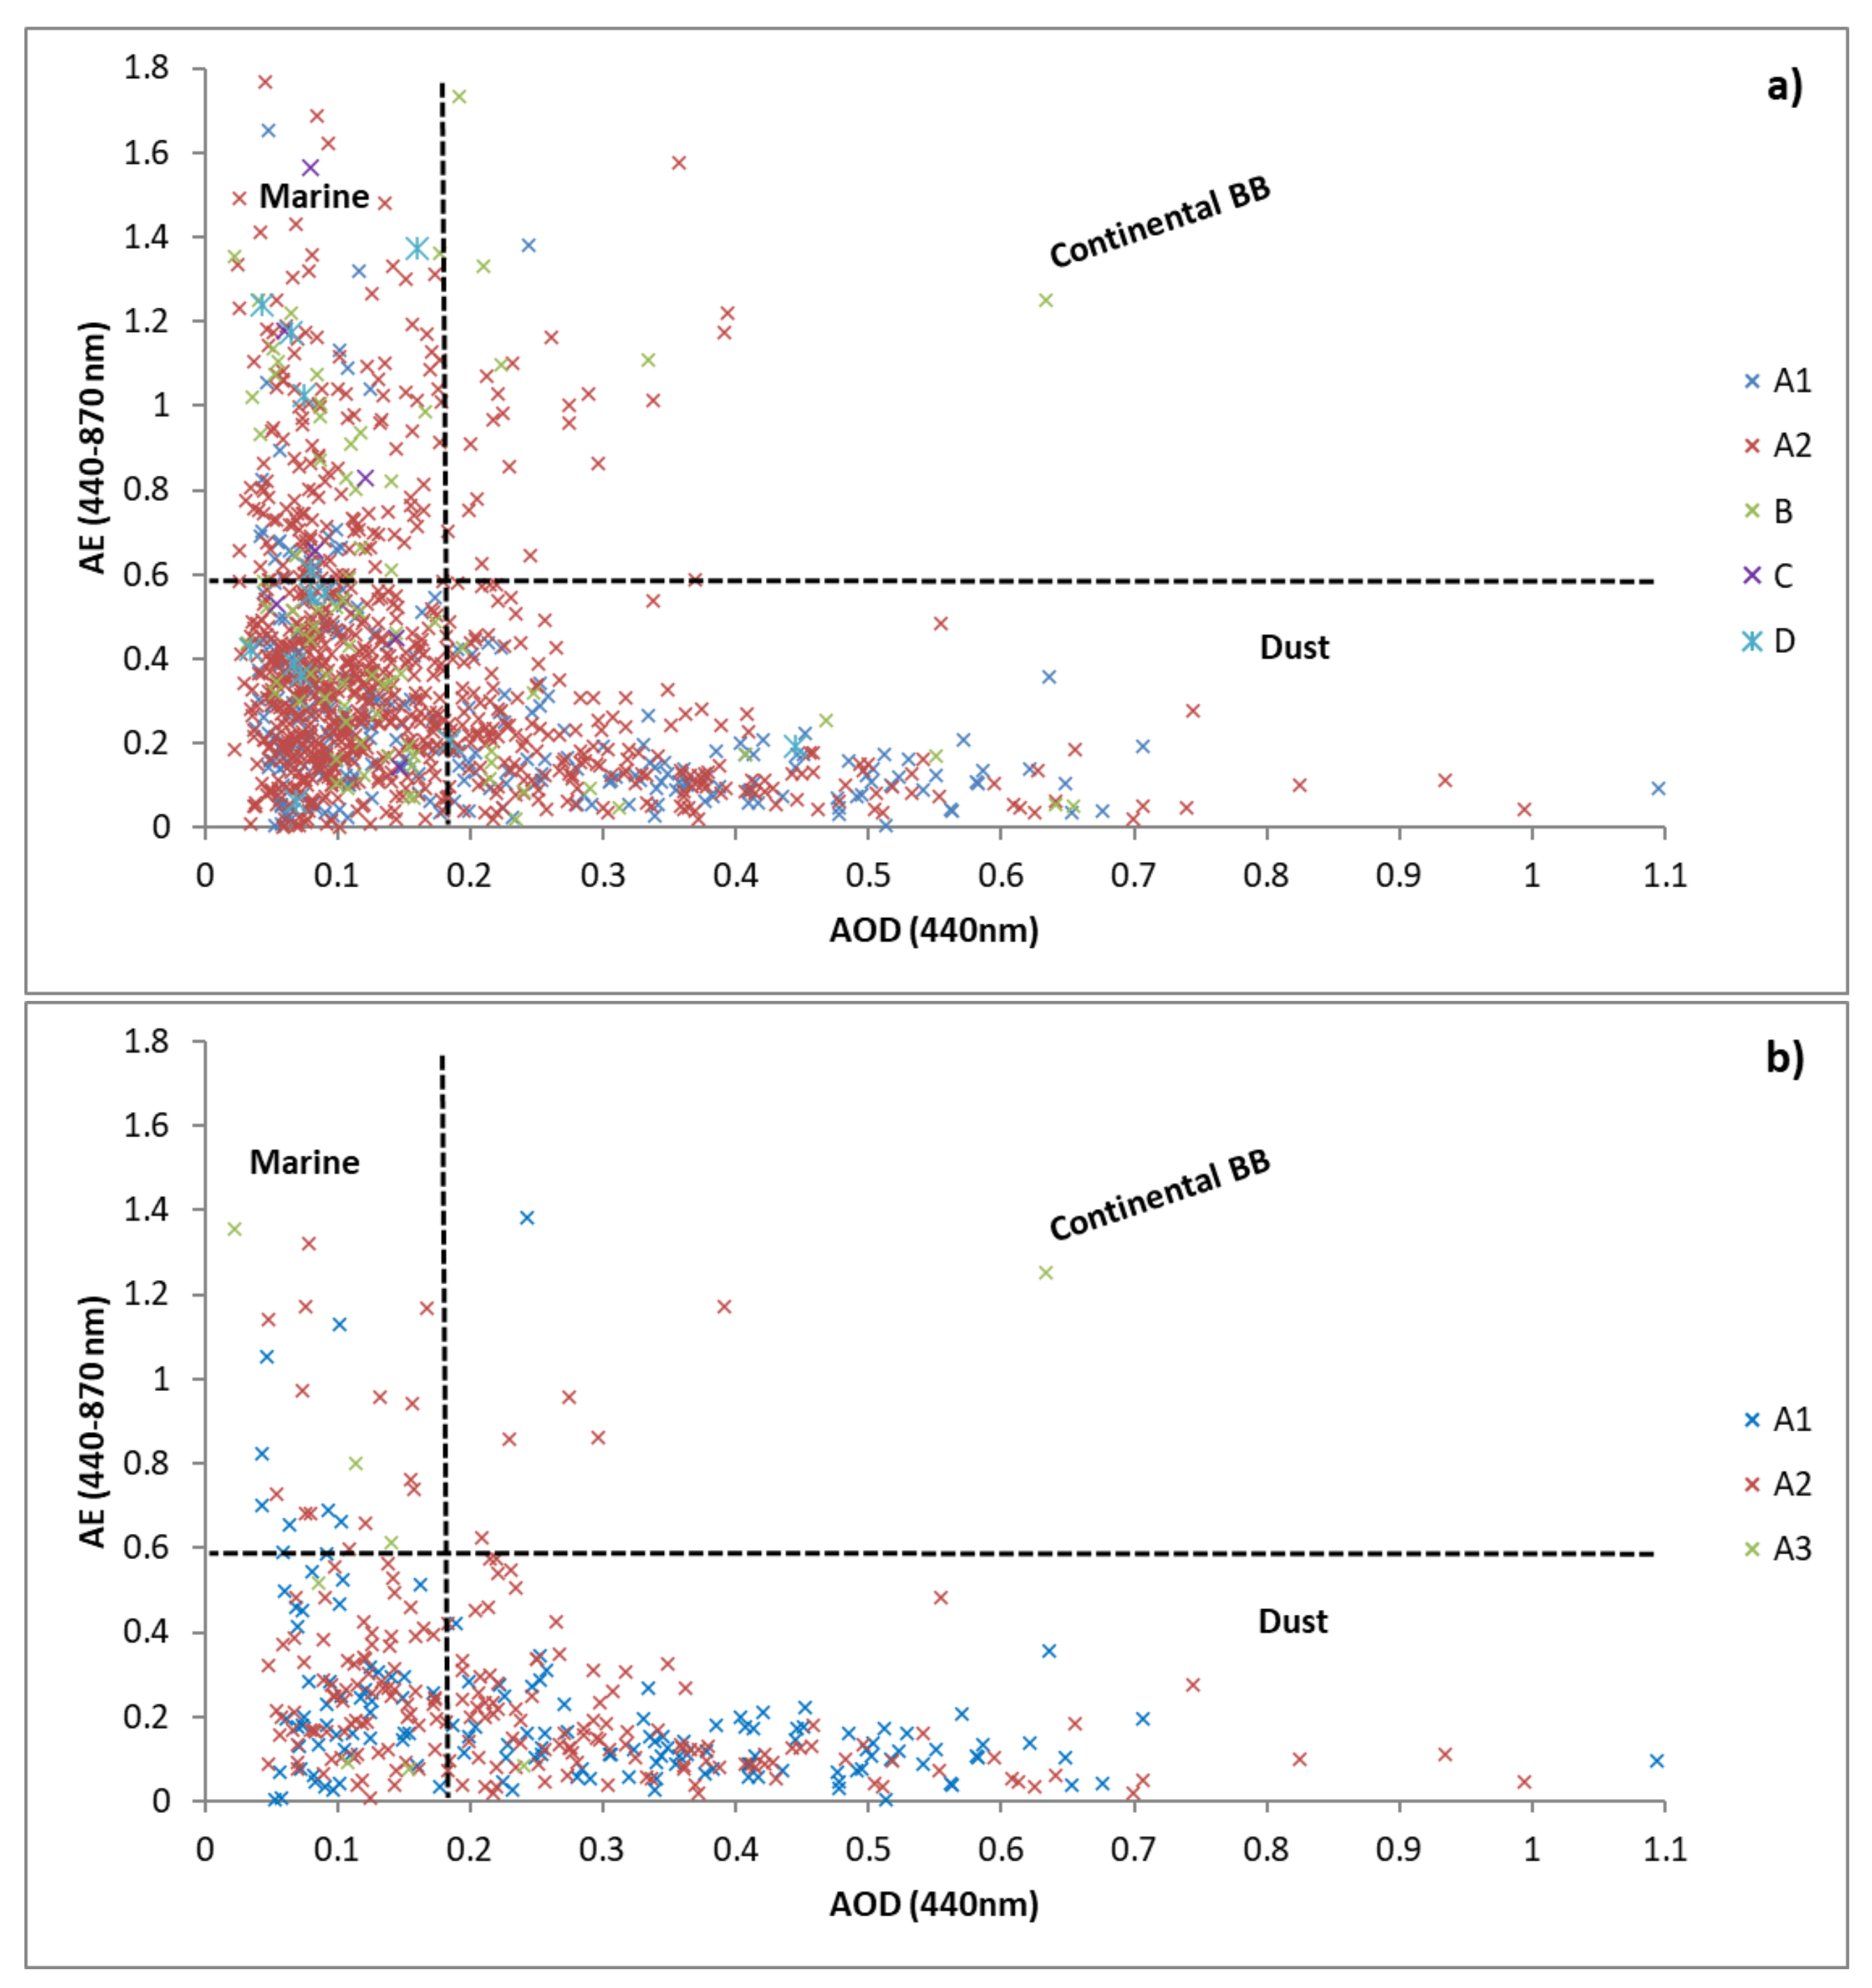
The seasonal transport of mineral aerosol from African desert sources over the North Atlantic Ocean significantly impacts the atmospheric background of the Caribbean area [40]. Indeed, this zone is mainly characterized by the dust season and the non-dust season, highlighting two distinct thermodynamic and granulometric profiles [41]. In this work, the general atmospheric state of the Lesser Antilles was examined in comparison to dust episodes that occurred in the last twenty years, notably the extreme one in June 2020 [25]. Figure 2 presents an overview of the seasonal redistribution of mineral aerosols between the African coasts and Central America.
The monthly behavior of mineral aerosols transport to the Caribbean islands over the last two decades shows that (i) the low dust season is from September to May (Figure 2a–c); nevertheless, this period also coincides to the high dust season of the Northern part of South America (Amazonia) [20,21], and (ii) the high dust season corresponds to June–July–August (Figure 2d).
At this stage, note that June is particularly marked by more frequent and more intense dusty events [16,42]. Figure 3 illustrates the magnitude of the phenomenon of June 2020 on the North Atlantic Ocean scale.
Compared to Figure 2d, which gives the trend of the high dust season over 2 decades, we observe that the maximum AOD intensity corresponds to the area extending from Capo Verde to the middle of the Atlantic Ocean in Figure 3. It can be seen that the Caribbean Basin was strongly impacted by this exceptional event. According to Francis et al. [25], the largest AOD was recorded during this event at Capo Verde and over large swaths of the Atlantic Ocean due to the high content of dust suspended in the atmosphere.
Subsequently, the classical dust episodes compared to June 2020 were studied using different types of measurements located at several sites in the Caribbean.

3.2. AOD Versus AE

In this section, our analysis deals with optical data (AOD versus AE distribution) to determine the nature of the particles in the Caribbean zone. In the insular context, sea salt particles compose the main atmospheric component [43,44]. The latter is characterized by varied sized particles where the coarse mode dominates without significant impact on AOD associated with visibility [21]. However, during dust events, the AOD values increase while the AE decreases, highlighting the coarse mode of the particles [45,46]. On the other hand, anthropogenic pollution generates fine particles [47]. Previous studies established thresholds related to AOD versus AE values reflecting marine, dust, continental, and biomasses burning (BB) particles [21,29,30,48]:
  • AOD ≥ 0.2 combined with AE ≤ 0.6 related to dust particles.
  • AOD < 0.2 combined with AE < 2 related to marine particles (background atmosphere).
  • AOD ≥ 0.15 combined with AE > 0.6 related to continental/BB particles (anthropogenic pollution).
Figure 4 shows the classification of particle types according to these known thresholds for the Caribbean zone. According to the results presented in Table 3, we notice that from 1996 to 2021, among the 9044 daily data collected, 64.89% are associated with the background atmosphere, 22.11% cases are related to dust episodes, and 3.47% to infrequent events of industrial pollution (continental/BB).
These results are consistent with previous studies [21]. This implies that the Caribbean area constitutes a privileged field of study, free from the impact of anthropogenic pollution due to its low industrial activity [49,50]. The main contributor of mineral pollution remains the seasonal episode of desert dust [20,21,51]. For June 2020, 68.42% of daily cases are associated to dust episodes. Later in this study, we will focus on the extreme event of June 2020.

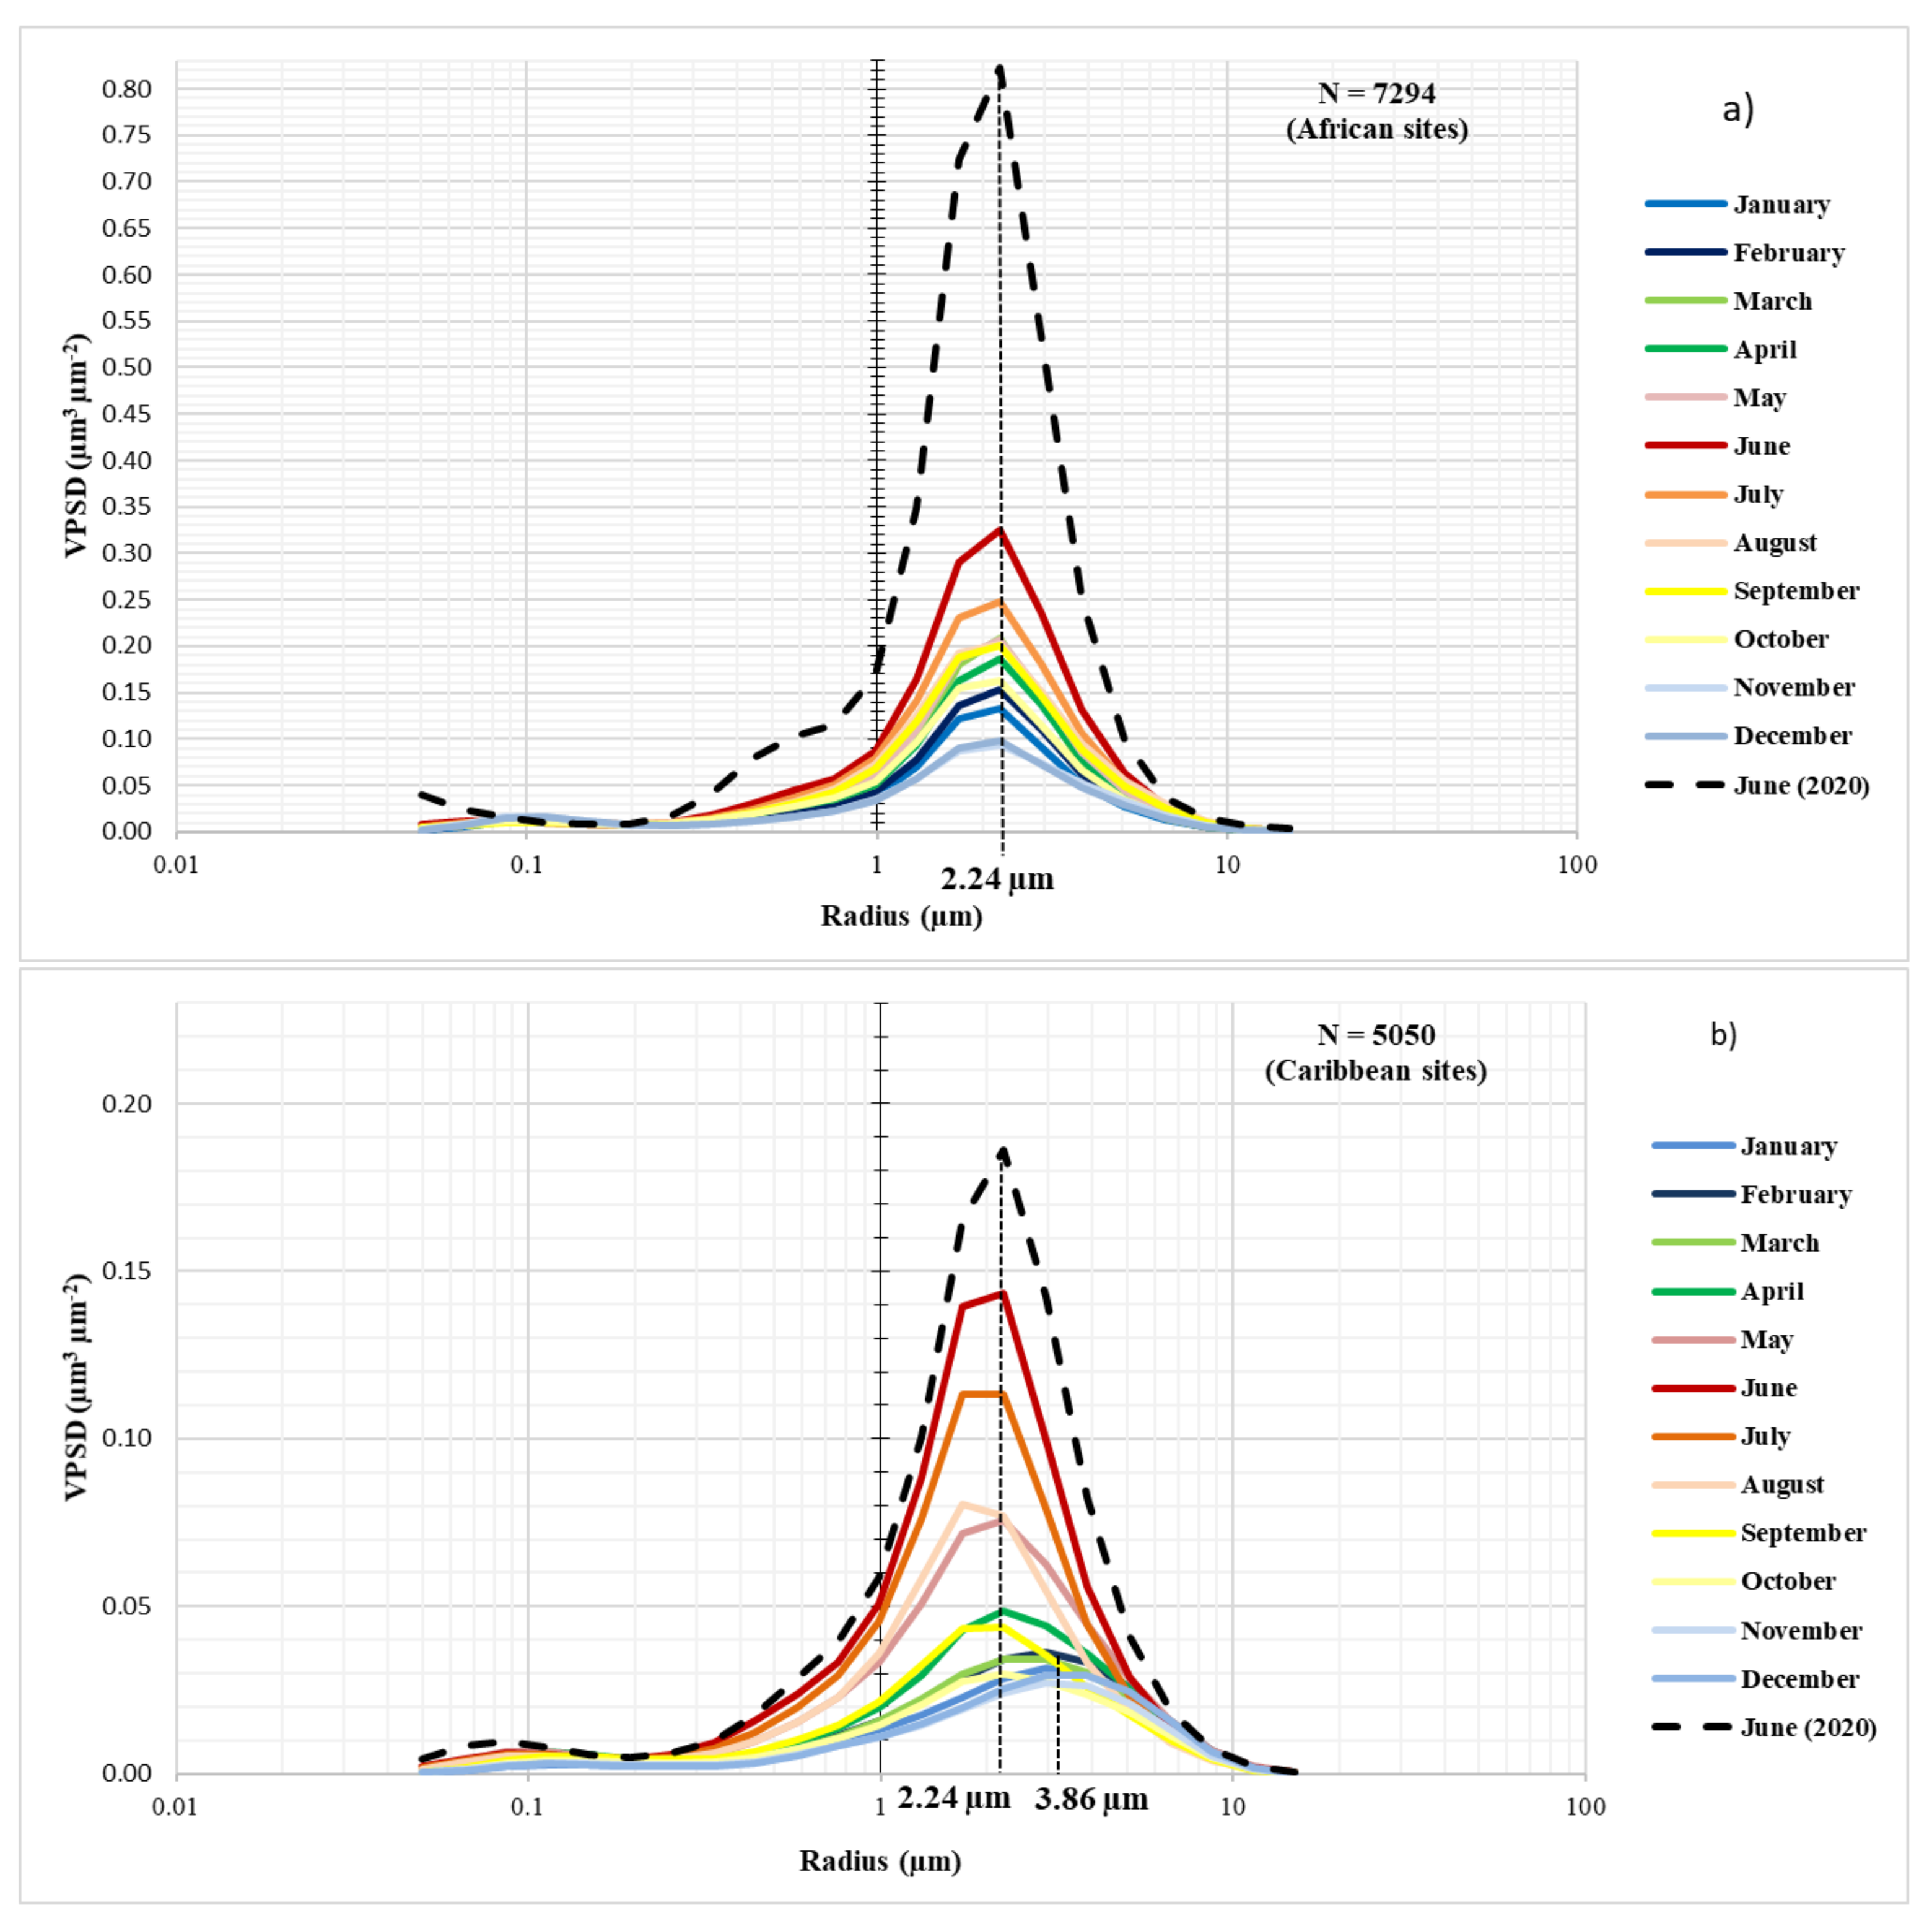
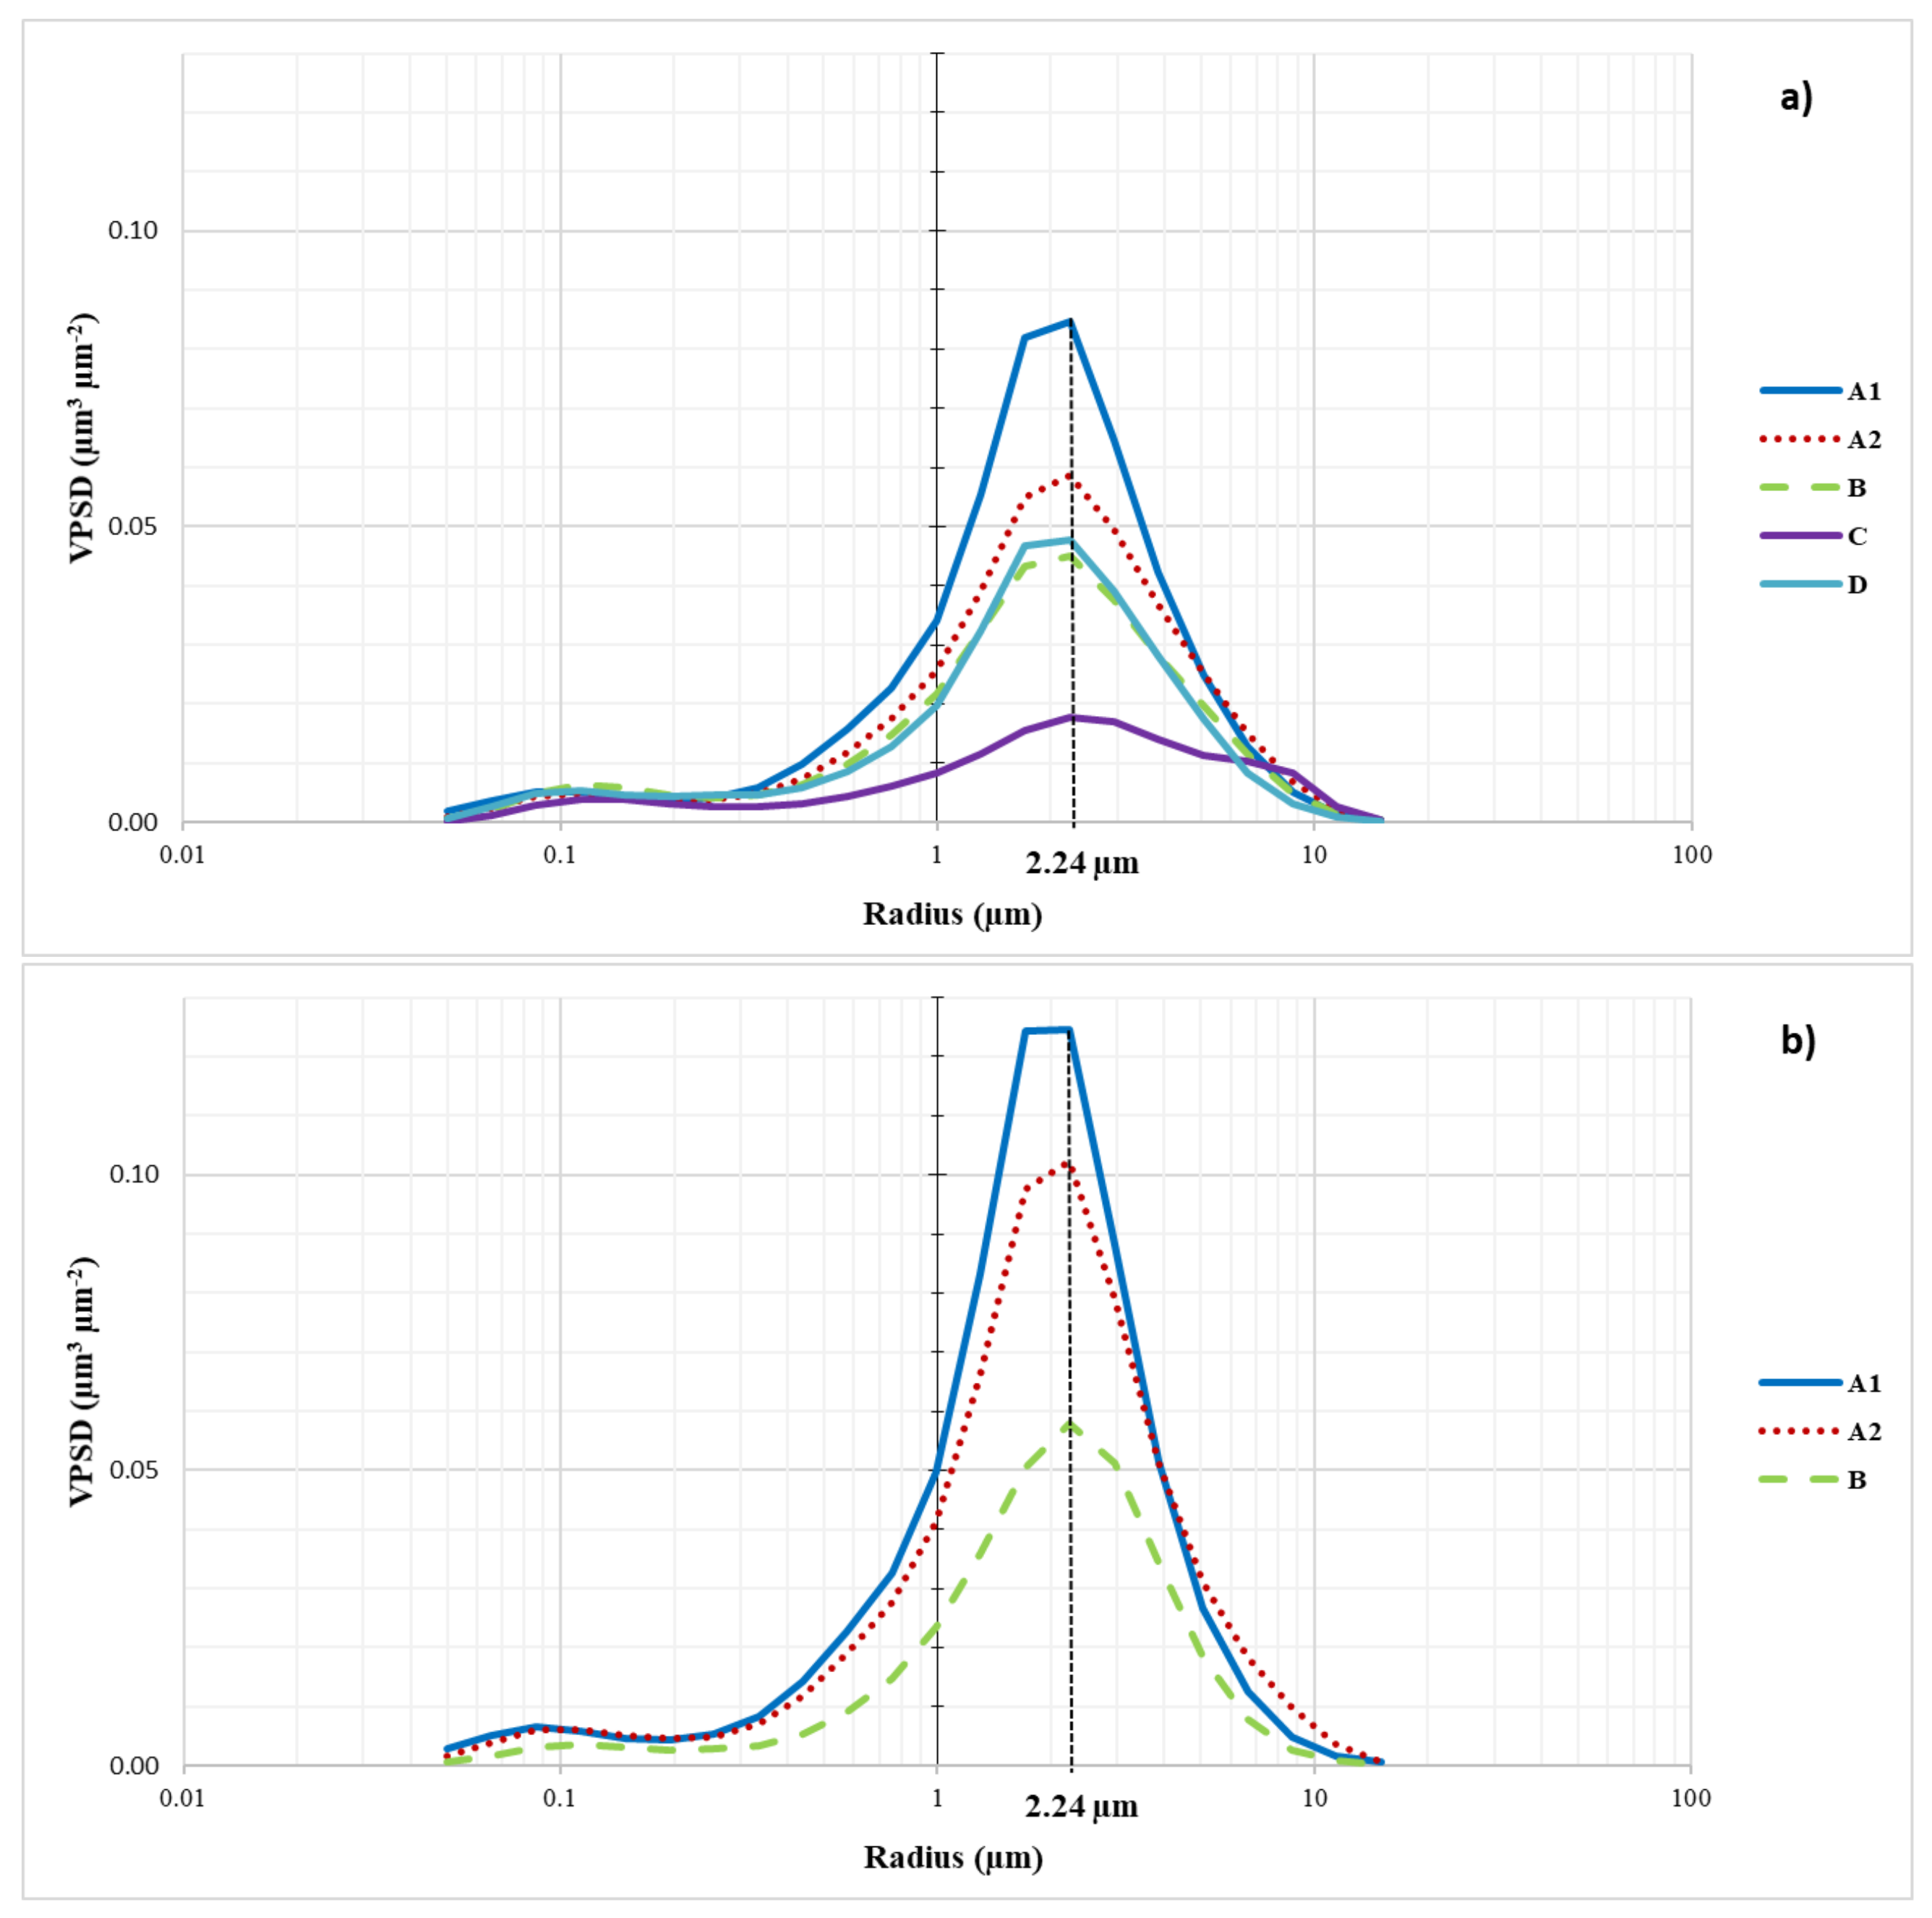
3.3. Monthly Volume Particles Size Distribution (Vpsd) Analysis from 1996 to 2021

The size distribution of the particles leads to the characterization of their composition and properties. The predominance of the fine/coarse mode results in a concentration peak for a specific radius which testifies to their nature. As a reminder, the radius 2.24 μ m is deeply associated with desert dust aerosols [21,46,52,53], while the radius 3.86 μ m corresponds to sea salt aerosols [21,52].
For African sites (see Figure 5a), all months show the same behavior with a peak concentration at radius 2.24 μ m, i.e., the desert dust signature. This is not surprising, as African dust sources (Mauritania, Sahara, and Bodélé) are active all year round, but their intensities fluctuate according to the seasons. Indeed, the maximum activity of the Sahara/Mauritania area is in winter, while the maximum activity of Bodélé is in summer. The cycle of activation related to dust sources has been highlighted in many studies [54,55,56,57,58,59,60,61], to mention a few. Over the 26 studied years, the maximum peak concentration corresponds to June and July with a concentration of 0.33 and 0.25 μ m 3 μ m 2 , respectively. The other months have an average concentration ranging from 0.13 to 0.20 μ m 3 μ m 2 . December has the minimum concentration with 0.1 μ m 3 μ m 2 . June’s concentrations in 2020 stand out. Indeed, this latter is clearly above the seasonal value with 0.83 μ m 3 μ m 2 , i.e., the highest concentration. June 2020 strongly influences the overall average concentration for the months of June.
For Caribbean sites (see Figure 5b), June and July show the highest peak of concentration at radius 2.24 μ m as expected. May and August show intermediate concentration rates but are still dominated by desert dust particles. The other months (September to April) are mainly marked by marine particles (background atmosphere) with a peak of concentration at radius 3.86 μ m. June and July correspond to the maximum peak with a concentration of 0.14 and 0.11 μ m 3 μ m 2 , respectively. The concentration in May and August is approximately 0.08 μ m 3 μ m 2 , while the other months have an average concentration ranging from 0.02 to 0.05 μ m 3 μ m 2 . In the Caribbean basin, only June 2020 stands out. Indeed, the concentration of June 2020 is approximately 1.5 times higher than the seasonal norm with 0.19 μ m 3 μ m 2 . It is important to emphasize that concentrations of the Caribbean are 4 times lower than concentrations observed on the African coasts. The decrease in volume particle size distribution is due to the dust particles deposition by dry or wet process during transport over the Atlantic. Overall, these results are in agreement with Velasco et al. [46] study. This analysis allowed to quantify the intensity of June 2020 event between Africa (source) and the Caribbean area (receptor).

3.4. Surface Dust Analysis

In addition to the optical data describing the column aerosols measurement, ground measurements were also analyzed. Thus, we examine the P M 10 concentrations measured by the air quality networks of Caribbean islands reflecting the pollution phenomenon impact on a local scale. The Pearson correlation coefficient between AOD and P M 10 in the West Indies is R = 0.8 [21,46], i.e., better than those found in Europe [62], the United States [63], and China [64,65]. The P M 10 thresholds inform the population of the air quality level and warn them of critical thresholds for human health. P M 2.5 , being more harmful, is closely monitored. However, mineral dust aerosols are mainly associated to coarse particles, i.e., P M 10 . In the Caribbean Basin, desert dust events are detected from P M 10 concentration superior or equal to 35 μ g . m 3 , i.e., dusty cases [21]. The classically threshold used in literature to detect dust episodes and alert the population is 50 μ g . m 3 . The latter corresponds to the European legislation (Directive 2008/50/EC) [66], which has proved to be unsuitable for the the Caribbean area [21].

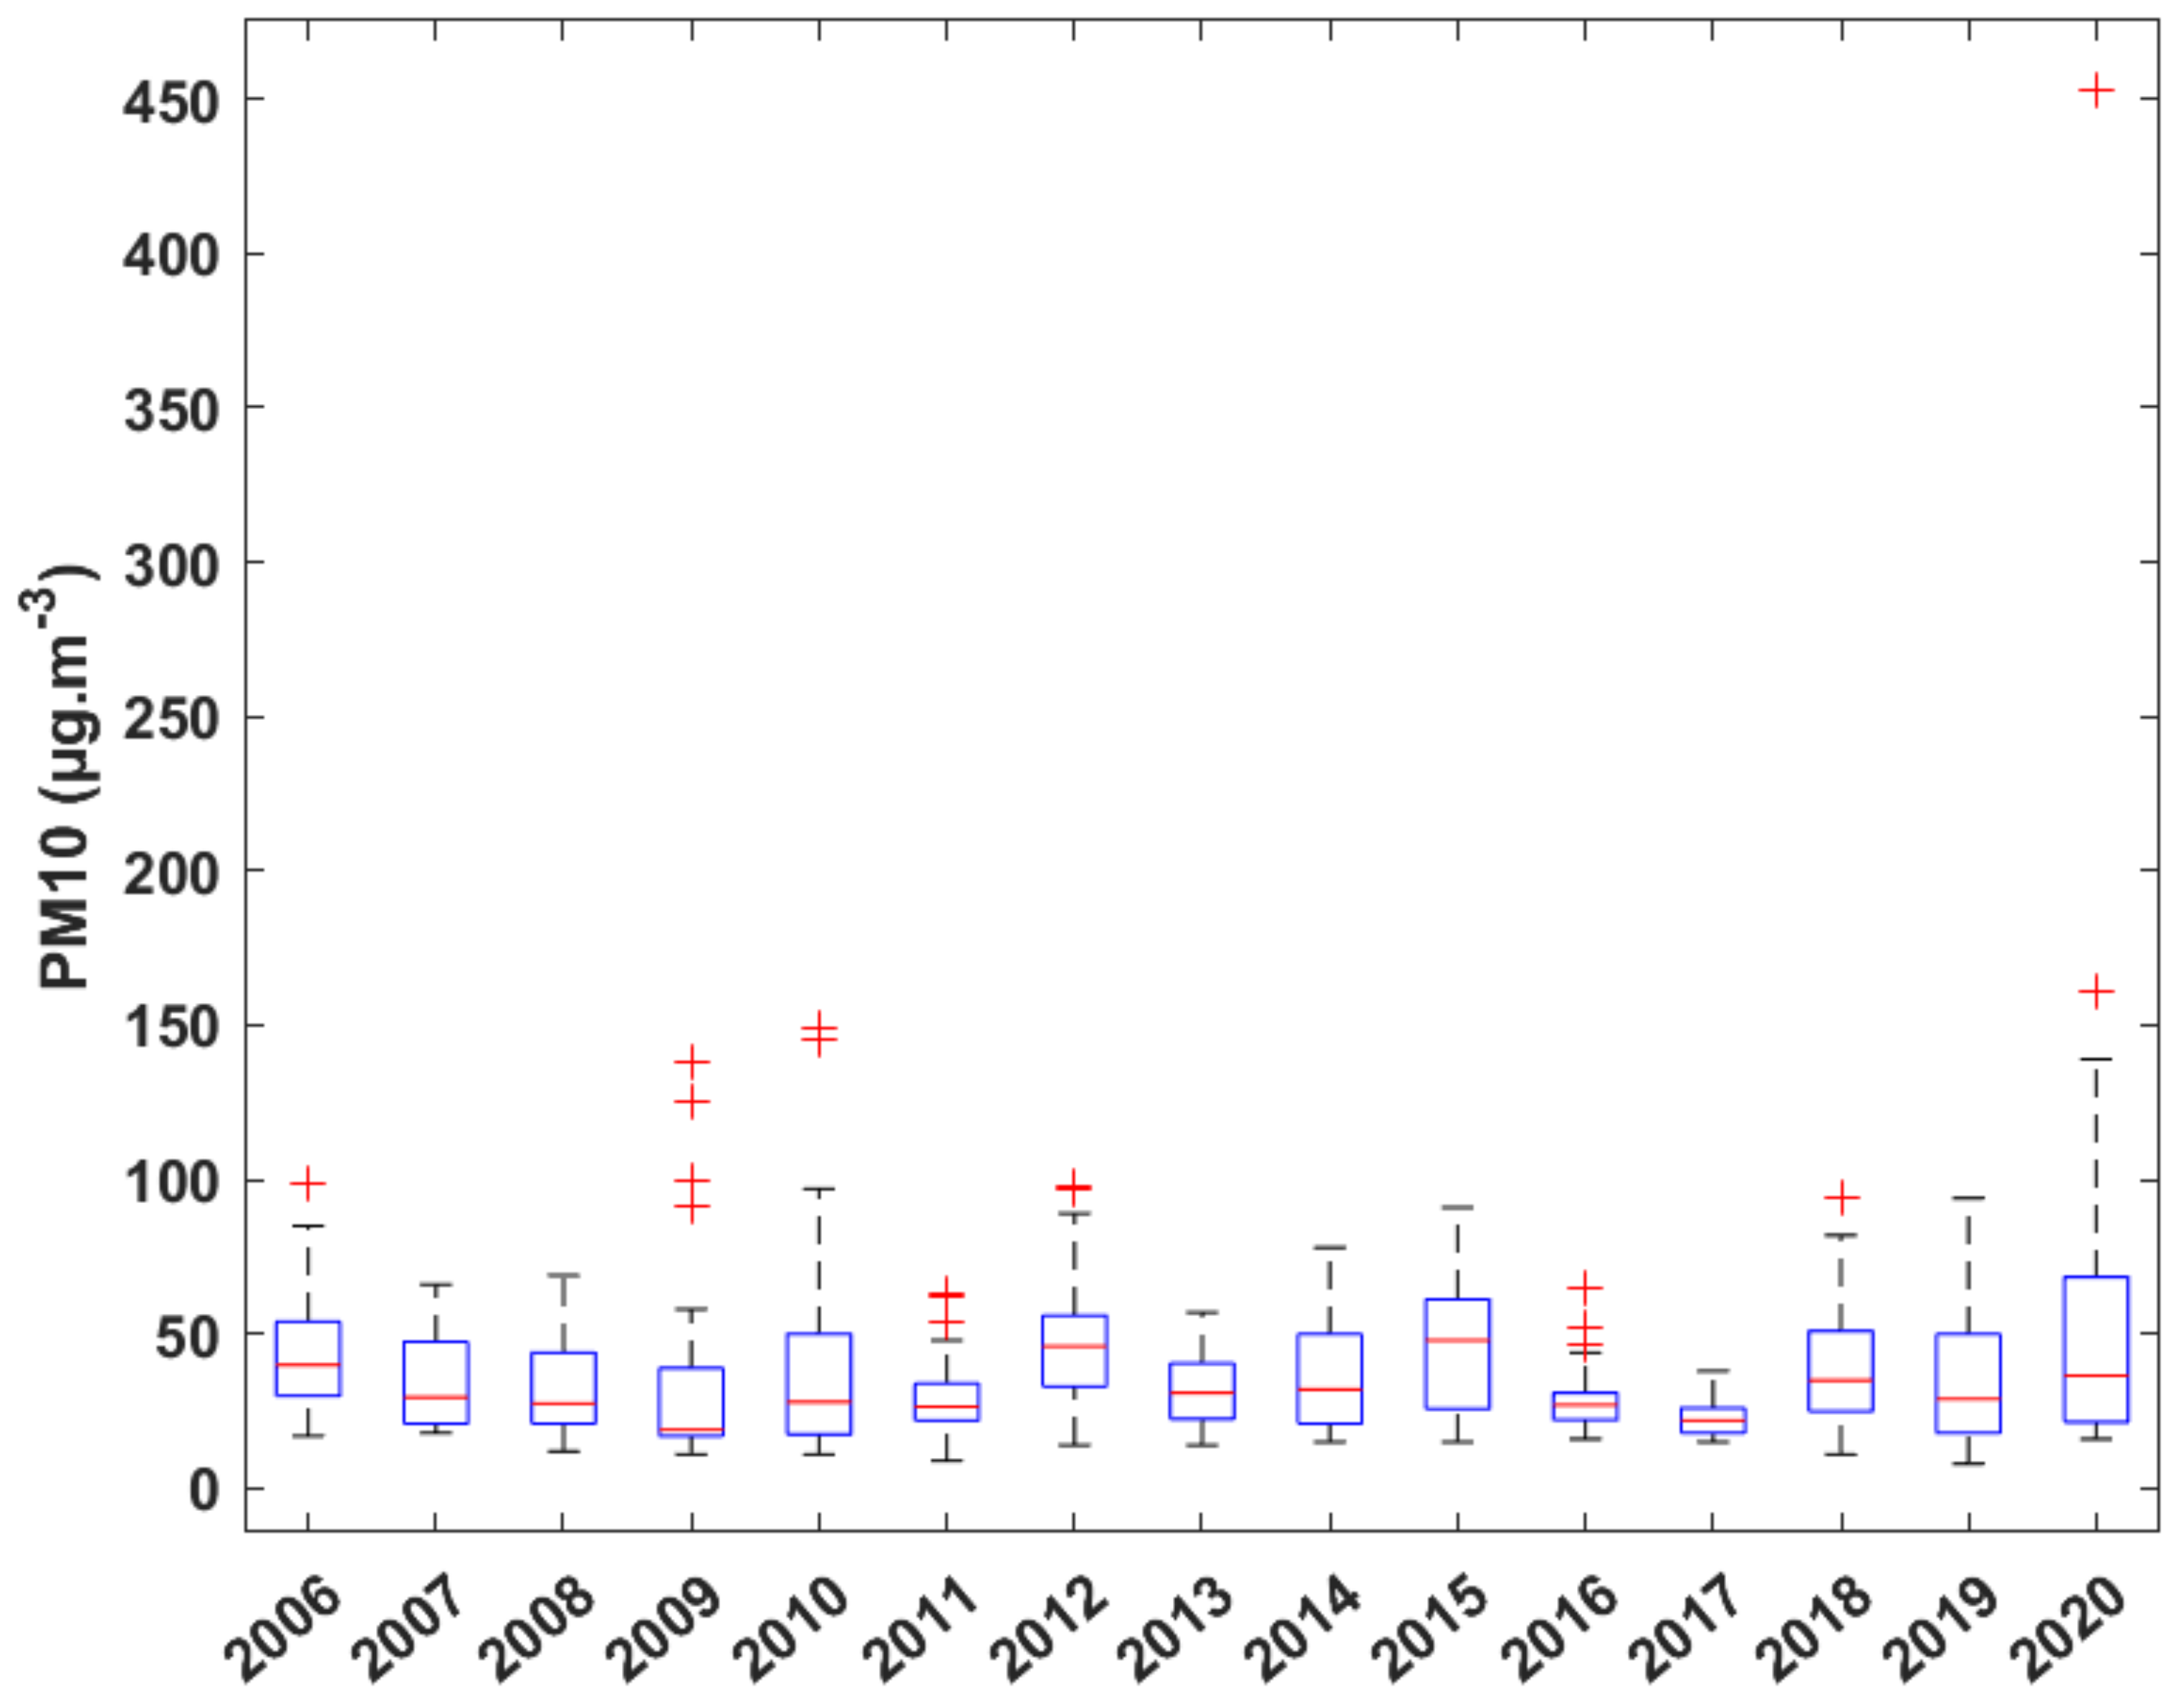
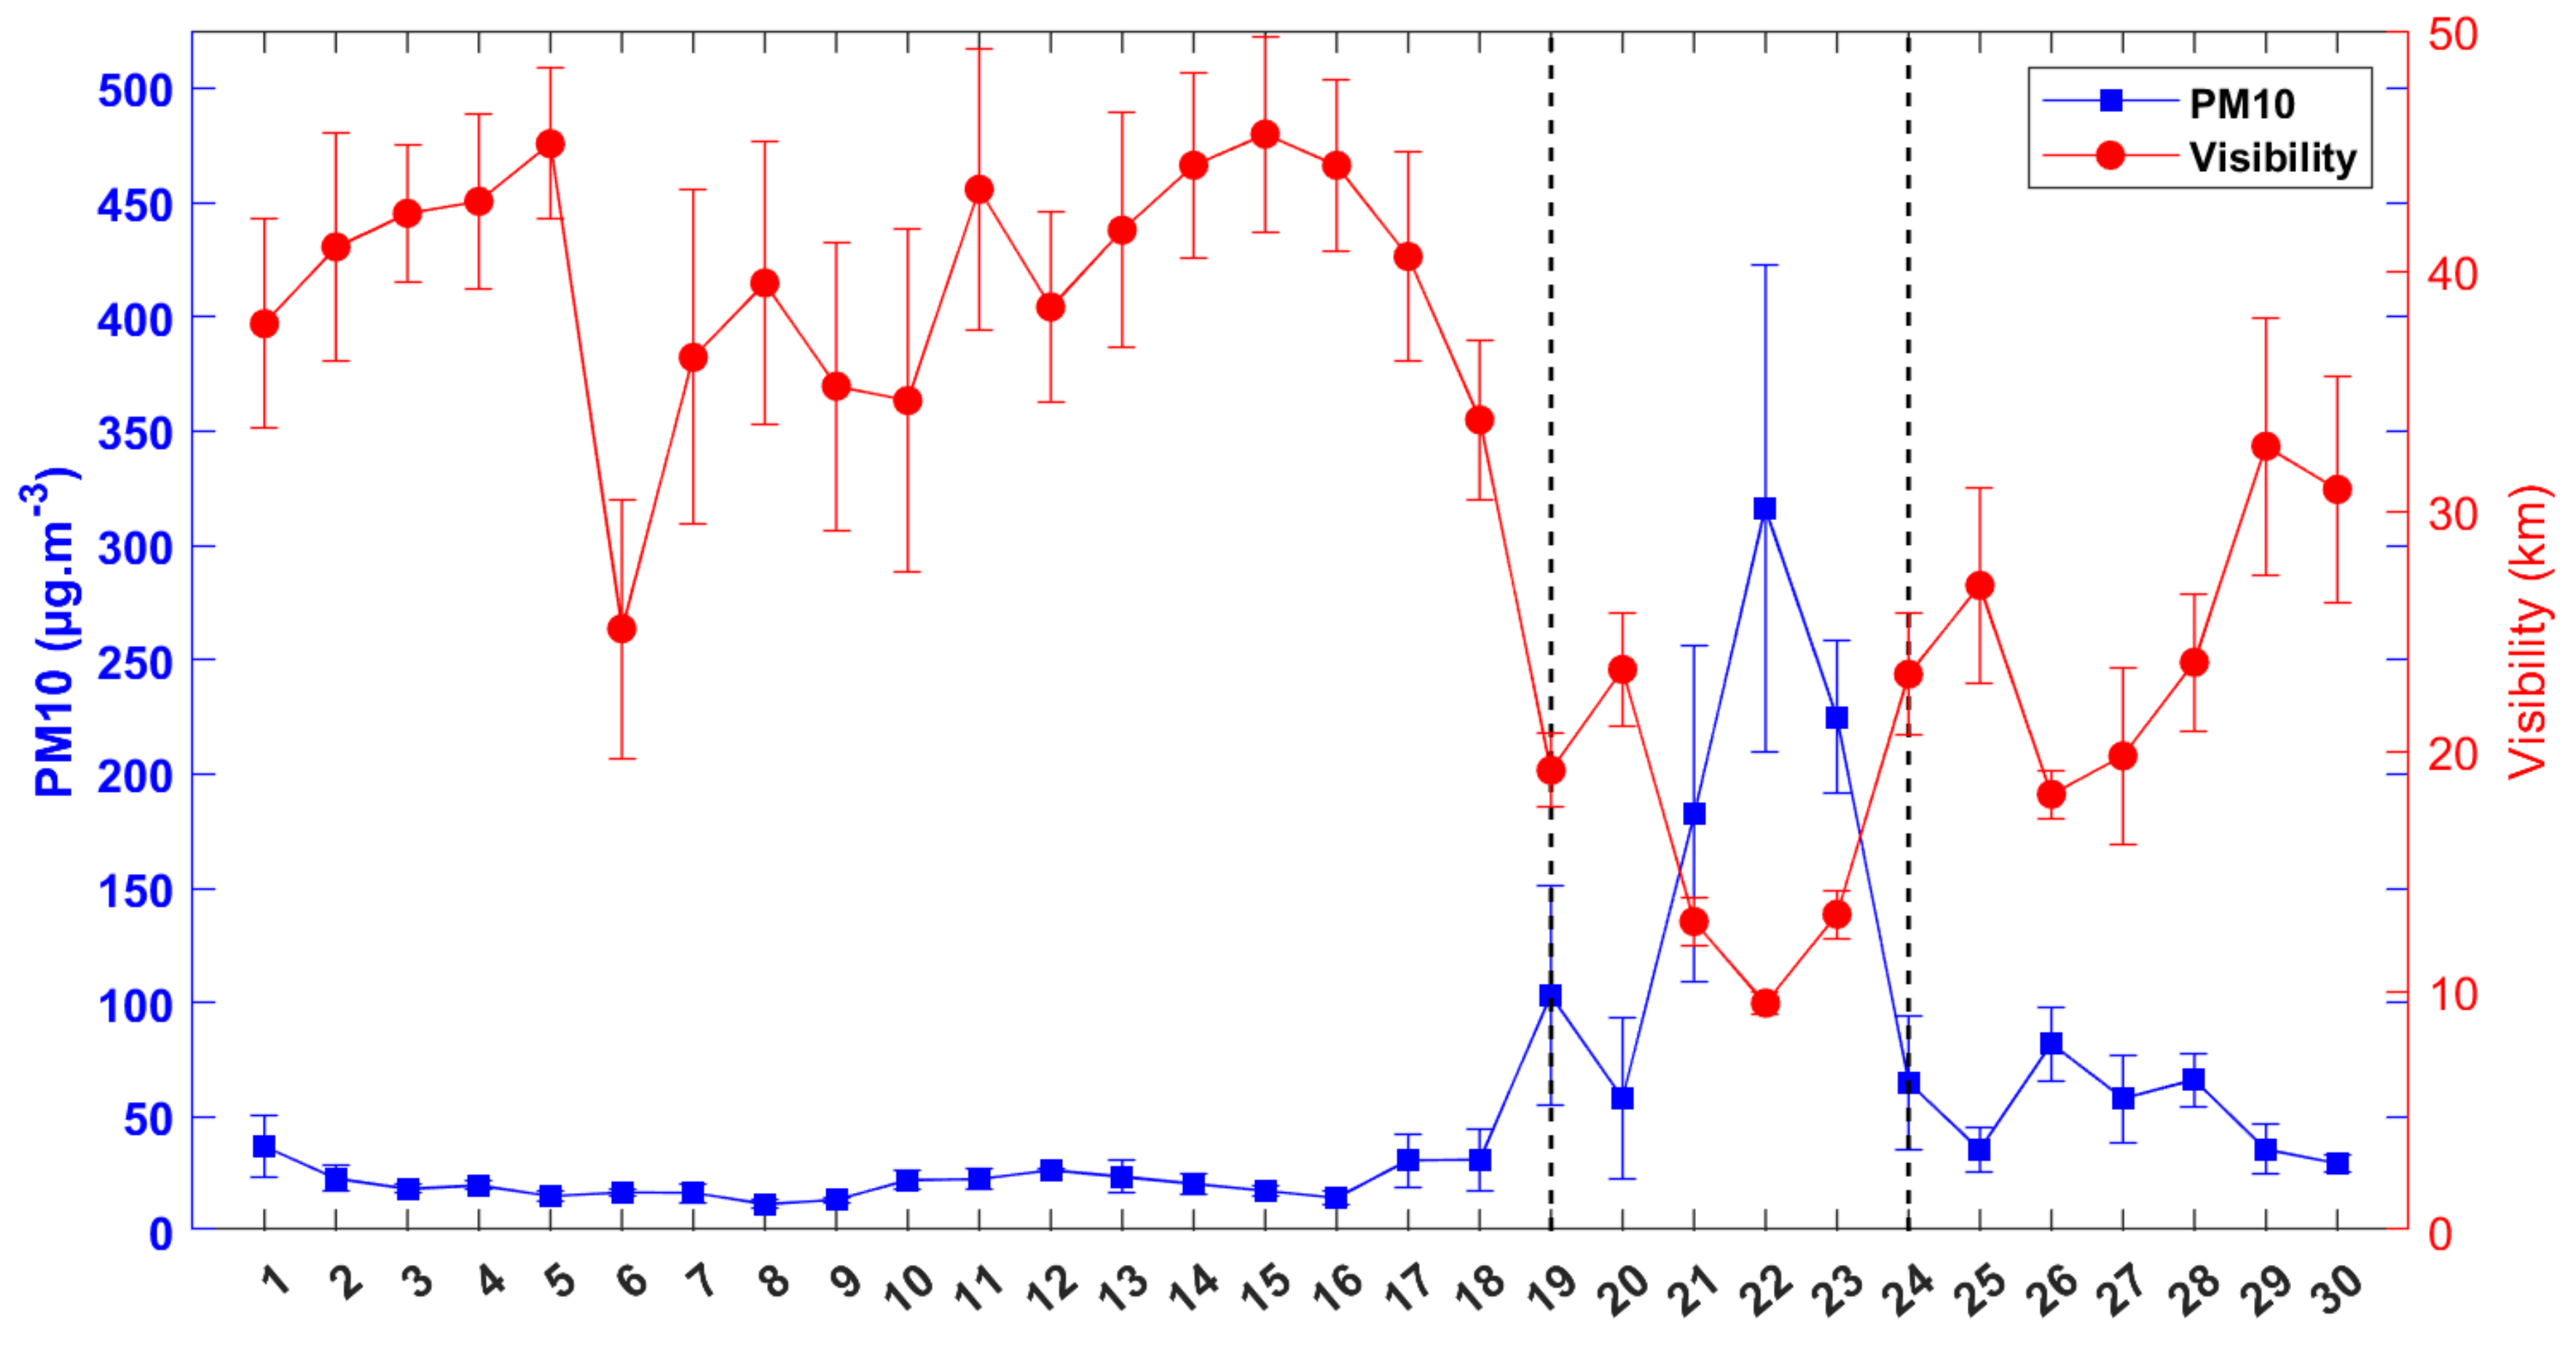
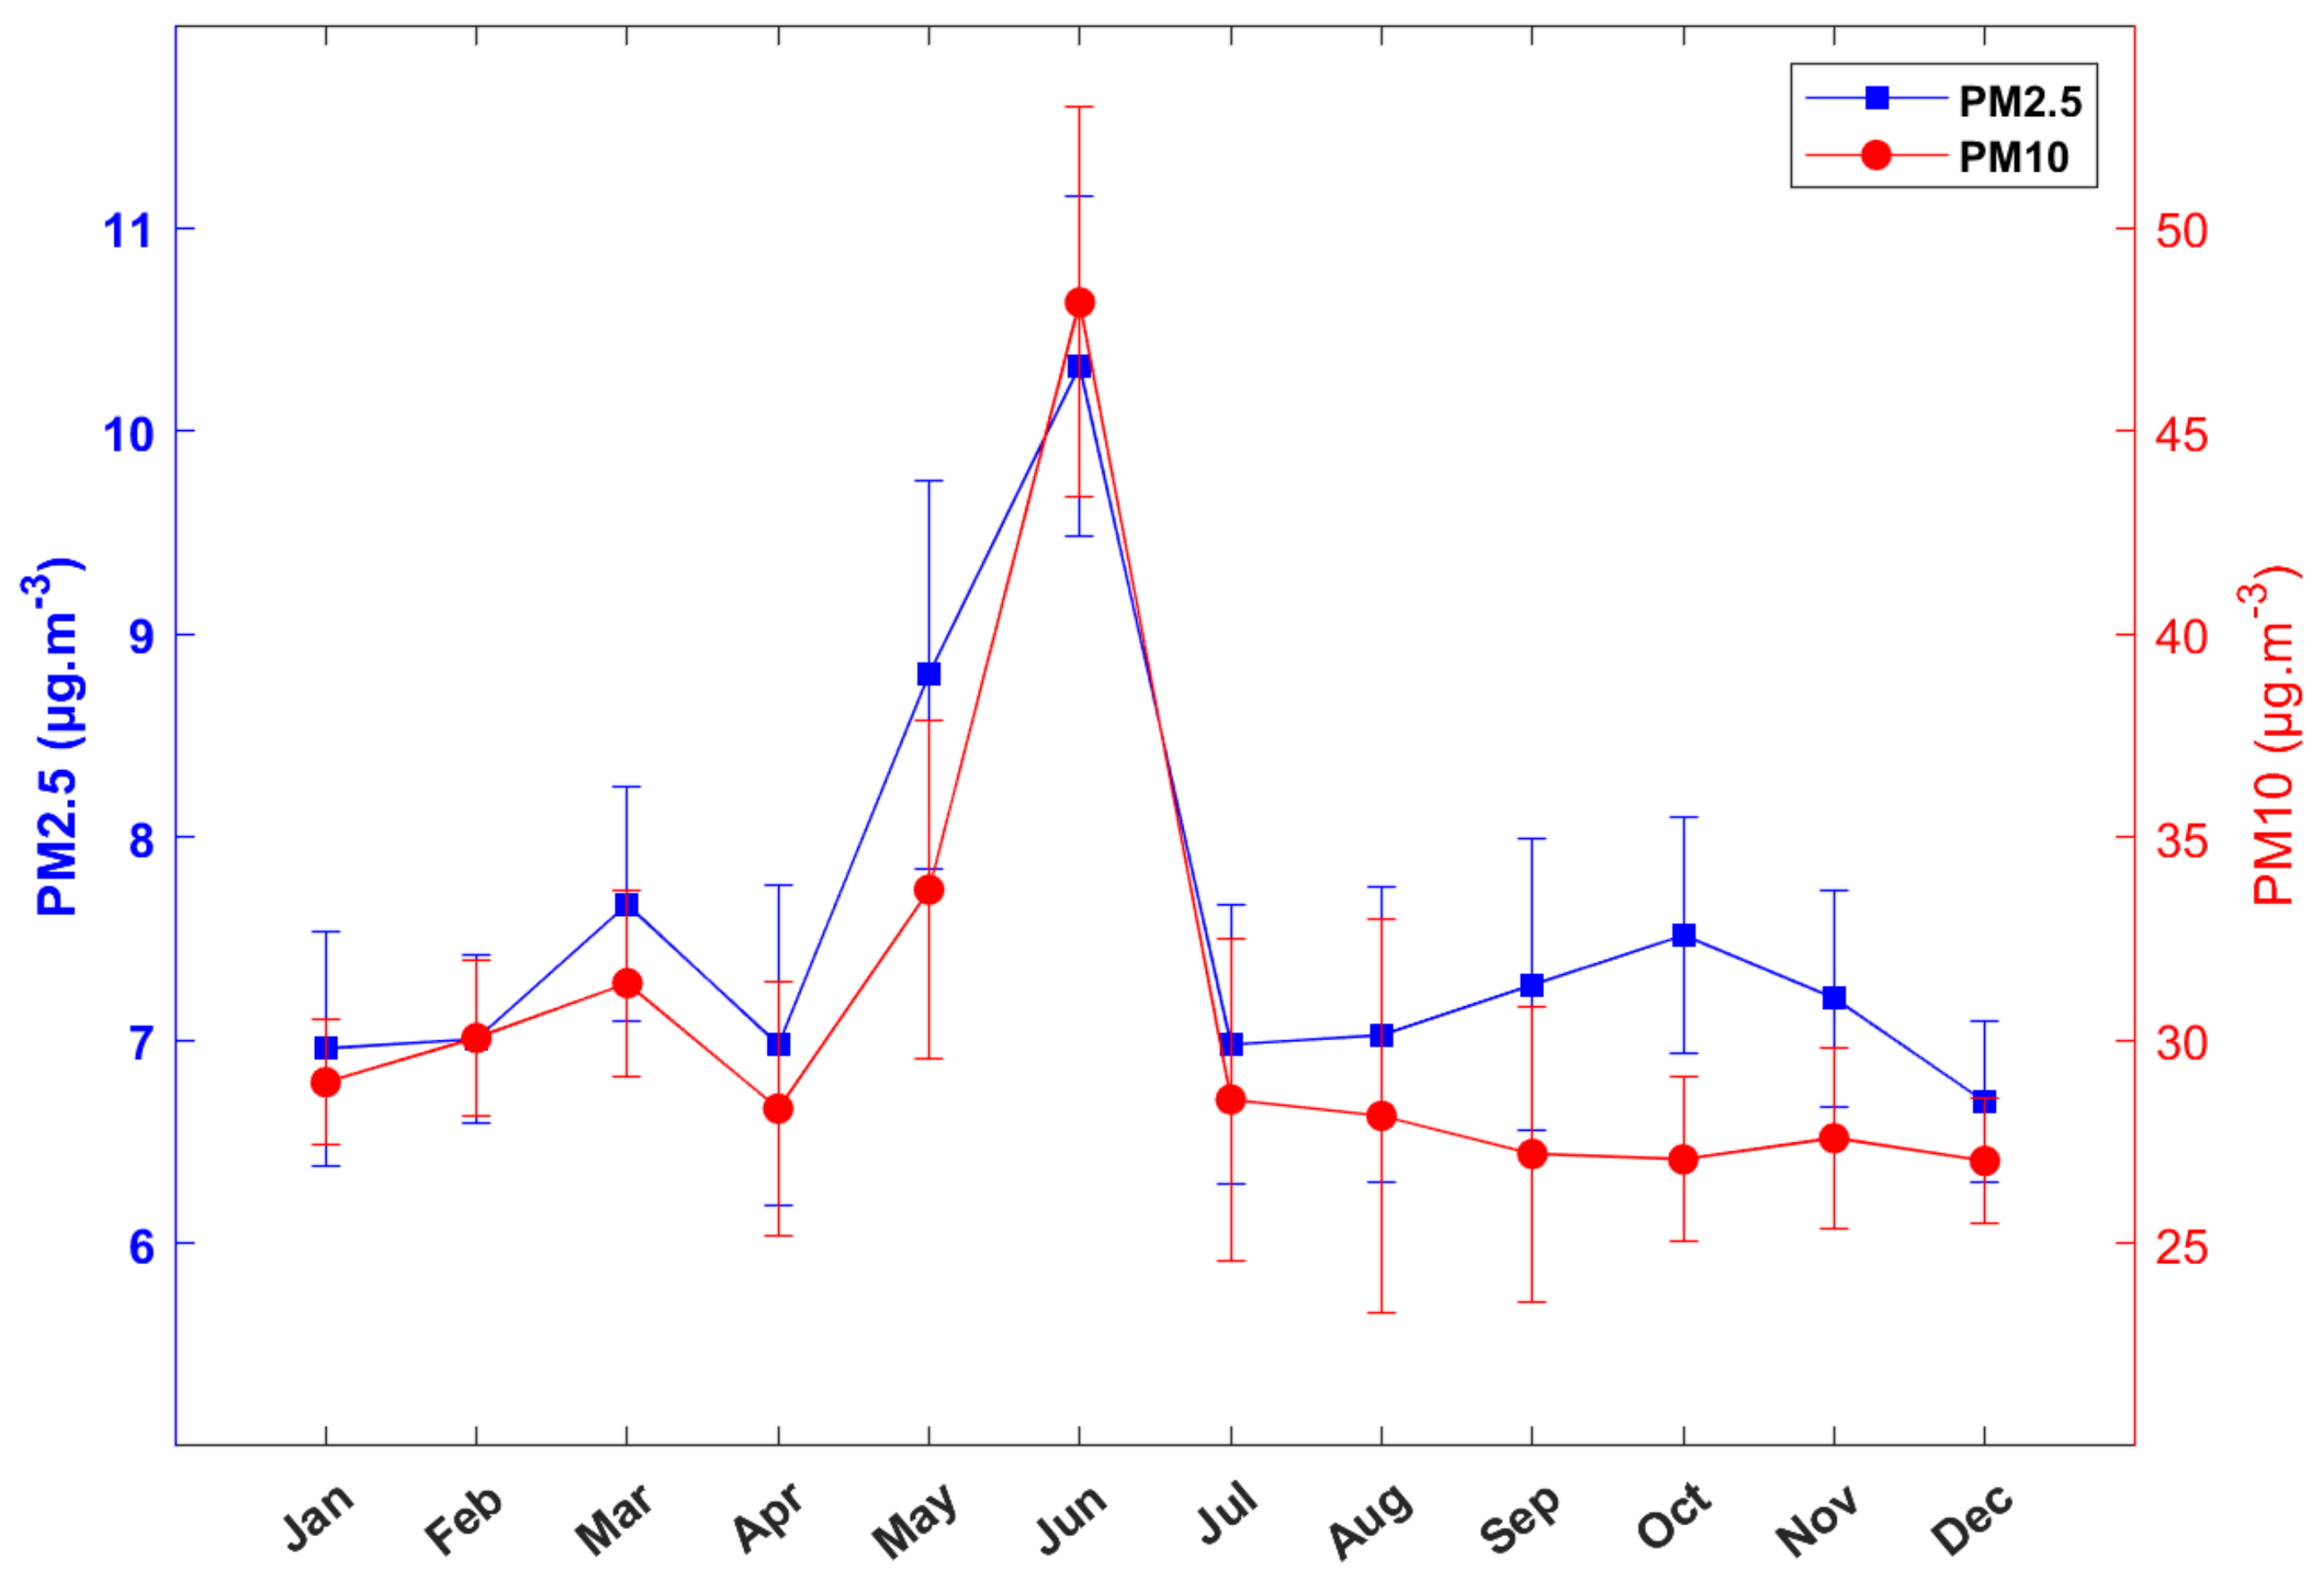
3.4.1. PM10 Statistical Analysis

Figure 6 and Table 4 present the results achieved for the descriptive statistics of June’s months between 2006 and 2020 in PR.
From one year to another, one can notice a strong heterogeneity in the statistical parameters values, i.e., median, mean, standard deviation, skewness, and kurtosis. One of the reasons that may explain this variability is the activation of dust sources in Africa [67]. Indeed, many sources of dust in Africa become more active in summer [68]. These activations are related to the development and movement of AEWs in collaboration with extra-tropical disturbances. In addition, the variations of soil properties in these source areas (rainfall, vegetation cover, or land use) coupled with the climate processes that affect them will act to modulate transport to receptor sites in the Western Atlantic [69].
In Figure 6, the presence of outliers is not systematic in the box-plot for each year. June 2020 stands out with a value at 453 μ g . m 3 the 23rd related to P M 10 peak concentration of the so-called “Godzilla” event. This value is 9 times higher than the 50 μ g . m 3 recommended by the World Health Organization over a 24 h period [70].
In Table 4, June 2020 exhibits the highest values for mean, standard deviation, skewness, and kurtosis. This clearly shows the exceptional criterion of this month. During this month, P M 10 daily concentrations are not high, except from the 20th to the 29th when [ P M 10 ] 50 μ g . m 3 for 9 consecutive days. Apart from the intensity of a dust event, it is important to emphasize its duration. Taking the example of June 2012, which has the second highest average, we see that [ P M 10 ] 35 μ g . m 3 for 21 days out of 30. However, among the 14 days when [ P M 10 ] 50 μ g . m 3 , the longest event is 5 consecutive days between the 1st and the 5th. For large-scale phenomena such as African dust, it seems that the more intense the event is, the longer its duration will be.
In order to quantify the impact of June 2020 event on a meteorological parameter in the Caribbean, the visibility has been used. The Pearson correlation coefficient computed between P M 10 and visibility is R = 0.8 , i.e., strong anti-correlation. Figure 7 illustrates the behavior of P M 10 concentrations and visibility data in GPE for June 2020.
During the first 18 days of the month there is no dusty event. Thus, P M 10 average values are almost constant with small standard deviations highlighting the value of the background atmosphere. By contrast, due to the lack of turbidity, visibility average values and their standard deviations are high. From the 19th to the 24th, one can clearly see that the passage of the event has a significant impact on visibility. Due to the persistence and intensity of the event, the standard deviations values are, respectively, minimum for the visibility and maximum for P M 10 . On the 22nd, the higher value of P M 10 (317 μ g . m 3 ) corresponds to the weaker value of visibility (9 km). During the strong dusty event from 19th to 23th June 1994 in GPE, the visibility also decreased to 9 km [71]. Note that the June 2020 event occurred during the same period as the June 1994 event.
Between GPE and PR, there is a one day lag for the peak of the event at PR, however the intensity is greater at PR. For the lag, this is due to the fact that PR is further from the African coast than GPE. Regarding the intensity, the mechanisms explaining this difference will be analyzed in a future study.

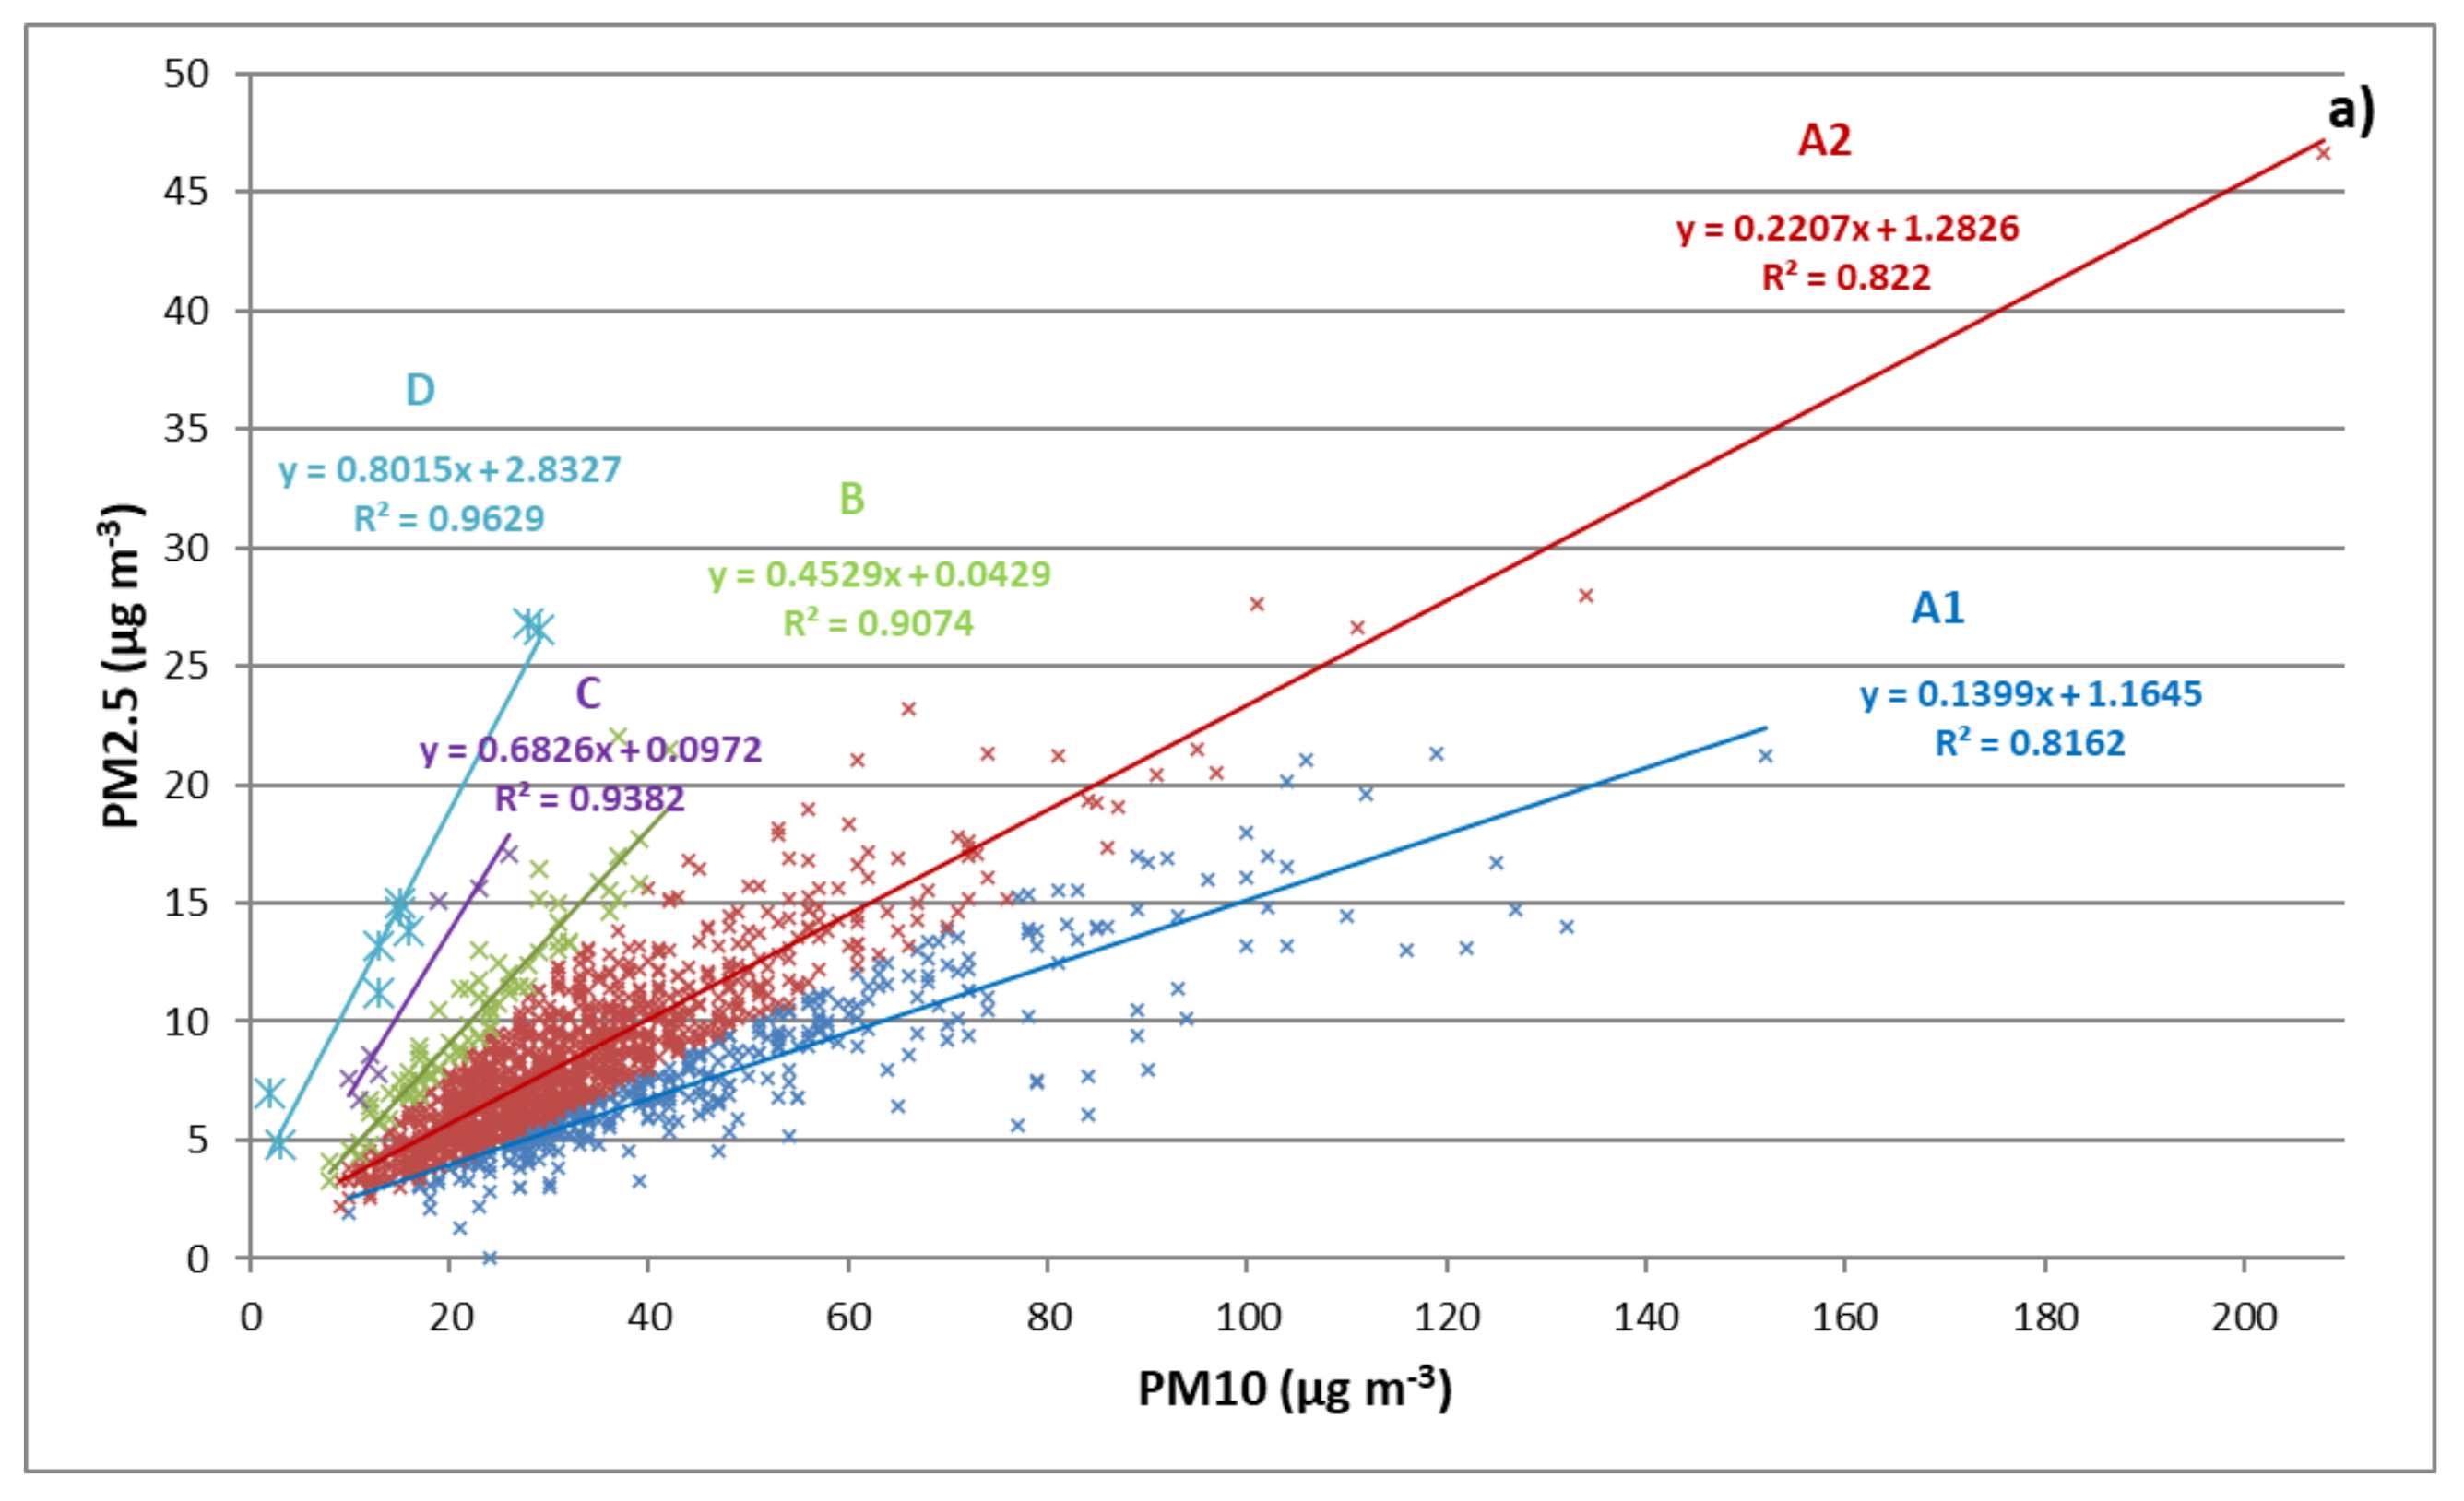
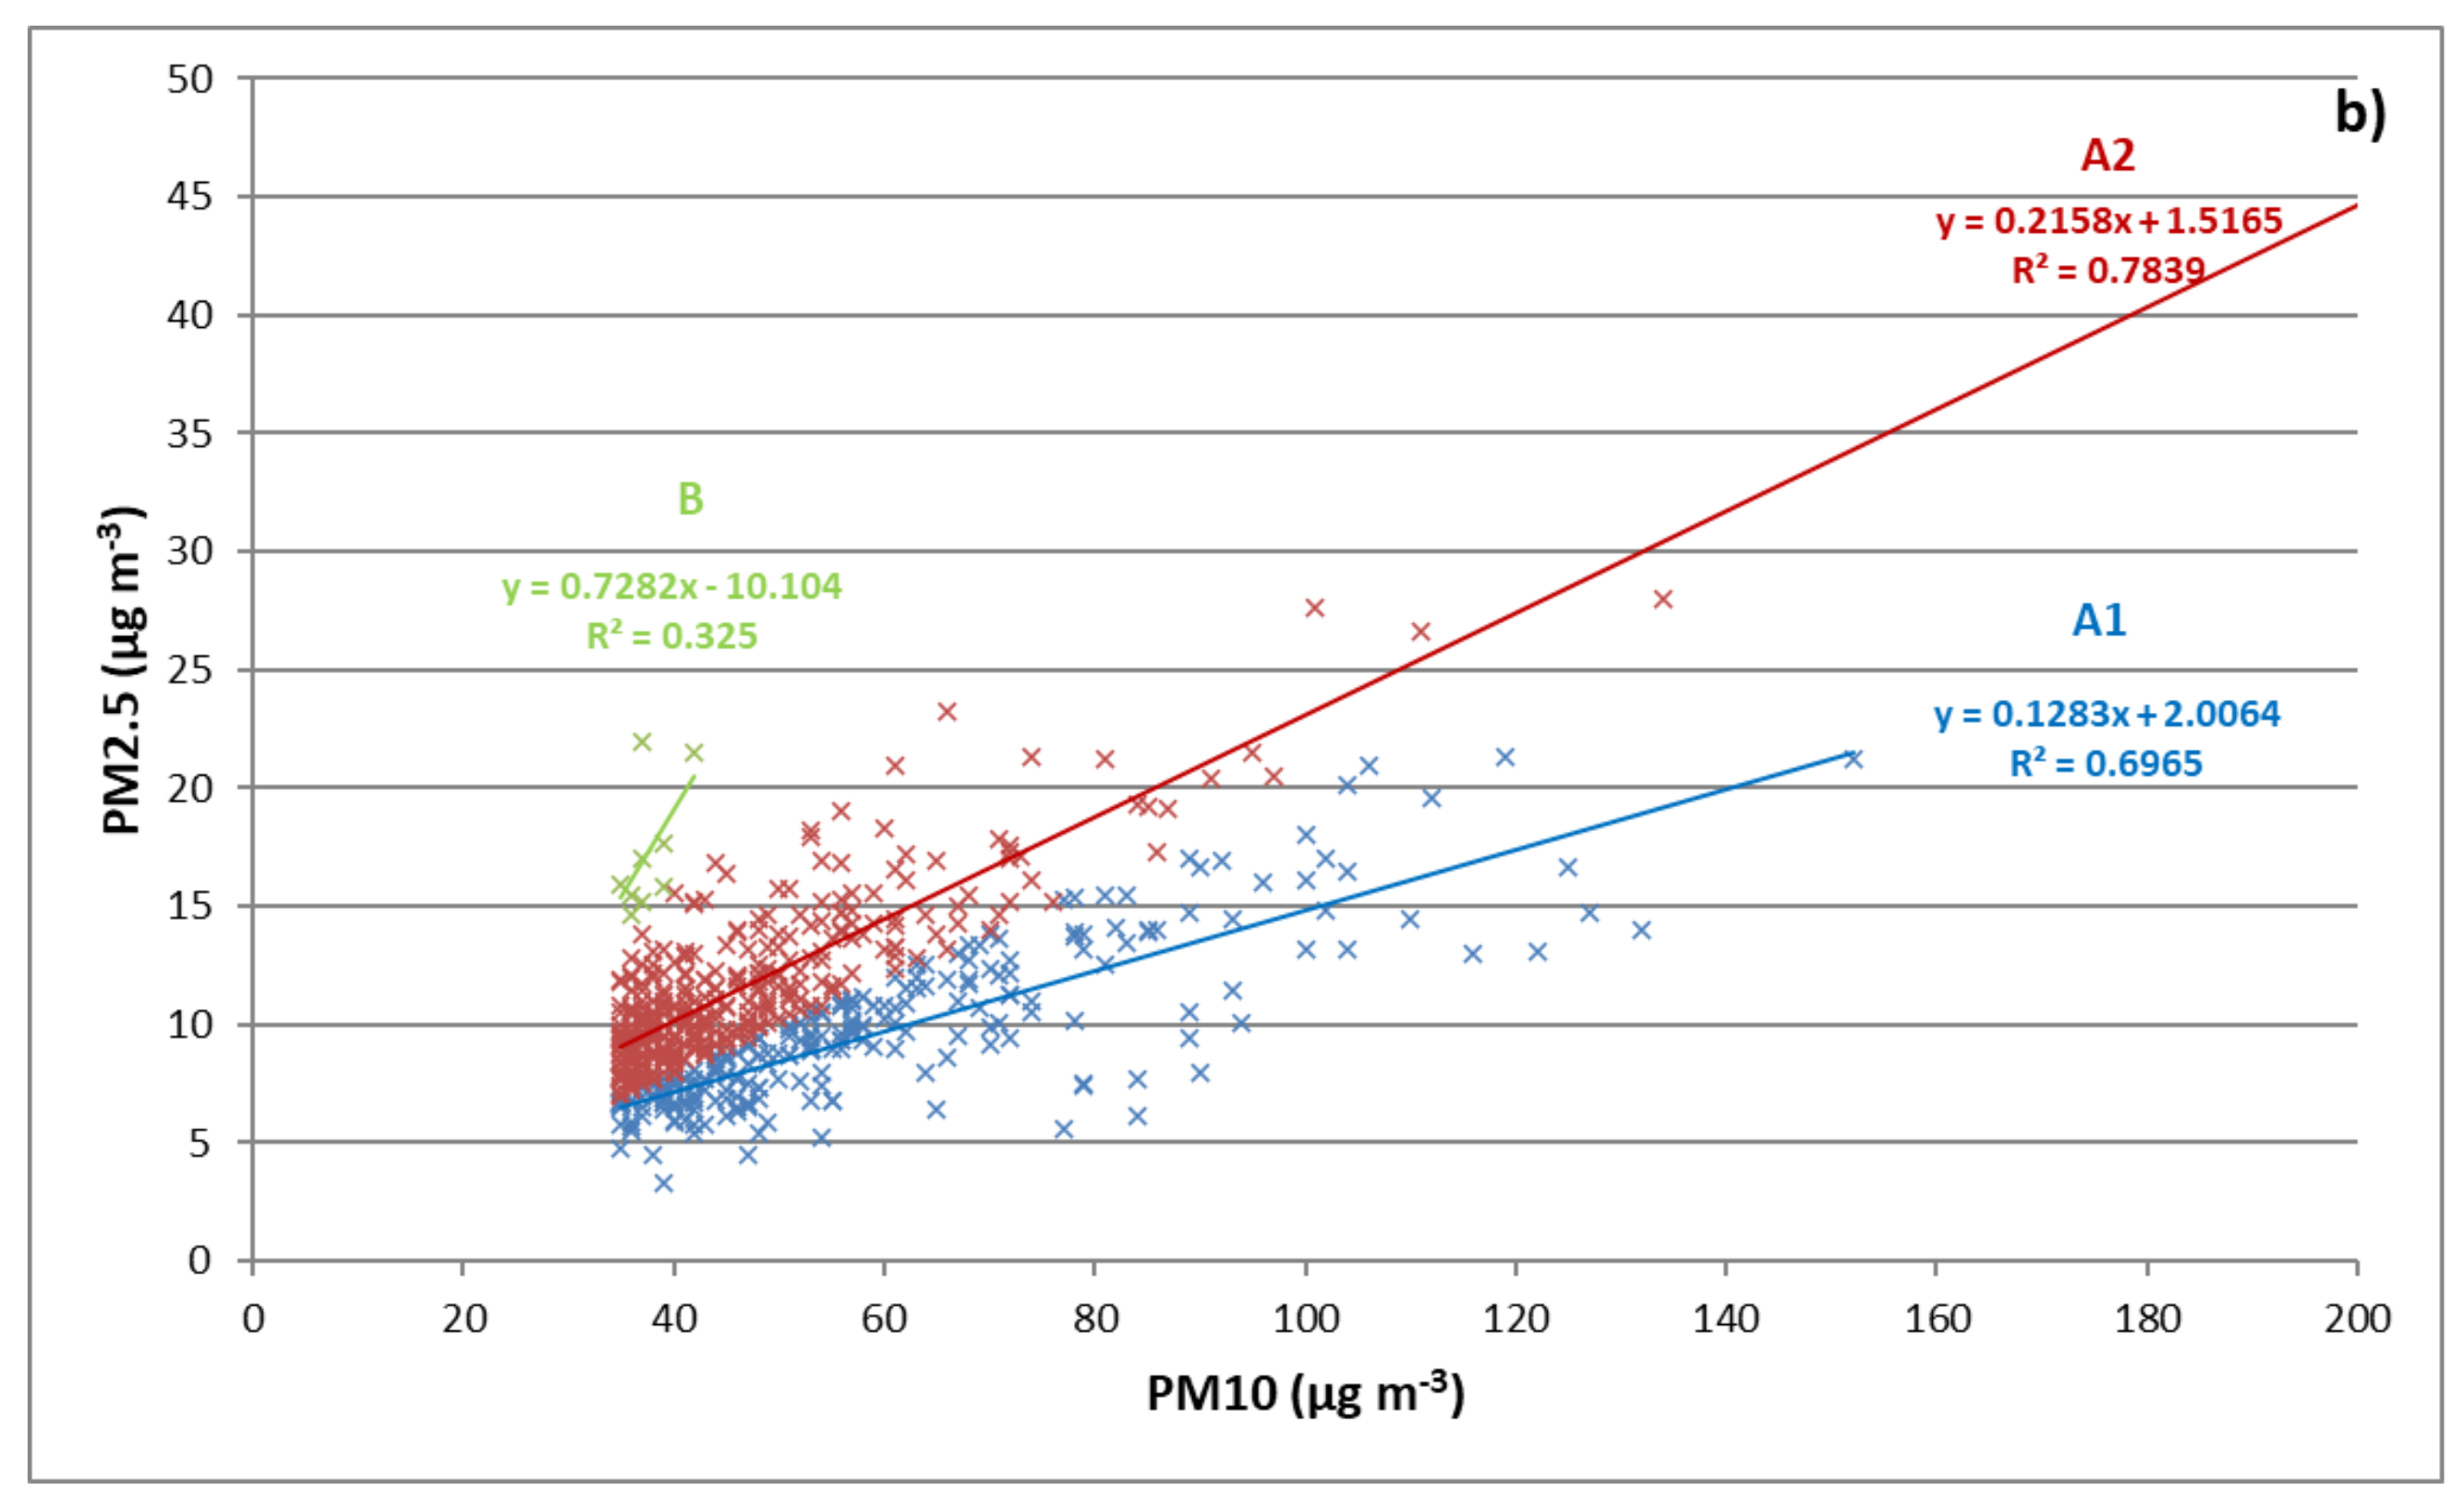
3.4.2. Relationship between PM2.5/PM10 Ratio and VPSD

Before analyzing the relationship between the P M ratio and the VPSD, it is essential to first investigate P M 2.5 and P M 10 behavior. From 2000 to 2020, the Pearson correlation coefficient between P M 2.5 and P M 10 is R = 0.73 . Figure 8 illustrates the monthly average concentrations for P M 2.5 and P M 10 highlighting a representative year over two decades. Overall, one can observe that P M 2.5 and P M 10 concentrations seem to follow the same temporal pattern. The highest P M 2.5 value corresponds to the highest P M 10 value (or vice versa). The impact of the dusty episodes in May and June clearly stands out. For May, P M 2.5 and P M 10 concentrations are, respectively, 8.8 and 33.7 μ g . m 3 ; in June, they are, respectively, 10.3 and 48.2 μ g . m 3 . It is relevant to emphasize that the standard deviations are weaker for the low dust season. Therefore, it can be reasonably considered that these two quantities are influenced by common factors. Nevertheless, we underline that from August to November, the P M 2.5 P M 10 curves seem to diverge slightly. The origin of this phenomenon will be analyzed in a future study.
Analysis of P M 2.5 proportion in P M 10 ( P M 2.5 / P M 10 ratio) leads to improve the characterization of the dust events by giving it a health significance. Some studies carried out in the Mediterranean [72,73] and in Asia [74] highlighted fine particle emissions in highly industrialized areas. For the Caribbean zone, we deepened our analysis on P M 2.5 / P M 10 by refining the following ratios:
  • A1: ratio < 0.2;
  • A2: 0.2 ≤ ratio < 0.4;
  • B: 0.4 ≤ ratio < 0.6;
  • C: 0.6 ≤ ratio < 0.8;
  • D: ratio ≥ 0.8.
Figure 9, Figure 10 and Figure 11 show three kinds of particle analysis: (i) P M 2.5 versus P M 10 sorted by previously defined ratio groups, (ii) the corresponding VPSD, and (iii) AE versus AOD for these ratios. This multiple approach allows us to determine the nature of the particles based on the known classification “VPSD” and “AE versus AOD”, while evaluating the potential health risk linked to the proportion of P M 2.5 in P M 10 . Indeed, the higher the P M 2.5 , the more harmful the health effects, especially for people with respiratory diseases and asthma [75,76]. Our multi-analysis shows two specific situations from 2000 to 2020: all cases (Figure 9a, Figure 10a and Figure 11a) and dusty cases ( [ P M 10 ] 35 μ g . m 3 ; Figure 9b, Figure 10b and Figure 11b).
Figure 9a illustrates the P M 2.5 against P M 10 classified according to the ratios for all cases. The linear regressions obtained highlight a good correlation between P M 2.5 and P M 10 with R 2 > 0.8:
  • For A1, as expected, the equation of the linear regression indicates that P M 2.5 values vary by approximately 0.14 as P M 10 increases by one unity, i.e., P M 2.5 is equivalent to 1/7 of P M 10 ;
  • For A2, P M 2.5 values vary by 0.22 as P M 10 increases by one unity, i.e., P M 2.5 is approximately equivalent to 1/4 of P M 10 ;
  • For B, P M 2.5 represents almost half (≈0.50, i.e., 1/2) of P M 10 ;
  • For C and D (ratio ≥ 0.6), P M 10 values are low contrary to P M 2.5 . However, due to the few cases retrieved over the study period, the achieved results are not significant.
The VPSD curves in Figure 10a depict the main dominance of desert dust, i.e., most of peaks of concentration are at radius 2.24 μ m. Only the concentration levels stand out from each other. A1 and A2 show the highest values with, respectively, 0.080 and 0.060 μ m 3 μ m 2 . B and D correspond to approximately 0.045 μ m 3 μ m 2 . Then, C displays a more extended distribution with a low peak at 0.020 μ m 3 μ m 2 . Ultimately, B–C–D ratios proportionally have the largest part of P M 2.5 in P M 10 and also exhibit the lowest VPSD concentrations. This shows that the increase in VPSD concentration is more influenced by P M 10 than by P M 2.5 . Compared to A1-A2 groups, the B–C–D group represents few cases. Note that a number of cases associated with the D ratio occur mainly outside the high dust season: September–November and February–May. Cases associated with the B ratio occur throughout the year at low frequencies. From our point of view, we think that B-C cases could be linked to the same type of phenomenon, i.e., a weak dust episode coupled with an influence of anthropogenic origin. Finally, most cases of the C ratio are intermittent and occurred during the same period: March–April–May 2017. This reflects a particular and non-seasonal event. According to the literature, this behavior could be explained by the smoke plumes which come up from Central Africa and the Amazon/Orinoco, mainly during the February to April season, just before the ITCZ rains move north [77].
Figure 9b illustrates the P M 2.5 against P M 10 for dusty cases, i.e., [ P M 10 ] 35 μ g . m 3 [21]. In this analysis, only A1, A2, and B are concerned with pure dust episodes. The coefficient of determination between P M 2.5 and P M 10 remains high with R 2 = 0.7 and 0.8, respectively, for A1 and A2. Nevertheless, B displays R 2 = 0.3 with very few cases. As regards the VPSD graph (see Figure 10b), the peaks at 2.24 μ m are more significant: 0.125, 0.100, and 0.060 μ m 3 μ m 2 , respectively, for A1, A2, and B. Figure 4 and Figure 11a show that the case rates associated with dust, marine, and continental/BB aerosols are equivalent to, respectively, 22%, 65%, and 3%. The results from Figure 11b are presented in Table 5.
Pure daily dust episodes account for more than 51.75% of cases, and dusty events with a marine dominance represent 46.36%. On the other hand, continental/BB cases are less significant with approximately 2%. As the atmospheric background is mainly dominated by marine aerosols, the results seem consistent. One can assume that the more the part of P M 2.5 increases, the more important the marine influence is. Thus, A2 is more marked by the influence of marine aerosols than A1. This reinforces the postulate that dusty episodes are more significantly related to P M 10 than to P M 2.5 .

3.5. Thermodynamic Analysis of The Atmosphere

Back trajectories from the sites located in San Juan (PR) and Grantley Adams (BAR) provide information on the origin of the dust-laden air masses that generated the extreme natural pollution episode of 23 June 2020. These two stations are representative of the general thermodynamic structure of the Caribbean area. From the HYSPLIT model (see Figure 12a), one can notice that the back trajectories come from Africa, and they indicate significant air uplift occurred 9 days before (the 14th at ≈6000 m of altitude) in the source area border between Mali and Algeria, i.e., the main source referenced in the bibliography [43,71,78,79,80]. According to Cavalieri et al. [81] and Adams et al. [82], 6000 m is the maximum altitude corresponding to the mechanism for lifting particles. This result is consistent with Francis et al. [25] study using satellite imagery. In this study, the processes behind the lifting and transport of this intense dust storm have been identified. Due to an anomalous atmospheric circulation pattern in the mid-latitudes associated with a circum-global wavetrain, a subtropical high-pressure system to the west of the Saharan Heat Low developed [25]. This generated a continuous dust emissions from the Sahara the 14 to 19 June 2020.
The dust plumes are subsequently driven westward in high-altitude wind shears, thus crossing the Atlantic Ocean to the Caribbean Basin via the SAL. The latter presents thermodynamic characteristics associated with dry and hot air [3,41]. The soundings in Figure 12b,c illustrate the temperature and the humidity profile of a dusty atmosphere. On the right curve, it can be seen the sudden temperature inversion around 1600 m is associated with a strong drying out of the layer at the same altitude on the left curve. It is the base of the SAL. The second temperature inversion marks the top of the SAL, i.e., ≈5000 m. In other words, the thickness of the SAL is approximately 3400 m above the Caribbean area during this event. One can notice that the top of the SAL (≈5000 m) is much higher than what has already been reported in literature, i.e., ≈3400–3600 m [36,77,82]. In addition, the soundings also display the intensity and direction of the wind related to the altitudes of dust transport. The average value of wind speed measured in this layer is 15 m . s 1 with a northeast average direction. In Africa, Francis et al. [25] found a wind speed of 20 m . s 1 in the SAL. The difference between both values can be attributed to the distance between the sites. Nevertheless, due to the magnitude of this event, these values are greater than the 10 m . s 1 usually found in the SAL [36,71,77].

4. Conclusions

To conclude, this climatological analysis of the dusty events in the Caribbean area over the last 20 years highlighted the extreme intensity of the episode in June 2020 dubbed “Godzilla”. In addition to the recent meteorological study made by Francis et al. [25], we propose a particulate approach of this event through data measured from the surface ( P M 10 , P M 2.5 ) and the atmospheric column (AOD, AE, and VPSD). The peculiarity of the Caribbean Basin is the fact that both approaches correlate, which makes it a privileged field of study. Thus, the thresholds reported in our recent work [21] have been confirmed and different types of particles are characterized: sea salt aerosols (background atmosphere), mineral aerosols (dust events), and anthropogenic particles (rare case). The determination of the thresholds relating to the size of the particles provides information on their nature and their properties.
At synoptic scale, the magnitude of June 2020 event was clearly observed using satellite imagery. With 453 and 317 μ g . m 3 , respectively, measured at PR and GPE for P M 10 concentrations, this event reached daily values never recorded in the last 20 years, even for volcanic eruption (150 μ g . m 3 ). Due to this extreme event, the P M 10 and the atmospheric column (AOD and VPSD) analysis exhibited their maximum values for June 2020. From a thermodynamic point of view, we highlighted the exceptional characteristics of the SAL in terms of thickness and wind speed. This episode had a strong impact on the environment, as is evident from the visibility factor reported during the event. Therefore, it was crucial to characterize this phenomenon in terms of the size, concentration, and nature of the particles.
To the best of the authors’ knowledge, the influence of marine aerosols in dusty events has never been assessed before in the Caribbean Basin. In this study, this topic was analyzed in order to better understand their possible interaction with P M 2.5 which are more harmful than P M 10 . Our results showed that the more the proportion of P M 2.5 in P M 10 increases, the more the influence of sea salt aerosols is significant. In order to more precisely quantify the proportion of P M 2.5 in P M 10 , a transfer entropy analysis should be performed in a future study.

Author Contributions

Conceptualization, L.E.-C. and T.P.; methodology, L.E.-C. and T.P.; validation, T.P. and L.E.-C.; formal analysis, L.E.-C., T.P., and F.-N.B.; investigation, L.E.-C. and T.P.; resources, L.E.-C. and T.P.; data curation, F.-N.B., L.E.-C., and T.P.; writing—original draft preparation, L.E.-C. and T.P.; writing—review and editing, T.P. and L.E.-C.; visualization, T.P. and L.E.-C.; supervision, T.P.; project administration, T.P.; funding acquisition, T.P. All authors have read and agreed to the published version of the manuscript.

Funding

The authors declare that they have not received any fund for the present paper. The paper is the sole work of the authors and is not a part/product of any project.

Institutional Review Board Statement

Not applicable.

Informed Consent Statement

Not applicable.

Data Availability Statement

Publicly available datasets were analyzed in this study. This data can be found here: https://giovanni.gsfc.nasa.gov/giovanni/ (accessed on 20 January 2021); http://weather.uwyo.edu/upperair/sounding.html (accessed on 15 December 2020); https://www.ready.noaa.gov/index.php (accessed on 31 January 2021); https://aeronet.gsfc.nasa.gov/ (accessed on 10 March 2021). The other data presented are available on request from the corresponding author. The data are not publicly available due to privacy or ethical.

Acknowledgments

The authors are very grateful to the anonymous reviewers for their valuable comments and constructive suggestions, which helped us to improve the quality of the paper substantially. The MODIS dataset is considered in this study and retrieved from https://giovanni.gsfc.nasa.gov (accessed on 20 January 2021). Atmospheric sounding are provided by University of Wyoming and available on the website: http://weather.uwyo.edu/upperair/sounding.html (accessed on 15 December 2020). A special thanks to “Météo France” for the visibility factor dataset transmitted. Measurements at Guadeloupe are carried out with support from “Les Associations Agrées de la Qualité de l’Air” (AASQA): Gwad’Air; from the air quality network of Puerto Rico: “Air Now”. The authors gratefully acknowledge the NOAA Air Resources Laboratory (ARL) for the provision of the HYSPLIT transport and dispersion model and/or READY website (http://www.ready.noaa.gov) (accessed on 31 January 2021) used in this publication. The authors also gratefully acknowledge the NASA AERONET program for data used in this study: Jack Molinié (Guadeloupe), Olga Mayol-Bracero (Cape San Juan and Rio Piedras), Brent Holben (Barbados), Joseph Prospero (Ragged Point), Janae Csavina (NEON GUAN), Philippe Goloub (Capo Verde), Didier Tanri (Dakar), Carlos Toledano and Albert Ansmann (SAL TRACE), for their effort in establishing and maintaining their sites. Finally, many thanks to Paul Halton & Mark Jury for their discussions and Sylvio Laventure for mapping assistance.

Conflicts of Interest

The authors declare no conflict of interest.

References

  1. Bou Karam, D.; Flamant, C.; Knippertz, P.; Reitebuch, O.; Pelon, J.; Chong, M.; Dabas, A. Dust emissions over the Sahel associated with the West African monsoon intertropical discontinuity region: A representative case-study. Q. J. R. Meteorol. Soc. A J. Atmos. Sci. Appl. Meteorol. Phys. Oceanogr. 2008, 134, 621–634. [Google Scholar] [CrossRef] [Green Version]
  2. Huneeus, N.; Schulz, M.; Balkanski, Y.; Griesfeller, J.; Prospero, J.; Kinne, S.; Bauer, S.; Boucher, O.; Chin, M.; Dentener, F.; et al. Global dust model intercomparison in AeroCom phase I. Atmos. Chem. Phys. 2011, 11, 7781–7816. [Google Scholar]
  3. Prospero, J.M.; Carlson, T.N. Vertical and areal distribution of Saharan dust over the western equatorial North Atlantic Ocean. J. Geophys. Res. 1972, 77, 5255–5265. [Google Scholar] [CrossRef] [Green Version]
  4. Van Der Does, M.; Korte, L.F.; Munday, C.I.; Brummer, G.J.A.; Stuut, J.B.W. Particle size traces modern Saharan dust transport and deposition across the equatorial North Atlantic. Atmos. Chem. Phys. 2016, 16, 13697–13710. [Google Scholar] [CrossRef] [Green Version]
  5. Gyan, K.; Henry, W.; Lacaille, S.; Laloo, A.; Lamsee-Ebanks, C.; McKay, S.; Antoine, R.; Monteil, M.A. African dust clouds are associated with increased paediatric asthma accident and emergency admissions on the Caribbean island of Trinidad. Int. J. Biometeorol. 2005, 49, 371–376. [Google Scholar] [CrossRef]
  6. Ramírez-Romero, C.; Jaramillo, A.; Córdoba, M.F.; Raga, G.B.; Miranda, J.; Alvarez-Ospina, H.; Rosas, D.; Amador, T.; Kim, J.S.; Yakobi-Hancock, J.; et al. African dust particles over the western Caribbean–Part I: Impact on air quality over the Yucatán Peninsula. Atmos. Chem. Phys. 2021, 21, 239–253. [Google Scholar] [CrossRef]
  7. Gurung, A.; Son, J.Y.; Bell, M.L. Particulate matter and risk of hospital admission in the Kathmandu Valley, Nepal: A case-crossover study. Am. J. Epidemiol. 2017, 186, 573–580. [Google Scholar] [CrossRef] [PubMed]
  8. Zhang, J.; Liu, Y.; Cui, L.L.; Liu, S.Q.; Yin, X.X.; Li, H.C. Ambient air pollution, smog episodes and mortality in Jinan, China. Sci. Rep. 2017, 7, 1–8. [Google Scholar]
  9. Momtazan, M.; Geravandi, S.; Rastegarimehr, B.; Valipour, A.; Ranjbarzadeh, A.; Yari, A.R.; Dobaradaran, S.; Bostan, H.; Farhadi, M.; Darabi, F.; et al. An investigation of particulate matter and relevant cardiovascular risks in Abadan and Khorramshahr in 2014–2016. Toxin Rev. 2019, 38, 290–297. [Google Scholar] [CrossRef]
  10. Feng, W.; Li, H.; Wang, S.; Van Halm-Lutterodt, N.; An, J.; Liu, Y.; Liu, M.; Wang, X.; Guo, X. Short-term PM10 and emergency department admissions for selective cardiovascular and respiratory diseases in Beijing, China. Sci. Total Environ. 2019, 657, 213–221. [Google Scholar] [CrossRef]
  11. Domínguez-Rodríguez, A.; Báez-Ferrer, N.; Abreu-González, P.; Rodríguez, S.; Díaz, R.; Avanzas, P.; Hernández-Vaquero, D. Impact of Desert Dust Events on the Cardiovascular Disease: A Systematic Review and Meta-Analysis. J. Clin. Med. 2021, 10, 727. [Google Scholar] [CrossRef] [PubMed]
  12. Tegen, I.; Lacis, A.A.; Fung, I. The influence on climate forcing of mineral aerosols from disturbed soils. Nature 1996, 380, 419. [Google Scholar] [CrossRef]
  13. Miller, R.; Tegen, I. Climate response to soil dust aerosols. J. Clim. 1998, 11, 3247–3267. [Google Scholar] [CrossRef]
  14. Choobari, O.A.; Zawar-Reza, P.; Sturman, A. The global distribution of mineral dust and its impacts on the climate system: A review. Atmos. Res. 2014, 138, 152–165. [Google Scholar] [CrossRef]
  15. Schepanski, K. Transport of mineral dust and its impact on climate. Geosciences 2018, 8, 151. [Google Scholar] [CrossRef] [Green Version]
  16. Plocoste, T.; Calif, R.; Euphrasie-Clotilde, L.; Brute, F.N. Investigation of local correlations between particulate matter (PM10) and air temperature in the Caribbean basin using Ensemble Empirical Mode Decomposition. Atmos. Pollut. Res. 2020, 11, 1692–1704. [Google Scholar] [CrossRef]
  17. Plocoste, T.; Pavón-Domínguez, P. Temporal scaling study of particulate matter (PM10) and solar radiation influences on air temperature in the Caribbean basin using a 3D joint multifractal analysis. Atmos. Environ. 2020, 222, 117115. [Google Scholar] [CrossRef]
  18. Dunion, J.P.; Velden, C.S. The impact of the Saharan air layer on Atlantic tropical cyclone activity. Bull. Am. Meteorol. Soc. 2004, 85, 353–366. [Google Scholar] [CrossRef] [Green Version]
  19. Zhang, H.; McFarquhar, G.M.; Saleeby, S.M.; Cotton, W.R. Impacts of Saharan dust as CCN on the evolution of an idealized tropical cyclone. Geophys. Res. Lett. 2007, 34. [Google Scholar] [CrossRef] [Green Version]
  20. Prospero, J.M.; Collard, F.X.; Molinié, J.; Jeannot, A. Characterizing the annual cycle of African dust transport to the Caribbean Basin and South America and its impact on the environment and air quality. Glob. Biogeochem. Cycles 2014, 28, 757–773. [Google Scholar] [CrossRef]
  21. Euphrasie-Clotilde, L.; Plocoste, T.; Feuillard, T.; Velasco-Merino, C.; Mateos, D.; Toledano, C.; Brute, F.N.; Bassette, C.; Gobinddass, M. Assessment of a new detection threshold for PM10 concentrations linked to African dust events in the Caribbean Basin. Atmos. Environ. 2020, 224, 117354. [Google Scholar] [CrossRef]
  22. Plocoste, T.; Carmona-Cabezas, R.; Jiménez-Hornero, F.J.; Gutiérrez de Ravé, E.; Calif, R. Multifractal characterisation of particulate matter (PM10) time series in the Caribbean basin using visibility graphs. Atmos. Pollut. Res. 2021, 12, 100–110. [Google Scholar] [CrossRef]
  23. Karyampudi, V.M.; Palm, S.P.; Reagen, J.A.; Fang, H.; Grant, W.B.; Hoff, R.M.; Moulin, C.; Pierce, H.F.; Torres, O.; Browell, E.V.; et al. Validation of the Saharan dust plume conceptual model using lidar, Meteosat, and ECMWF data. Bull. Am. Meteorol. Soc. 1999, 80, 1045–1076. [Google Scholar] [CrossRef] [Green Version]
  24. Prospero, J.M.; Lamb, P.J. African droughts and dust transport to the Caribbean: Climate change implications. Science 2003, 302, 1024–1027. [Google Scholar] [CrossRef]
  25. Francis, D.; Fonseca, R.; Nelli, N.; Cuesta, J.; Weston, M.; Evan, A.; Temimi, M. The Atmospheric Drivers of the Major Saharan Dust Storm in June 2020. Geophys. Res. Lett. 2020, 47, e2020GL090102. [Google Scholar] [CrossRef]
  26. Remini, B. Awesome, the dust of the sahara in the sky of the america continent. Godzilla, the biggest dust storm in half a century. LARHYSS J. 2020, 43, 139–167. [Google Scholar]
  27. Wu, Y.; Graaf, M.D.; Menenti, M. Improved MODIS Dark Target aerosol optical depth algorithm over land: Angular effect correction. Atmos. Meas. Tech. 2016, 9, 5575–5589. [Google Scholar] [CrossRef] [Green Version]
  28. Holben, B.N.; Eck, T.F.; Slutsker, I.; Tanre, D.; Buis, J.; Setzer, A.; Vermote, E.; Reagan, J.A.; Kaufman, Y.; Nakajima, T.; et al. AERONET—A federated instrument network and data archive for aerosol characterization. Remote Sens. Environ. 1998, 66, 1–16. [Google Scholar] [CrossRef]
  29. Dubovik, O.; Holben, B.; Eck, T.F.; Smirnov, A.; Kaufman, Y.J.; King, M.D.; Tanré, D.; Slutsker, I. Variability of absorption and optical properties of key aerosol types observed in worldwide locations. J. Atmos. Sci. 2002, 59, 590–608. [Google Scholar] [CrossRef]
  30. Dubovik, O.; Holben, B.; Lapyonok, T.; Sinyuk, A.; Mishchenko, M.; Yang, P.; Slutsker, I. Non-spherical aerosol retrieval method employing light scattering by spheroids. Geophys. Res. Lett. 2002, 29, 54-1–54-4. [Google Scholar] [CrossRef] [Green Version]
  31. Dubovik, O.; Smirnov, A.; Holben, B.; King, M.; Kaufman, Y.; Eck, T.; Slutsker, I. Accuracy assessments of aerosol optical properties retrieved from Aerosol Robotic Network (AERONET) Sun and sky radiance measurements. J. Geophys. Res. Atmos. 2000, 105, 9791–9806. [Google Scholar] [CrossRef] [Green Version]
  32. Ozer, P.; Laghdaf, M.B.O.M.; Lemine, S.O.M.; Gassani, J. Estimation of air quality degradation due to Saharan dust at Nouakchott, Mauritania, from horizontal visibility data. Water Air Soil Pollut. 2007, 178, 79–87. [Google Scholar] [CrossRef] [Green Version]
  33. Stein, A.; Draxler, R.R.; Rolph, G.D.; Stunder, B.J.; Cohen, M.; Ngan, F. NOAA’s HYSPLIT atmospheric transport and dispersion modeling system. Bull. Am. Meteorol. Soc. 2015, 96, 2059–2077. [Google Scholar] [CrossRef]
  34. Rolph, G.; Stein, A.; Stunder, B. Real-time environmental applications and display sYstem: READY. Environ. Model. Softw. 2017, 95, 210–228. [Google Scholar] [CrossRef]
  35. Stohl, A. Computation, accuracy and applications of trajectories—A review and bibliography. Atmos. Environ. 1998, 32, 947–966. [Google Scholar] [CrossRef]
  36. Dunion, J.P. Rewriting the climatology of the tropical North Atlantic and Caribbean Sea atmosphere. J. Clim. 2011, 24, 893–908. [Google Scholar] [CrossRef]
  37. Gläser, G.; Wernli, H.; Kerkweg, A.; Teubler, F. The transatlantic dust transport from North Africa to the Americas—Its characteristics and source regions. J. Geophys. Res. Atmos. 2015, 120, 11–231. [Google Scholar] [CrossRef] [Green Version]
  38. García, M.I.; Rodriguez, S.; Alastuey, A. Impact of North America on the aerosol composition in the North Atlantic free troposphere. Atmos. Chem. Phys. 2017, 17, 7387. [Google Scholar] [CrossRef] [Green Version]
  39. Kalnay, E.; Kanamitsu, M.; Kistler, R.; Collins, W.; Deaven, D.; Gandin, L.; Iredell, M.; Sana, S.; White, G.; Woollen, J.; et al. The NCEP/NCAR 40-year reanalysis project. Bull. Am. Meteorol. Soc. 1996, 77, 437–472. [Google Scholar] [CrossRef] [Green Version]
  40. Plocoste, T.; Carmona-Cabezas, R.; Jiménez-Hornero, F.J.; Gutiérrez de Ravé, E. Background PM10 atmosphere: In the seek of a multifractal characterization using complex networks. J. Aerosol Sci. 2021, 155, 105777. [Google Scholar] [CrossRef]
  41. Carlson, T.N.; Prospero, J.M. The large-scale movement of Saharan air outbreaks over the northern equatorial Atlantic. J. Appl. Meteorol. Climatol. 1972, 11, 283–297. [Google Scholar] [CrossRef]
  42. Zuidema, P.; Alvarez, C.; Kramer, S.J.; Custals, L.; Izaguirre, M.; Sealy, P.; Prospero, J.M.; Blades, E. Is summer African dust arriving earlier to Barbados? The updated long-term in situ dust mass concentration time series from Ragged Point, Barbados, and Miami, Florida. Bull. Am. Meteorol. Soc. 2019, 100, 1981–1986. [Google Scholar] [CrossRef]
  43. Clergue, C.; Dellinger, M.; Buss, H.; Gaillardet, J.; Benedetti, M.; Dessert, C. Influence of atmospheric deposits and secondary minerals on Li isotopes budget in a highly weathered catchment, Guadeloupe (Lesser Antilles). Chem. Geol. 2015, 414, 28–41. [Google Scholar] [CrossRef] [Green Version]
  44. Rastelli, E.; Corinaldesi, C.; Dell’Anno, A.; Martire, M.L.; Greco, S.; Facchini, M.C.; Rinaldi, M.; O’Dowd, C.; Ceburnis, D.; Danovaro, R. Transfer of labile organic matter and microbes from the ocean surface to the marine aerosol: An experimental approach. Sci. Rep. 2017, 7, 11475. [Google Scholar] [CrossRef]
  45. Smirnov, A.; Holben, B.; Savoie, D.; Prospero, J.; Kaufman, Y.; Tanre, D.; Eck, T.; Slutsker, I. Relationship between column aerosol optical thickness and in situ ground based dust concentrations over Barbados. Geophys. Res. Lett. 2000, 27, 1643–1646. [Google Scholar] [CrossRef] [Green Version]
  46. Velasco-Merino, C.; Mateos, D.; Toledano, C.; Prospero, J.M.; Molinie, J.; Euphrasie-Clotilde, L.; González, R.; Cachorro, V.E.; Calle, A.; Frutos, A.M.D. Impact of long-range transport over the Atlantic Ocean on Saharan dust optical and microphysical properties based on AERONET data. Atmos. Chem. Phys. 2018, 18, 9411–9424. [Google Scholar] [CrossRef] [Green Version]
  47. Jang, H.N.; Seo, Y.C.; Lee, J.H.; Hwang, K.W.; Yoo, J.I.; Sok, C.H.; Kim, S.H. Formation of fine particles enriched by V and Ni from heavy oil combustion: Anthropogenic sources and drop-tube furnace experiments. Atmos. Environ. 2007, 41, 1053–1063. [Google Scholar] [CrossRef]
  48. Toledano, C.; Cachorro, V.; Berjon, A.; De Frutos, A.; Sorribas, M.; De la Morena, B.; Goloub, P. Aerosol optical depth and Ångström exponent climatology at El Arenosillo AERONET site (Huelva, Spain). Q. J. R. Meteorol. Soc. A J. Atmos. Sci. Appl. Meteorol. Phys. Oceanogr. 2007, 133, 795–807. [Google Scholar] [CrossRef]
  49. Plocoste, T.; Calif, R.; Jacoby-Koaly, S. Temporal multiscaling characteristics of particulate matter PM10 and ground-level ozone O3 concentrations in Caribbean region. Atmos. Environ. 2017, 169, 22–35. [Google Scholar] [CrossRef]
  50. Plocoste, T.; Dorville, J.F.; Monjoly, S.; Jacoby-Koaly, S.; André, M. Assessment of Nitrogen Oxides and Ground-Level Ozone behavior in a dense air quality station network: Case study in the Lesser Antilles Arc. J. Air Waste Manag. Assoc. 2018, 68, 1278–1300. [Google Scholar] [CrossRef] [PubMed] [Green Version]
  51. Plocoste, T.; Calif, R. Spectral Observations of PM10 Fluctuations in the Hilbert Space. In Functional Calculus; IntechOpen: Rijeka, Croatia, 2019; pp. 1–13. [Google Scholar]
  52. Sellegri, K.; Gourdeau, J.; Putaud, J.P.; Despiau, S. Chemical composition of marine aerosol in a Mediterranean coastal zone during the FETCH experiment. J. Geophys. Res. Atmos. 2001, 106, 12023–12037. [Google Scholar] [CrossRef] [Green Version]
  53. Román, R.; Benavent-Oltra, J.A.; Casquero-Vera, J.; Lopatin, A.; Cazorla, A.; Lyamani, H.; Denjean, C.; Fuertes, D.; Pérez-Ramírez, D.; Torres, B.; et al. Retrieval of aerosol profiles combining sunphotometer and ceilometer measurements in GRASP code. Atmos. Res. 2018, 204, 161–177. [Google Scholar] [CrossRef] [Green Version]
  54. D’Almeida, G.A. A model for Saharan dust transport. J. Appl. Meteorol. Climatol. 1986, 25, 903–916. [Google Scholar] [CrossRef] [Green Version]
  55. Brooks, N.; Legrand, M. Dust variability over northern Africa and rainfall in the Sahel. In Linking Climate Change to Land Surface Change; Springer: New York, NY, USA, 2000; pp. 1–25. [Google Scholar]
  56. Middleton, N.; Goudie, A. Saharan dust: Sources and trajectories. Trans. Inst. Br. Geogr. 2001, 26, 165–181. [Google Scholar] [CrossRef]
  57. Chiapello, I.; Moulin, C. TOMS and METEOSAT satellite records of the variability of Saharan dust transport over the Atlantic during the last two decades (1979–1997). Geophys. Res. Lett. 2002, 29, 17-1–17-4. [Google Scholar] [CrossRef]
  58. Koren, I.; Joseph, J.H.; Israelevich, P. Detection of dust plumes and their sources in northeastern Libya. Can. J. Remote Sens. 2003, 29, 792–796. [Google Scholar] [CrossRef]
  59. Schepanski, K.; Tegen, I.; Macke, A. Saharan dust transport and deposition towards the tropical northern Atlantic. Atmos. Chem. Phys. 2009, 9, 1173–1189. [Google Scholar] [CrossRef] [Green Version]
  60. Huang, J.; Zhang, C.; Prospero, J.M. African dust outbreaks: A satellite perspective of temporal and spatial variability over the tropical Atlantic Ocean. J. Geophys. Res. Atmos. 2010, 115. [Google Scholar] [CrossRef] [Green Version]
  61. Formenti, P.; Schütz, L.; Balkanski, Y.; Desboeufs, K.; Ebert, M.; Kandler, K.; Petzold, A.; Scheuvens, D.; Weinbruch, S.; Zhang, D. Recent progress in understanding physical and chemical properties of African and Asian mineral dust. Atmos. Chem. Phys. 2011, 11, 8231–8256. [Google Scholar] [CrossRef] [Green Version]
  62. Burgos, M.A.; Mateos, D.; Cachorro, V.E.; Toledano, C.; de Frutos, A. Aerosol properties of mineral dust and its mixtures in a regional background of north-central Iberian Peninsula. Sci. Total Environ. 2016, 572, 1005–1019. [Google Scholar] [CrossRef] [Green Version]
  63. Engel-Cox, J.A.; Holloman, C.H.; Coutant, B.W.; Hoff, R.M. Qualitative and quantitative evaluation of MODIS satellite sensor data for regional and urban scale air quality. Atmos. Environ. 2004, 38, 2495–2509. [Google Scholar] [CrossRef]
  64. Wang, J.; Christopher, S.A.; Reid, J.S.; Maring, H.; Savoie, D.; Holben, B.N.; Livingston, J.M.; Russell, P.B.; Yang, S.K. GOES 8 retrieval of dust aerosol optical thickness over the Atlantic Ocean during PRIDE. J. Geophys. Res. Atmos. 2003, 108. [Google Scholar] [CrossRef]
  65. Wang, C.; Zhang, Z.; Yue, S. Correlating aerosol optical thickness measurement with PM10 mass concentration in Wuhan area. In Proceedings of the 2011 International Conference on Optical Instruments and Technology: Optoelectronic Measurement Technology and Systems, Beijing, China, 6–9 November 2011; International Society for Optics and Photonics: San Diego, CA, USA, 2011; Volume 8201, p. 82010D. [Google Scholar]
  66. European Union. Directive 2008/50/EC of the European Parliament and of the Council of 21 May 2008 on ambient air quality and cleaner air for Europe. Off. J. Eur. Union 2008, 108, 1–44. [Google Scholar]
  67. Plocoste, T.; Calif, R.; Euphrasie-Clotilde, L.; Brute, F. The statistical behavior of PM10 events over guadeloupean archipelago: Stationarity, modelling and extreme events. Atmos. Res. 2020, 241, 104956. [Google Scholar] [CrossRef]
  68. Knippertz, P.; Todd, M.C. The central west Saharan dust hot spot and its relation to African easterly waves and extratropical disturbances. J. Geophys. Res. Atmos. 2010, 115. [Google Scholar] [CrossRef] [Green Version]
  69. Ginoux, P.; Prospero, J.M.; Gill, T.E.; Hsu, N.C.; Zhao, M. Global-scale attribution of anthropogenic and natural dust sources and their emission rates based on MODIS Deep Blue aerosol products. Rev. Geophys. 2012, 50. [Google Scholar] [CrossRef]
  70. World Health Organization. Review of Evidence on Health Aspects of Air Pollution—REVIHAAP Project; Technical Report; WHO Regional Office for Europe: Copenhagen, Denmark, 2013. [Google Scholar]
  71. Petit, R.; Legrand, M.; Jankowiak, I.; Molinié, J.; Asselin de Beauville, C.; Marion, G.; Mansot, J. Transport of Saharan dust over the Caribbean Islands: Study of an event. J. Geophys. Res. Atmos. 2005, 110, D18S09. [Google Scholar] [CrossRef]
  72. Evagelopoulos, V.; Zoras, S.; Triantafyllou, A.; Albanis, T. PM10-PM2. 5 time series and fractal analysis. Glob. NEST J. 2006, 8, 234–240. [Google Scholar]
  73. Koçak, M.; Mihalopoulos, N.; Kubilay, N. Contributions of natural sources to high PM10 and PM2.5 events in the eastern Mediterranean. Atmos. Environ. 2007, 41, 3806–3818. [Google Scholar] [CrossRef]
  74. Xu, G.; Jiao, L.; Zhang, B.; Zhao, S.; Yuan, M.; Gu, Y.; Liu, J.; Tang, X. Spatial and temporal variability of the PM2.5/PM10 ratio in Wuhan, Central China. Aerosol Air Qual. Res. 2017, 17, 741–751. [Google Scholar] [CrossRef] [Green Version]
  75. Querol, X.; Alastuey, A.; Rodriguez, S.; Plana, F.; Ruiz, C.R.; Cots, N.; Massagué, G.; Puig, O. PM10 and PM2.5 source apportionment in the Barcelona Metropolitan area, Catalonia, Spain. Atmos. Environ. 2001, 35, 6407–6419. [Google Scholar] [CrossRef]
  76. Zapata, C.; Cano, N.; Ramirez, M. PM2.5/PM10 relationship in the Metropolitan Area of Valle de Aburrá, Colombia. Air Pollut. XXIV 2016, 207, 111. [Google Scholar]
  77. Jury, M.R.; Jiménez, A.T.N. Tropical Atlantic dust and the zonal circulation. Theor. Appl. Climatol. 2021, 143, 901–913. [Google Scholar] [CrossRef]
  78. Shinn, E.A.; Smith, G.W.; Prospero, J.M.; Betzer, P.; Hayes, M.L.; Garrison, V.; Barber, R.T. African dust and the demise of Caribbean coral reefs. Geophys. Res. Lett. 2000, 27, 3029–3032. [Google Scholar] [CrossRef] [Green Version]
  79. Colarco, P.; Toon, O.; Holben, B. Saharan dust transport to the Caribbean during PRIDE: 1. Influence of dust sources and removal mechanisms on the timing and magnitude of downwind aerosol optical depth events from simulations of in situ and remote sensing observations. J. Geophys. Res. Atmos. 2003, 108. [Google Scholar] [CrossRef]
  80. Reid, J.S.; Kinney, J.E.; Westphal, D.L.; Holben, B.N.; Welton, E.J.; Tsay, S.C.; Eleuterio, D.P.; Campbell, J.R.; Christopher, S.A.; Colarco, P.; et al. Analysis of measurements of Saharan dust by airborne and ground-based remote sensing methods during the Puerto Rico Dust Experiment (PRIDE). J. Geophys. Res. Atmos. 2003, 108. [Google Scholar] [CrossRef]
  81. Cavalieri, O.; Cairo, F.; Fierli, F.; Donfrancesco, G.D.; Snels, M.; Viterbini, M.; Cardillo, F.; Chatenet, B.; Formenti, P.; Marticorena, B.; et al. Variability of aerosol vertical distribution in the Sahel. Atmos. Chem. Phys. 2010, 10, 12005–12023. [Google Scholar] [CrossRef] [Green Version]
  82. Adams, A.M.; Prospero, J.M.; Zhang, C. CALIPSO-derived three-dimensional structure of aerosol over the Atlantic Basin and adjacent continents. J. Clim. 2012, 25, 6862–6879. [Google Scholar] [CrossRef]
Figure 1. Overview of the Caribbean area with, respectively, from top to the bottom Puerto Rico ( 18.23 ° N, 66.50 ° W; PR in yellow), Guadeloupe archipelago ( 16.25 ° N, 61.58 ° W; GPE in orange), and Barbados ( 13.16 ° N, 59.55 ° W; BAR in green).
Atmosphere 12 00502 g001
Figure 2. Seasonal satellite images from MODIS for the North Atlantic area with AOD monthly average between 2000 and 2020 for (a) September to November (SON), (b) December to February (DJF), (c) March to May (MAM), and (d) June to August (JJA). [NASA GIOVANNI (https://giovanni.gsfc.nasa.gov/giovanni/) (accessed on 20 January 2021)].
Atmosphere 12 00502 g002
Figure 3. MODIS satellite image of the North Atlantic area with AOD values for the extreme event of June 2020. (NASA GIOVANNI (https://giovanni.gsfc.nasa.gov/giovanni/) (accessed on 20 January 2021)).
Atmosphere 12 00502 g003
Figure 4. AE (440–870 nm) versus AOD (440 nm) distribution for daily data from 1996 to 2021 for Caribbean sites located in PR, GPE and BAR. N represents the data point number.
Atmosphere 12 00502 g004
Figure 5. Volume Particles Size Distribution (VPSD) [ d V ( r ) / d l n ( r ) ( μ m 3 μ m 2 ) ] of monthly data for (a) African sites (Capo Verde and Dakar) and (b) Caribbean sites (PR, GPE, and BAR) from 1996 to 2021.
Atmosphere 12 00502 g005
Figure 6. P M 10 box-plot with medians and outliers in PR for daily data in June from 2006 to 2020.
Atmosphere 12 00502 g006
Figure 7. Daily average of P M 10 and visibility data in GPE for June 2020. Standard deviations are illustrated by the whiskers and the vertical dotted lines indicate the passage of the event.
Atmosphere 12 00502 g007
Figure 8. Monthly average of P M 2.5 and P M 10 concentrations in PR between 2000 and 2020. Standard deviations are illustrated by the whiskers.
Atmosphere 12 00502 g008
Figure 9. Scatter plot showing the correlation (linear regression) between daily P M 2.5 and P M 10 data in PR from 2000 to 2020 for (a) all cases and (b) dusty cases ( [ P M 10 ] 35 μ g . m 3 ) according to the following ratios: A1 = P M 2.5 / P M 10 < 0.2, A2 = 0.2 ≤ P M 2.5 / P M 10 < 0.4, B = 0.4 ≤ P M 2.5 / P M 10 < 0.6, C = 0.6 ≤ P M 2.5 / P M 10 < 0.8 and D = P M 2.5 / P M 10 ≥ 0.8.
Atmosphere 12 00502 g009aAtmosphere 12 00502 g009b
Figure 10. The Volume Particles Size Distribution (VPSD) in PR from 2000 to 2020 for (a) all cases and (b) dusty cases ( [ P M 10 ] 35 μ g . m 3 ) according to the following ratios: A1 = P M 2.5 / P M 10 < 0.2, A2 = 0.2 ≤ P M 2.5 / P M 10 < 0.4, B = 0.4 ≤ P M 2.5 / P M 10 < 0.6, C = 0.6 ≤ P M 2.5 / P M 10 < 0.8 and D = P M 2.5 / P M 10 ≥ 0.8.
Atmosphere 12 00502 g010
Figure 11. AE (440–870 nm) versus AOD (440 nm) distribution in PR from 2000 to 2020 for (a) all cases and (b) dusty cases ( [ P M 10 ] 35 μ g . m 3 ) according to the following ratios: A1 = P M 2.5 / P M 10 < 0.2, A2 = 0.2 ≤ P M 2.5 / P M 10 < 0.4, B = 0.4 ≤ P M 2.5 / P M 10 < 0.6, C = 0.6 ≤ P M 2.5 / P M 10 < 0.8 and D = P M 2.5 / P M 10 ≥ 0.8.
Atmosphere 12 00502 g011
Figure 12. (a) NOAA HYSPLIT 10-day backward trajectories ending at San Juan (PR) and Grantley Adams (BAR) on 23 June 2020. The corresponding soundings from Wyoming are depicted in subfigure (b) for San Juan (PR) and subfigure (c) Grantley Adams (BAR).
Atmosphere 12 00502 g012
Table 1. Geographical coordinates, considered periods, and total number (N) of daily AERONET data used for Caribbean sites (PR, GPE, and BAR) and African sites (Capo Verde and Dakar).
SitesCoordinates ( ° N, ° E)Time PeriodAERONET Daily Data (N)
Caribbean
BAR (Barbados)(13.149, −59.624)1996–2000695
GPE (Pointe-à-Pitre)(16.225, −61.528)1997–20202601
PR (Cap San Juan)(18.384, −65.620)2005–20212182
PR (Rio Piedras)(18.402, −66.051)200456
BAR (Ragged Point)(13.165, −59.432)2007–20212623
BAR (Sal Trace)(13.149, −59.625)2013–201477
PR (Neo Guan)(17.970, −66.869)2017–2021810
African
Capo Verde(16.733, −22.935)1994–20213176
Dakar(14.394, −16.959)1994–20204118
Table 2. Particulate Matter (PM) daily data from PR and GPE. N represents the data point number.
Air Quality NetworkStationDatabaseCoordinates ( ° N, ° E)Time PeriodDaily Data (N)
Air Now (PR)Catano P M 10 / P M 2.5 18.431, −66.1422000–20201668
Gwad’Air (GPE)Pointe-à-Pitre P M 10 16.242, −61.541June 202030
Table 3. Percentage of daily case meeting dust, marine, and continental/BB particles criteria for Caribbean sites located in PR, GPE, and BAR between 1996 and 2021.
LocationDust AerosolsMarine AerosolsContinental/BB Aerosols
AOD ≥ 0.2AOD ≤ 0.15AOD ≥ 0.15
AE ≤ 0.6AE < 2AE > 0.6
Caribbean sites22.11%64.89%3.47%
Table 4. Mean ( M ¯ ), standard deviation ( σ ), Skewness (S), Kurtosis (K), and number of dusty days superior or equal to 35 and 50  μ g . m 3 for P M 10 daily data in June between 2006 and 2020 at PR. N represents the data point number and the numbers in bold the maximum values.
June M ¯ ( μ g . m 3 ) σ ( μ g . m 3 )SK [ PM 10 ] 35   μ g . m 3 (Days) [ PM 10 ] 50   μ g . m 3 (Days)
2006 (N = 25)45.422.21.03.1126
2007 (N = 26)35.916.00.62.1114
2008 (N = 30)32.914.00.52.5132
2009 (N = 30)34.933.82.05.785
2010 (N = 25)42.339.21.74.996
2011 (N = 30)30.413.61.03.474
2012 (N = 30)49.521.60.73.02114
2013 (N = 25)31.811.50.62.792
2014 (N = 30)38.119.10.62.1149
2015 (N = 26)45.122.00.42.21610
2016 (N = 28)29.211.61.44.952
2017 (N = 27)23.77.30.62.250
2018 (N = 26)40.322.40.93.0137
2019 (N = 26)35.721.60.83.2127
2020 (N = 29)63.385.43.616.8149
Table 5. Rate in percentage of marine, dust, and continental/BB aerosols related to AE (440–870 nm) versus AOD (440 nm) for PR station from 2000 to 2020 (N = 371).
Ratio GroupDust (%)Marine (%)Continental/BB (%)
A123.1816.710.27
A228.3028.031.35
B0.271.620.27
Total51.7546.361.89
Publisher’s Note: MDPI stays neutral with regard to jurisdictional claims in published maps and institutional affiliations.

