Article

The Influence of Large-Scale Environment on the Extremely Active Tropical Cyclone Activity in November 2019 over the Western North Pacific

1
School of Atmospheric Sciences, Nanjing University of Information Science & Technology, Nanjing 210044, China
2
Nanjing Meteorological Bureau, Nanjing 210019, China
*
Authors to whom correspondence should be addressed.
Atmosphere 2021, 12(4), 501; https://doi.org/10.3390/atmos12040501
Submission received: 10 March 2021 / Revised: 8 April 2021 / Accepted: 13 April 2021 / Published: 15 April 2021
(This article belongs to the Section Climatology)

Abstract

:
In November 2019, tropical cyclone (TC) frequency over the western North Pacific reached its record high. In this study, the possible causes and formation mechanisms of that record high TC frequency are investigated by analyzing the effect of large-scale environmental factors. A comparison between the extremely active TC years and extremely inactive TC years is performed to show the importance of the large-scale environment. The contributions of several dynamic and thermodynamic environmental factors are examined on the basis of two genesis potential indexes and the box difference index that can measure the relative contributions of large-scale environmental factors to the change in TC genesis frequency. Results indicate that dynamical factors played a more important role in TC genesis in November 2019 than thermodynamic factors. The main contributions were from enhanced low-level vorticity and strong upward motion accompanied by positive anomalies in local sea surface temperature, while the minor contribution was from changes in vertical wind shear. Changes in these large-scale environmental factors are possibly related to sea surface temperature anomalies over the Pacific (e.g., strong Pacific meridional mode).

1. Introduction

Tropical cyclones (TCs) are one of the most disastrous weather systems in the world because of their associated whole gales and torrential rains. In the past decades, TCs have brought severe destruction as well as economic hardship, and thus have become a major focus of tropical meteorology [1]. Research on TCs at various time scales would improve the understanding of TC activity in response to climate change and help protect us from injury and economic damage [2,3]. Approximately 35 TCs occur over the western North Pacific (WNP) basin each year, accounting for ~33% of TCs worldwide [4,5]. Obviously, the WNP is the most active basin for TC genesis. TC activity over the WNP basin often causes serious damage to China and the adjacent regions.
The WNP basin in November 2019 was characterized by an exceptionally high frequency of TCs. Unless otherwise specifically stated, the WNP basin in this study refers to the WNP basin (equator to 30° N, 120° to 180° E) and the South China Sea (SCS: equator to 22° N, 105° to 120° E). Six TCs were observed in November 2019 over the WNP based on the best track data available from the Joint Typhoon Warning Center (JTWC), constituting the highest TC frequency since weather satellites began routine monitoring in 1965. We used three best track datasets available from the JTWC, the Regional Specialized Meteorological Center of the Japan Meteorological Agency (JMA), and the Shanghai Typhoon Institute of China (CMA_STI), and found consistent results for the record-high TC genesis frequency in November 2019. Previous studies have suggested that TC activity in the WNP basin is strongly influenced by various modes of natural climate variability, such as intra-seasonal oscillations [6,7,8], inter-annual variations [9,10,11], as well as decadal and inter-decadal variabilities [12,13,14,15]. Previous studies have also discussed the changes in TC genesis during the past decade or so [16,17,18]. To our knowledge, the unusually high TC frequency in November 2019 has not received much attention. It is a puzzle as to why the abnormal frequency of TC genesis occurred in November 2019. Therefore, it was of great interest to explore the possible causes and formation mechanisms of TC activity in that year.
In this study, our objective was to examine why TC frequency was high in November 2019 over the WNP basin. The influence of large-scale environmental factors and regional sea surface temperature (SST) changes over different oceans related to TC activity was emphasized to shed light on the highest recorded TC number. The remainder of this paper is organized as follows. Section 2 describes the data and methodology. The spatio-temporal characteristics of TC activity in November 2019 are revealed in Section 3.1. Large-scale anomalies associated with the record-high TC frequency in November 2019 are analyzed and compared in Section 3.2. Diagnosis of key dynamical and thermodynamic factors affecting TC genesis is carried out in Section 3.3. The role of regional SST changes in the event of record high TC frequency is discussed in Section 3.4. Finally, a summary is given in Section 4.

2. Data and Methods

2.1. Data

In this study, we focused mainly on the JTWC best track data set unless otherwise specified. Since weather satellites began routine monitoring in 1965, we used the JTWC best track records during 1979–2019. The TCs with tropical storm intensity or above (maximum sustained surface wind speed of 35 kt or above) were taken into consideration. Note that there are several organizations that maintain their own historical TC records for the WNP basin (e.g., JTWC, JMA, the Hong Kong Observatory (HKO) of China, and CMA_STI), but previous studies have suggested that the differences in TC tracks and TC genesis are generally small, particularly in the satellite-observation areas [19,20,21,22]. To further improve our analyses, we used the three best track data sets available from the JTWC, CMA_STI, and JMA, and found consistent results for the record high TC frequency in November 2019.
To examine the impact of large-scale environmental factors on the highest TC frequency in November 2019, our analyses utilized the environmental variables (i.e., wind, relative humidity) from the National Centers for Environmental Prediction and National Center for Atmospheric Research (NCEP/NCAR) Reanalysis I data set, which had a 2.5° × 2.5° grid resolution and 17 vertical pressure levels [23]. The SST data were the extended reconstructed SST (ERSST version 3) data from the National Oceanic and Atmospheric Administration (NOAA) with a 2° × 2° resolution [24]. The significance of the correlations and differences in this study was accessed by the student’s-t test. The correlations and differences appeared to be significant if the p-value was lower than or equal to 5%.

2.2. Diagnostic Tools for Assessing the Relative Importance of Large-Scale Environmental Factors in TC Genesis

(a)
Genesis Potential Index
To explore key factors affecting the extremely high TC frequency in November 2019 from a non-linear perspective, the genesis potential index developed by Emanuel and Nolan (ENGPI) [25] was adopted in this study. The ENGPI has been widely used to diagnose the inter-annual and inter-decadal variabilities of TC genesis in the WNP [26,27] and to understand the processes by which the El Niño-Southern Oscillation (ENSO) impacts TC genesis globally [28]. The ENGPI is defined as follows:
E N G P I = 1 + 0.1 × V s 2.0 R H 600 50 3 M P I 70 3 × ζ a 850 × 10 5 1.5
where R H 600 denotes the relative humidity (%) at 600 hPa; M P I represents the maximum potential intensity (m s−1), which is an empirical value and is determined by the SST and the vertical structure of temperature and moisture [29]; V s is the magnitude of the vertical wind shear (m s−1) between 200 and 850 hPa; and ζ a 850 is the absolute vorticity (s−1) at 850 hPa. The definition of MPI is based on Emanuel (1995) and modified by Bister and Emanuel (1998):
M P I 2 = C k C D T s T o T o h o * h *
where C k and C D denote the surface enthalpy and momentum exchange coefficients, respectively; T s is the sea surface temperature; T o is the outflow temperature; h o * is the saturation moist static energy of the sea surface; and h * is the saturation moist static energy of the free atmosphere. The details on the computation of MPI can be found in Bister and Emanuel [29].
In addition, previous studies found that dynamical variables are of primary importance for separating developing and non-developing disturbances in the present-day climate in the WNP [30]. Thus, to corroborate the results of the ENGPI and further reveal the dynamical key factors that affected TC genesis in November 2019, the dynamical genesis potential index (DGPI) more recently developed by Wang and Murakami was adopted in this study [31]. The DGPI, consisting of four dynamical parameters, provides a diagnostic tool for understanding the changes of TC genesis. The DGPI formula is as follows:
D G P I = V s 1 U y 2 ω 3 ζ a 2 e 12 1.0
where the terms V s and ζ a are the same as those in the ENGPI; ω is the vertical velocity at 500 hPa, U y denotes meridional gradient of zonal wind at 500 hPa, and e stands for exponential function. In addition, Wang et al. [31,32] assumed that the TC genesis latitudes are 5 degrees away from the equator and the SST is higher than 26 °C. Therefore, the DGPI is set as zero over the grids where the SST is smaller than 26 °C or the latitude is within 5 degrees around the equator. The DGPI and ENGPI have comparable ability to portray climatological mean distribution and the relationship between TC genesis and ENSO [31,32]. The relative roles of thermodynamic and dynamical factors influencing TC formation in November 2019 over the WNP basin are fully discussed in our study by comparing the DGPI and ENGPI.
(b)
Box Difference Index
The box difference index (BDI) can objectively and quantitatively identify controlling parameters by measuring the differences between developing and non-developing disturbances [33]. The definition of the index is as below:
B D I = M D E V M N O N D E V σ D E V + σ N O N D E V
where M D E V and σ D E V ( M N O N D E V and σ N O N D E V ) represent the mean and standard deviation of the variables for the developing (non-developing) cases. The sign of the BDI reflects the physical nature of a variable and the magnitude measures how well a variable can differentiate between the developing and non-developing disturbances. In this study, we used the BDI to quantitatively identify the large-scale environment between years with high and low TC frequency and between the year 2019 and the climatological mean. Details will be shown in the latter section. In the calculation of the BDI, ENGPI and DGPI, we compare the average environmental factors relative to the center of each TC genesis time and location within the 10° × 10° domain for different TC cases.

3. Diagnosis of Possible Causes and Formation Mechanisms of the Record High TC Frequency in the WNP in November 2019

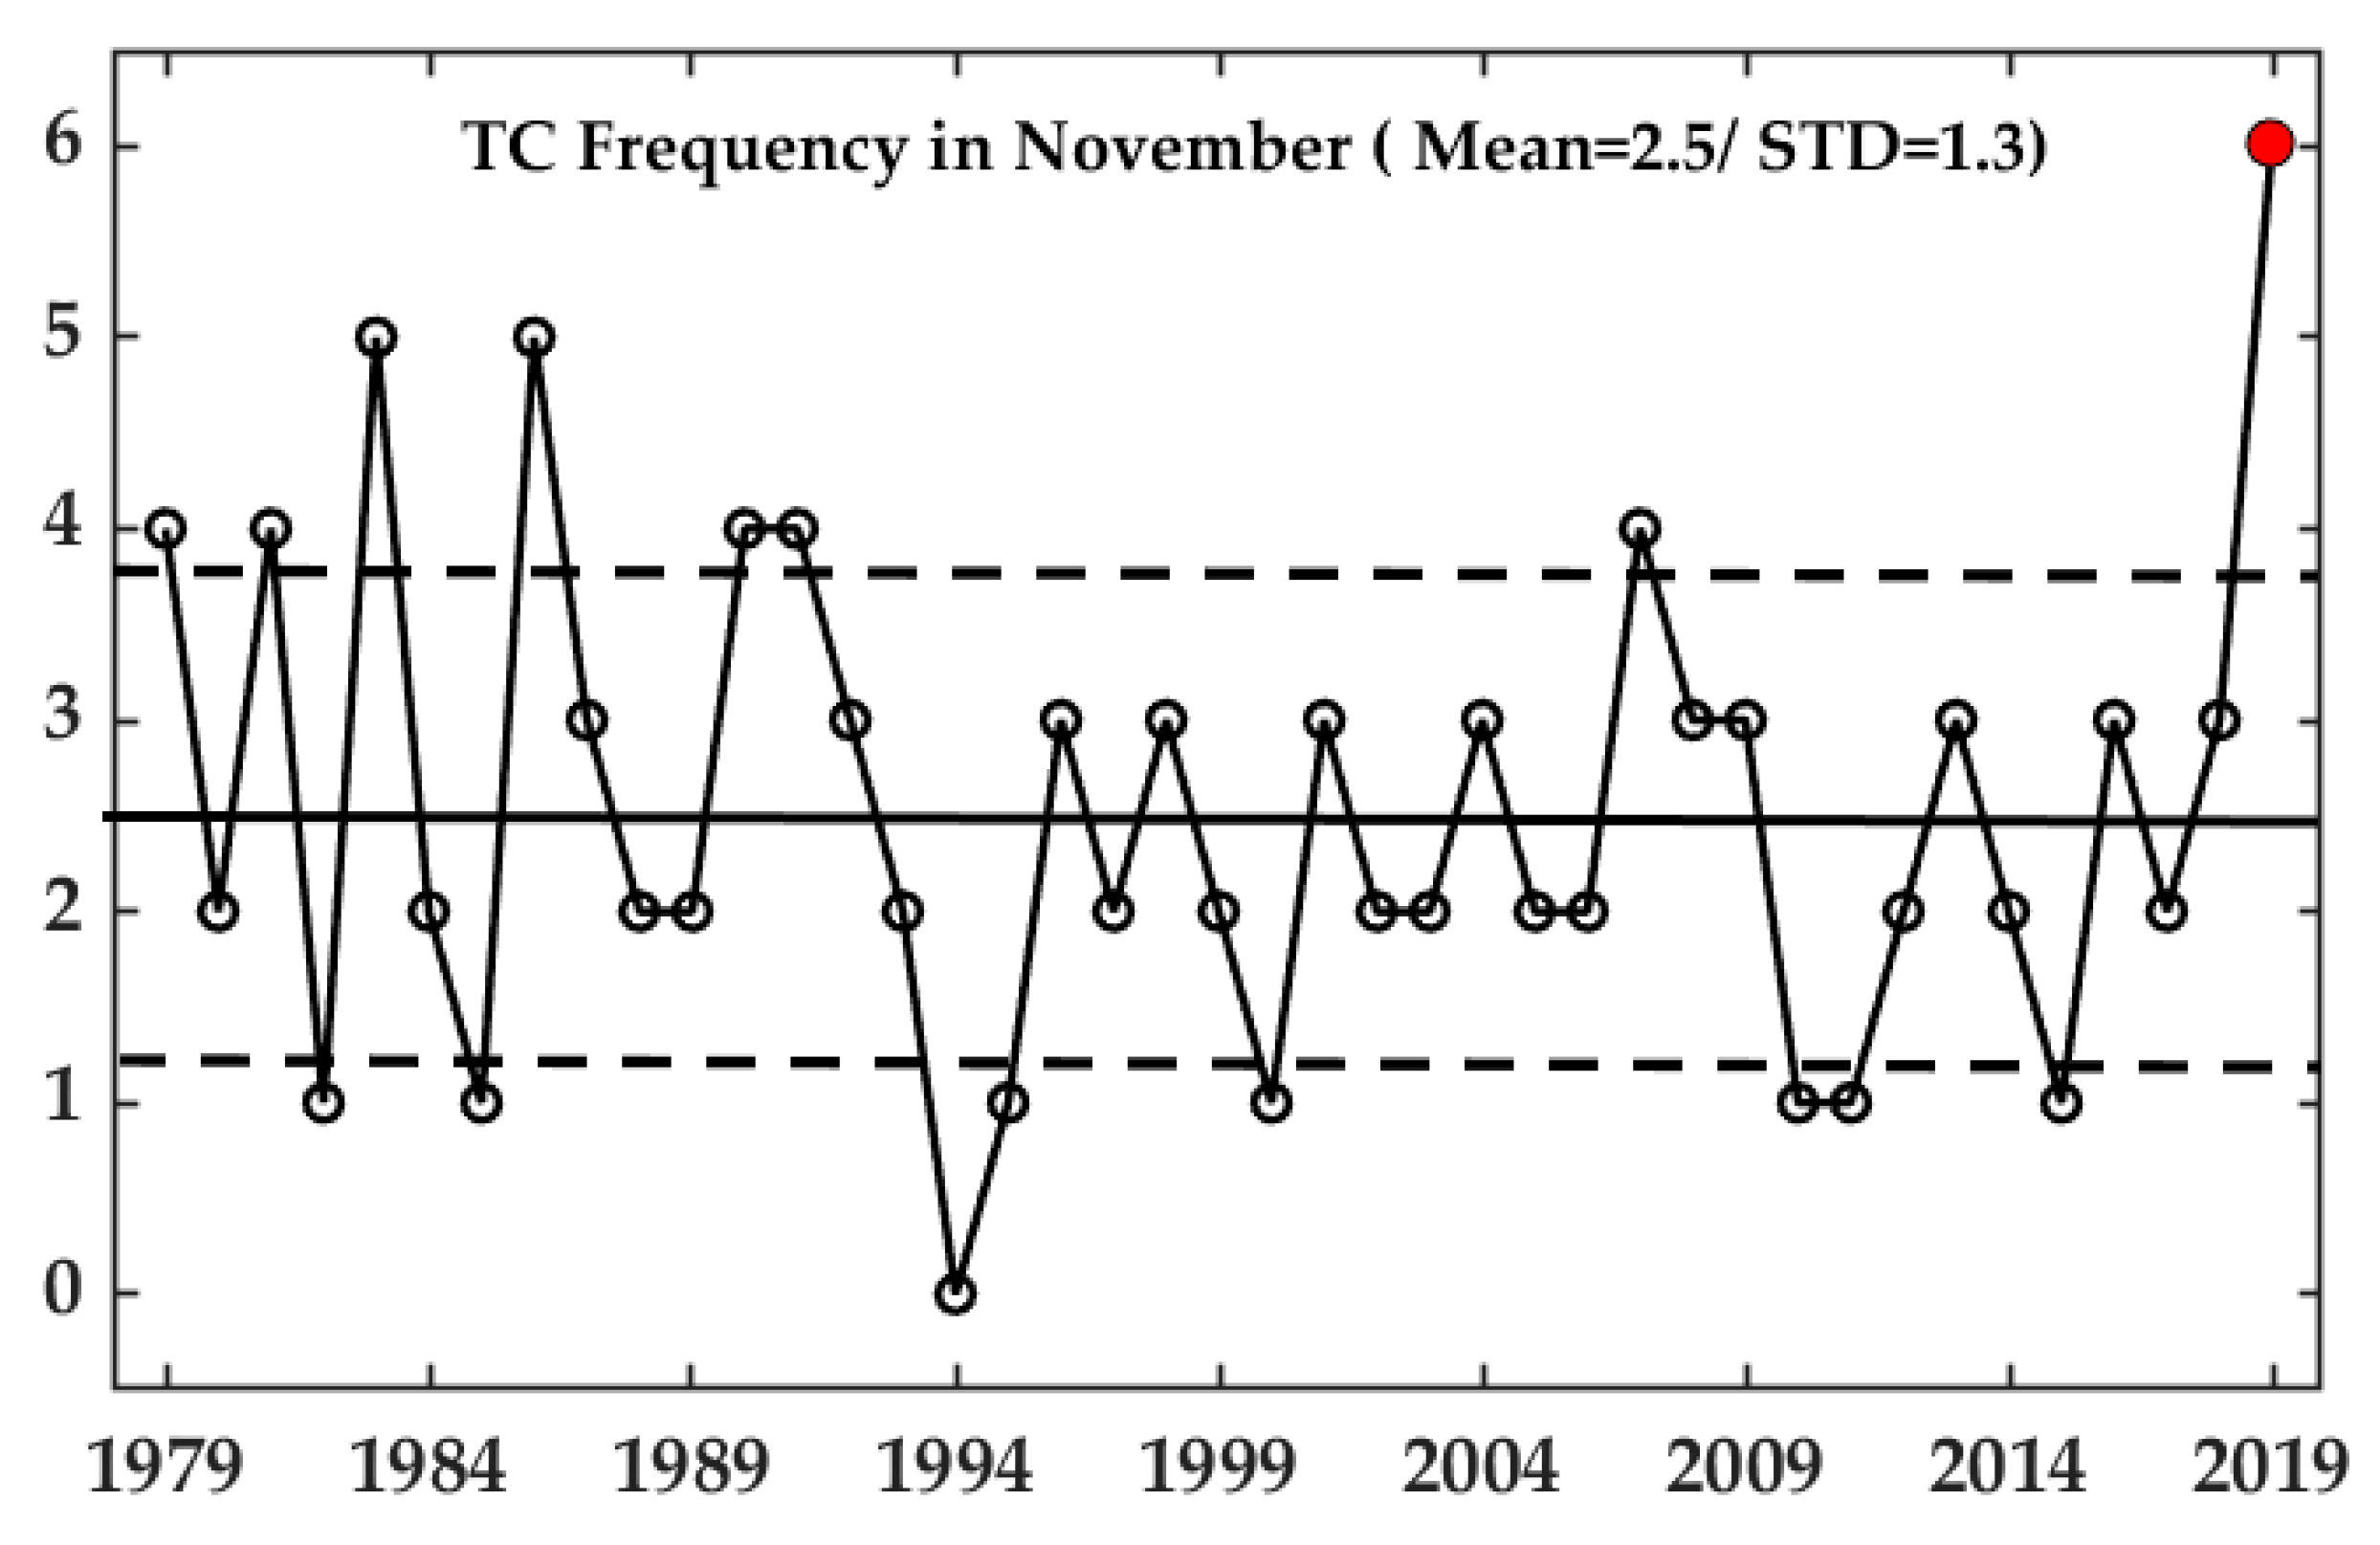
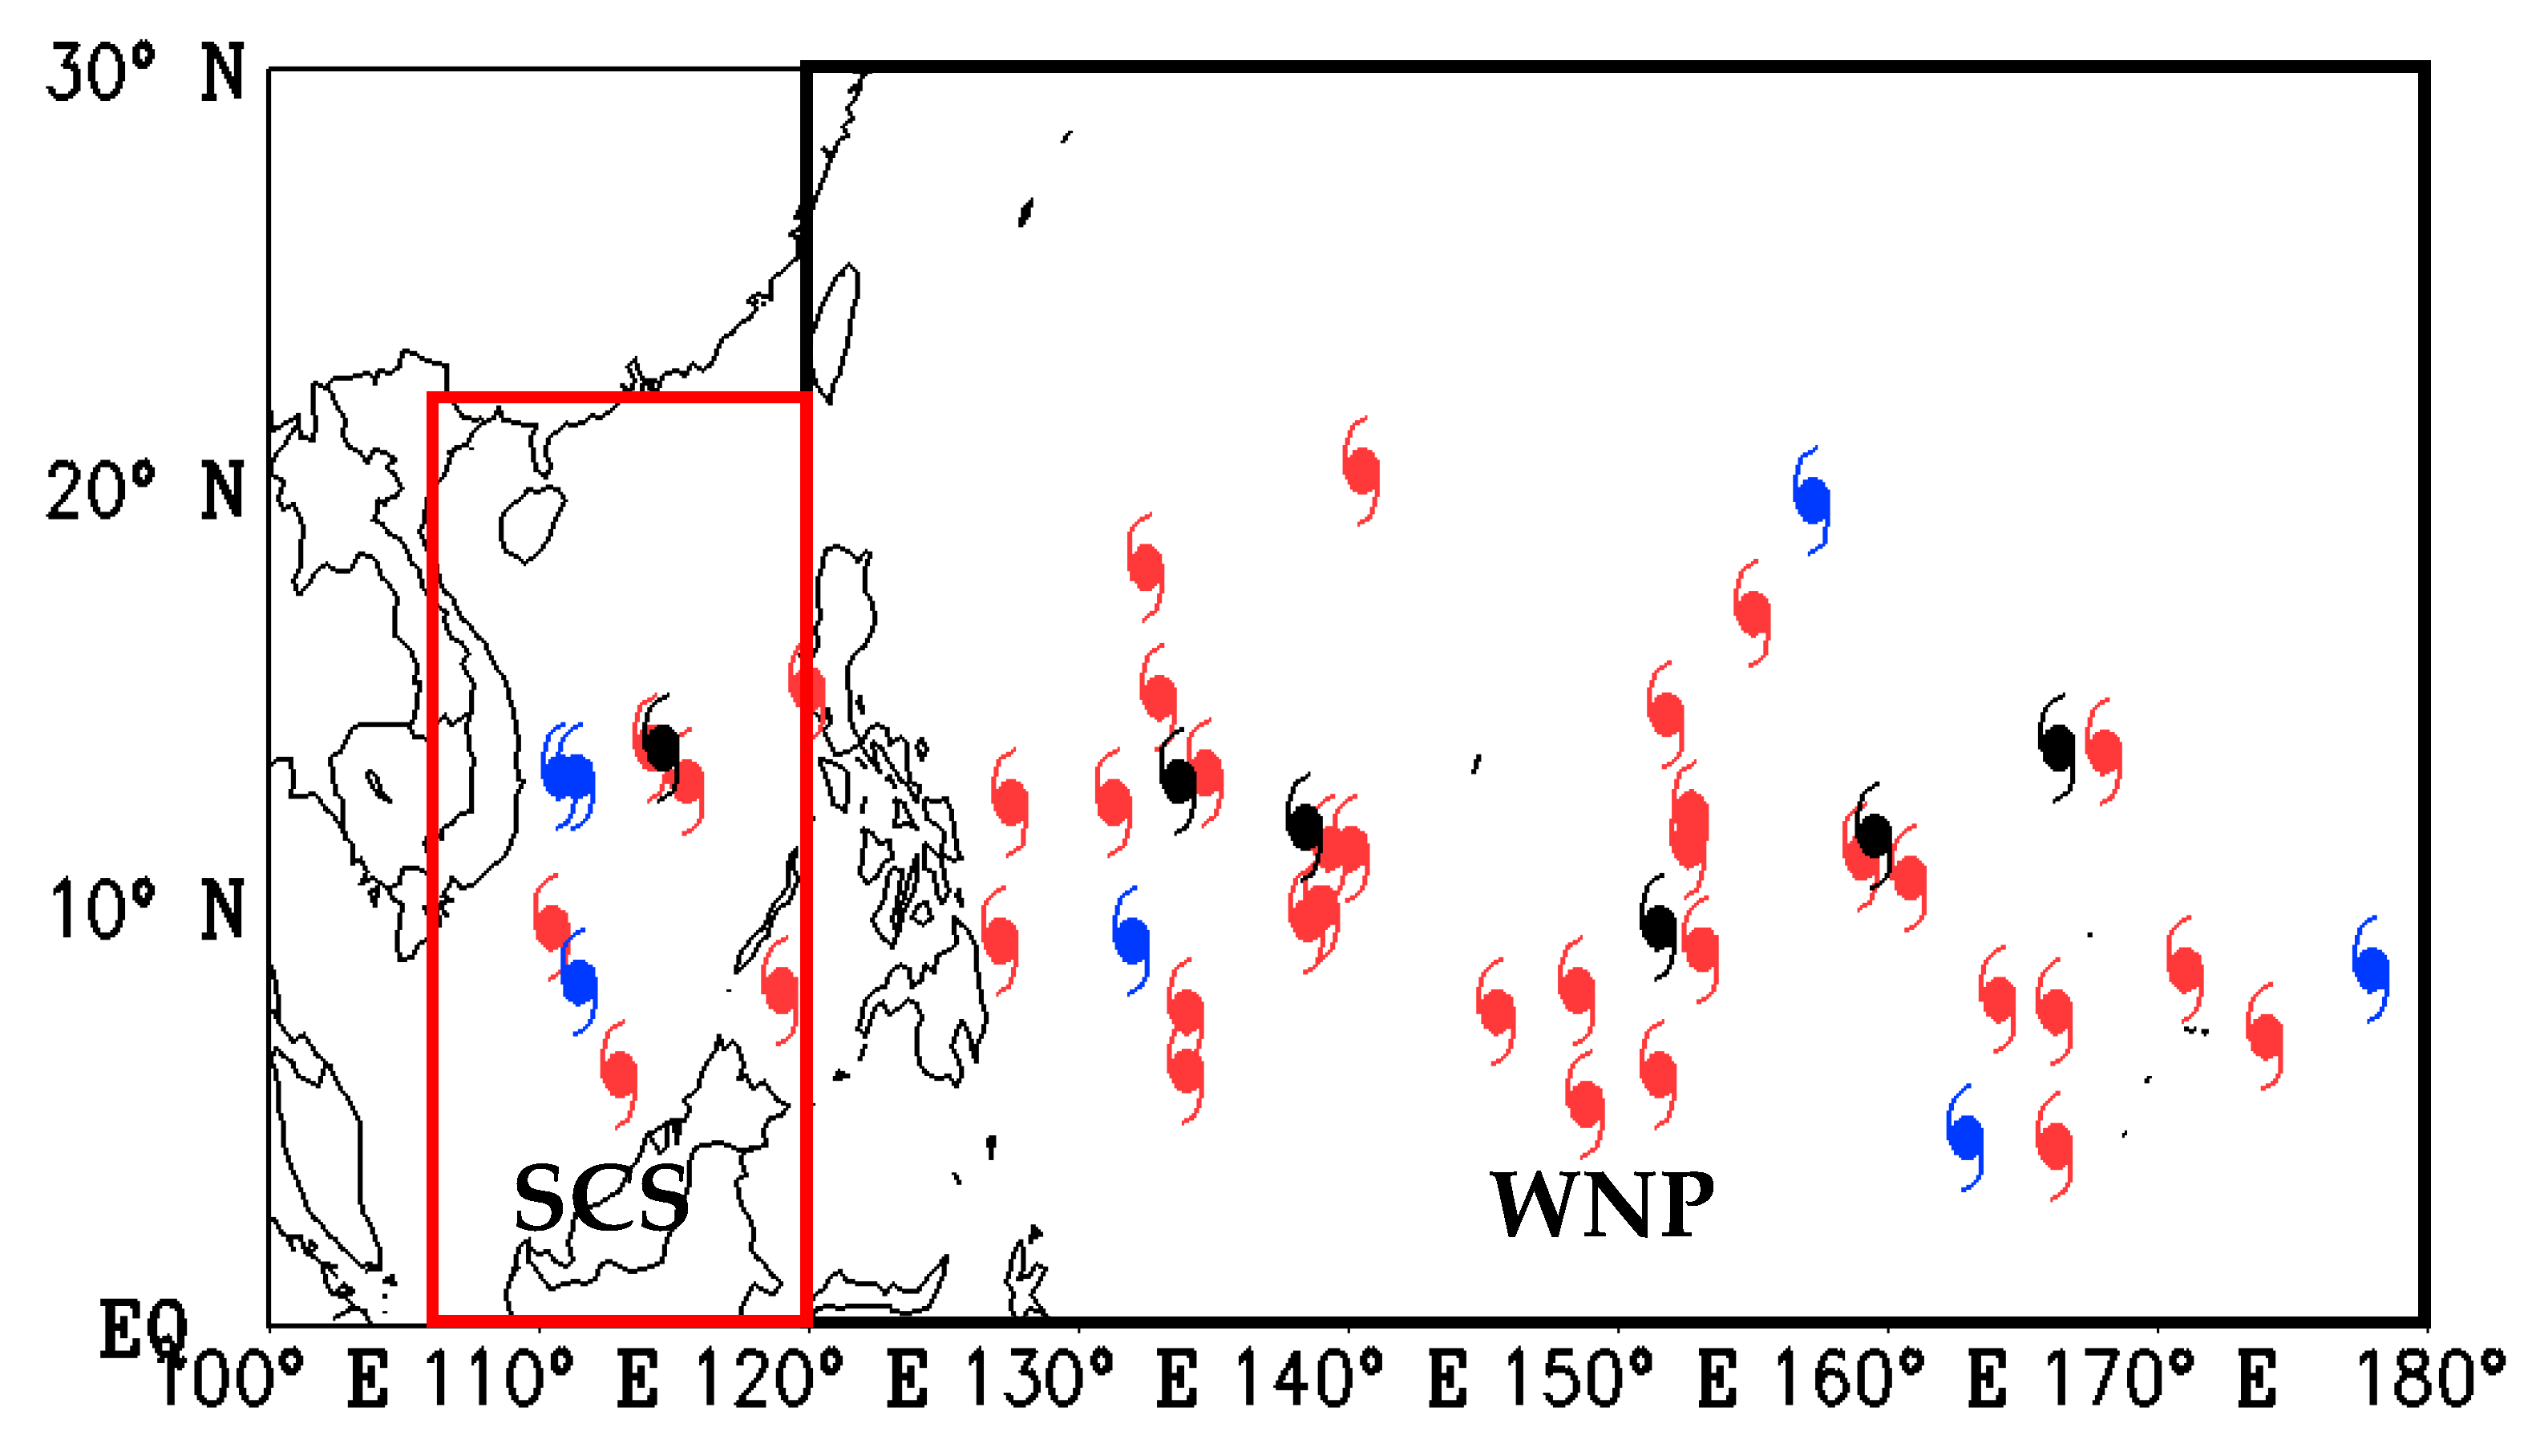
3.1. The Spatio-Temporal Characteristics of TC Activities in November 2019

As shown in Figure 1 and Table 1, there is a pronounced inter-annual variability of TC frequency over the WNP basin, with the mean frequency and standard deviation being 2.5 and 1.3 in the Novembers of 1979–2019. The 6 TCs observed in November 2019 were the highest since 1979 and more than 3 above the mean. It is noteworthy that until 2020, the TC frequency in November 2019 was still the record high.
In this study, years with a TC frequency larger than or equal to 3.8, which is greater than or equal to the mean value plus one standard deviation, were regarded as years with high TC frequency. Conversely, years with a TC frequency below 1.2, which is lower than or equal to the mean value minus one standard deviation, were considered as years with low TC frequency. During years with high TC frequency, 36 TCs occurred over the WNP basin, accounting for 83.33% of the total number from 1979 to 2019. By contrast, only 7 TCs occurred during the years with low frequency. These results were also found in the other two best track datasets (i.e., JMA and CMA_STI), suggesting that the record high TC frequency in November 2019 was robust and not a spurious fact due to observational techniques.
Apart from the abnormality in TC frequency in November 2019, the significant characteristic in TC genesis locations is also noteworthy. To better illustrate the difference of TC locations, we distinguish the WNP from the SCS in this paragraph. In this study, the TC formation location was defined as the location where tropical storm intensity was initially attained. Following this definition, as shown in Figure 2, TCs that formed over the SCS were counted in the SCS, and similarly, those that formed over the WNP excluding the SCS were counted in the WNP excluding the SCS. Results show that in the years with high TC frequency, 83.33% of the TCs appeared in the WNP and only 16.67% in the SCS. Similar results can be found for November 2019, when 5 TCs appeared in the WNP while merely 1 occurred in the SCS. However, in the years with low TC frequency, 57.14% of all TCs occurred in the WNP, which means relatively more TCs occurred in the SCS in these years [26,27].

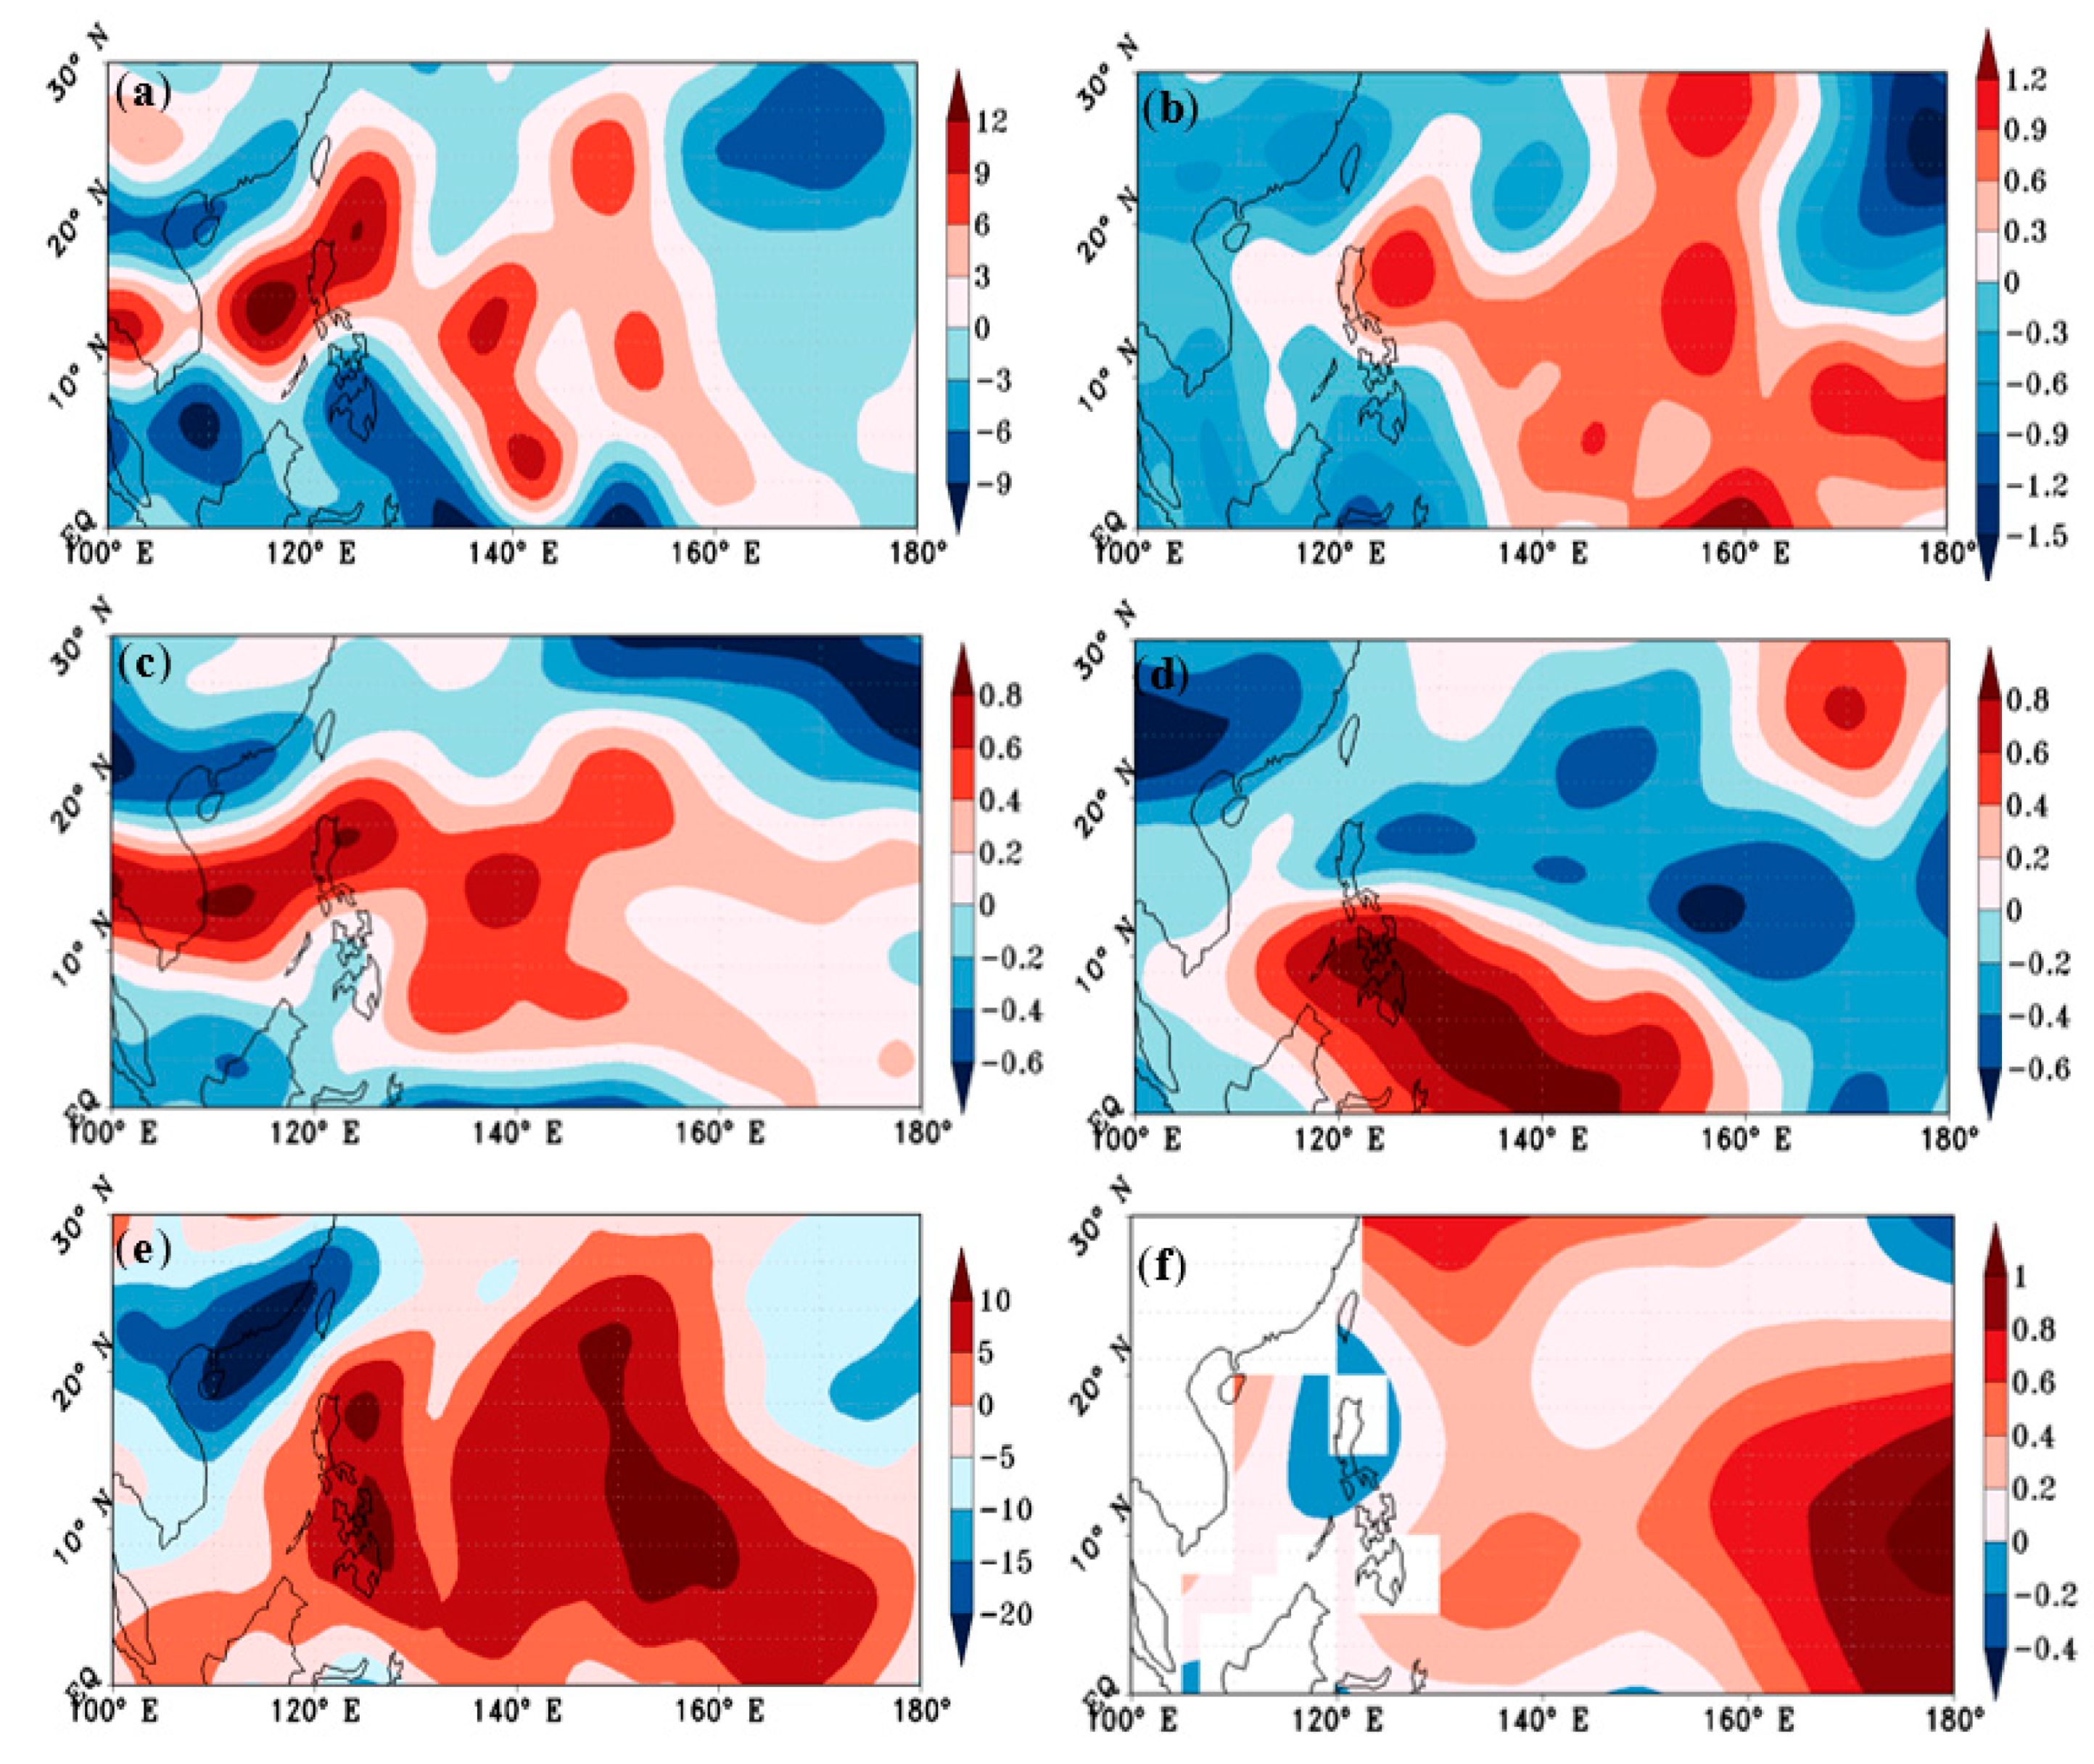
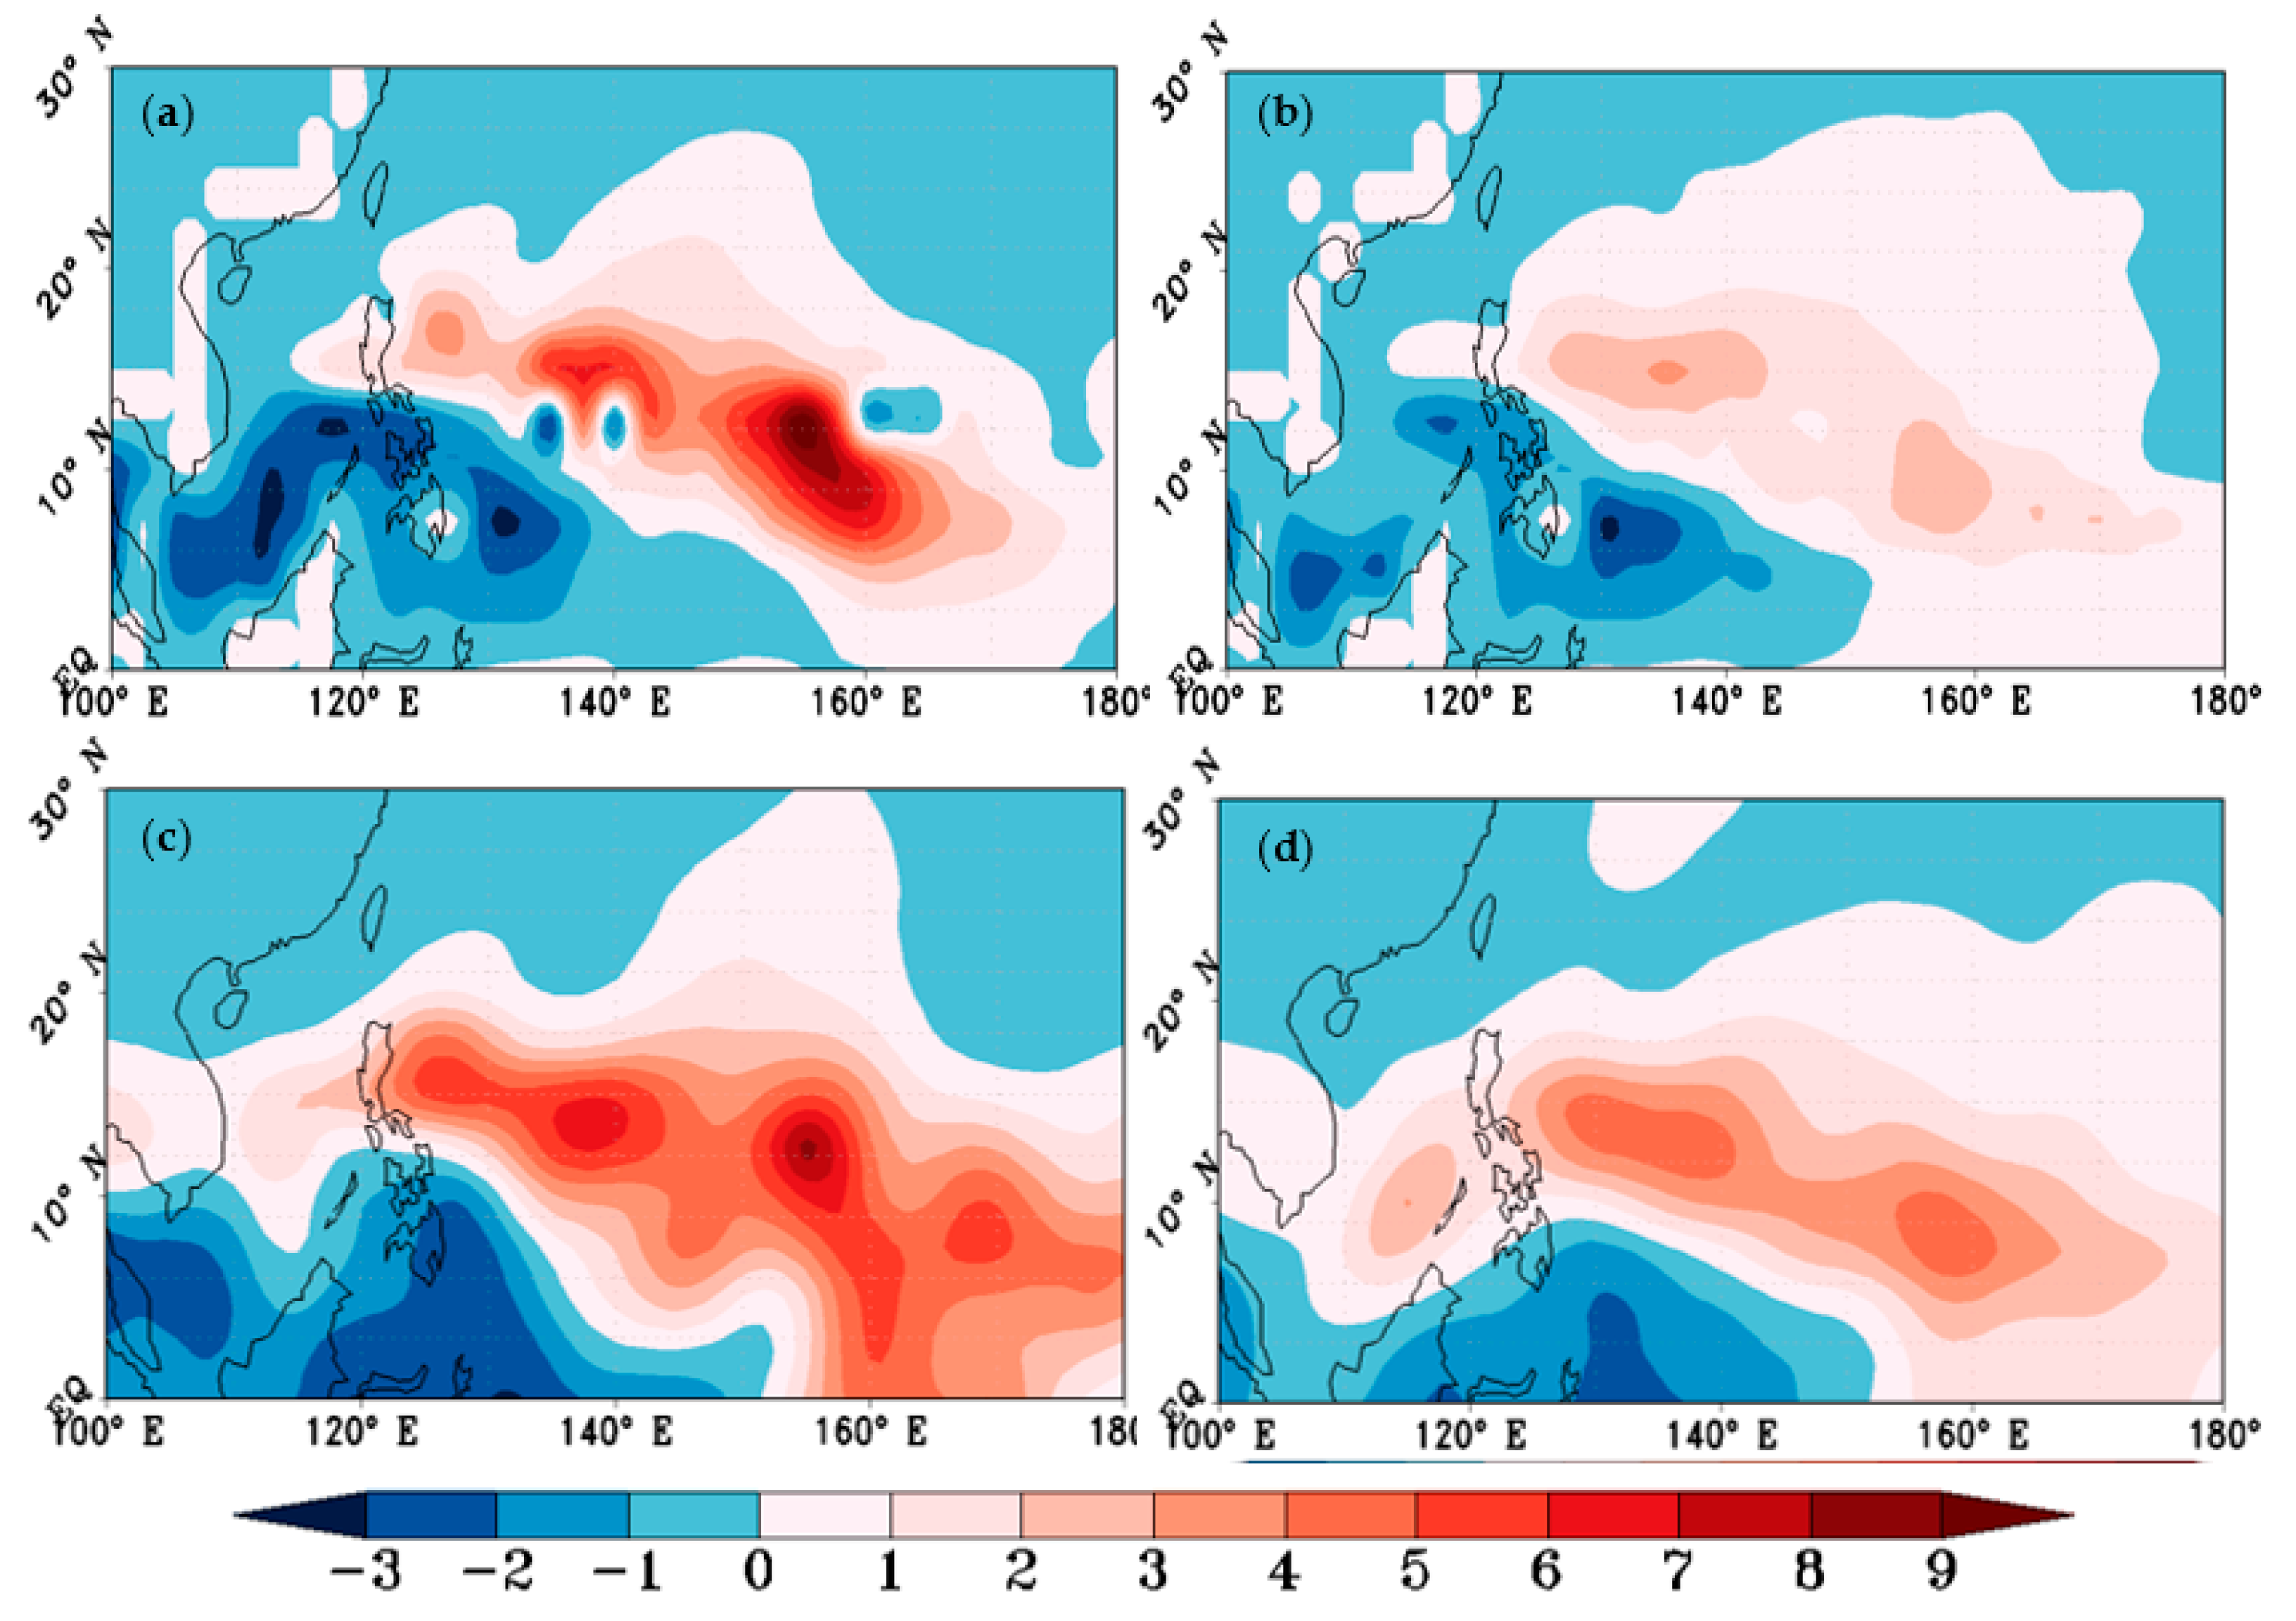
3.2. Large-scale Environmental Factors Related to the Active TC Genesis in November 2019

To further understand the influence of the large-scale environment on TC activity over the WNP basin in November 2019, we compared large-scale environmental factors between November 2019 and the climatological mean (Figure 3). Moreover, the large-scale environment in high TC frequency years was compared to that in low TC frequency years (Figure 4), so as to provide a reference for interpreting the abnormally large number in November 2019.
For the dynamical factors, we note that in November 2019, there were strong positive absolute vorticity (SVOR) anomalies in the TC generating area (Figure 3a), which was about 50% more than the difference between the years with high and low TC frequency (Figure 4a). Meanwhile, the WNP basin had a wide range of positive vertical velocity anomalies in November 2019 (Figure 3b), with the maximum value about 1.5 times the maximum difference between the years with high and low TC frequency (Figure 4b). The ascending motion was favorable for active TC genesis. As shown in Figure 3c, a wide range of positive meridional gradients of zonal wind can be observed in the WNP, with the maximum value around 110° E and extending to about 150° E. The 500 hPa vorticity due to meridional shear of zonal winds was suggested to be of importance in the WNP and the zonal wind confluence zone [31]. The large horizontal shear of the developing disturbances could have been related to large-scale circulation pattern like a stronger monsoon gyre, favoring TC development [33]. Moreover, minor vertical wind shear (VWS) was observed over the tropical WNP (Figure 3d), which was beneficial to the formation of a warm core. In conclusion, the positive vorticity and strong upward motion could have favored strong convective activity and were conducive to TC generation [33,34]. Meanwhile, the easterly vertical shear, differing from the westerly vertical shear, favored the development of low-level synoptic waves and TC when its amplitude was not too large [33,34].
For the thermodynamic factors, centers of positive relative humidity (RH) anomalies were found near the Philippines and the central WNP (Figure 3e). Positive RH anomalies were particularly obvious in the troposphere. Meanwhile, a large increase in SST was found over the central and eastern WNP (Figure 3f). The difference in SST between November 2019 and the climatological mean reached about 1 °C and was significant, at a 95% confidence level. Compared with the typical east-west dipole between the years with high and low TC frequency (Figure 4f), the positive SST anomaly stretched from the eastern Pacific to the central Pacific. Since years with an SST anomaly larger (less) than 0.81 °C (−0.81 °C) are defined as El Niño (La Niña) years [17], we can define 2019 as a typical El Niño year. The ENSO condition may be suggested as one of the determinant factors that promoted TC formation in November 2019.
Taken together, the large-scale environmental factors in November 2019 were favorable for TC genesis over the WNP basin. The remarkable increase in TC frequency was mainly accompanied by an enhancement of absolute vorticity, strong upward motion, and positive SST anomaly. We should pay attention to the atmospheric circulation in response to the tropics-wide SST changes because of the effect of remote and local SST changes on controlling TC activity [34,35,36,37]. Because SST changes over the different ocean basins can induce variations in large-scale atmospheric circulation and thus affect TC activity [38,39,40,41], we also investigated the relative roles of regional SST distributions in the following context.

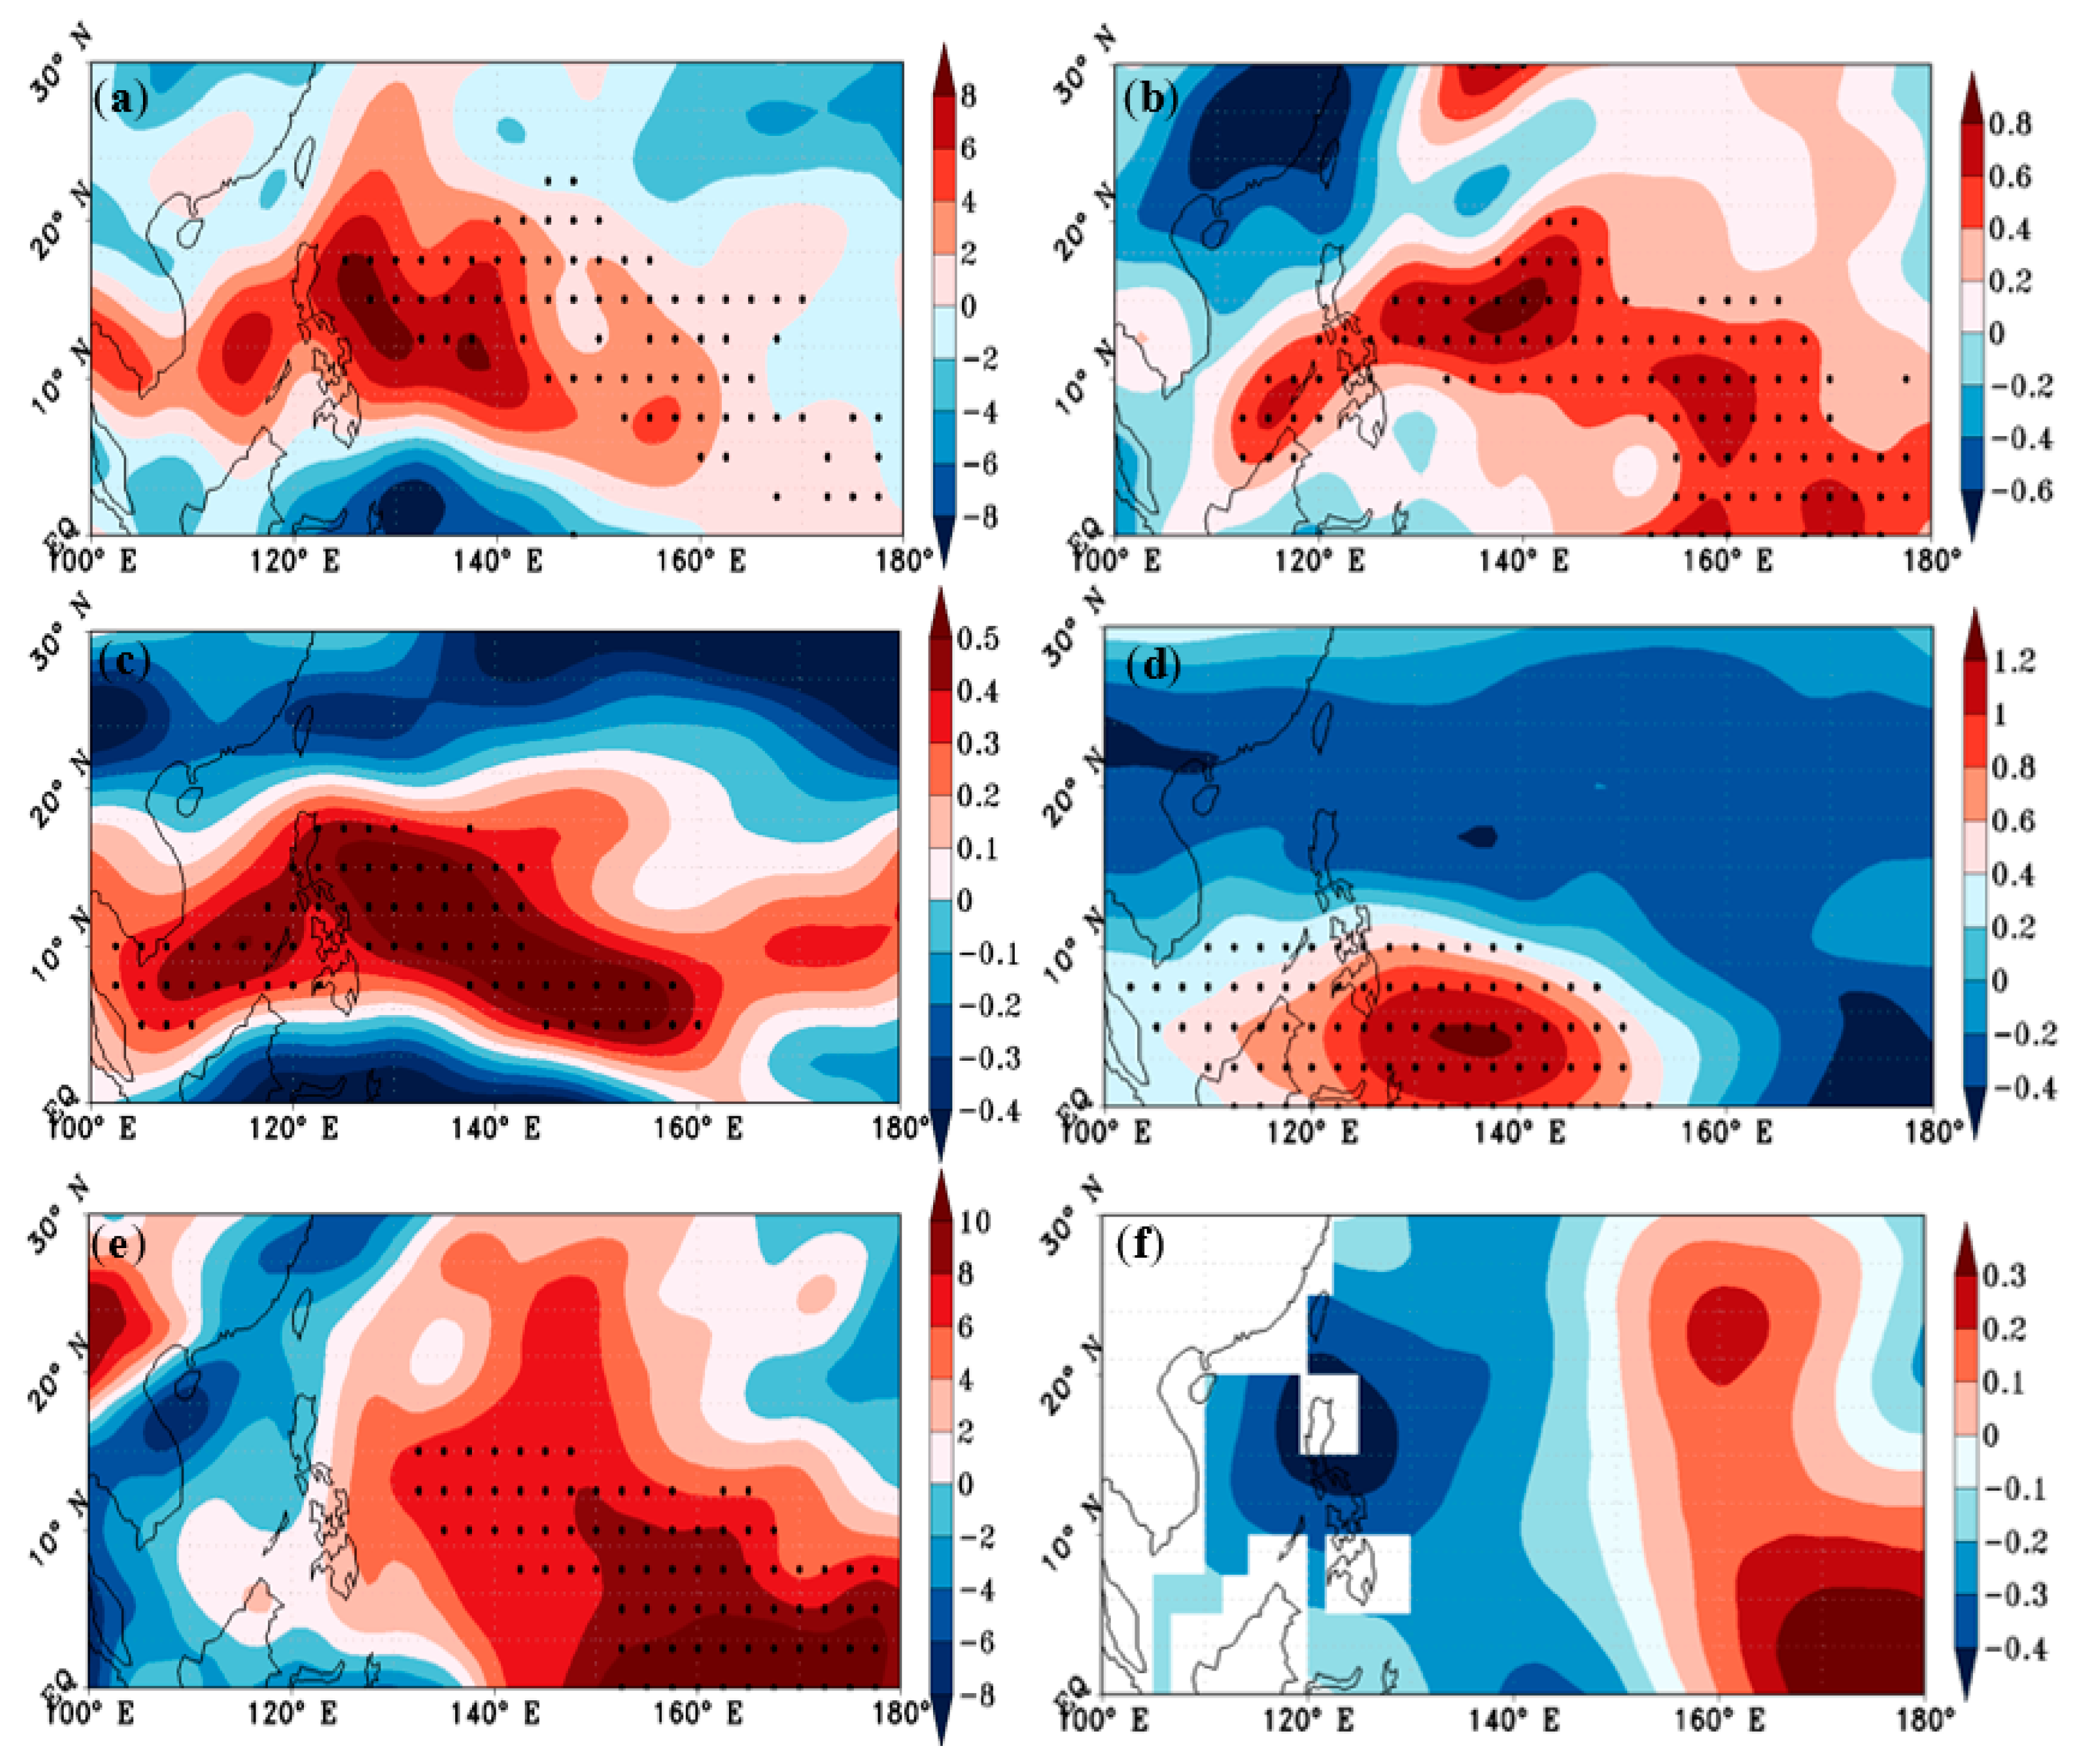
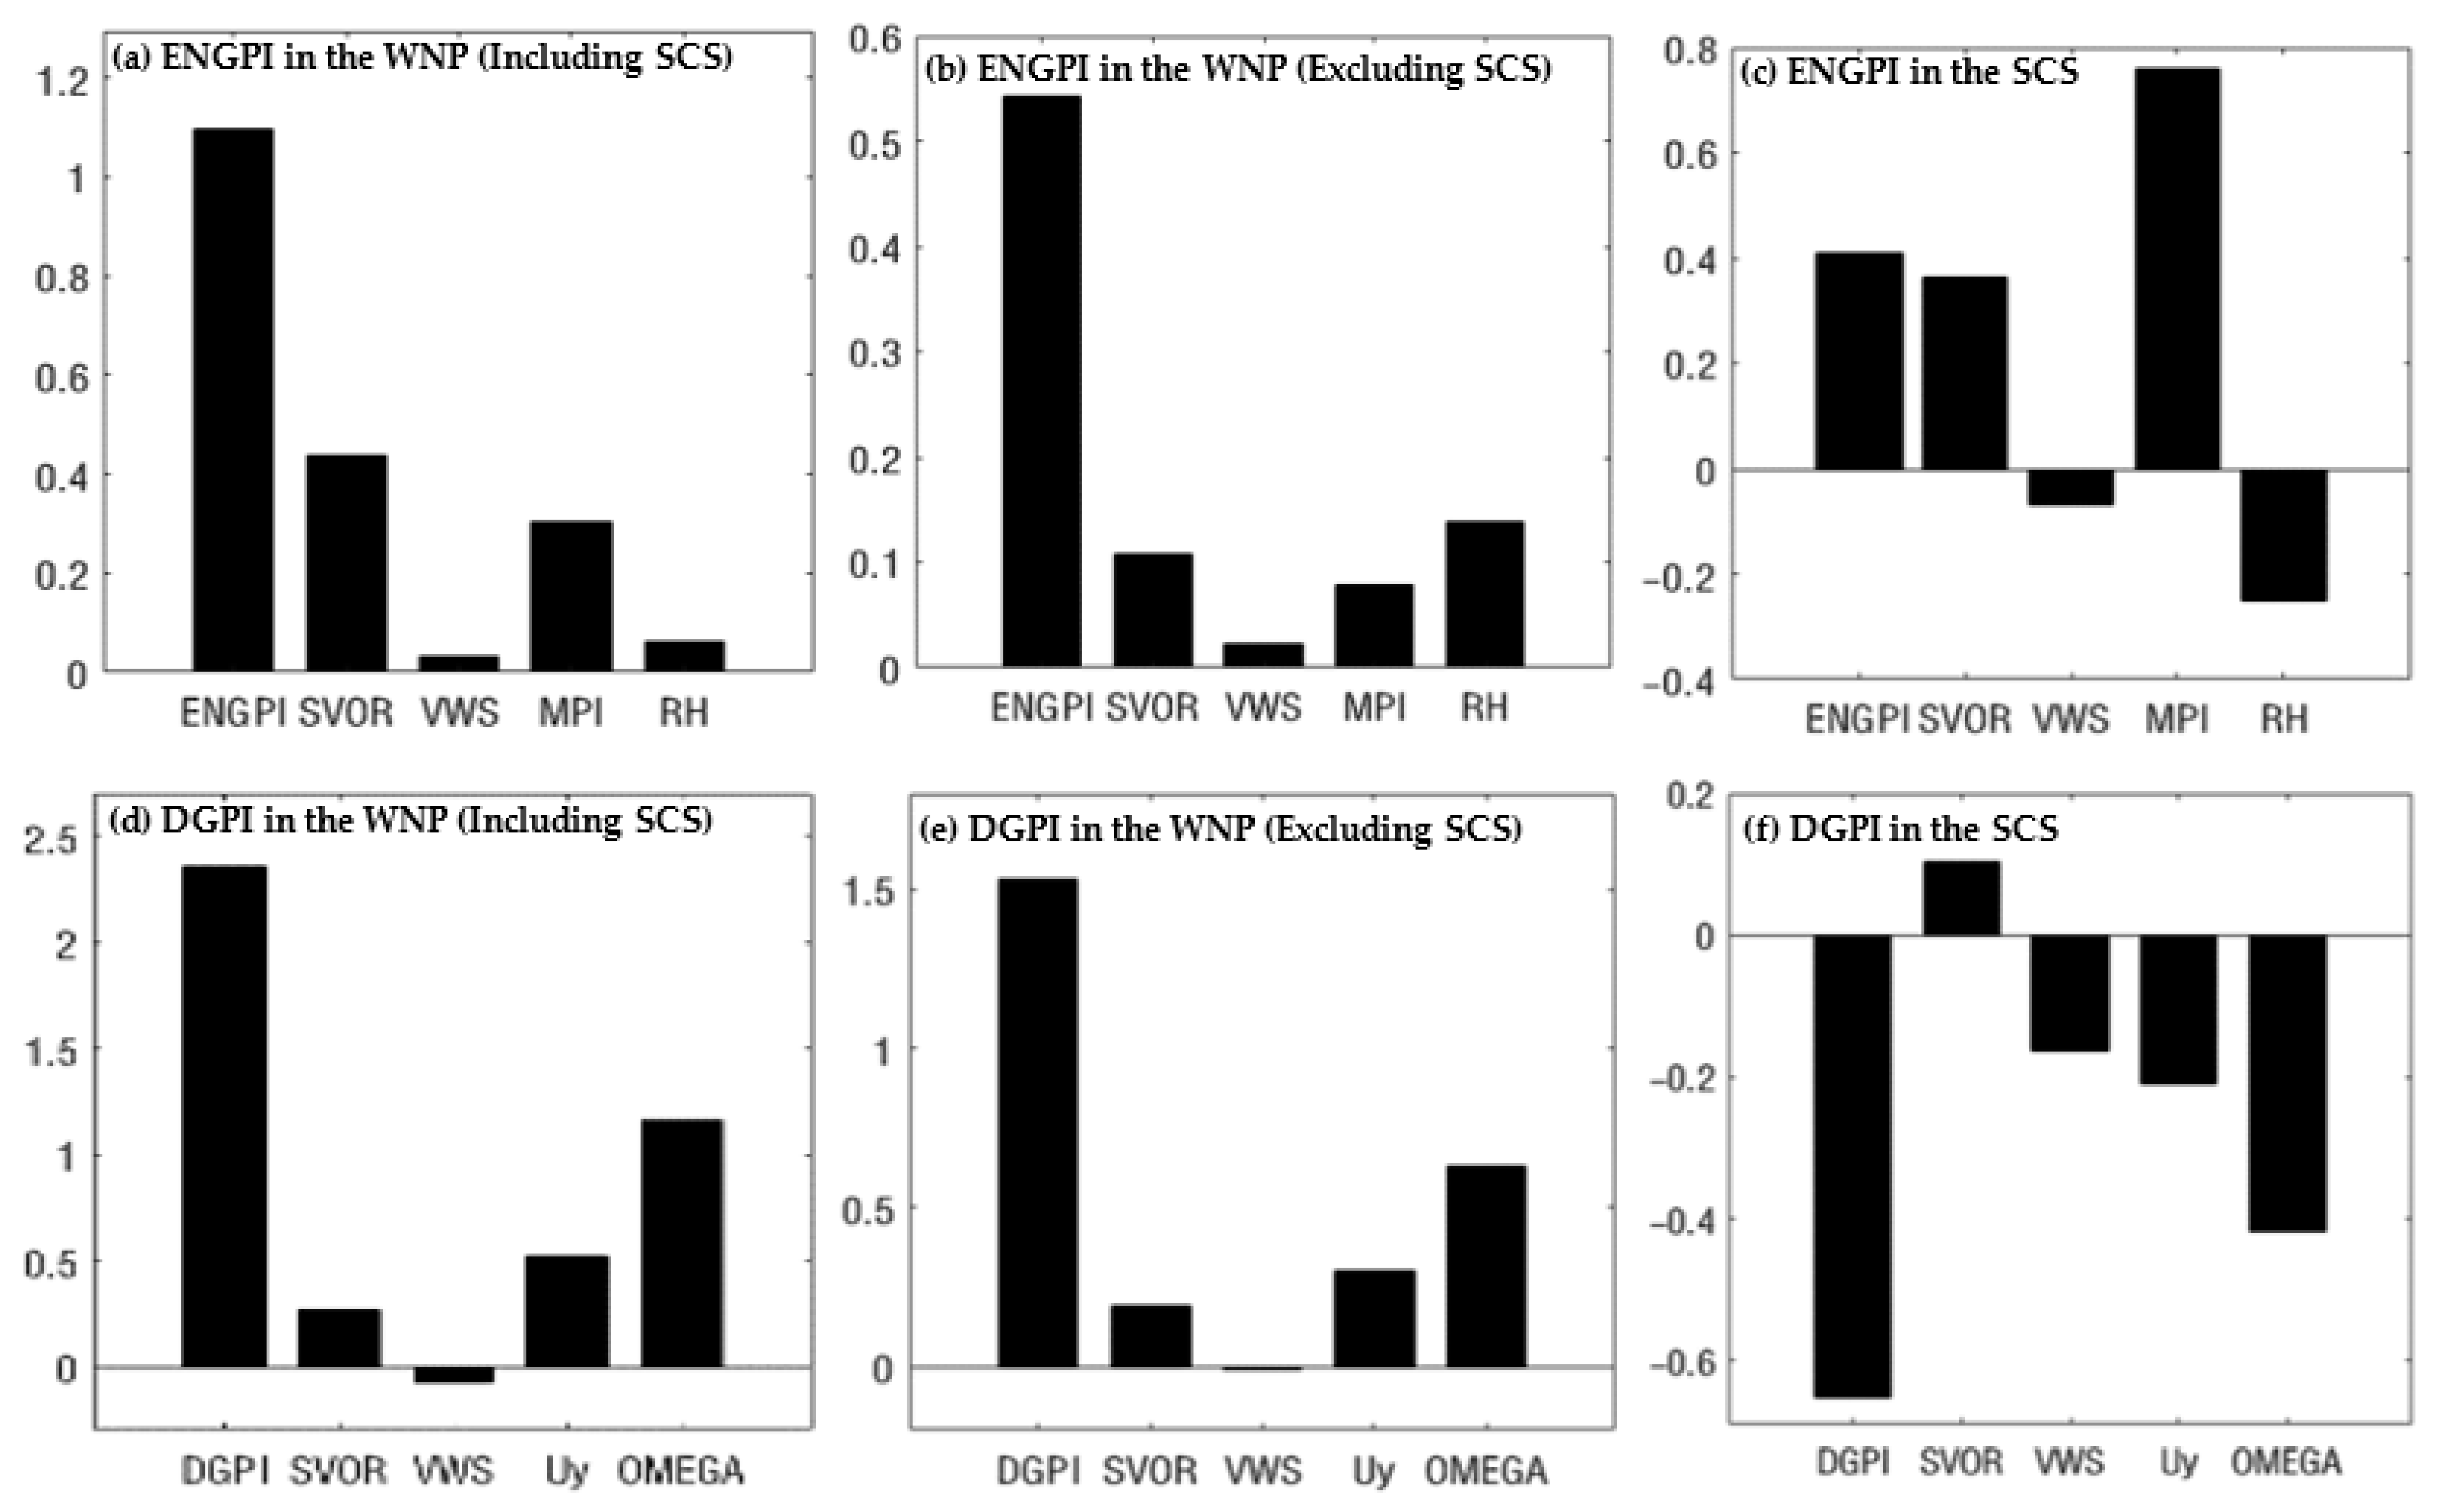
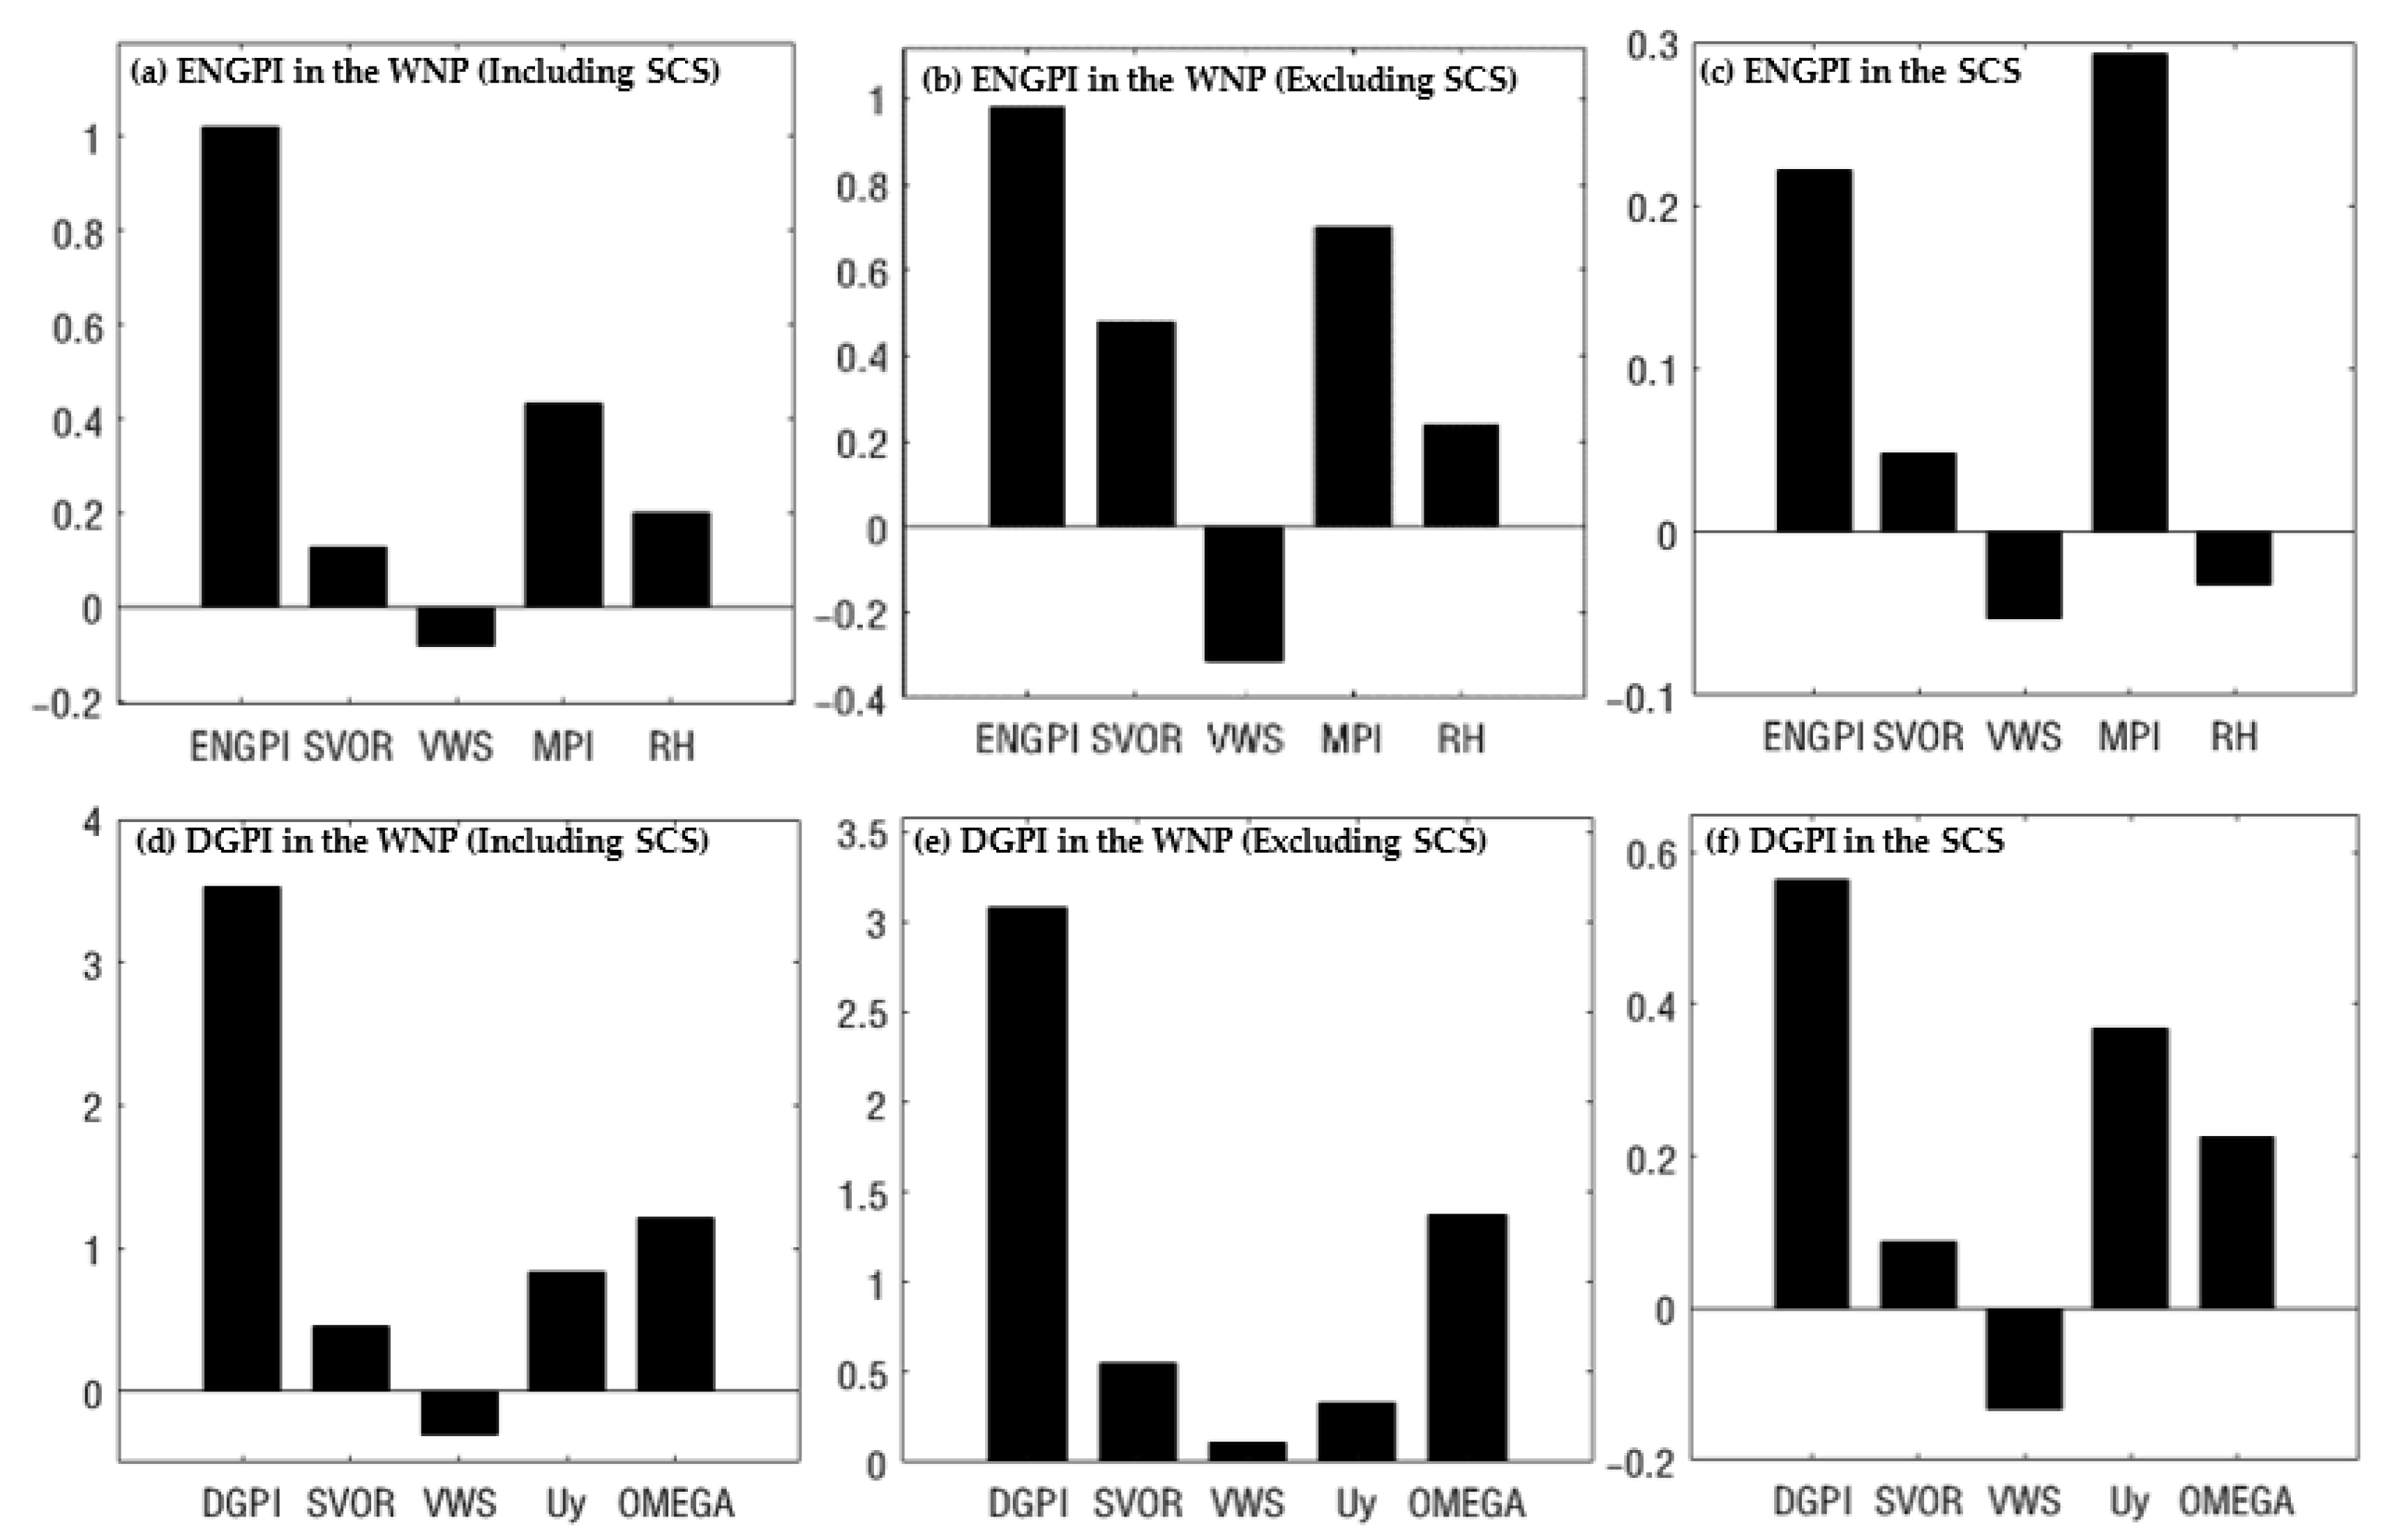
3.3. Key Factors Influencing the Highest TC Frequency in November 2019

Previous studies indicated a weak correlation between the frequency of TC in the SCS and the WNP (excluding SCS) on the inter-annual timescale, implying that the inter-annual changes in the two basins are relatively independent [26,27]. Considering regional differences in TC formation over the SCS and the WNP (excluding SCS), the role of environmental factors affecting TC generation in the two basins may be different. Thus, in this section, we diagnosed the key factors in the SCS, the WNP (excluding the SCS), and the WNP (including the SCS), respectively.
In this study, we used the BDI to quantitatively identify the large-scale environmental factors and focused on the difference between November 2019 and the climatological mean, as well as the differences between the years with high and low TC frequency:
B D I 2019 clim . = M 2019 M clim . σ 2019 + σ clim .
B D I a c t i v e i n a c t i v e = M a c t i v e M i n a c t i v e σ a c t i v e + σ i n a c t i v e
The parameters of M and σ in the BDI are calculated by the average environmental factors relative to the center of each TC genesis time and location within the 10° × 10° domain for different TC cases. The sign of the BDI reflects the physical nature of a variable and the magnitude measures how well a variable can differentiate between the November of 2019 and the climatological mean (or between the years with high and low TC frequency). With the aid of the BDI, we can objectively evaluate how important a variable is.
The environmental factors calculated in the BDI, whether dynamical or thermodynamic, are based on previous studies and the factors included in the ENGPI and DGPI. The rank of key variables based on their BDI values is sorted in Table 2. Taken as a whole, the WNP (including SCS) indicated that absolute vorticity ranks at the top of all the factors; the second factor is vertical velocity. Among the factors we calculated, vertical wind shear and relative humidity had minor BDI. Based on the BDI, dynamical factors such as absolute vorticity and vertical velocity were important factors when attempting to separate the November 2019 disturbances from the climatological mean, while thermodynamic factors such as maximum potential intensity may have been of secondary importance. Furthermore, a similar conclusion could be found for the SCS and the WNP basin (excluding SCS). Whether in the WNP (excluding SCS) or in the SCS, absolute vorticity played the most significant role. Meanwhile, vertical velocity served as the second and third most important factor in the WNP (excluding SCS) and the SCS, respectively. In general, dynamic factors exert a marked influence in both the separated regions and the total WNP basin, while the effects of thermal factors showed somewhat regional differences. In the WNP, the contribution of relative humidity ranked third, while that of maximum potential intensity was the smallest. In the SCS, however, the role of maximum potential intensity ranked second, while relative humidity made a negative contribution. This is consistent with findings in previous studies on the negative contribution of relative humidity over the SCS and the positive role it plays over the WNP basin [27,28].
Although BDI comprehensively described the relative importance of dynamical and thermodynamic factors, it was not enough to reveal the key factors based merely on linear indicators. Previous studies illustrated that the genesis potential index (GPI) is able to replicate the observed climatological annual cycle, as well as the inter-annual variation of TC genesis in several different basins [28,29]. Hence, we further used the ENGPI and DGPI to shed light on key factors from a non-linear perspective. As illustrated in Figure 5, we calculated the ENGPI and DGPI anomalies in the WNP (including SCS), the differences between November 2019 and years with low TC frequency, as well as the differences between the years with high and low TC frequency. The distributions of the ENGPI and DGPI are similar, both marked by slightly positive anomalies over the SCS and highly positive anomalies over the equatorial eastern Pacific. This was consistent with actual observations in TC genesis locations. The spatial correlation between the ENGPI and the actual TC distribution in November 2019 was 0.73, and that between the DGPI and the actual TC distribution was 0.64. Both were statistically significant at a 95% confidence level.
To further understand the physical processes for the record high TC frequency in November 2019, we examined the individual roles of the variables that make up the DGPI and ENGPI, including four dynamical factors—SVOR, OMEGA, VWS, Uy—and two thermodynamic factors—RH and MPI. Based upon analyses of anomalous GPI by varying the variables included in the GPI, Camargo et al. examined how different environmental factors contribute to the influence of ENSO on TC activity, and found that specific factors have more influence than others in different basins [28]. We respectively calculated the ENGPI and DGPI using the long-term climatology (1979–2019) in three of the four variables, while keeping the fourth variable set to the actual value in November 2019. This was then repeated for each of the other three variables. The total anomaly of GPI cannot be simply described as the sum of the four factors due to the nonlinearity of GPI. Nevertheless, the index can provide weights that appropriately quantify the relative importance of the different factors in TC genesis, provided that the nonlinearities are not too large [31]. The parameters in the ENGPI and DGPI were calculated using the average environmental factors relative to the center of each TC genesis time and location within the 10°×10° domain for different TC cases. Similarly as analyzed above, we diagnosed the key factors in the SCS, the WNP (excluding the SCS), and the WNP (including the SCS), respectively.
Taking the WNP (including SCS) as a whole, the ENGPI indicated that absolute vorticity made the largest contribution, followed by the increased maximum potential intensity (Figure 6a). Previous studies suggested that the influence of SST on TC generation is included in the maximum potential intensity, and that warming in the WNP basin (a positive PI anomaly) contributes positively to TC activity through the local thermodynamic process [42,43,44]. These results also showed good agreement in the WNP (excluding SCS) and the SCS, separately (Figure 6b,c), although some differences did exist. When it comes to thermal factors, relative humidity contributes most in the WNP (excluding SCS), while MPI plays a role as the most important factor in the SCS. In terms of the dynamic factors, absolute vorticity played a role of secondary importance in both the WNP (excluding SCS) and SCS. Both BDI and ENGPI revealed the important roles of dynamical factors in influencing the generation of TCs in November 2019 (e.g., enhanced low-level vorticity).
To further reveal the dynamical mechanisms in the formation of TCs, a similar method was utilized to analyze the impact of the four dynamical factors in the DGPI (Figure 6d–f). Results for the DGPI indicated that whether in the WNP (including SCS), the WNP (excluding SCS) or the SCS, vertical velocity plays the largest role in contributing to the total DGPI anomaly, followed by the meridional gradient of zonal wind. The results given by the DGPI shed light on the importance of the meridional gradient of zonal wind, which has not been taken into account in the BDI and ENGPI, thus suggesting that meridional gradient of zonal wind might be of importance in TC genesis in the WNP by influencing the zonal wind confluence zone [45,46]. It should be noted that the thermodynamic factors identified in the ENGPI could be represented by the corresponding large-scale environmental dynamical factors in the DGPI [31]. For instance, relative humidity is highly correlated with vertical velocity, and thus the role of relative humidity can be well represented by the 500 hPa vertical motion. The SST anomaly from the tropical (30° S–30° N) mean (SSTA) is also significantly correlated with vertical velocity. Therefore, the important effects of relative humidity and maximum potential intensity on the generation of TC in the ENGPI might be transferred to vertical velocity in the DGPI, which may be one of the reasons why vertical motion is suggested as the factor with the largest contribution in the DGPI anomaly. The DGPI largely coincides with the BDI, in which vertical velocity also plays a significant role. However, although both the ENGPI and BDI reveal the relative importance of absolute vorticity, it does not play a major role in the DGPI, which may be related to the difference in calculation of absolute vorticity in the DGPI.
We further used the above methods to examine the difference between the years with high and low TC frequency (Figure 7 and Table 3). Taking the WNP (including SCS) as a whole, the results of the three indices all shed light on the possible significance of maximum potential intensity, vertical velocity, and meridional gradient of zonal wind, indicating that these three factors may be critical to the increasing frequency of TC genesis in the WNP.
Considering the WNP (excluding SCS) and the SCS separately, the results indicated that major factors affecting TC genesis in the two basins are similar, although there are some regional differences. Major factors such as maximum potential intensity and vertical velocity play a vital role in both the WNP (excluding SCS) and the SCS. It seems that meridional gradient of zonal wind makes great contributions to TCs in the SCS, but not in the WNP. Absolute vorticity exerts notable impacts on TCs in the WNP (excluding SCS), but plays a minor role in the SCS. The different roles of vertical wind shear between the WNP (excluding SCS) and the SCS in Table 3 are also noteworthy. The BDI for the VWS between the years with high and low TC frequency had positive (negative) values over the SCS (WNP excluding SCS), indicating that the VWS can play different roles in TC activity for these two regions. It appears that the BDI value of the VWS in a coupled basin (i.e., the WNP including SCS) is very minor, compared to the BDI values for the other factors. Previous studies have also shown that the VWS in the central and southern regions of the SCS is positively and significantly correlated with TC frequency in the SCS [45,46]. Based upon these analyses, the contribution of the VWS over the whole WNP (including SCS) might be seriously underestimated by coupling the SCS (i.e., the positive BDI value for the VWS) with the WNP excluding SCS (i.e., the negative BDI value). This hypothesis deserves a further study. It is also noted that relative humidity still makes a negative contribution to TC formation in the SCS, as suggested by the BDI and the ENGPI.
When comparing the difference between 2019 and other years with high TC frequency, it is noteworthy that absolute vorticity was particularly significant in TC genesis in November 2019, but played a minor role in other years with high TC frequency. To conclude, through the BDI, ENGPI, and DGPI, we diagnosed possible key factors affecting the abnormal increase in TCs in November 2019. The results disclosed by the BDI, ENGPI, and DGPI were generally similar, except for several minor factors that contributed little to the generation of TCs (e.g., vertical wind shear). The results indicate that dynamical factors possibly played a major role in TC genesis in November 2019. The enhanced absolute vorticity served the most important role, followed by strong upward motion and positive SST anomaly. These conclusions are consistent with the findings in the context of large-scale conditions, which indicates that our judgment has a certain degree of credibility from both observation and numerical analyses.

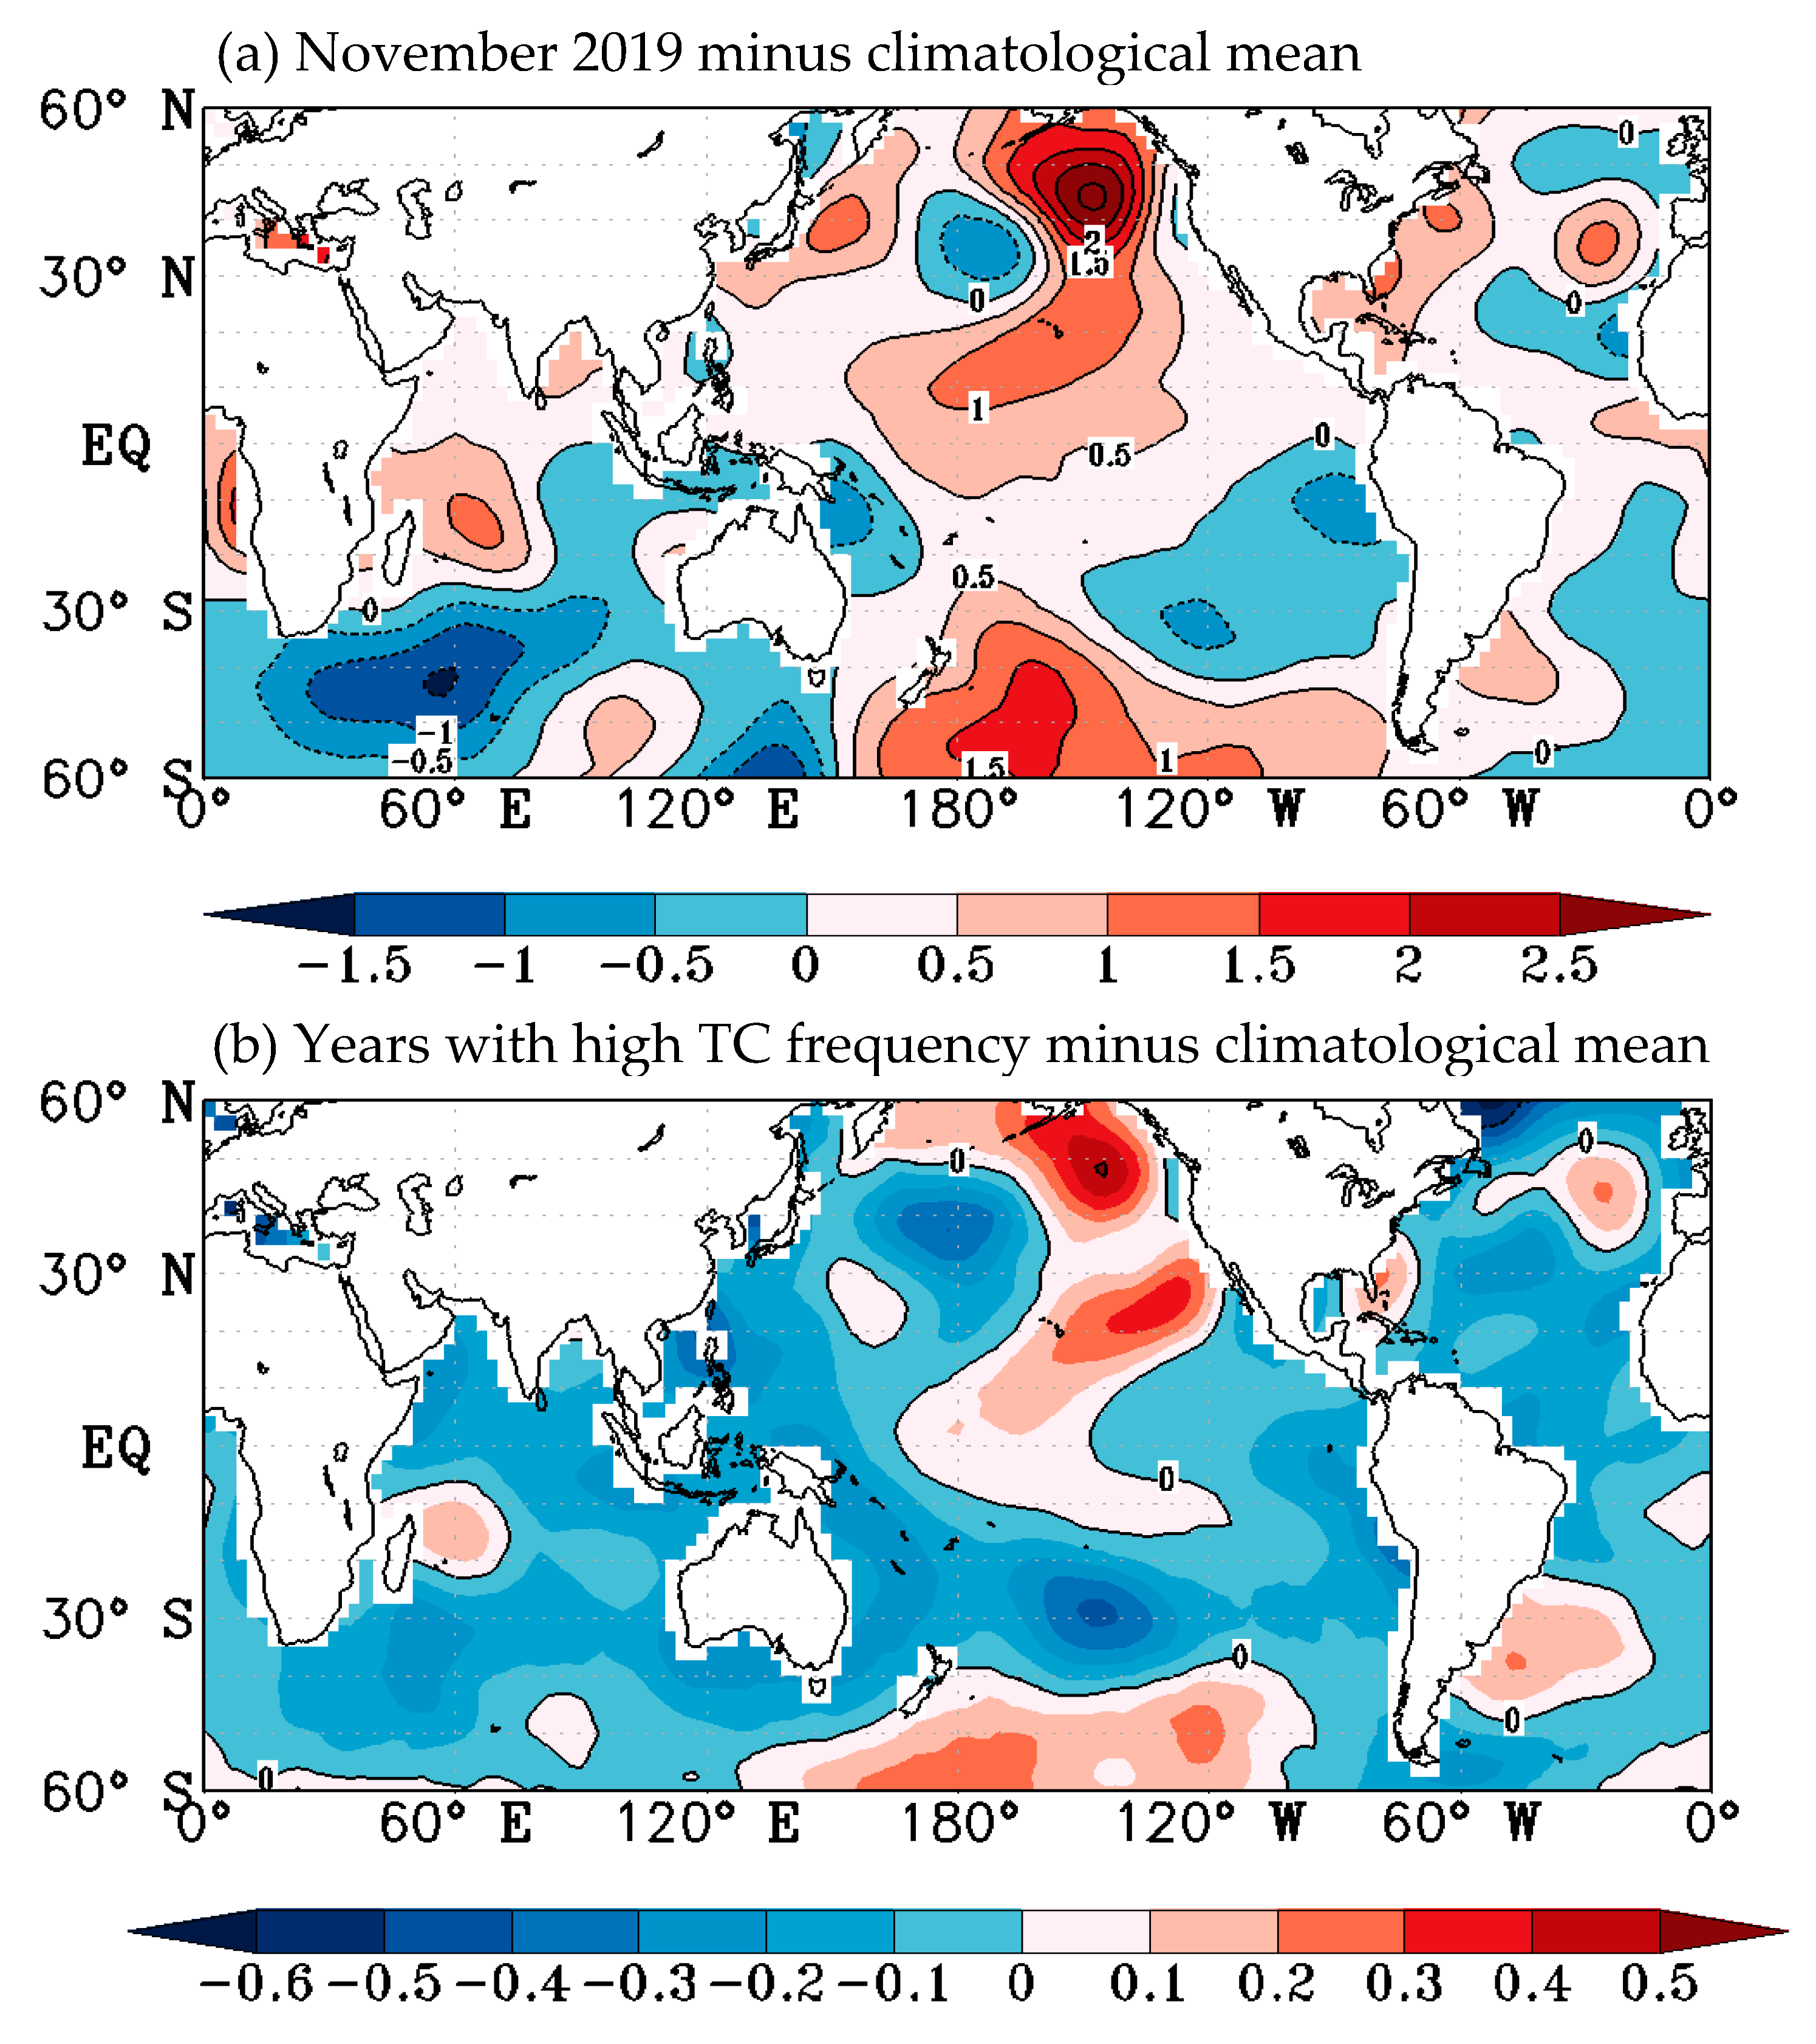
3.4. The Role of Regional SST Changes in Promoting TC Genesis in November 2019

The results of the BDI and ENGPI both reveal the major role of a positive SST anomaly (a positive PI anomaly) in promoting TC genesis in November 2019. Previous studies suggested that enhanced WNP SST contributes positively to TC genesis through local thermodynamic processes [42,43,44]. Moreover, the SST anomaly associated with an El Niño-like pattern could provide a significant dynamical stimulus for TC genesis change [47,48]. Previous studies have also shown that SST affects the distribution of environmental factors through the Walker circulation [48,49]. In addition to the SST anomaly in the Pacific, the SST anomaly in the Indian Ocean can also affect TC frequency over the WNP basin by means of modulating the monsoon circulation and the equatorial Kelvin wave activity [50,51,52]. Thus, the extremely high TC frequency in November 2019 may be associated with the atmospheric circulation in response to the tropics-wide SST change.
To help elucidate the influence of SST over different basins on TC genesis, a discussion on the SST anomaly field was carried out (Figure 8). In the Pacific, a 2.5 °C anomaly was observed in the eastern part, which was even larger than the SST anomaly in years with high TC frequency. In the Indian Ocean, a typical dipole could be seen in the tropical region. Meanwhile, in the south Indian Ocean (SIO), a negative SST anomaly was observed, of about 1.5 °C lower than the climatological mean. We further explored the impact of the SST anomalies in the Pacific Ocean and the Indian Ocean through the Pacific meridional mode (PMM) index and the Indian Ocean Dipole (IOD) index. Notably, a negative SST anomaly was observed in the North Atlantic; its possible contribution to TC genesis in November 2019 in the WNP deserves further discussion.
The PMM index was introduced to describe the impact of Pacific Ocean SST on TC formation. Previous studies have shown that the marine environment of the Pacific Ocean plays a vital role in TC activity [53]. The PMM is the first major mode of the ocean-air coupling meridional dynamical mode in the Pacific Ocean, which is represented by the abnormal meridional SST gradient crossing the average position of the Intertropical Convergence Zone (ITCZ) and the atmospheric boundary layer wind crossing the gradient in the warm-direction abnormal hemisphere [54]. We evaluated the possible relationship between the PMM and November TC formation from 1979 to 2019 (Figure 9a). The linear correlation coefficient between the PMM index and TC frequency was 0.32, which is statistically significant at a 95% confidence level using a Student’s t-test, thus indicating that the PMM has a significant association with TC frequency. Note that the PMM index value in 2019 was the second-largest in the past 41 years, surpassed only in 2017. Combined with the SST anomaly distribution in November 2019 (Figure 8a), the regional SST anomaly over the WNP basin in November 2019 was characterized by more warming in the eastern Pacific compared to the climatological mean. This may lead to an increase in upward motion and midlevel RH, which generally promotes TC formation over the WNP basin.
To describe the remote impact of the Indian Ocean SST on TC formation over the WNP basin, we also used the IOD index. There are three types of IOD indexes: namely, the tropical Indian Ocean uniform sea temperature mode (IOBW) [55,56], the subtropical South Indian Ocean Dipole (SIOD) [57,58], and the tropical Indian Ocean SST dipole (TIOD) [59,60]. We evaluated the correlations between the three IOD indices and TC frequency during 1979–2019. Results showed that both the SIOD index and IOBW index had a negative relationship with TC frequency (figure not shown). Conversely, TIOD had a positive influence on TC formation, and the correlation coefficient between the TC numbers and TIOD was about 0.15, which is not statistically significant at a 95% confidence level. Although the correlation between the IOD index and TC frequency in November was insignificant through the 1979–2019 period, as shown in Figure 9b, many previous studies have indicated that anomalous SST associated with a positive (negative) IOD index, and especially extreme IOD events, may cause changes in large-scale circulations and thus affect TC formation over the WNP basin [60,61].
It is noteworthy that the TIOD index reached its highest point in 2019, and previous studies proposed a possible mechanism whereby TIO warming acts like a capacitor that anchors the atmospheric anomalies over the Indo-western Pacific oceans [59,60]. Further studies suggested that the tropical Indian Ocean teleconnection is accomplished by a warm atmospheric Kelvin wave propagating into the WNP basin [61,62]. In the tropical Indian Ocean, high temperatures in western part might reduce the strength of the Walker circulation, thus causing the occurrence of abnormal easterly winds in the tropical Indian Ocean [61,62]. Tropical Pacific fields can be affected by the abnormal winds, thus promoting the intensity of cyclones, which helps explain the unusually high TC frequency in the WNP in November 2019. Moreover, recent studies have further investigated the impact of the SIO on the frequency of TCs over the WNP [61,62]. The abnormal decrease in SST in the SIO (Figure 8a) might have induced intensified ascending motions and higher SST over the WNP with sufficient moisture that supplied a favorable environment for TC formation.
In summary, the regional SST anomaly in November 2019 was characterized by more warming in the eastern Pacific Ocean compared to the climatological mean. Previous studies suggested that positive PMM-like SSTA forces an east-west overturning circulation anomaly in the subtropical North Pacific, and the typical PMM pattern may exert an influence on large-scale circulation in the WNP (e.g., increasing upward motion), generally promoting TC formation over the WNP region [54]. Moreover, previous studies also implied that the energy propagation of the stationary planetary wave could be responsible for the tropospheric teleconnection between IOD and tropical Pacific Ocean [61,62,63]. Thus, the effect of regional SST distribution over TIO with an extreme IOD event may also promote TC formation over the WNP basin. Similarly to the analyses using the BDI and GPI, the positive anomalies in local SST serve an indispensable thermodynamic role, suggesting a positive role for changes in local SST. These hypotheses should be confirmed or tested with more observations and numerical simulations in a future study.

4. Summary and Discussions

November TC frequency in the WNP region set a record high in 2019. The same results can be found in the best track datasets available from three organizations (JTWC, CMA_STI, and JMA). This suggests that the record high TC frequency is robust. In November 2019, five TCs occurred in the WNP region while only one occurred in the SCS. Relatively more TCs have occurred in the SCS in years with low TC frequency, while more have occurred in the WNP in years with high TC frequency, in agreement with previous studies [26,27].
Large-scale environmental factors impacting TC genesis during November 2019 were discussed. Overall, the large-scale conditions in November 2019 over the WNP favored TC genesis, and were characterized by enhanced absolute vorticity, strong ascending motion, increased midlevel relative humidity, and favorable SSTA patterns with local warming over the eastern WNP, an extreme IOD event, and strong PMM mode [33,34,35,36,37]. Using the ENGPI proposed by Emanuel and Nolan [25], the DGPI developed by Wang and Murakami [31], and the BDI proposed by Fu et al. [33], the relative importance of these large-scale environmental factors was diagnosed. The results indicated that dynamical factors played a major role in TC genesis in November 2019. The enhanced absolute vorticity served as the most important factor, followed by strong upward motion and MPI.
Both BDI and GPI analyses indicated the indispensable role of SST in the generation of TCs in November 2019. Previous studies also suggested that SST anomalies in different ocean basins exert a profound influence on TC formation in the WNP [42,43,44,50,51]. In particular, significant positive SST anomalies in the eastern Pacific, a typical dipole in the tropical Indian Ocean, and an abnormally negative SST anomaly in the South Indian Ocean were observed in November 2019. We found that both the PMM and the IOD indices reached extremely high values in 2019, indicating that the typical PMM and IOD modes may have induced abnormal circulations in the WNP and changes in other environmental factors, thus promoting the generation of TCs in November that year [62,63].
This study provided a better understanding of the high frequency of TCs in the WNP in November 2019, and could benefit operational climate predictions of TC activity. Further examinations based on numerical experiments should be carried out to support the relative roles of the aforementioned factors found through observational analyses. As a final comment, while this study implied that changes in environmental factors were possibly driven by changes in regional SSTA over the Pacific and the tropical Indian Ocean, it remains unclear which of these atmospheric and oceanic mechanisms were responsible for the extremely high frequency of TCs observed in November 2019. More observational analyses and numerical simulations are needed to explore the underlying associated physical mechanisms for the record-high TC frequency from the perspective of Indo-Pacific Ocean interaction.

Author Contributions

Conceptualization, H.Z. and M.S.; methodology, H.Z., M.S., S.W., and X.Q.; software, M.S., S.W., and X.Q.; validation, H.Z. and M.S.; formal analysis, H.Z., M.S., S.W., and X.Q.; investigation, M.S., S.W., and X.Q.; resources, M.S. and X.Q.; data curation, M.S.; writing—original draft preparation, M.S. and S.W.; writing—review and editing, H.Z., M.S., S.W., X.Q., and Y.S.; visualization, M.S., S.W., and X.Q.; supervision, H.Z. and Y.S.; project administration, M.S. All authors have read and agreed to the published version of the manuscript.

Funding

This research was jointly supported by College Students’ Practice Innovation Training Program of Jiangsu Province, NUIST Students’ Platform for Innovation and Entrepreneurship Training Program (202010300002Z), the Natural Science Foundation of Jiangsu Province (Grant no. BK20181412), and the project of the "Six Talent Peaks Project" in Jiangsu Province (2019-JY-100).

Institutional Review Board Statement

Not applicable.

Informed Consent Statement

Not applicable.

Data Availability Statement

The datasets used in this study are publicly available online.

Acknowledgments

The authors acknowledge Emanuel for providing code of MPI in the calculation of ENGPI.

Conflicts of Interest

The authors declare no conflict of interest.

References

  1. You, L.; Gao, J.; Lin, H.; Chen, S. Impact of the intra-seasonal oscillation on tropical cyclone genesis over the western North Pacific. Int. J. Climatol. 2019, 39, 1969–1984. [Google Scholar] [CrossRef]
  2. Tan, K.; Huang, P.; Liu, F.; Murakami, H.; Hsu, P.C. Simulated ENSO’s impact on tropical cyclone genesis over the western North Pacific in CMIP5 models and its changes under global warming. Int. J. Climatol. 2019, 39, 3668–3678. [Google Scholar] [CrossRef]
  3. Li, H.; Xu, F.; Sun, J.; Lin, Y.; Wright, J.S. Subtropical High Affects Interdecadal Variability of Tropical Cyclone Genesis in the South China Sea. J. Geophys. Res. 2019, 124, 6379–6392. [Google Scholar] [CrossRef]
  4. Lee, M.; Hong, C.; Tseng, W.; Hsu, H. Distinct Influences of the ENSO-Like and PMM-Like SST Anomalies on the Mean TC Genesis Location in the Western North Pacific: The 2015 Summer as an Extreme Example. J. Clim. 2018, 31, 3049–3059. [Google Scholar]
  5. Defforge, C.L.; Merlis, T.M. Observed warming trend in sea surface temperature at tropical cyclone genesis. Geophys. Res. Lett. 2017, 44, 1034–1040. [Google Scholar] [CrossRef]
  6. Weng, C.; Hsu, H. Intraseasonal oscillation enhancing C5 typhoon occurrence over the tropical western North Pacific. Geophys. Res. Lett. 2017, 44, 3339–3345. [Google Scholar] [CrossRef]
  7. Curtis, S. The Madden-Julian Oscillation: A tool for regional seasonal precipitation outlooks? Atmosphere 2017, 8, 180. [Google Scholar] [CrossRef] [Green Version]
  8. Alvarez, M.S.; Vera, C.S.; Kiladis, G.N. MJO modulating the activity of the leading mode of intraseasonal variability in South America. Atmosphere 2017, 8, 232. [Google Scholar] [CrossRef] [Green Version]
  9. Tang, H.; Ahrens, B.; Micheels, A.; Eronen, J.T. Strong interannual variation of the Indian summer monsoon in the Late Miocene. Clim. Dyn. 2013, 41, 135–153. [Google Scholar] [CrossRef]
  10. Zhang, S.; Du, L.; Wang, H.; Jiang, H. Regional sea level variation on interannual timescale in the East China Sea. J. Clim. 2014, 5, 1405–1414. [Google Scholar] [CrossRef] [Green Version]
  11. Wang, L.; Chen, L. Interannual variation of the Asian-Pacific oscillation. Dyn. Atmos. Ocean. 2017, 77, 17–25. [Google Scholar] [CrossRef] [Green Version]
  12. Wu, X.; Mao, J. Interdecadal variability of early summer monsoon rainfall over South China in association with the Pacific Decadal Oscillation. Int. J. Climatol. 2017, 37, 706–721. [Google Scholar] [CrossRef]
  13. Hua, W.; Dai, A.; Qin, M. Contributions of internal variability and external forcing to the recent Pacific decadal variations. Geophys. Res. Lett. 2018, 45, 7084–7092. [Google Scholar] [CrossRef] [Green Version]
  14. Lou, J.; Holbrook, N.J.; O’Kane, T.J. South Pacific decadal climate variability and potential predictability. J. Clim. 2019, 32, 6051–6069. [Google Scholar] [CrossRef]
  15. Ramesh, N.; Cane, M.A. The predictability of tropical Pacific decadal variability: Insights from attractor reconstruction. J. Atmos. Sci. 2019, 76, 801–819. [Google Scholar] [CrossRef]
  16. Maue, R.N. Recent historically low global tropical cyclone activity. Geophys. Res. Lett. 2011, 38. [Google Scholar] [CrossRef]
  17. Zhao, H.; Raga, G.B. The influence of large-scale circulations on the extremely inactive tropical cyclone activity in 2010 over the western North Pacific. Atmósfera 2014, 27, 353–365. [Google Scholar] [CrossRef] [Green Version]
  18. Rajasree, V.P.M.; Kesarkar, A.P.; Bhate, J.N.; Singh, V.; Umakanth, U.; Varma, T.H. A comparative study on the genesis of North Indian Ocean tropical cyclone Madi (2013) and Atlantic Ocean tropical cyclone Florence (2006). J. Geophys. Res. 2016, 121, 13826–13858. [Google Scholar] [CrossRef]
  19. Wenjie, D.; Fumin, R.; Jin, L.; Xiuqun, Y.; Guoxiong, W. Reliability analysis of climate change of tropical cyclone activity over the western North Pacific. J. Clim. 2011, 24, 5887–5898. [Google Scholar]
  20. Zhao, H.; Wu, L. Dynamically derived tropical cyclone intensity changes over the western North Pacific. J. Clim. 2012, 25, 89–98. [Google Scholar]
  21. Kawabata, Y.; Yamaguchi, M. Probability Ellipse for tropical cyclone track forecasts with multiple ensembles. J. Meteorol. Soc. Jpn. Ser. II 2020, 98, 821–833. [Google Scholar] [CrossRef]
  22. Yang, H.; Wu, L.; Xie, T. Comparisons of four methods for tropical cyclone center detection in a high-resolution simulation. J. Meteorol. Soc. Jpn. Ser. II 2020, 98, 379–393. [Google Scholar] [CrossRef] [Green Version]
  23. Kalnay, E.; Kanamitsu, M.; Kistler, R.; Collins, W.; Deaven, D.; Gandin, L.; Iredell, M.; Saha, S.; White, G.; Woollen, J.; et al. The NCEP/NCAR 40-year reanalysis project. Bull. Amer. Meteorol. Soc. 1996, 77, 437–471. [Google Scholar] [CrossRef] [Green Version]
  24. Smith, T.M.; Reynolds, R.W. Improved extended reconstruction of SST (1854–1997). J. Clim. 2004, 17, 2466–2477. [Google Scholar] [CrossRef]
  25. Emanuel, K.A.; Nolan, D.S. Tropical cyclone activity and the global climate system. In Proceedings of the 26th Conference on Hurricanes and Tropical Meteorology, Miami, FL, USA, 3–7 May 2004. [Google Scholar]
  26. Zhang, M.; Zhou, L.; Chen, D.; Wang, C. A genesis potential index for Western North Pacific tropical cyclones by using oceanic parameters. J. Geophys. Res. 2016, 121, 7176–7191. [Google Scholar] [CrossRef] [Green Version]
  27. Zhao, H.; Klotzbach, P.J.; Raga, G.B.; Chen, S. Impact of the extended boreal summer intraseasonal oscillation on Western North Pacific tropical cloud cluster genesis productivity. J. Clim. 2018, 31, 9175–9191. [Google Scholar] [CrossRef]
  28. Camargo, S.J.; Emanuel, K.A.; Sobel, A.H. Use of a genesis potential index to diagnose ENSO effects on tropical cyclone genesis. J. Clim. 2007, 20, 4819–4834. [Google Scholar] [CrossRef]
  29. Bister, M.; Emanuel, K.A. Low frequency variability of tropical cyclone potential intensity 1. Interannual to interdecadal variability. J. Geophys. Res. 2002, 107, 21–26. [Google Scholar] [CrossRef]
  30. Kitoh, A.; Murakami, H.; Wang, B.; Li, T. Projected increase in tropical cyclones near Hawaii. Nat. Clim. Chang. 2013, 3, 749–754. [Google Scholar]
  31. Wang, B.; Murakami, H. Dynamical genesis potential index for diagnosing present-day and future global tropical cyclone genesis. Environ. Res. Lett. 2020, 15, 114008–114010. [Google Scholar] [CrossRef]
  32. Xie, X.; Wang, B. Low-frequency equatorial waves in vertically shear flow. Part I: Stable waves. J. Atmos. Sci. 1996, 53, 449–467. [Google Scholar] [CrossRef] [Green Version]
  33. Fu, B.; Stevens, D.E.; Peng, M.S.; Li, T. Developing versus nondeveloping disturbances for tropical cyclone formation. Part I: North Atlantic. Mon. Weather Rev. 2012, 140, 1047–1066. [Google Scholar] [CrossRef] [Green Version]
  34. Emanuel, K.A. Increasing destructiveness of tropical cyclones over the past 30 years. Nature 2005, 436, 686–688. [Google Scholar] [CrossRef] [PubMed]
  35. Vecchi, G.A.; Soden, B.J. Increased tropical Atlantic wind shear in model projections of global warming. Geophys. Res. Lett. 2007, 34, L08702. [Google Scholar] [CrossRef] [Green Version]
  36. Latif, M.; Keenlyside, N.; Bader, J. Tropical sea surface temperature, vertical wind shear, and hurricane development. Geophys. Res. Lett. 2007, 34, L01710. [Google Scholar] [CrossRef] [Green Version]
  37. Zhao, H.; Chu, P.S.; Hsu, P.C.; Murakami, H. Exploratory analysis of extremely low tropical cyclone activity during the late-season of 2010 and 1998 over the western North Pacific and the South China Sea. J. Adv. Model. Earth. Syst. 2014, 6, 1141–1153. [Google Scholar] [CrossRef]
  38. Li, H.; Sriver, R.L. Tropical Cyclone Activity in the high-resolution community earth system model and the impact of ocean coupling. Adv. Model. Earth. Syst. 2018, 10, 165–186. [Google Scholar] [CrossRef]
  39. Xie, S.-P.; Yang, L.; Du, Y. Tropical Indian Ocean influence on Northwest Pacific tropical cyclones in summer following strong El Nino. J. Clim. 2011, 24, 315–322. [Google Scholar]
  40. Samson, G.; Masson, S.; Lengaigne, M.; Keerthi, M.G.; Vialard, J.; Pous, S.; Madec, G.; Jourdain, N.C.; Jullien, S.; Menkes, C.; et al. The NOW regional coupled model: Application to the tropical Indian Ocean climate and tropical cyclone activity. Adv. Model. Earth. Syst. 2014, 6, 700–722. [Google Scholar] [CrossRef] [Green Version]
  41. Emanuel, K. Effect of Upper-Ocean Evolution on projected trends in tropical cyclone activity. J. Clim. 2015, 28, 8165–8170. [Google Scholar] [CrossRef]
  42. Emanuel, K.; Sobel, A. Response of tropical sea surface temperature, precipitation, and tropical cyclone-related variables to changes in global and local forcing. Adv. Model. Earth. Syst. 2013, 5, 447–458. [Google Scholar] [CrossRef]
  43. Stephens, S.A.; Ramsay, D.L. Extreme cyclone wave climate in the Southwest Pacific Ocean: Influence of the El Nino Southern Oscillation and projected climate change. Glob. Planet. Chang. 2014, 123, 13–26. [Google Scholar] [CrossRef] [Green Version]
  44. Zhang, S.; Zhao, M.; Lin, S.J.; Yang, X.; Anderson, W.; Zhang, W.; Rosati, A.; Underwood, S.; Zeng, F. Impact of having realistic tropical cyclone frequency on ocean heat content and transport forecasts in a high-resolution coupled model. Geophys. Res. Lett. 2015, 42, 5966–5973. [Google Scholar] [CrossRef]
  45. McBride, J.L.; Zehr, R. Observational analysis of tropical cyclone formation: Comparison of non-developing versus developing systems. J. Atmos. Sci. 1981, 38, 1132–1151. [Google Scholar] [CrossRef] [Green Version]
  46. Peng, M.S.; LI, T.; Stevens, D.E.; Fu, B. Developing versus nondeveloping disturbances for tropical cyclone formation. Part II: Western North Pacific. Mon. Weather Rev. 2012, 140, 1067–1080. [Google Scholar] [CrossRef] [Green Version]
  47. Zhan, R.; Wang, Y.; Lei, X. Contributions of ENSO and East Indian Ocean SSTA to the interannual variability of Northwest Pacific tropical cyclone frequency. J. Clim. 2011, 24, 509–521. [Google Scholar] [CrossRef]
  48. Huu, C.T.; Sato, T. Effect of ENSO phase on the contribution of environmental variables to tropical cyclone genesis in the western North Pacific. Int. J. Climatol. 2019, 39, 2461–2473. [Google Scholar]
  49. Le, T.; Bae, D.H. Causal Links on interannual timescale between ENSO and the IOD in CMIP5 future simulations. Geophys. Res. Lett. 2019, 46, 2820–2828. [Google Scholar] [CrossRef]
  50. Kelly, K.A.; Jiang, C.L.; Cronin, M.F.; Thompson, L. The roles of intraseasonal Kelvin waves and tropical instability waves in SST variability along the equatorial Pacific in an isopycnal ocean model. J. Clim. 2009, 22, 3470–3487. [Google Scholar]
  51. Lestari, R.K.; Koh, T. Statistical evidence for asymmetry in ENSO-IOD interactions. Atmos. Ocean 2016, 54, 498–504. [Google Scholar] [CrossRef]
  52. Yuan, J.; Gao, Y.; Feng, D.; Yang, Y. The zonal dipole pattern of tropical cyclone genesis in the Indian Ocean influenced by the tropical Indo-Pacific Ocean sea surface temperature anomalies. J. Clim. 2019, 32, 6533–6549. [Google Scholar] [CrossRef]
  53. Zhan, R.; Wang, Y.; Liu, Q. Salient differences in tropical cyclone activity over the Western North Pacific between 1998 and 2016. J. Clim. 2017, 30, 9979–9997. [Google Scholar] [CrossRef]
  54. Chiang, J.C.; Viomont, D.J. Analogous Pacific and Atlantic Meridional Modes of tropical armosphere-ocean variability. J. Clim. 2004, 17, 4143–4158. [Google Scholar] [CrossRef]
  55. Klein, S.A.; Soden, B.J.; Lau, N.C. Remote sea surface temperature variations during ENSO: Evidence for a tropical atmospheric bridge. J. Clim. 1999, 12, 917–932. [Google Scholar] [CrossRef] [Green Version]
  56. Lau, N.C.; Nath, M.J. Impact of ENSO on the variability of the Asian-Australian monsoons as simulated in GCM experiments. J. Clim. 2000, 13, 4287–4309. [Google Scholar] [CrossRef] [Green Version]
  57. Behera, S.K.; Yamagata, T. Subtropical SST dipole events in the southern Indian Ocean. Geophys. Res. Lett. 2001, 28, 327–330. [Google Scholar] [CrossRef]
  58. Reason, C.J.C. Subtropical Indian Ocean SST dipole events and southern African rainfall. Geophys. Res. Lett. 2001, 28, 2225–2227. [Google Scholar] [CrossRef]
  59. Saji, N.H.; Goswami, B.N.; Vinayachandran, P.N.; Yamagata, T. A dipole mode in the tropical Indian Ocean. Nature 1999, 401, 360–363. [Google Scholar] [CrossRef]
  60. Webster, P.J.; Moore, A.M.; Loschnigg, J.P.; Leben, R.R. Coupled ocean-atmosphere dynamicals in the Indian Ocean during 1997–1998. Nature 1999, 401, 356–360. [Google Scholar] [CrossRef]
  61. Wang, T.; Lu, X.; Yang, S. Impact of south Indian Ocean Dipole on tropical cyclone genesis over the South China Sea. Int. J. Climatol. 2019, 39, 101–111. [Google Scholar] [CrossRef]
  62. Magee, A.D.; Kidd, D.C.V. On the relationship between Indian Ocean sea surface temperature variability and tropical cyclogenesis in the southwest Pacific. Int. J. Climatol. 2018, 38, e774–e795. [Google Scholar] [CrossRef]
  63. Yong, L.; Ping, H.; Guanghua, C. Impacts of the combined modes of the tropical Indo-Pacific sea surface temperature anomalies on the tropical cyclone genesis over the western North Pacific. Int. J. Climatol. 2019, 39, 2108–2119. [Google Scholar]
Figure 1. November TC frequency over the WNP basin from 1979 to 2019. The data was collected from the JTWC best track dataset. The solid line represents the climatological mean over the 41 years. Dashed lines stand for one standard deviation of TC frequency during 1979–2019.
Atmosphere 12 00501 g001
Figure 2. The genesis locations of TCs in November in the year 2019 (black), the years with high TC frequency (red), and the years with low TC frequency (blue), with different geographic locations for the WNP basin (equator to 30° N, 120° to 180° E) and the SCS (equator to 22° N, 105° to 120° E).
Atmosphere 12 00501 g002
Figure 3. Differences in environmental factors in November 2019 compared to the climatological mean: (a) 850 hPa absolute vorticity (unit: 10−6 s−1); (b) 500 hPa vertical velocity (unit: −10−1 Pa s−1); (c) meridional gradient of zonal wind at 500 hPa (unit: s−1); (d) vertical wind shear (unit: m s−1); (e) 600 hPa relative humidity (%); (f) sea surface temperature (unit: °C).
Atmosphere 12 00501 g003
Figure 4. Differences in environmental factors in years with high and low TC frequency: (a) 850 hPa absolute vorticity (unit: 10−6 s−1); (b) 500 hPa vertical velocity (unit: −10−1 Pa s−1); (c) meridional gradient of zonal wind at 500 hPa (unit: s−1); (d) vertical wind shear (unit: m s−1); (e) 600 hPa relative humidity (%); (f) sea surface temperature (unit: °C). The values in black dots are significant at a 95% confidence level.
Atmosphere 12 00501 g004
Figure 5. Anomalies in the WNP (including SCS) for (a) ENGPI in November 2019 compared to years with low TC frequency; (b) ENGPI in years with high TC frequency compared to the low TC frequency years; (c) DGPI in November 2019 compared to years with low TC frequency; and (d) DGPI in years with high TC frequency compared to the low TC frequency years.
Atmosphere 12 00501 g005
Figure 6. Differences of the GPI (November 2019 minus the climatological mean) and varying variables over different sea areas: total ENGPI anomaly and the ENGPI anomaly varying absolute vorticity (SVOR), vertical wind shear (VWS), maximum potential intensity (MPI), and 600 hPa relative humidity (RH) in the WNP (including SCS) (a), the WNP (excluding SCS) (b), and the SCS (c); Total DGPI anomaly and the DGPI anomaly varying absolute vorticity (SVOR), vertical wind shear (VWS), meridional gradient of zonal wind (Uy), and vertical velocity (OMEGA) in the WNP (including SCS) (d), the WNP (excluding SCS) (e), and the SCS (f).
Atmosphere 12 00501 g006
Figure 7. Differences of the GPI (the years with high TC frequency minus the years with low TC frequency) and varying variables over different sea areas: total ENGPI anomaly and the ENGPI anomaly varying absolute vorticity (SVOR), vertical wind shear (VWS), maximum potential intensity (MPI), and 600 hPa relative humidity (RH) in the WNP (including SCS) (a), the WNP (excluding SCS) (b), and the SCS (c); Total DGPI anomaly and the DGPI anomaly varying absolute vorticity (SVOR), vertical wind shear (VWS), meridional gradient of zonal wind (Uy), and vertical velocity (OMEGA) in the WNP (including SCS) (d), the WNP (excluding SCS) (e), and the SCS (f).
Atmosphere 12 00501 g007
Figure 8. SST anomalies for (a) November 2019 minus the climatological mean and (b) the years with high TC frequency minus the climatological mean.
Atmosphere 12 00501 g008
Figure 9. Standardized time series of TC frequency and Pacific meridional mode (PMM) index (a), and tropical Indian Ocean Dipole (TIOD) index (b) in the Novembers of 1979–2019. Correlation coefficients are also shown, with the sign “*” indicating a significant value at a 95% confidence level.
Atmosphere 12 00501 g009
Table 1. Years with high (≥mean value plus one standard deviation) and low (≤mean value minus one standard deviation) TC frequency in November.
Years with high TC frequency in November1979, 1981, 1983, 1986, 1990, 1991, 2007, 2019
Years with low TC frequency in November1982, 1985, 1994, 1995, 2000, 2010, 2011, 2015
Table 2. BDI values of environmental factors in measuring the difference between November 2019 and the climatological mean in different sea areas.
Variable NamesBDI in the WNP (Including SCS)BDI in the WNP (Excluding SCS)BDI in the SCS
Absolute vorticity (SVOR)+0.94+0.80+0.82
Vertical velocity (OMEGA)+0.54+0.63+0.45
Maximum potential intensity (MPI)+0.41+0.39+0.69
Meridional gradient of zonal wind (Uy)+0.36+0.51+0.44
Vertical wind shear (VWS)−0.19−0.48−0.24
Relative humidity (RH)+0.08+0.53−0.21
Table 3. BDI values of environmental factors in measuring the difference between years with high and low TC frequency in different sea areas.
Variable NamesBDI in the WNP (Including SCS)BDI in the WNP (Excluding SCS)BDI in the SCS
Vertical velocity (OMEGA)+0.49+0.79+0.20
Meridional gradient of zonal wind (Uy)+0.48+0.44+0.44
Maximum potential intensity (MPI)+0.41+0.66+0.55
Relative humidity (RH)+0.29+0.62−0.10
Absolute vorticity (SVOR)+0.26+0.70+0.19
Vertical wind shear (VWS)−0.16−0.60+0.35
Publisher’s Note: MDPI stays neutral with regard to jurisdictional claims in published maps and institutional affiliations.

