Article

Trends in Different Grades of Precipitation over the Yangtze River Basin from 1960 to 2017

1
Faculty of Geographical Science, Beijing Normal University, Beijing 100875, China
2
State Key Laboratory of Earth Surface Process and Resource Ecology, Beijing Normal University, Beijing 100875, China
*
Author to whom correspondence should be addressed.
Atmosphere 2021, 12(3), 413; https://doi.org/10.3390/atmos12030413
Submission received: 5 February 2021 / Revised: 19 March 2021 / Accepted: 19 March 2021 / Published: 23 March 2021
(This article belongs to the Section Climatology)

Abstract

:
Under the background of global warming, the trends and variabilities of different grades of precipitation have significant effects on the management of regional ecosystems and water resources. Based on a daily precipitation dataset collected from 148 meteorological stations in the Yangtze River Basin from 1960 to 2017, precipitation events were divided into four grades (small, moderate, large, and heavy precipitation events) according to the precipitation intensity to analyze the temporal and spatial change trends of different grades of precipitation amounts and frequencies, and the influence of different grades of precipitation on total precipitation was also discussed in this study. The results revealed that small precipitation amounts over the Yangtze River Basin decreased significantly, with a rate of −1.22%/10a, while heavy precipitation amounts showed a significant increasing trend (4.27%/10a) during the study period. The precipitation frequency of small and total events decreased significantly, with rates of −3.86%/10a and −2.97%/10a, respectively. Regionally, from the upper reaches to the lower reaches of the Yangtze River Basin, the contribution rate of small precipitation amounts and frequencies to the total precipitation gradually decreased, while heavy precipitation amounts and frequencies increased. The different grades of precipitation in region II showed a decreasing trend due to its unique geographical features. Furthermore, a Pearson correlation analysis was used to analyze the response of precipitation to long-term air temperature, demonstrating that small and moderate precipitation amounts and frequencies were mainly negatively correlated with long-term air temperature and that heavy precipitation amounts showed a stronger positive correlation with long-term air temperature (13.35%/K). Based on this, the rate of change in heavy precipitation in the Yangtze River Basin may be higher under the background of climate warming, which will lead to greater risks of extreme floods in the future. Evaluating and predicting the trends of different grades can provide a theoretical reference for agricultural production, flood control, and drought mitigation.

1. Introduction

In the context of global warming and frequent human activities, a series of changes have taken place in global and local precipitation patterns, resulting in changes in regional and global water cycles [1,2,3]. The precipitation characteristics (amount, frequency, and intensity) of different grades are expected to change [4]. Based on the data of 8326 high-quality terrestrial observatories around the world, Westra et al. [5] revealed that the trend of annual maximum daily precipitation time series from 1900 to 2009 showed a significant growth trend on a global scale, and nearly two-thirds of the stations showed an increase. However, precipitation changes are complex. Willems [6] also observed that the precipitation extremes in Europe have an oscillating behavior on a time scale of several decades. However, a short-term increase in heavy precipitation will cause flooding, while a continuous and steady decrease in light precipitation could lead to drought [7,8]. Therefore, identifying changes in different grades of precipitation is imperative for exploring water management strategies, agricultural applications, and ecosystem characteristics.
Different changes in precipitation regimes have been detected across different regions worldwide. In the middle and low latitudes, extreme precipitation is on the rise and small precipitation events are on the decline [9]. Fujibe [10] also demonstrated that from 1989–2003, Japan experienced increased heavy precipitation during all seasons, while the occurrence of small precipitation events decreased. A study conducted by Kysely [11] revealed a generally positive trend in winter extreme precipitation in the mid-latitude land areas of the Northern Hemisphere. Bengtsson and Rana [12] found that the annual maximum multi-day rainfall has increased in southern Sweden over the last 50 years. In contrast, significant downward trends in heavy precipitation events have been observed over Western Australia and Europe [13,14], and an increasing trend in small precipitation events has been detected in North America and southern Europe [15]. In China, the frequency of small and moderate precipitation events showed a clear downward trend [4,16]. However, the changes in heavy precipitation events are relatively complex, with obvious regional and local characteristics [7,17]. Increases in extreme precipitation were found in western and southern China, especially in the middle and lower Yangtze River Basin (YRB), whereas decreases in extreme precipitation were detected in northern China [18,19].
Analyzing the contribution of different grades of precipitation to the total precipitation is essential to understand the long-term impact of global warming on the global hydrological cycle [20]. Previous research has been conducted in this area. For instance, Karl and Knight [21] set up 20th -century American differently graded precipitation trends, according to the percentile threshold, and stated that the increase in total precipitation was caused by the increase in extreme precipitation events. In addition, Raziei et al. [22] found that the contribution of less than 75% of precipitation events to total annual precipitation decreased, while the contribution of extreme events increased in Iran. In China, many studies have revealed that accumulated small precipitation events accounted for an important proportion of the annual precipitation amount and contributed greatly to precipitation frequency, while large and heavy precipitation amounts and frequencies have gradually increased [23,24].
According to the fifth assessment report of the Intergovernmental Panel on Climate Change (IPCC), with global warming, the intensity and frequency of heavy precipitation have increased, and this trend will continue in the future [25]. In theory, this change in precipitation is believed to be related to global warming [26,27,28]; as air temperature increases, according to the Clausius–Clapeyron equation, the change in precipitation will increase by approximately 7% K−1 [29,30,31], and the water vapor content increases, which affects precipitation. Karl and Trenberth [32] selected sites with the same amount of precipitation around the world and found that sites with higher average temperatures have more heavy precipitation and fewer small precipitation events. Similarly, studies by Liu et al. [33] and Shiu et al. [34] also suggested that heavy precipitation increased by approximately 100% K−1, and small and moderate precipitation events decreased by approximately 20% K−1 based mainly on interannual differences in precipitation and long-term air temperature from 1979 to 2007. As a consequence, changes in extreme precipitation events may have greater variation in precipitation than changes in their mean values.
The Yangtze River Basin is an important agriculturally productive and densely populated area in China. Precipitation has an important impact on the economic development of this area. Since the 21st century, the impact of climate change has caused regional floods in the YRB many times, which have brought heavy losses to the local society and economy [35,36]. Correspondingly, the weakening of the East Asian summer monsoon has decreased the water vapor flux spreading northward, resulting in a different wet (dry) tendency in South (North) China [37]. In this context, heavy precipitation in the middle and lower YRB was observed to increase. Ali et al. [38] detected that maximum annual flows showed an increasing trend in regions of the Yangtze River, with the maximum annual flows becoming larger, increasing the risk of flooding in the YRB. Thus, exploring precipitation changes in the YRB is particularly crucial. There have been some studies on precipitation changes in the YRB [39,40,41,42]. For example, Sun et al. [43] pointed out that the extreme precipitation measured by most observation stations in the YRB increased; only some stations in high-altitude areas upstream decreased, while extreme precipitation in the eastern part of the YRB increased significantly. Qian et al. [16] also demonstrated that the effective precipitation in the middle and lower YRB was mainly due to the contribution of large and heavy precipitation events.
In summary, the current research on the YRB is concentrated on the characteristics of extreme precipitation and the prediction of future extreme precipitation based on global climate models [44,45] or changes in annual, seasonal, or monthly mean precipitation [36,40,42,46], with relatively few studies on the different grades of the precipitation structure. Additionally, more research has focused on some regions of the YRB [47,48]. There are few studies on the overall regional characteristics of precipitation in the YRB. Moreover, the connection between precipitation and the warming trend remains unclear [4], and the responses of precipitation to the variation in long-term air temperature have seldom been investigated. The understanding of the contribution rate of different grades of precipitation to the total precipitation is not sufficient. Unlike previous studies, this study is not limited to the study of light rain or extreme precipitation in a certain region of the YRB but is focused on the regional change characteristics of different grades of precipitation over the YRB and its subregions and further analysis of the response of precipitation to temperature in order to provide a theoretical reference for agricultural production, flood control, drought relief, and disaster reduction in this basin.
The main objectives of this study were as follows: (1) to study the changing trends of different grades of precipitation amounts and frequencies in six subregions of the YRB using the Mann–Kendall (MK) test and the linear trend analysis method; (2) to explore the trends of the contribution rate of different grades of precipitation to regional total precipitation; and (3) to analyze the sensitivities of graded precipitation to the long-term air temperature trend using Pearson’s correlation analysis and linear regression.; The paper is organized as follows: the data and methods are described in Section 2; Section 3.1 presents the trends of different precipitation grades; the contributions of different grades of precipitation to the total are discussed in Section 3.2; Section 3.3 analyzes the responses of graded precipitation to long-term air temperature in the YRB. Finally, Section 4 and Section 5 present the discussion and conclusion, respectively of this paper.

2. Materials and Methods
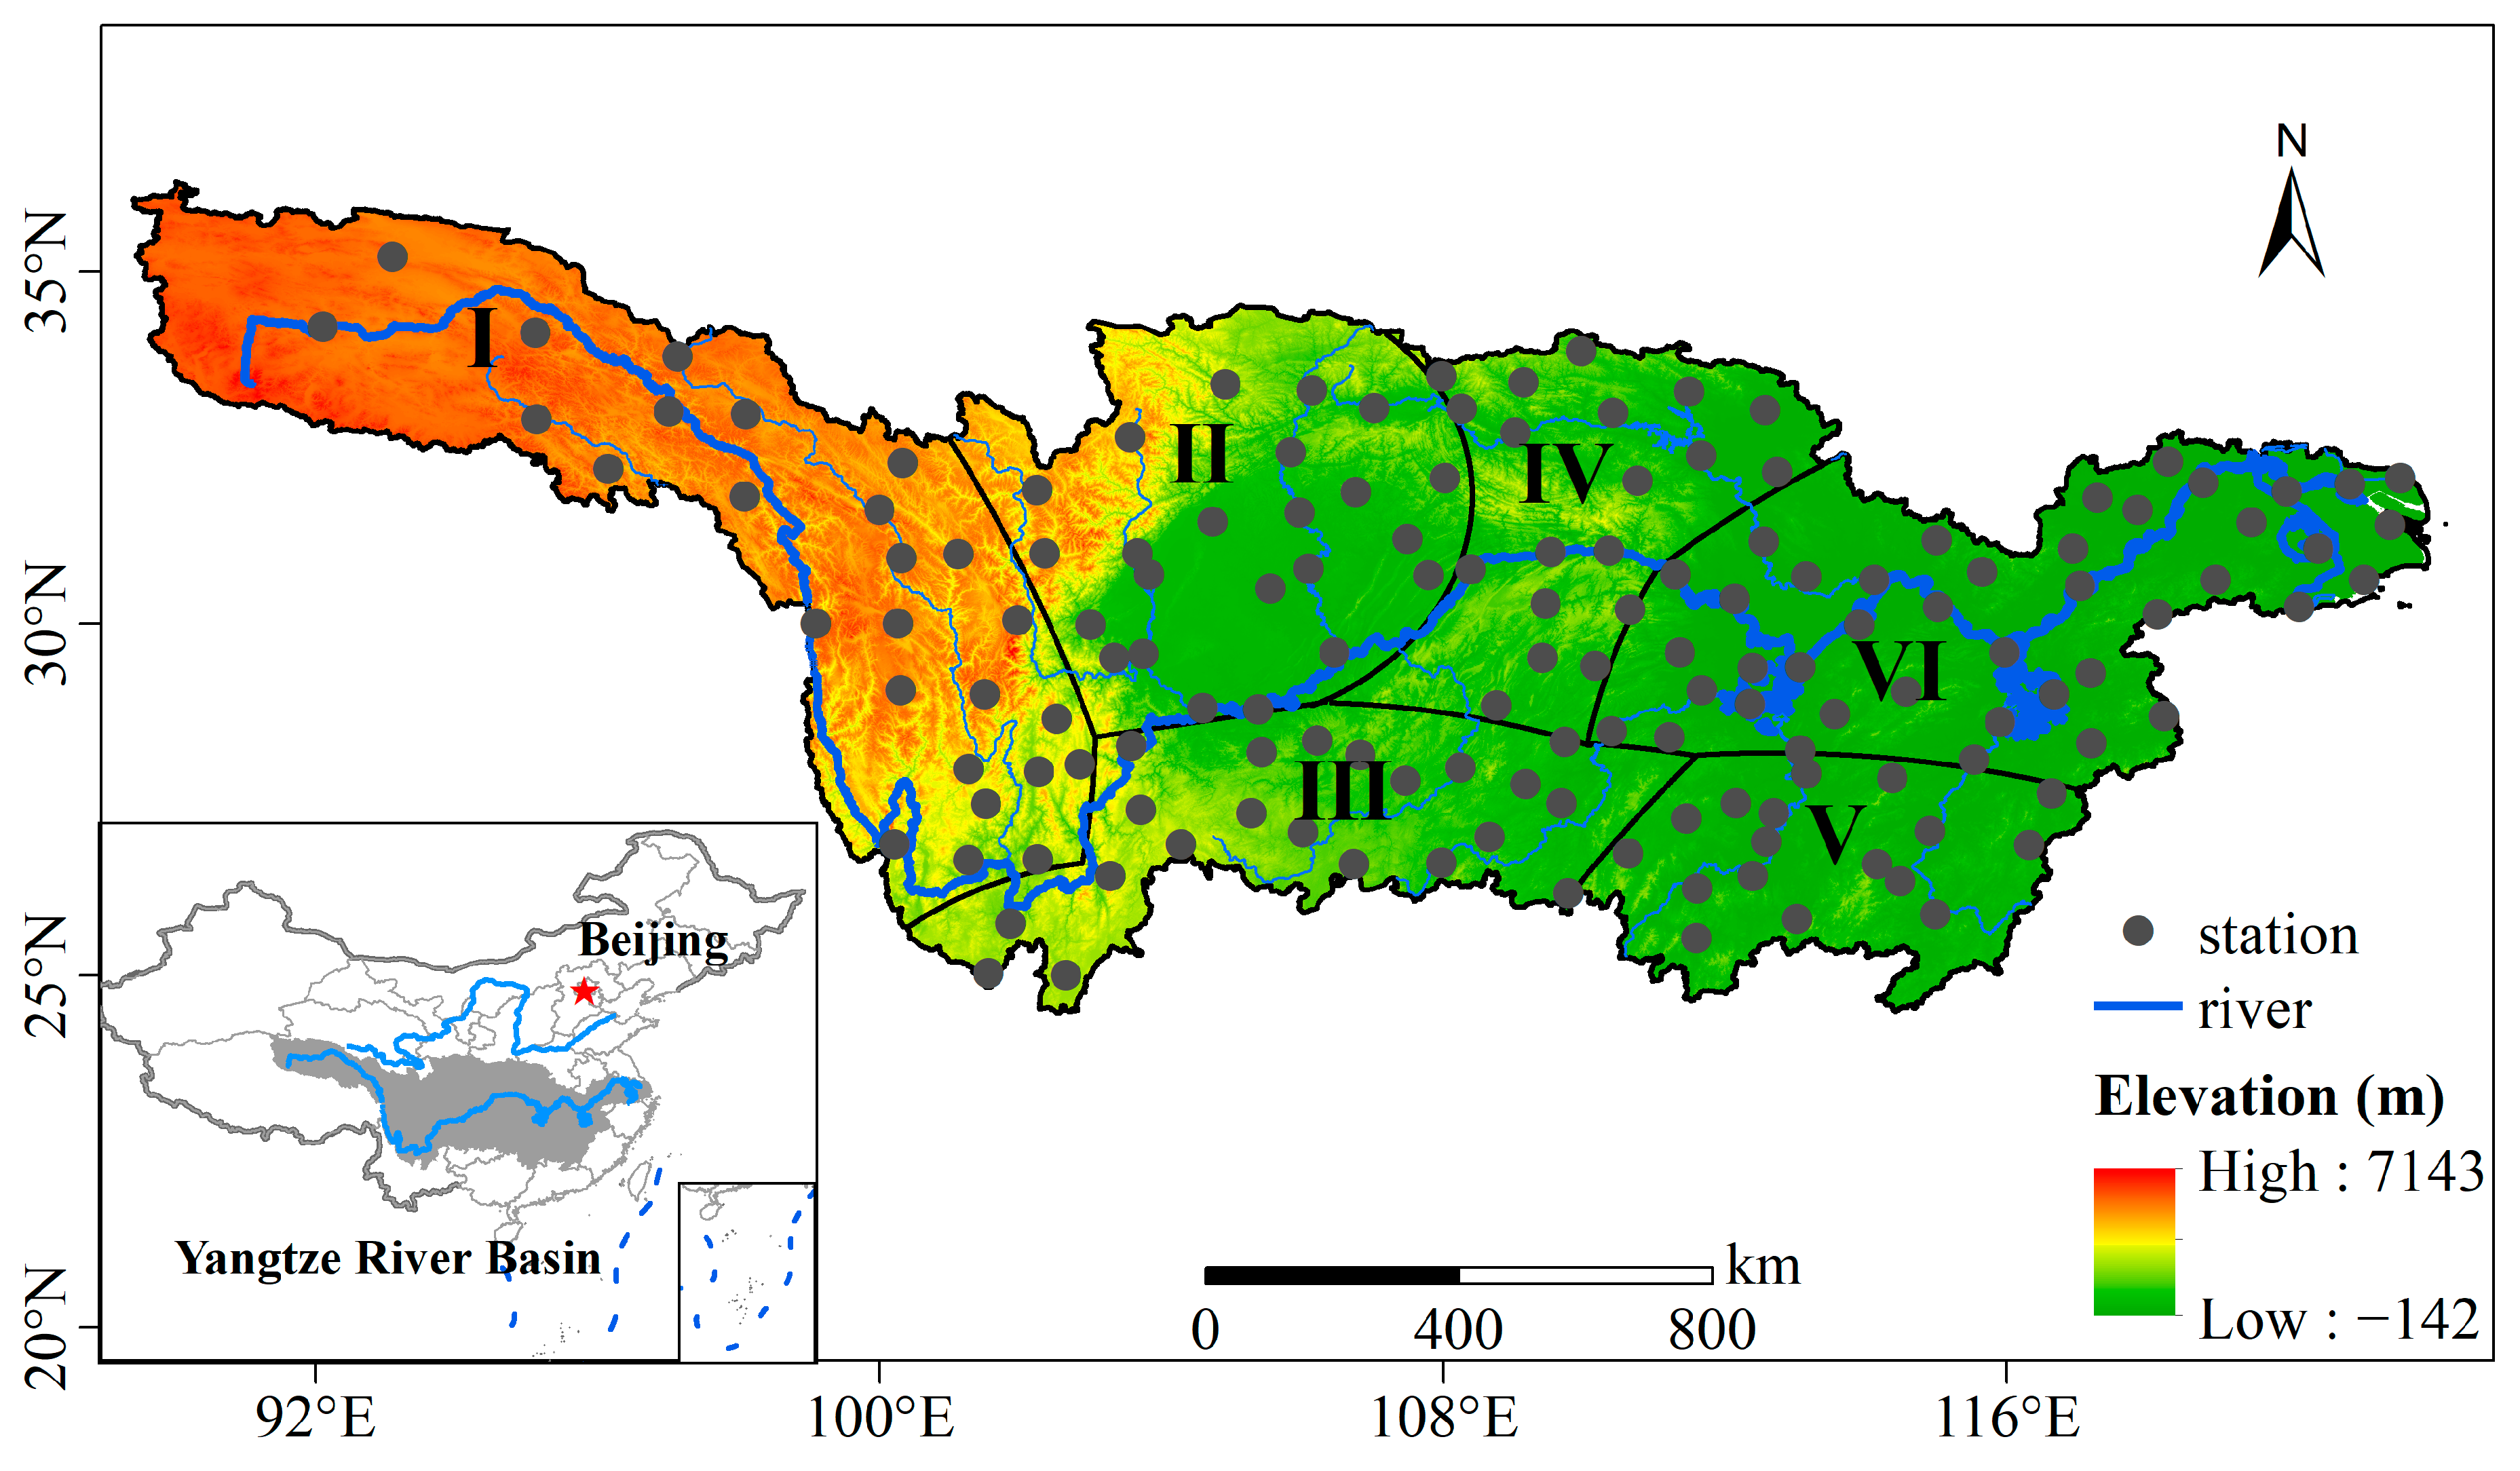
2.1. Study Area

The Yangtze River lies between 90°33′–122°25′ E and 24°30′–35°45′ N. It originates in the Himalayas on the Qinghai-Tibet Plateau and flows eastward into the East China Sea. The YRB has a vast territory, diverse landform types, and high west and low east elevations, which form tertiary terraces, and most of the region has a typical subtropical monsoon climate. Besides, the middle and lower YRB is located in a climate transition zone between the subtropical zone and warm temperate zone, so the climatic conditions are complex and changeable. The spatial and temporal distributions of precipitation vary greatly in the basin; the area west of the YRB receives 270–500 mm, while the southeast receives 1600–1900 mm [40,44]. Additionally, the YRB spans the three major economic regions of eastern, central, and western China. Nearly 440 million people live in the basin, which accounts for approximately 33% of the total population of China [49].
For a better understanding, the regional characteristics of precipitation change, six subregions (I–VI) were divided into the entire YRB according to the Rotated Empirical Orthogonal Function analyzed by Su et al. [39]. The six subregions include the eastern Tibetan Plateau (I), Sichuan Basin (II), and the south-central (III), mid-eastern (IV), southeastern (V) the northeastern (VI) regions in the YRB (Figure 1). In winter, the YRB is dominated by the Northwestern Siberian monsoon, in summer, V and VI regions in the middle and lower reaches are mainly controlled by the East Asian monsoon, while I, II, III, and IV regions in the upper reaches are mainly controlled by the Southwest monsoon [50,51].

2.2. Data

The daily precipitation and 2 m air temperature datasets used were obtained from the China Meteorological Administration (CMA). These precipitation and temperature datasets were processed following strict quality control procedures that could fully ensure completeness and accuracy [19]. Stations with five or more data missing consecutively for precipitation and temperature within a year were eliminated. The missing data were replaced with a long-term daily average of the same day, which was calculated using information derived from different years [40,41]. There were 19 stations for precipitation data interpolation and 25 stations for temperature data, and the proportion of interpolated daily data to the total data was less than 0.63% and 0.66%, respectively. Therefore, the missing data had a low impact on our results. The distribution of the selected 148 stations is presented in Figure 1. The stations were fairly evenly distributed across the YRB, with a slightly lower concentration on the eastern Tibetan Plateau.
According to the CMA standards [30], precipitation events were categorized into four grades of intensity: small (0.1 ≤ P < 10 mm/d); moderate (10 ≤ P < 25 mm/d); large (25 ≤ P < 50 mm/d); and heavy (P ≥ 50 mm/d). These classification criteria have been used for many global precipitation analyses [52,53]. Specifically, total daily precipitation of 0.1 mm is regarded as a precipitation event [54]. The precipitation amount (frequency) of each category was the cumulative precipitation amount (frequency) of the precipitation events in that category. The spatial distributions for the YRB and different hydrological regions were drawn from the mean annual data for each station. The different grades of precipitation amount and frequency parameters considered in this paper are presented in the Abbreviations. Daily precipitation (temperature) values for the YRB and six subregions were calculated from the arithmetic average of daily precipitation (temperature) data for all of the stations in each region, and then did the analyses of change trends for different grades of precipitation.

2.3. Methods

2.3.1. Mann–Kendall Trend Detection Test

The Mann–Kendall (MK) test has been widely used to assess the significance of monotonic trends in hydrometeorological series [44,55] due to its insensitivity to outliers and normally distributed time-series data [56]. In this study, the MK test was used to detect whether the change trends in graded precipitation were statistically significant. The MK test statistic (Q) is shown as follows:
Q = i = 1 n 1 j = i + 1 n s i g n x j x i ,
s i g n s =   1   ( s > 0 )   0   s = 0 1   ( s < 0 ) ,
z =   s 1 n n 1 2 n + 5 / 18   ( Q > 0 )   0   Q = 0 ,   s 1 n n 1 2 n + 5 / 18   ( Q < 0 )
where Q is the definition statistic; xj and xi are a set of sequences; n is the number of samples. Z is a standardized statistic that is acquired from the test. The significance level for trends was set at 5% in this study (|Z|>1.96). However, the MK test has limitations; its significance is affected by the presence of autocorrelation [57,58].

2.3.2. The Linear Trend Analysis Method

Linear least-squares trend analysis was used to analyze the long-term trend magnitudes of different graded precipitation indices. The linear function of time is presented as follows:
Y = ax + b,
where a is the regression coefficient that denotes the linear trend and b is a constant. Considering the large regional variation in precipitation, there is no comparability of precipitation trend values (mm/a; d/a) across different regions. Therefore, the trend was expressed as the percentage change in precipitation per 10 years (%/10a). The regression coefficient was also used to quantify the sensitivity of precipitation to long-term air temperature. The robustness of the linear least square method is relatively poor, that is, when individual data points change greatly, the regression coefficient (a) may change with time.

2.3.3. Contribution Rates

To quantitatively analyze the differences in the contribution of different grades of precipitation to the total precipitation, we calculated the ratio of the different grades of precipitation amounts (frequencies) to total precipitation amounts (frequencies). The contribution rate of each grade of precipitation amount (Cia, %) and frequency (Cid, %) can be determined using Equations (5) and (6), respectively, as follows:
Cia = I a/TA × 100%,
Cid = id/TD × 100%,
where i (i = S; M; L; H) indicates different grades of precipitation; TA indicates total precipitation amounts; TD indicates total precipitation frequencies over the YRB.

2.3.4. Pearson Correlation Analysis

Pearson correlation analysis was used to detect the relationship between precipitation and the long-term trend of temperature in this study. The formula is given by:
  R 2 = i = 1 n x i x ¯ y i y ¯ 2 i = 1 n ( x i x ¯ ) 2 i = 1 n ( y i y ¯ ) 2  
where n is the time in years, and xi and yi represent the actual values of the two related variables. The significance of the correlation was tested, and a 95% probability level of significance was used.

3. Results

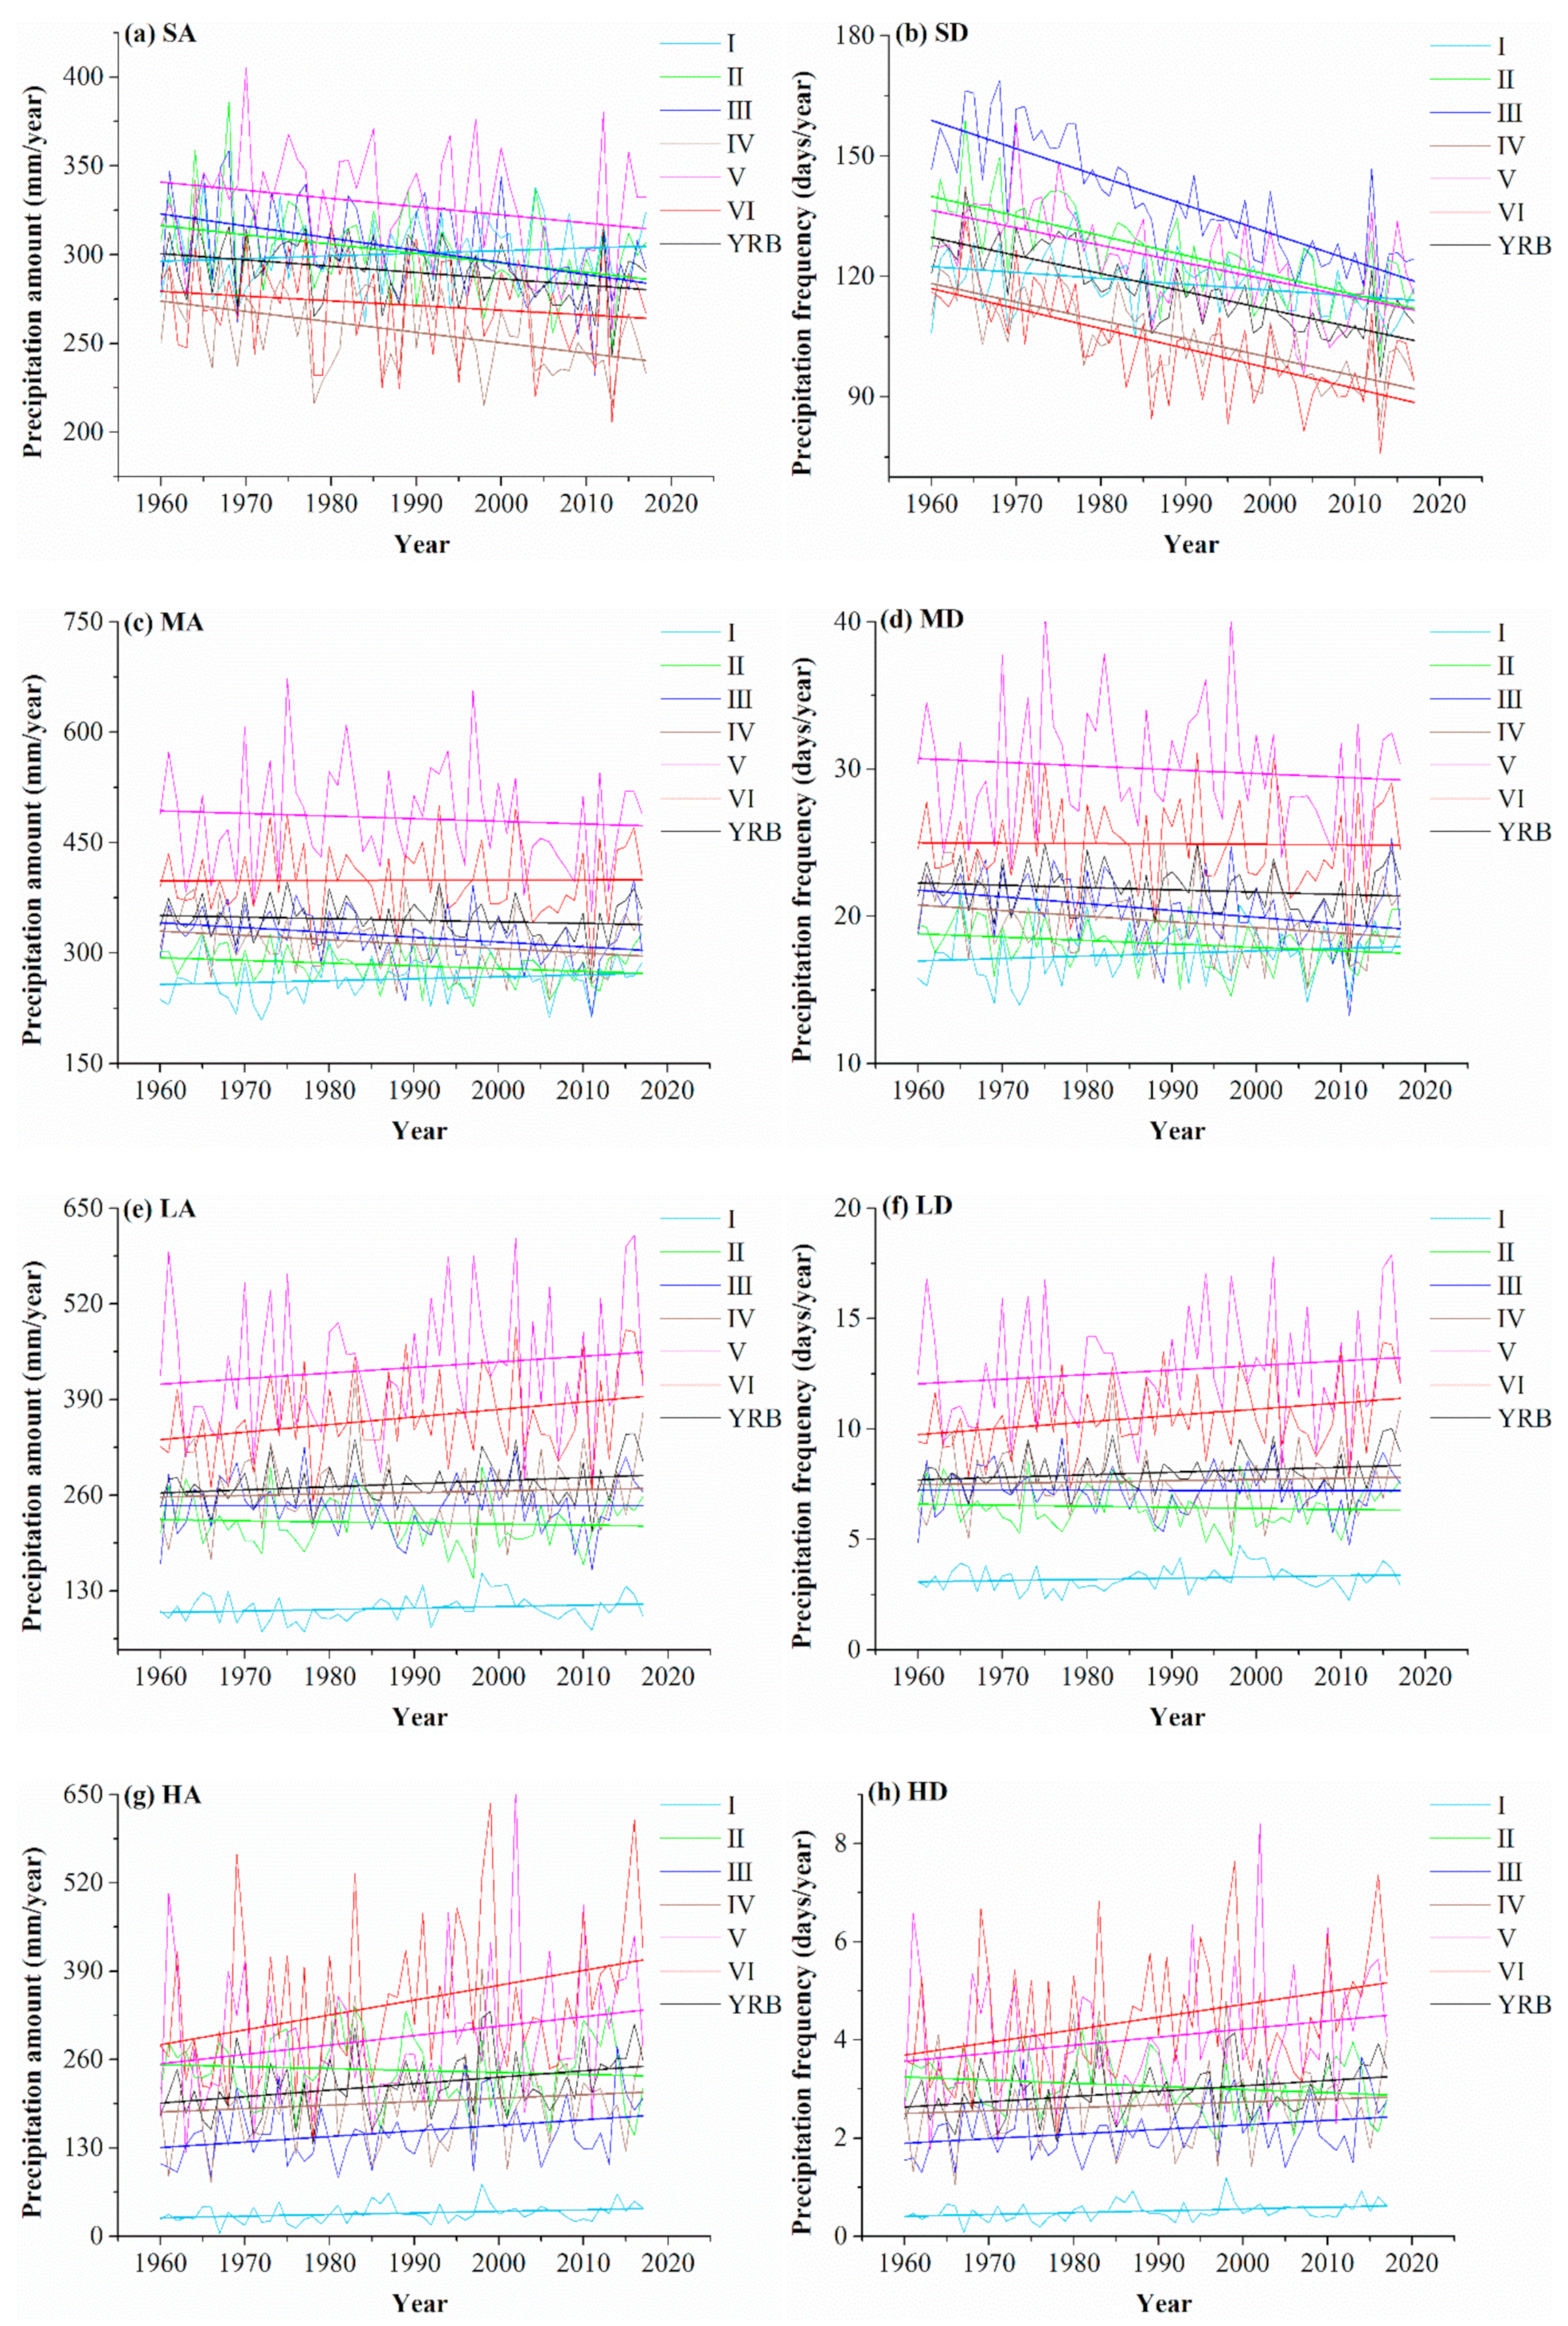
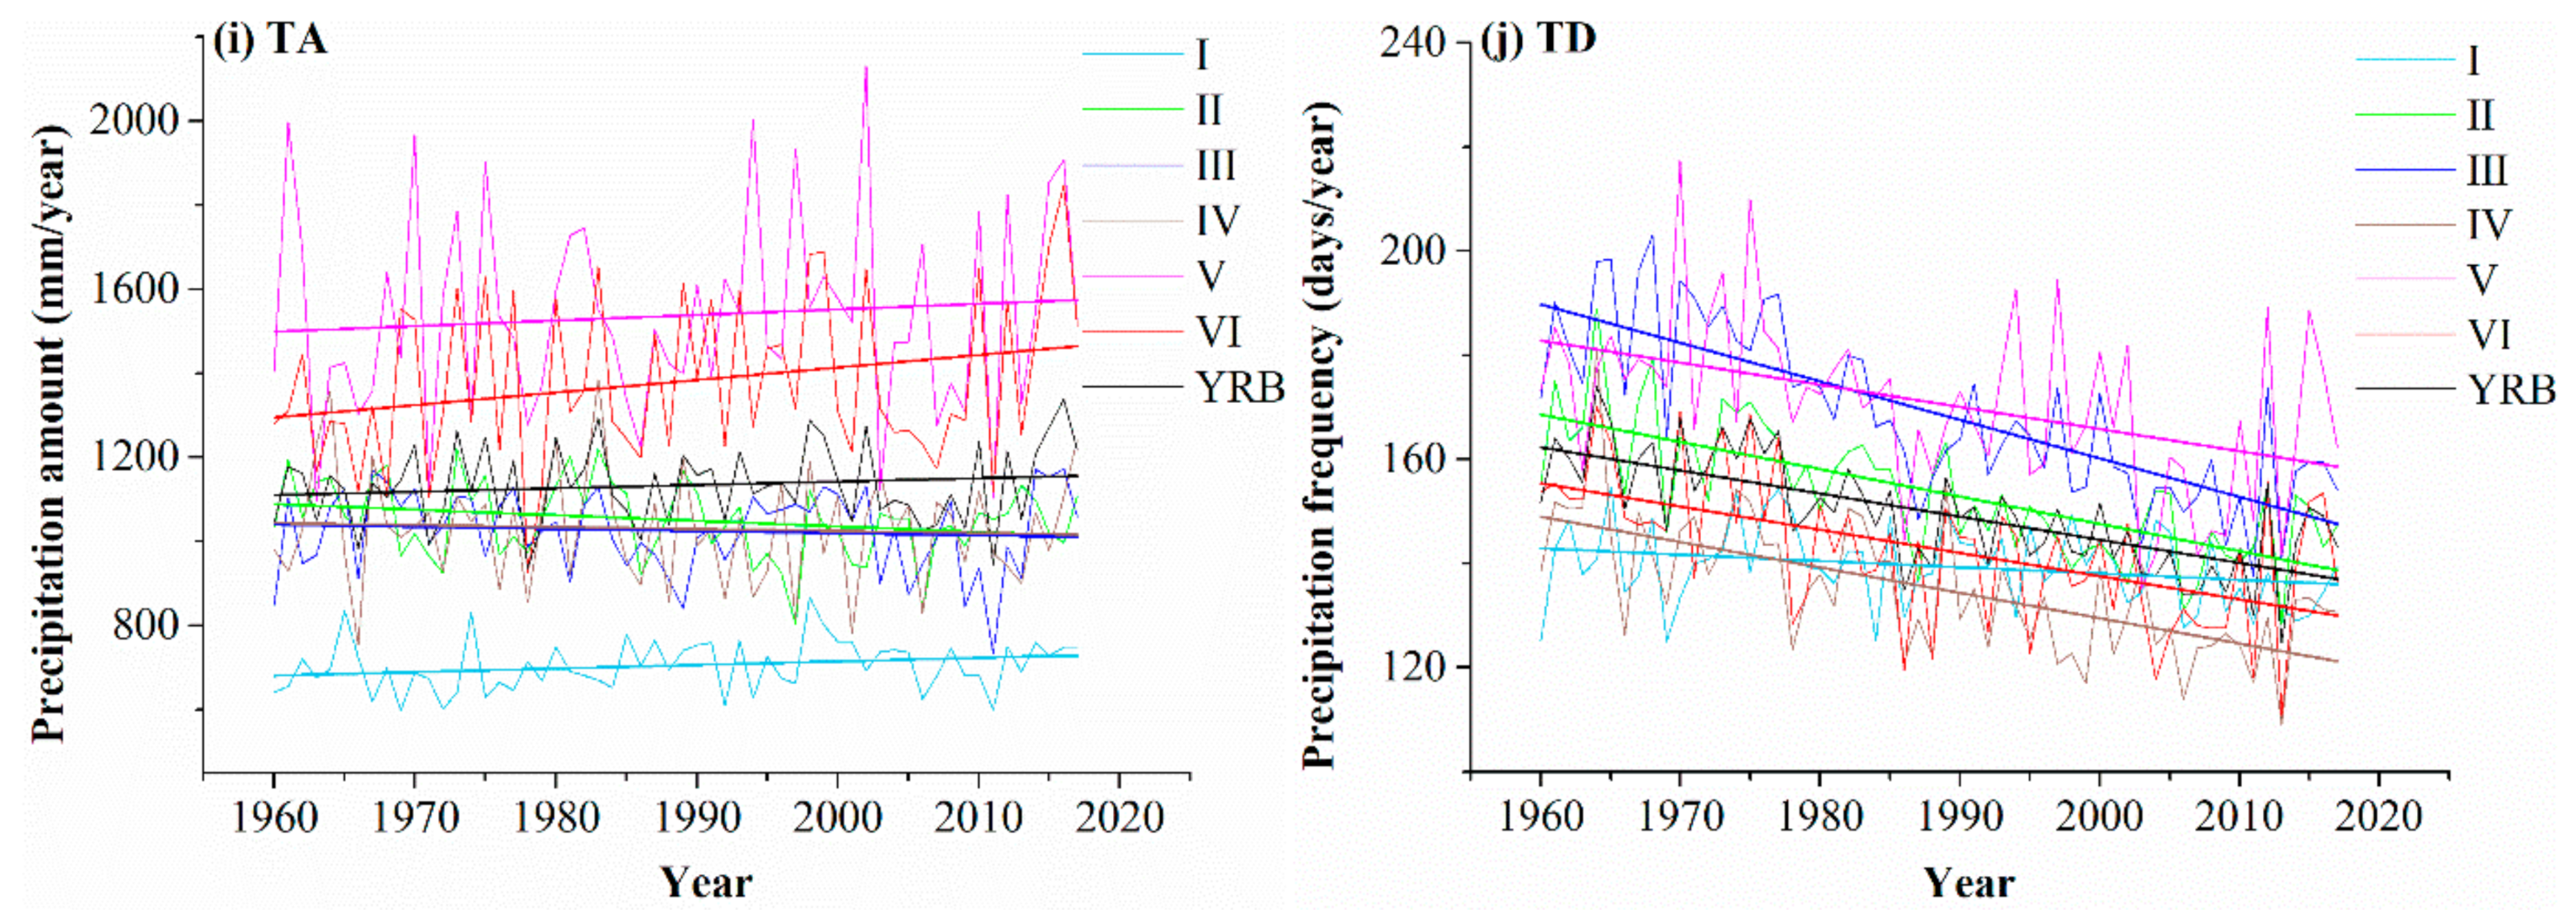
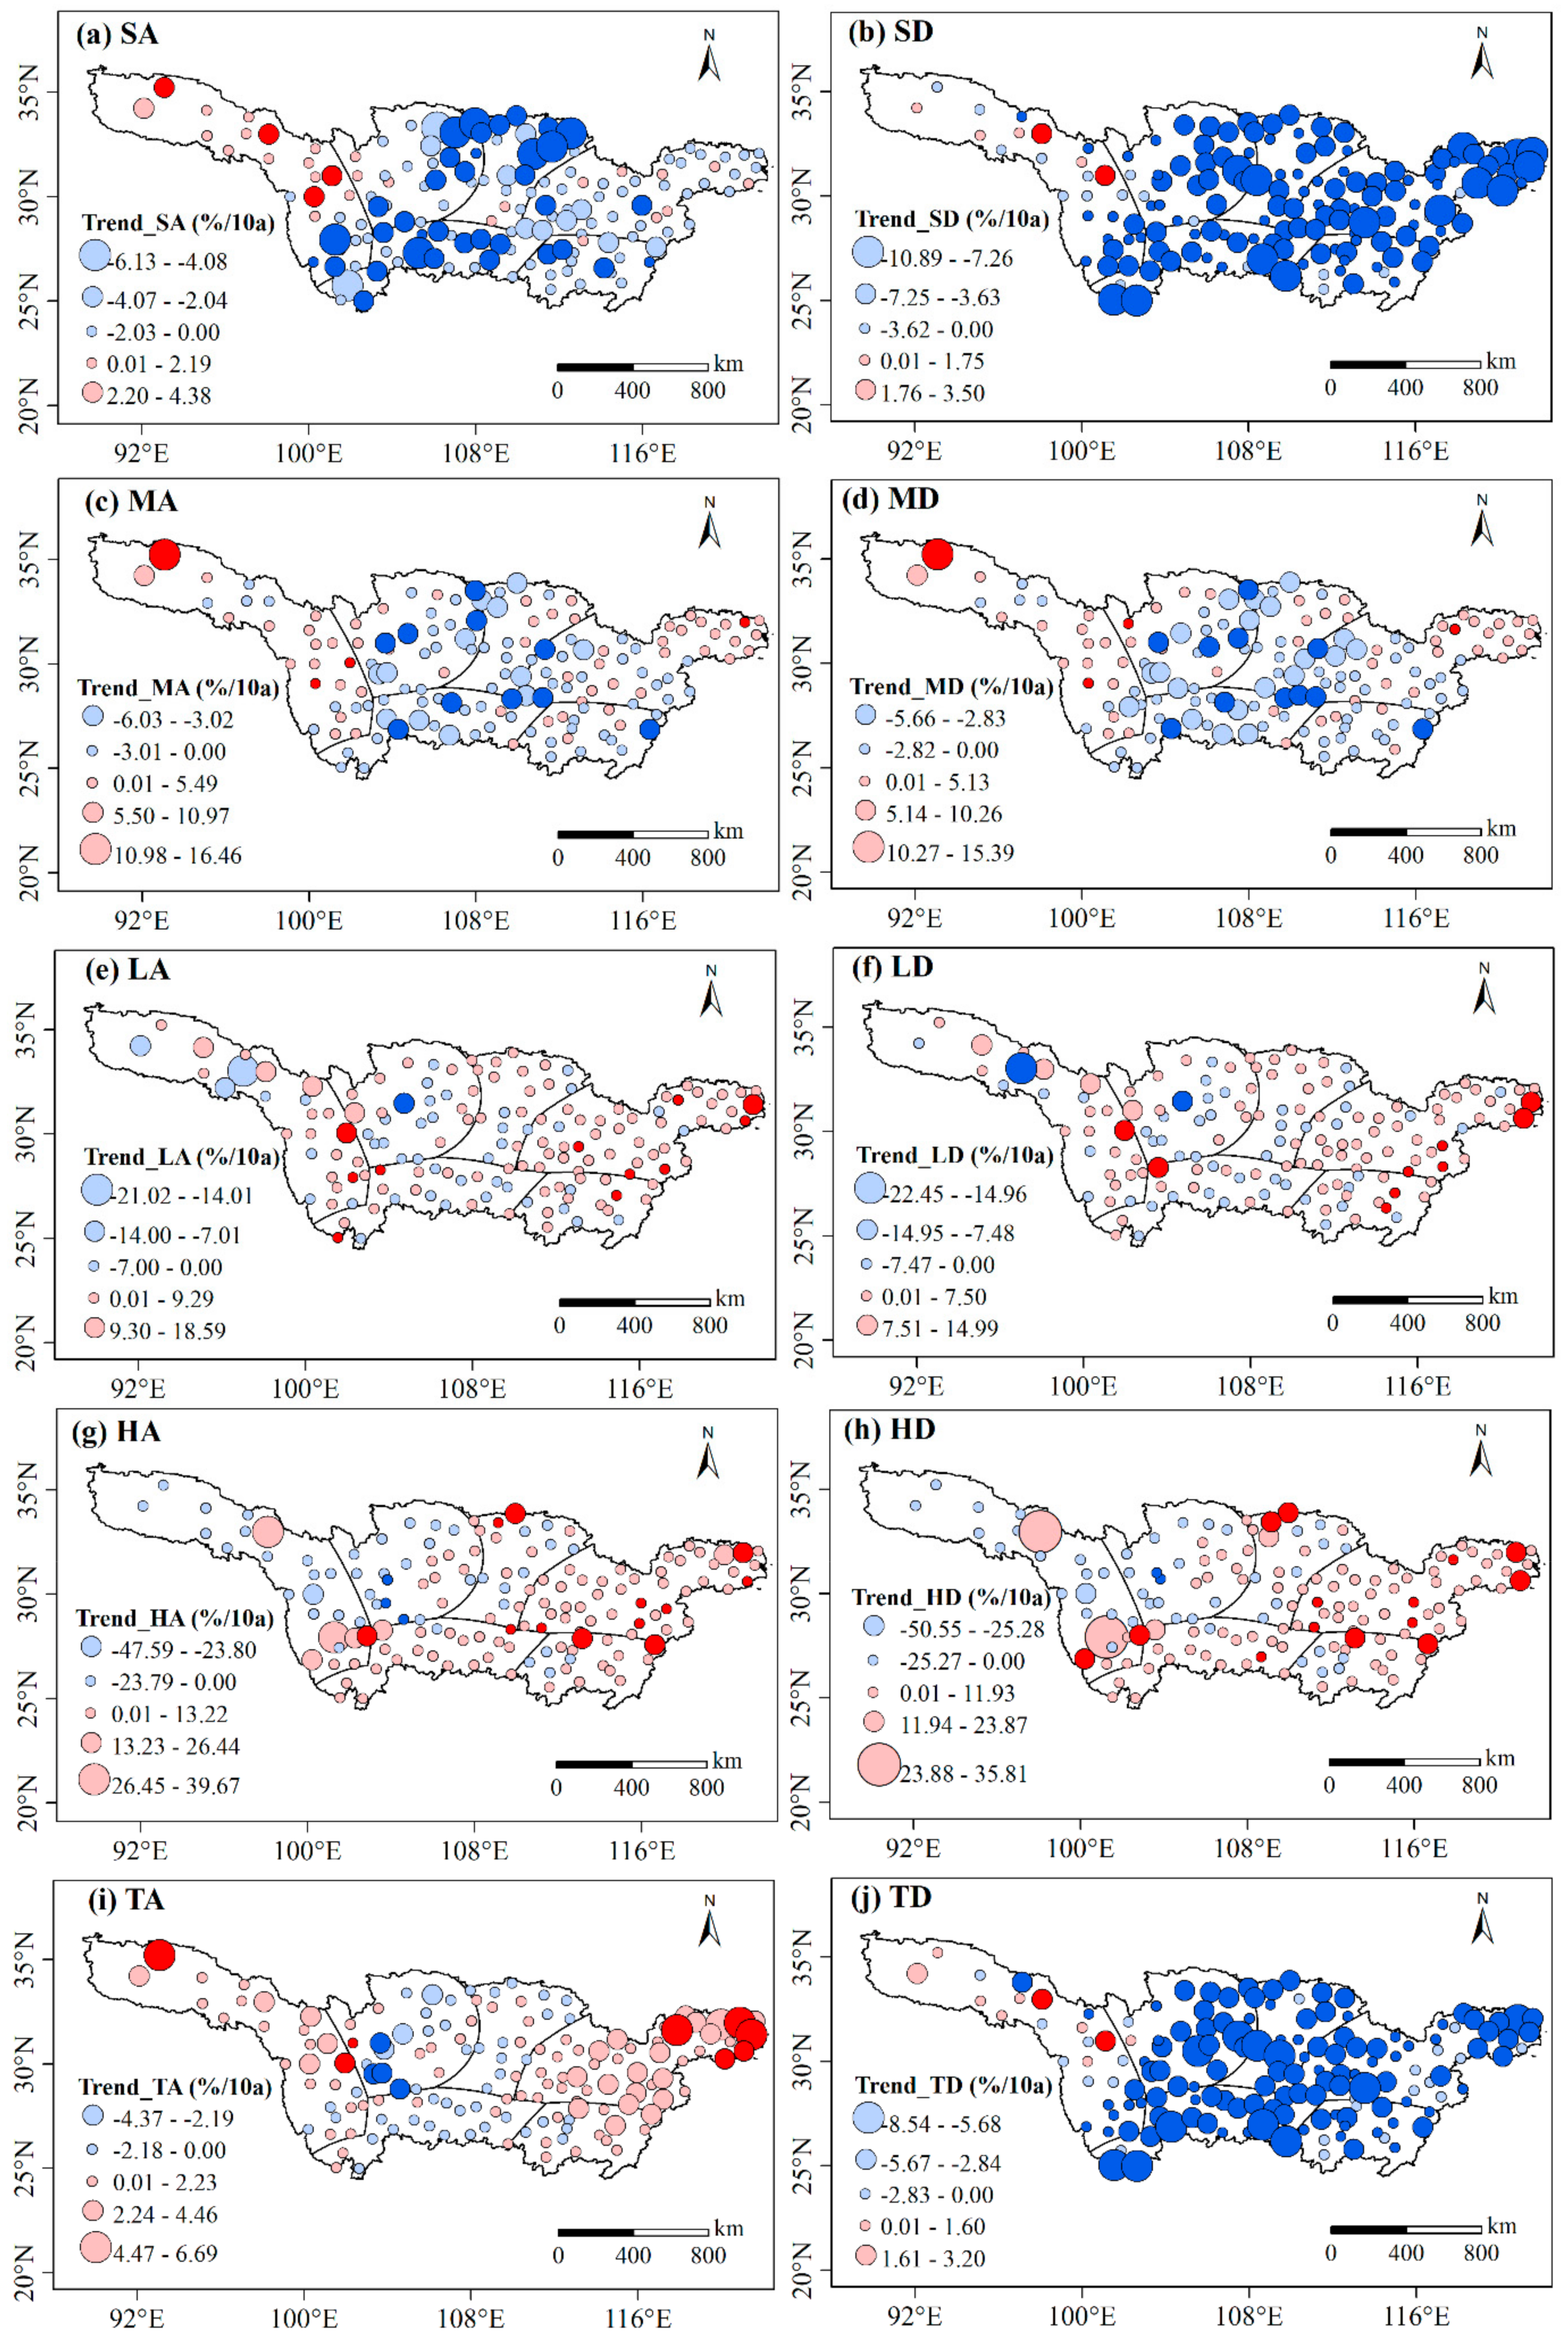
3.1. Trends in Different Grades of Precipitation

To better understand the various characteristics of precipitation in the YRB, we analyzed the long-term characteristics of different grades of precipitation. The time series of precipitation amounts and frequencies in the YRB and six subregions from 1960–2017 are presented in Figure 2 and Table 1. Over the YRB as a whole, there was a slight increasing trend in the total amount of precipitation (TA), with an increased rate of 0.71%/10a. The heavy precipitation amount (HA) increased significantly and linearly at a rate of 4.27%/10a, while the small precipitation amount (SA) showed a significant decreasing trend at a rate of −1.22%/10a. The number of days with small precipitation events (SD) and the total number of days with precipitation (TD) in the YRB showed significant decreasing trends, with rates of −3.86%/10a and −2.97%/10a, respectively. Among the six subregions, the grades of all precipitation amounts exhibited an upward trend in region I (Figure 2; Table 1). However, region II showed diametrically opposite results, with all grades of precipitation amounts and frequencies in this region showing a downward trend. It is worth noting that the only decreasing trend of HA was observed in region II at a rate of −1.16%/10a, while HA showed a sharp increase in all other regions. In region III and region IV, TA also showed a downward trend, similar to region II, but the large precipitation event amount (LA) and HA in these regions showed opposite increasing characteristics. Furthermore, LA and HA increased more obviously in region V and region VI, which were located in the lower reach of the YRB. SD and TD showed a clear downward trend in the entire region and in the subregions. In contrast, there were differences in HD changes in each region. HD increased significantly in region I and region VI, with rates of 7.36%/10a and 5.84%/10a, respectively. HD showed a decreasing trend only in region II (−2.10%/10a).
Figure 3 shows the spatial variations in the graded precipitation amounts and frequencies in the YRB from 1960 to 2017. For TA, 97 stations over the YRB showed an upward trend, with an obvious changing pattern. TA was represented by an increasing–decreasing–increasing trend from upstream to downstream of the Yangtze River (Figure 3i; Table 1). However, TD had a noticeable descending tendency. Approximately 93% (115 stations) of all stations showed a descending tendency, and 83% of those stations passed the significance test (Figure 3j). This indicated that precipitation frequency drops were prominent in the YRB from 1960 to 2017, while precipitation amounts showed more complex characteristics. In terms of different grades of precipitation, a descending tendency dominated SA and SD over the YRB, with most stations meeting the 95% confidence interval. Moderate precipitation amounts (MA) and the number of days with moderate precipitation events (MD) decreased significantly in the middle and lower YRB (Figure 3c,d); large and heavy precipitation events mainly increased, and significant increasing trends were concentrated in the middle and lower YRB (Figure 3e–h). As expected, there were obvious regional differences in the precipitation trends among different grades.

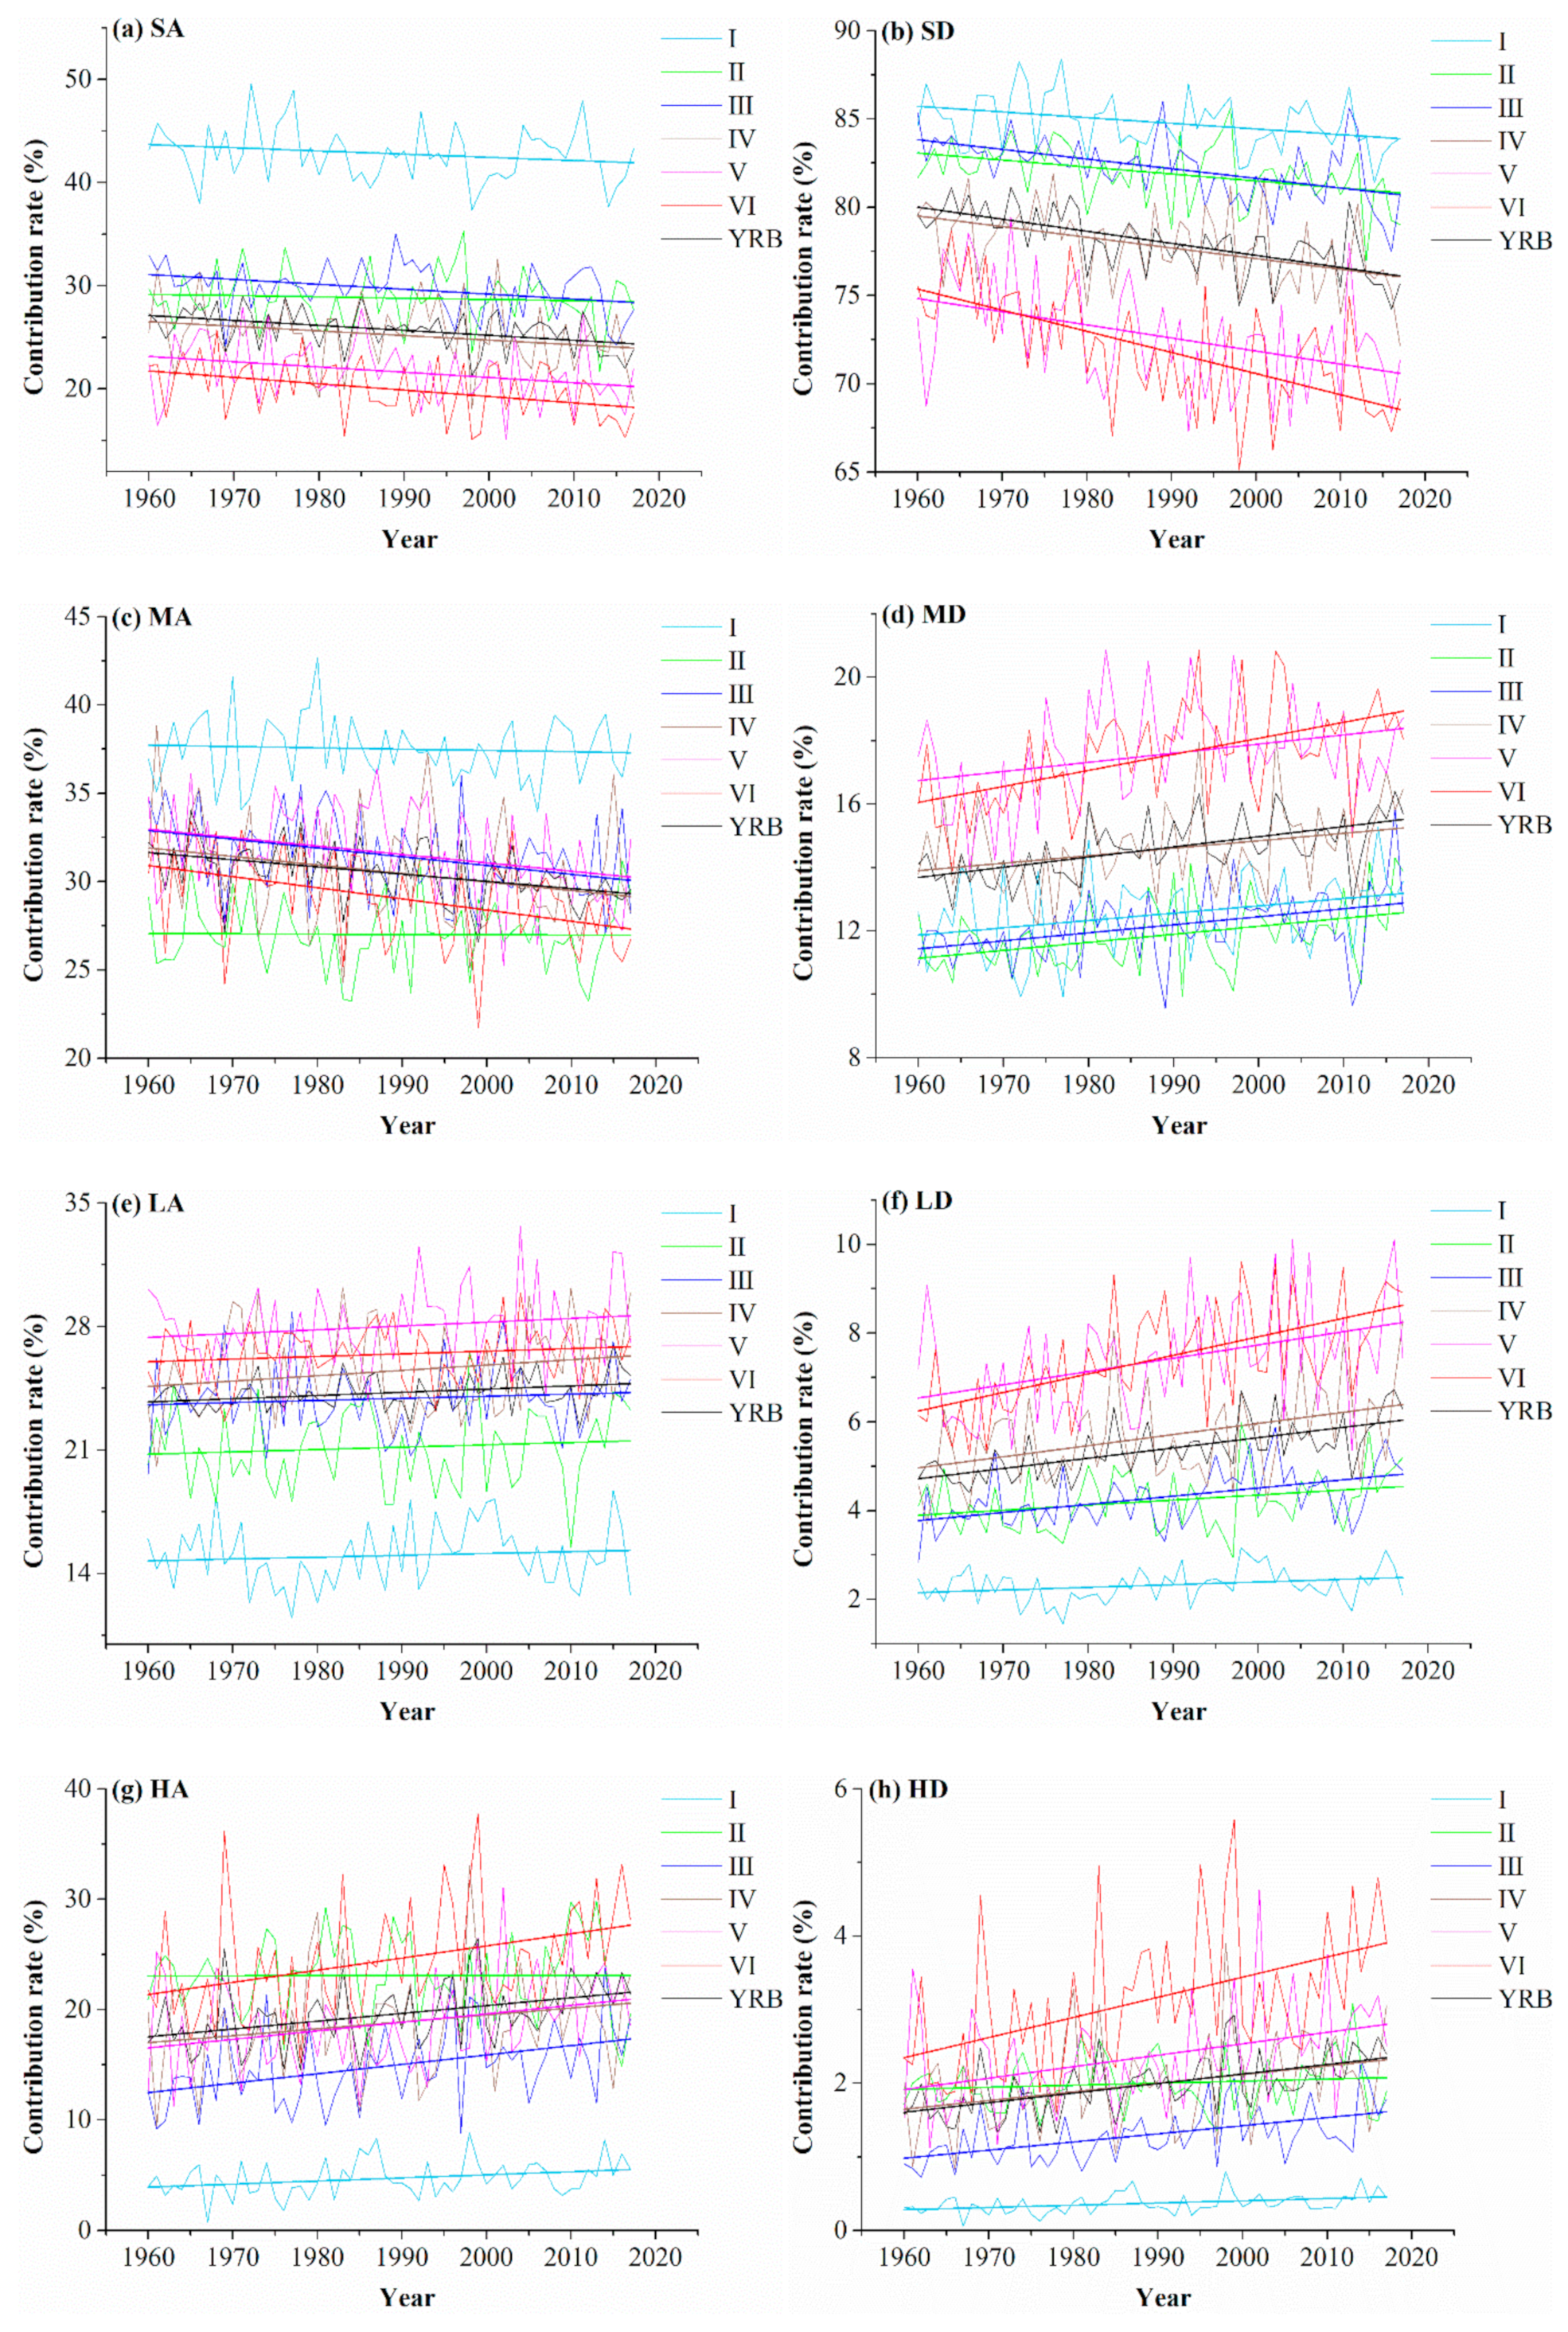
3.2. Trends in Graded Precipitation Contribution Rate

The percentage contributions of different categories of precipitation amounts (frequencies) to the total precipitation amounts (frequencies) over all six subregions are shown in Table 2. For the YRB as a whole, SA and MA dominated the total annual precipitation, accounting for 25.74% and 30.48%, respectively, of the total precipitation amount. In contrast, HA contributed minimally in the YRB (by 19.54%). Geographically, regions I and II were dominated by SA, which accounted for more than 25% of the overall precipitation amount, while regions III and IV were dominated by MA, with contribution rates of 31.47% and 30.52%, respectively. Regions V and VI, located in the lower YRB, were both dominated by MA and LA; compared with upstream and midstream, the proportion of HA was higher, while the contribution of SA was relatively low. With respect to the precipitation frequency, SD (78.05%) had the most significant contribution, followed by MD (14.60%), and the number of days with heavy precipitation events (HD) (1.97%) had the smallest contribution across the whole YRB. The precipitation frequencies in other regions showed the same characteristics. Taken together, the contribution rates of SA and SD to the total precipitation gradually decreased from upstream to downstream of the YRB, while HA and HD gradually increased.
Figure 4 and Table 3 show the contribution rate trends for different grades of precipitation amounts (frequencies) to the total precipitation amount (frequency) in the YRB from 1960–2017. For the whole YRB, the contribution rates of SA and MA showed a significant decreasing trend, with rates of −0.48%/10a and −0.41%/10a, respectively, while HA increased significantly, with a rate of 0.71%/10a, and the contribution rate of SD decreased significantly at a rate of −0.68%/10a. In terms of the six subregions of the YRB, the contribution rates of SA and MA mainly showed a significant decreasing trend, especially in regions V and VI. Consistent with the characteristics of the decrease in the contribution rate of SA, the contribution rate of SD also showed a significant decreasing trend in each region, with larger declines in regions V and VI, of −0.74%/10a and −1.20%/10a, respectively. The contribution rates of HA and HD showed a significant increasing trend, except in region II. Specifically, the contribution rates of HA and HD increased significantly in the middle and lower YRB and reached a maximum in region VI, with increasing trends of 1.10%/10a and 0.27%/10a, respectively. The contribution rate of LD showed a significant increasing trend, except in region II, and the contribution rate of LA did not change significantly across the six subregions. The change trends in the contribution rates of small and moderate precipitation amounts and frequencies were smaller, while those of the heavy precipitation amounts and frequencies were relatively large.

3.3. Sensitivities of Graded Precipitation to the Long-Term Trend of Air Temperature

To further analyze the responses of precipitation to air temperature in the YRB, the regression coefficients of different grades of precipitation and air temperature were calculated. Table 4 shows the sensitivity of different graded precipitation amounts and frequencies to the long-term warming trend of the air temperature. Over the YRB as a whole, a warming trend boosted precipitation amounts, especially for HA and LA (13.35%/K and 5.09%/K, respectively). In contrast, SA showed a significant negative sensitivity (−6.14%/K) to the long-term air temperature trend. With respect to the number of precipitation days, SD and TD showed significant negative sensitivities to the warming trend (−11.63%/K and −9.03%/K, respectively), while HD showed significant positive responses to air temperature (11.01%/K). Overall, small and heavy precipitation events were more sensitive to the long-term trend of air temperature.
From a regional perspective, SA and MA in all six subregions over the YRB were mainly negatively correlated with air temperature, while HA was only negatively correlated with air temperature in region II (−7.63%/K). The HA in regions I and V was more sensitive to air temperature (17.67%/K and 12.91%/K, respectively), which means that HA in the upper and lower reaches was greatly affected by temperature changes. Clearly, SD and TD over all subregions were significantly negatively correlated with Ta, particularly in the middle and lower YRB reaches (regions II, III, IV, and V). Furthermore, the only negative correlation between HD and the air temperature was observed in the Sichuan Basin, including region II, with a decrease of −9.14%/K (Table 4).

4. Discussion

4.1. Changing Trends of Different Grades of Precipitation

In this study, we found that both SD and TD over the YRB showed a significant downward trend from 1960 to 2017. Some studies have found similar results, showing that the decrease in precipitation frequencies in the East China monsoon region was mainly due to the decrease in SD [16,20]. Thus, it can be deduced that the decrease in the TD trend is mainly attributable to the decreasing SD trend. Moreover, the most significant downward trend of SD was detected in the middle and lower YRB. Previous studies have indicated that the decrease in the number of small precipitation frequencies in eastern China was strongly connected with the increase in anthropogenic aerosol emissions [59,60]. Currently, the emissions of aerosols and other pollutants caused by anthropogenic activities have increased significantly in the middle and lower YRB. Aerosols inhibit the upward movement of the atmosphere and cause small precipitation reductions [19,59]. Precipitation amounts were closely related to the precipitation frequencies. With decreases in SD, SA also decreased. If TD and SD continue to decrease, and no rain days increase, there may be an increased risk of short-term drought disasters in regions II, III, and IV.
The heavy precipitation amounts and frequencies in the YRB showed a significant increasing tendency, which was basically consistent with the previous findings of other researchers in the YRB [42,61]. These changes in precipitation in the YRB may be associated with the variation of the East Asian summer monsoon system [41,62,63,64]. The weakening of the East Asian monsoon leads to an increase in heavy precipitation in the middle and lower YRB [37]. However, we further observed an interesting feature: HA showed a downward trend only in region II. This feature was likely related to the topography of region II. The basin is completely surrounded by mountains and plateaus, and the weakening East Asian monsoon has reduced water vapor transmission to the basin [63], thus causing the heavy rain in region II to decrease. As a result, the local risk of natural disasters such as landslides and mudslides caused by heavy precipitation may be reduced in region II.

4.2. Trends in the Contribution Rate of Different Grades of Precipitation to the Total Precipitation

Analyzing the contribution rate trends of different grades of precipitation events can help us understand the impact of global warming on the global water cycle. With respect to the contribution rate of graded precipitation to total precipitation over the YRB, SA and MA constituted the largest contributions to TA. From upstream to downstream, the contribution rates of SA and MA gradually decreased, while the contribution rates of LA and HA gradually increased, which is in accordance with previous studies [16,43]. With respect to the precipitation frequency, SD made a major contribution to TD over the whole YRB despite its low intensity. The multi-year changes in the number of precipitation days were mainly caused by the decrease in the number of days of small precipitation events. Similar conclusions were obtained in other studies [20,65]. A study conducted by Liu et al. [20] showed that light rain exhibited a downward trend in China from 1960 to 2000, and the decrease in the frequency of light rain accounted for 66% of the decrease in the total precipitation frequency. Qian et al. [65] also reported that the decrease in the frequency of light rain is the main reason for the decrease in the total rain frequency in China.
The contribution rates of HA and HD increased most in the middle and lower YRB from 1960–2017, and the contribution rate of HA varied more than that of the other grades in the YRB. Relevant studies also detected that changes in extreme precipitation tended to be larger than changes in average precipitation under a warmer climate [61,66,67]. Qian et al. [16] stated that the effective precipitation in the middle and lower YRB was mostly contributed by heavy precipitation, and the contribution rate of heavy precipitation increased. Studies in Canada, Norway, the United States, Mexico, Iran, and other countries have also demonstrated that the contribution of heavy precipitation to the total precipitation is increasing [22,68]. In summary, if this precipitation trend continues, regions V and VI may face serious heavy precipitation events, which have greater social, economic, and environmental impacts than other precipitation events. Appropriate actions should be taken in these regions to deal with the threat of more frequent extreme precipitation.

4.3. Relationship between Graded Precipitation and Air Temperature

Rising temperatures will lead to an increased moisture content in the atmosphere, thereby affecting precipitation [29]. Our research indicates that small, moderate, and total precipitation amounts and frequencies were mainly negatively correlated with the long-term trend of air temperature, which is consistent with previous studies [30,32]. The YRB has experienced climate warming in the past 50 years [69], and air temperature has increased significantly [70]. In this context, air temperature increases will increase the water-holding capacity of the atmosphere, making it harder than usual for warmer air to reach dew-point temperatures, resulting in fewer days of small rainfall events [71]. Compared with heavy rainfall, small rainfall events should be more sensitive to subtle changes in saturated water vapor pressure, making warming a potential factor in the reduction of small rainfall events [71]. Ma et al. [4] analyzed the dependence of precipitation changes for each grade in China on the global average temperature, and the results showed that the frequency of small rainfall events exhibited large changes per unit of global warming, with a significant sensitivity of −22.38%/K. Therefore, temperature changes have a great impact on small precipitation events, and the relationship requires further examination and quantitative assessment.
We further found that large and heavy precipitation events were positively correlated with air temperature. Heavy precipitation mainly depends on the amount of water in the air. As the temperature increases, the saturated water vapor pressure in the air will rise significantly [29,72], and the intensity of precipitation will also increase [7]. Zhou et al. [30] reported that with long-term temperature increases, heavy precipitation amounts over China increased rapidly, with a significant sensitivity of 9.8%/K. However, one issue that deserves is why HA in region II was negatively correlated with temperature. Region II is densely populated, has a high output of anthropogenic emissions [73]. The wind speed was relatively low in region II due to the topography of the basin. These factors are not conducive to the elimination of pollutants. The long-term accumulation of pollutants results in a high aerosol content in the atmosphere [47]. In this case, the deep aerosol that is not easy to spread reduces the solar radiation reaching the ground and reduces the sunshine duration, as well as visibility, thus resulting in lower temperatures [52]. An increase in the concentration of aerosol particles used as cloud condensation nuclei will increase the concentration and decrease the droplet size. Droplets with smaller concentrations will not precipitate before reaching the supercooled level, which will accumulate more atmospheric water, release more latent heat, and promote stronger convective processes, thus forming more frequent heavy precipitation [74]. Therefore, the heavy rain and temperature region II shows a negative correlation that was inconsistent with the correlation observed in other regions.
Previous studies have indicated that the temperature in the Yangtze River Basin will continue to increase in the future [75,76]. In this context, SD and TD over the whole YRB will continue to decrease, and the risk of short-term droughts will increase. HA and HD in the YRB will continue to increase, especially in region I, which may lead to more flood disasters and soil erosion.

4.4. Limitations

This study revealed the spatial distribution and changing trends of different grades of precipitation over the YRB, which will be helpful to further deepen the understanding of changes in the regional precipitation structure. However, fixed thresholds are usually used for relatively homogenous regions. Due to the vast area of the YRB and the large precipitation differences between subregions, the method of defining precipitation grades in this study may be insufficient. It is possible that there are differences between the upper reaches with less precipitation and the lower reaches with more precipitation for the same precipitation level, which may lead to some errors in the regional precipitation characteristics. Thus, the use of percentiles as thresholds to define precipitation events to compare the research results is needed. At the same time, the main factors that affect the changes in the different grades of precipitation, such as the response mechanism of different grades of precipitation to changes in temperature and atmospheric circulation, are not sufficiently thorough in this study. These should be further strengthened in later studies, which can provide a reference for flood control and water resource utilization.

5. Conclusions

This study used the data of 148 meteorological stations in the YRB from 1960 to 2017 to study the characteristics of the changing trends of precipitation and their contributions to the total precipitation amounts and frequencies in the six subregions of the YRB. Furthermore, the sensitivities of precipitation to long-term air temperature were analyzed. The main results are as follows:
(1) From 1960 to 2017, SA and SD decreased significantly over the YRB, while HA and HD showed a significant increasing tendency, with rates of 4.27%/10a and 3.69%/10a, respectively. The TD in YRB has dropped significantly, which was caused by the sharp decrease in SD.
(2) The contribution rate trends of HA and HD to TA and TD, respectively, increased significantly from 1960–2017, especially in regions V and VI. The increasing proportion of heavy precipitation may have a serious impact on local flood control and water resource management.
(3) There were obvious regional differences in the precipitation of different grades in the YRB. The contribution rate of HA to the TA was higher in region VI than in other regions. On the contrary, all grades of precipitation in region II showed a decreasing trend due to its special topographical features, especially the reduction of HA, and local disasters such as landslides may be reduced.
(4) The sensitivities of precipitation to long-term air temperature exhibited obvious features. SA, SD, and TD were mainly negatively correlated with air temperature in all subregions over the YRB, while HA and HD were mainly positively correlated, except in region II. In the case of an increase in temperature in the future, as TD and SD decrease, the number of rainless days will increase, and the short-term drought risk will increase. Meanwhile, HA and HD will increase, especially in region I, which may face serious problems of flood risk, deteriorating water quality, and ecological environmental damage.

Author Contributions

Conceptualization, M.D. and M.H.; software, M.D., L.W.; investigation, M.D., M.H.; data curation, M.H., X.T. and L.W.; formal analysis, M.H. and M.D.; writing—original draft preparation, M.H. and M.D.; writing—review and editing, M.D, M.H.; funding acquisition, M.D, Y.J. and M.H. All authors have read and agreed to the published version of the manuscript.

Funding

This research was supported by the National Natural Science Foundation of China (Grant Nos. 41630750) and the National Science and Technology Major Project: Water Pollution Control and Management Technology of China (No. 2017ZX07301-001-03).

Institutional Review Board Statement

Not applicable.

Informed Consent Statement

Not applicable.

Data Availability Statement

The data presented in this study are available on request from the corresponding author.

Acknowledgments

We would like to thank the high-performance computing support from the Center for Geodata and Analysis, Faculty of Geographical Science, Beijing Normal University [https://gda.bnu.edu.cn/] (Accessed on 23 March 2021).

Conflicts of Interest

The authors declare no conflict of interest.

Abbreviations

IPCCIntergovernmental Panel on Climate Change
YRBYangtze River Basin
CMAChinese Meteorology Administration
MKMann–Kendall
SAThe amount of precipitation from small precipitation events in a year.mm/year
MA The amount of precipitation from moderate precipitation events in a year.mm/year
LAThe amount of precipitation from large precipitation events in a year. mm/year
HAThe amount of precipitation from heavy precipitation events in a year.mm/year
TAThe amount of total precipitation in a year.mm/year
SDThe number of days with small precipitation events in a year.days/year
MD The number of days with moderate precipitation in a year.days/year
LDThe number of days with large precipitation events in a year.days/year
HDThe number of days with heavy precipitation in a year.days/year
TDThe total number of days with precipitation in a year.days/year
10a10 yearsyear
*Significant at the 0.05 level.

References

  1. Birkinshaw, S.J.; Guerreiro, S.B.; Nicholson, A.; Liang, Q.; Quinn, P.; Zhang, L.; He, B.; Yin, J.; Fowler, H.J. Climate change impacts on Yangtze River discharge at the Three Gorges Dam. Hydrol. Earth Syst. Sci. 2017, 21, 1911–1927. [Google Scholar] [CrossRef] [Green Version]
  2. Chen, P.-C.; Wang, Y.-H.; You, G.J.-Y.; Wei, C.-C. Comparison of methods for non-stationary hydrologic frequency analysis: Case study using annual maximum daily precipitation in Taiwan. J. Hydrol. 2017, 545, 197–211. [Google Scholar] [CrossRef]
  3. Ali, R.; Kuriqi, A.; Abubaker, S.; Kisi, O. Hydrologic Alteration at the Upper and Middle Part of the Yangtze River, China: Towards Sustainable Water Resource Management Under Increasing Water Exploitation. Sustainability 2019, 11, 5176. [Google Scholar] [CrossRef] [Green Version]
  4. Ma, S.M.; Zhou, T.J.; Dai, A.G.; Han, Z.Y. Observed Changes in the Distributions of Daily Precipitation Frequency and Amount over China from 1960 to 2013. J. Clim. 2015, 28, 6960–6978. [Google Scholar] [CrossRef]
  5. Westra, S.; Alexander, L.V.; Zwiers, F.W. Global Increasing Trends in Annual Maximum Daily Precipitation. J. Clim. 2013, 26, 3904–3918. [Google Scholar] [CrossRef] [Green Version]
  6. Willems, P. Multidecadal oscillatory behaviour of rainfall extremes in Europe. Clim. Chang. 2013, 120, 931–944. [Google Scholar] [CrossRef] [Green Version]
  7. Donat, M.G.; Lowry, A.L.; Alexander, L.V.; O’Gorman, P.A.; Maher, N. More extreme precipitation in the world’s dry and wet regions. Nat. Clim. Chang. 2017, 7, 154–158. [Google Scholar] [CrossRef] [Green Version]
  8. Gregersen, I.B.; Sorup, H.J.D.; Madsen, H.; Rosbjerg, D.; Mikkelsen, P.S.; Arnbjerg-Nielsen, K. Assessing future climatic changes of rainfall extremes at small spatio-temporal scales. Clim. Chang. 2013, 118, 783–797. [Google Scholar] [CrossRef]
  9. Hennessy, K.J.; Gregory, J.M.; Mitchell, J.F.B. Changes in daily precipitation under enhanced greenhouse conditions. Clim. Dyn. 1997, 13, 667–680. [Google Scholar] [CrossRef]
  10. Fujibe, F. Clausius-Clapeyron-like relationship in multidecadal changes of extreme short-term precipitation and temperature in Japan. Atmos. Sci. Lett. 2013, 14, 127–132. [Google Scholar] [CrossRef]
  11. Kysely, J. Trends in heavy precipitation in the Czech Republic over 1961-2005. Int. J. Climatol. 2009, 29, 1745–1758. [Google Scholar] [CrossRef]
  12. Bengtsson, L.; Rana, A. Long- term change of daily and multi- daily precipitation in southern Sweden. Hydrol. Process. 2014, 28, 2897–2911. [Google Scholar] [CrossRef]
  13. Haylock, M.; Nicholls, N. Trends in extreme rainfall indices for an updated high quality data set for Australia, 1910–1998. Int. J. Climatol. 2000, 20, 1533–1541. [Google Scholar] [CrossRef]
  14. Karagiannidis, A.F.; Karacostas, T.; Maheras, P.; Makrogiannis, T. Climatological aspects of extreme precipitation in Europe, related to mid-latitude cyclonic systems. Theor. Appl. Climatol. 2012, 107, 165–174. [Google Scholar] [CrossRef]
  15. Huang, G.; Wen, G. Spatial and temporal variations of light rain events over China and the mid-high latitudes of the Northern Hemisphere. Chin. Sci. Bull. 2013, 58, 1402–1411. [Google Scholar] [CrossRef] [Green Version]
  16. Qian, W.; Fu, J.; Yan, Z. Decrease of light rain events in summer associated with a warming environment in China during 1961–2005. Geophys. Res. Lett. 2007, 34. [Google Scholar] [CrossRef]
  17. Miao, C.; Duan, Q.; Sun, Q.; Lei, X.; Li, H. Non-uniform changes in different categories of precipitation intensity across China and the associated large-scale circulations. Environ. Res. Lett. 2019, 14, 025004. [Google Scholar] [CrossRef]
  18. Fu, G.; Yu, J.; Yu, X.; Ouyang, R.; Zhang, Y.; Wang, P.; Liu, W.; Min, L. Temporal variation of extreme rainfall events in China, 1961–2009. J. Hydrol. 2013, 487, 48–59. [Google Scholar] [CrossRef]
  19. Wu, Y.; Wu, S.-Y.; Wen, J.; Xu, M.; Tan, J. Changing characteristics of precipitation in China during 1960–2012. Int. J. Climatol. 2016, 36, 1387–1402. [Google Scholar] [CrossRef]
  20. Liu, B.H.; Xu, M.; Henderson, M.; Qi, Y. Observed trends of precipitation amount, frequency, and intensity in China, 1960–2000. J. Geophys. Res. Atmos. 2005, 110, 1–10. [Google Scholar] [CrossRef]
  21. Karl, T.R.; Knight, R.W. Secular trends of precipitation amount, frequency, and intensity in the United States. Bull. Am. Meteorol. Soc. 1998, 79, 231–241. [Google Scholar] [CrossRef]
  22. Raziei, T.; Daryabari, J.; Bordi, I.; Modarres, R.; Pereira, L.S. Spatial patterns and temporal trends of daily precipitation indices in Iran. Clim. Chang. 2014, 124, 239–253. [Google Scholar] [CrossRef]
  23. Feng, Y.; Zhao, X. Changes in spatiotemporal pattern of precipitation over China during 1980–2012. Environ. Earth Sci. 2015, 73, 1649–1662. [Google Scholar] [CrossRef]
  24. Zhang, S.; Wu, J.; Zhao, D.; Xia, L. Characteristics and reasons for light rain reduction in Southwest China in recent decades. Prog. Phys. Geogr. 2019, 43, 643–665. [Google Scholar] [CrossRef]
  25. IPCC. Climate change 2013: The physical science basis. In Contribution of Working Group I to the Fifth Assessment Report of the Intergovernmental Panel on Climate Change; Cambridge University Press: Cambridge, UK; New York, NY, USA. [CrossRef] [Green Version]
  26. O’Gorman, P.A.; Muller, C.J. How closely do changes in surface and column water vapor follow Clausius-Clapeyron scaling in climate change simulations? Environ. Res. Lett. 2010, 5. [Google Scholar] [CrossRef]
  27. Lupikasza, E. Spatial and temporal variability of extreme precipitation in Poland in the period 1951–2006. Int. J. Climatol. 2010, 30, 991–1007. [Google Scholar] [CrossRef]
  28. Ntegeka, V.; Willems, P. Trends and multidecadal oscillations in rainfall extremes, based on a more than 100-year time series of 10 min rainfall intensities at Uccle, Belgium. Water Resour. Res. 2008, 44. [Google Scholar] [CrossRef]
  29. Trenberth, K.E. Changes in precipitation with climate change. Clim. Res. 2011, 47, 123–138. [Google Scholar] [CrossRef] [Green Version]
  30. Zhou, C.; Wang, K. Quantifying the Sensitivity of Precipitation to the Long-Term Warming Trend and Interannual-Decadal Variation of Surface Air Temperature over China. J. Clim. 2017, 30, 3687–3703. [Google Scholar] [CrossRef]
  31. Martinkova, M.; Kysely, J. Overview of Observed Clausius-Clapeyron Scaling of Extreme Precipitation in Midlatitudes. Atmosphere 2020, 11, 786. [Google Scholar] [CrossRef]
  32. Karl, T.R.; Trenberth, K.E. Modern global climate change. Science 2003, 302, 1719–1723. [Google Scholar] [CrossRef] [Green Version]
  33. Liu, S.C.; Fu, C.; Shiu, C.-J.; Chen, J.-P.; Wu, F. Temperature dependence of global precipitation extremes. Geophys. Res. Lett. 2009, 36. [Google Scholar] [CrossRef] [Green Version]
  34. Shiu, C.-J.; Liu, S.C.; Fu, C.; Dai, A.; Sun, Y. How much do precipitation extremes change in a warming climate? Geophys. Res. Lett. 2012, 39. [Google Scholar] [CrossRef] [Green Version]
  35. Zhao, G.; Mu, X.; Hoermann, G.; Fohrer, N.; Xiong, M.; Su, B.; Li, X. Spatial patterns and temporal variability of dryness/wetness in the Yangtze River Basin, China. Quat. Int. 2012, 282, 5–13. [Google Scholar] [CrossRef]
  36. Zhang, Q.; Peng, J.; Xu, C.-Y.; Singh, V.P. Spatiotemporal variations of precipitation regimes across Yangtze River Basin, China. Theor. Appl. Climatol. 2014, 115, 703–712. [Google Scholar] [CrossRef]
  37. Yang, H.; Zhi, X.F.; Gao, J.; Liu, Y. Variation of East Asian Summer Monsoon and Its Relationship with Precipitation of China in Recent 111 Years. Agric. Sci. Technol. 2011, 12, 1711–1716. [Google Scholar] [CrossRef]
  38. Ali, R.; Kuriqi, A.; Abubaker, S.; Kisi, O. Long-Term Trends and Seasonality Detection of the Observed Flow in Yangtze River Using Mann-Kendall and Sen’s Innovative Trend Method. Water 2019, 11, 1855. [Google Scholar] [CrossRef] [Green Version]
  39. Su, B.; Gemmer, M.; Jiang, T. Spatial and temporal variation of extreme precipitation over the Yangtze River Basin. Quat. Int. 2008, 186, 22–31. [Google Scholar] [CrossRef]
  40. Chen, Y.D.; Zhang, Q.; Xiao, M.; Singh, V.P.; Leung, Y.; Jiang, L. Precipitation extremes in the Yangtze River Basin, China: Regional frequency and spatial-temporal patterns. Theor. Appl. Climatol. 2014, 116, 447–461. [Google Scholar] [CrossRef]
  41. Xiao, M.; Zhang, Q.; Singh, V.P. Influences of ENSO, NAO, IOD and PDO on seasonal precipitation regimes in the Yangtze River basin, China. Int. J. Climatol. 2015, 35, 3556–3567. [Google Scholar] [CrossRef]
  42. Guan, Y.; Zheng, F.; Zhang, X.; Wang, B. Trends and variability of daily precipitation and extremes during 1960-2012 in the Yangtze River Basin, China. Int. J. Climatol. 2017, 37, 1282–1298. [Google Scholar] [CrossRef]
  43. Sun, H.; Zhang, X.; Luo, Z.; Shang, C.; He, X.; Rao, Z. Analyses on Characteristics of Extreme Precipitation Indices in the Yangtze River Basin in the Past 53 Years. Resour. Environ. Yangtze Val. 2018, 27, 1879–1890. [Google Scholar]
  44. Guo, J.; Guo, S.; Li, Y.; Chen, H.; Li, T. Spatial and temporal variation of extreme precipitation indices in the Yangtze River basin, China. Stoch. Environ. Res. Risk Assess. 2013, 27, 459–475. [Google Scholar] [CrossRef]
  45. Wang, M.; Yin, S.Y. Spatiotemporal variations of the extremeprecipitation of middle and lower reaches of the Yangtze River inrecent 52 years. Resour. Environ. Yangtze Val. 2015, 24, 1221–1229. [Google Scholar] [CrossRef]
  46. Becker, S.; Gemmer, M.; Jiang, T. Spatiotemporal analysis of precipitation trends in the Yangtze River catchment. Stoch. Environ. Res. Risk Assess. 2006, 20, 435–444. [Google Scholar] [CrossRef]
  47. Wang, S.; Zhang, M.; Wang, B.; Sun, M.; Li, X. Recent changes in daily extremes of temperature and precipitation over the western Tibetan Plateau, 1973–2011. Quat. Int. 2013, 313, 110–117. [Google Scholar] [CrossRef]
  48. Hu, C.; Xu, Y.; Han, L.; Yang, L.; Xu, G. Long-term trends in daily precipitation over the Yangtze River Delta region during 1960–2012, Eastern China. Theor. Appl. Climatol. 2016, 125, 131–147. [Google Scholar] [CrossRef]
  49. Sang, Y.-F.; Wang, Z.; Liu, C. Spatial and temporal variability of daily temperature during 1961-2010 in the Yangtze River Basin, China. Quat. Int. 2013, 304, 33–42. [Google Scholar] [CrossRef]
  50. Su, B.D.; Jiang, T.; Jin, W.B. Recent trends in observed temperature and precipitation extremes in the Yangtze River basin, China. Theor. Appl. Climatol. 2006, 83, 139–151. [Google Scholar] [CrossRef]
  51. Zhao, G.J.; Hoermann, G.; Fohrer, N.; Gao, J.F.; Zhai, J.Q.; Zhang, Z.X. Spatial and temporal characteristics of wet spells in the Yangtze River Basin from 1961 to 2003. Theor. Appl. Climatol. 2009, 98, 107–117. [Google Scholar] [CrossRef]
  52. Fu, C.; Dan, L. Trends in the Different Grades of Precipitation over South China during 1960-2010 and the Possible Link with Anthropogenic Aerosols. Adv. Atmos. Sci. 2014, 31, 480–491. [Google Scholar] [CrossRef]
  53. Huang, D.-Q.; Zhu, J.; Zhang, Y.-C.; Huang, Y.; Kuang, X.-Y. Assessment of summer monsoon precipitation derived from five reanalysis datasets over East Asia. Q. J. R. Meteorol. Soc. 2016, 142, 108–119. [Google Scholar] [CrossRef]
  54. Zhai, P.M.; Ren, F.M.; Zhang, Q. Detection of trends in China’s precipitation extremes. Acta Meteorol. Sin. 1999, 57, 208–216. [Google Scholar] [CrossRef]
  55. Tabari, H.; Talaee, P.H. Temporal variability of precipitation over Iran: 1966–2005. J. Hydrol. 2011, 396, 313–320. [Google Scholar] [CrossRef]
  56. Hamed, K.H. Trend detection in hydrologic data: The Mann-Kendall trend test under the scaling hypothesis. J. Hydrol. 2008, 349, 350–363. [Google Scholar] [CrossRef]
  57. Kuriqi, A.; Ali, R.; Quoc Bao, P.; Gambini, J.M.; Gupta, V.; Malik, A.; Nguyen Thi Thuy, L.; Joshi, Y.; Duong Tran, A.; Van Thai, N.; et al. Seasonality shift and streamflow flow variability trends in central India. Acta Geophys. 2020, 68, 1461–1475. [Google Scholar] [CrossRef]
  58. Yue, S.; Wang, C.Y. The Mann-Kendall test modified by effective sample size to detect trend in serially correlated hydrological series. Water Resour. Manag. 2004, 18, 201–218. [Google Scholar] [CrossRef]
  59. Qian, Y.; Gong, D.; Fan, J.; Leung, L.R.; Bennartz, R.; Chen, D.; Wang, W. Heavy pollution suppresses light rain in China: Observations and modeling. J. Geophys. Res. Atmos. 2009, 114, D7. [Google Scholar] [CrossRef]
  60. Zhao, C.; Tie, X.; Lin, Y. A possible positive feedback of reduction of precipitation and increase in aerosols over eastern central China. Geophys. Res. Lett. 2006, 33. [Google Scholar] [CrossRef]
  61. Wu, Y.; Ji, H.; Wen, J.; Wu, S.-Y.; Xu, M.; Tagle, F.; He, B.; Duan, W.; Li, J. The characteristics of regional heavy precipitation events over eastern monsoon China during 1960–2013. Glob. Planet. Chang. 2019, 172, 414–427. [Google Scholar] [CrossRef]
  62. Wang, Y.; Yan, Z. Changes of frequency of summer precipitation extremes over the Yangtze River in association with large-scale oceanic-atmospheric conditions. Adv. Atmos. Sci. 2011, 28, 1118–1128. [Google Scholar] [CrossRef]
  63. Zhang, Q.; Xu, C.-Y.; Chen, X.; Zhang, Z. Statistical behaviours of precipitation regimes in China and their links with atmospheric circulation 1960–2005. Int. J. Climatol. 2011, 31, 1665–1678. [Google Scholar] [CrossRef]
  64. Lu, M.; Wu, S.-J.; Chen, J.; Chen, C.; Wen, Z.; Huang, Y. Changes in extreme precipitation in the Yangtze River basin and its association with global mean temperature and ENSO. Int. J. Climatol. 2018, 38, 1989–2005. [Google Scholar] [CrossRef]
  65. Qian, Y.; Gong, D.; Leung, R. Light rain events change over North America, Europe, and Asia for 1973–2009. Atmos. Sci. Lett. 2010, 11, 301–306. [Google Scholar] [CrossRef]
  66. Russo, S.; Sterl, A. Global changes in seasonal means and extremes of precipitation from daily climate model data. J. Geophys. Res. Atmos. 2012, 117. [Google Scholar] [CrossRef] [Green Version]
  67. Kharin, V.V.; Zwiers, F.W.; Zhang, X.; Wehner, M. Changes in temperature and precipitation extremes in the CMIP5 ensemble. Clim. Chang. 2013, 119, 345–357. [Google Scholar] [CrossRef]
  68. Groisman, P.Y.; Knight, R.W. Prolonged dry episodes over the conterminous united states: New tendencies emerging during the last 40 years. J. Clim. 2008, 21, 1850–1862. [Google Scholar] [CrossRef]
  69. Tian, Q.; Prange, M.; Merkel, U. Precipitation and temperature changes in the major Chinese river basins during 1957-2013 and links to sea surface temperature. J. Hydrol. 2016, 536, 208–221. [Google Scholar] [CrossRef]
  70. Cui, L.; Wang, L.; Lai, Z.; Tian, Q.; Liu, W.; Li, J. Innovative trend analysis of annual and seasonal air temperature and rainfall in the Yangtze River Basin, China during 1960–2015. J. Atmos. Sol.-Terr. Phys. 2017, 164, 48–59. [Google Scholar] [CrossRef]
  71. Wu, J.; Zhang, L.Y.; Zhao, D.M.; Tang, J.P. Impacts of warming and water vapor content on the decrease in light rain days during the warm season over eastern China. Clim. Dyn. 2015, 45, 1841–1857. [Google Scholar] [CrossRef]
  72. Held, I.M.; Soden, B.J. Robust responses of the hydrological cycle to global warming. J. Clim. 2006, 19, 5686–5699. [Google Scholar] [CrossRef]
  73. Zhang, M.; Ma, Y.; Wang, L.; Gong, W.; Hu, B.; Shi, Y. Spatial-temporal characteristics of aerosol loading over the Yangtze River Basin during 2001–2015. Int. J. Climatol. 2018, 38, 2138–2152. [Google Scholar] [CrossRef]
  74. Rosenfeld, D.; Lohmann, U.; Raga, G.B.; O’Dowd, C.D.; Kulmala, M.; Fuzzi, S.; Reissell, A.; Andreae, M.O. Flood or Drought: How Do Aerosols Affect Precipitation? Science 2008, 321, 1309–1313. [Google Scholar] [CrossRef] [PubMed] [Green Version]
  75. Tao, H.; Gemmer, M.; Jiang, J.; Lai, X.; Zhang, Z. Assessment of CMIP3 climate models and projected changes of precipitation and temperature in the Yangtze River Basin, China. Clim. Chang. 2012, 111, 737–751. [Google Scholar] [CrossRef]
  76. Niu, Z.; Wang, L.; Fang, L.; Li, J.; Yao, R. Analysis of spatiotemporal variability in temperature extremes in the Yellow and Yangtze River basins during 1961–2014 based on high-density gauge observations. Int. J. Climatol. 2020, 40, 1–21. [Google Scholar] [CrossRef]
Figure 1. Spatial distribution of the 148 meteorological stations used in this study and their regional classification. Six subregions were classified: the eastern Tibetan Plateau (I), the Sichuan Basin (II), the south-central region (III), the mid-eastern region (IV), the southeastern region (V), and the northeastern region (VI) in the YRB.
Atmosphere 12 00413 g001
Figure 2. The annual time series of the different grades of precipitation amounts and frequencies (aj) in the whole Yangtze River Basin (YRB) and six subregions (regions I, II, III, IV, V, and VI) from 1960–2017. The bold solid lines represent linear temporal trends.
Atmosphere 12 00413 g002aAtmosphere 12 00413 g002b
Figure 3. Spatial variations in different grades of precipitation amounts and frequencies (aj) over the YRB from 1960–2017. The trend is expressed as a percentage of the average precipitation amount (frequency) per decade. A red (blue) spot represents a station showing an increasing (decreasing) tendency. Dark red (blue) represents a significant increase (decrease) at the 0.05 confidence level.
Atmosphere 12 00413 g003
Figure 4. The contribution rate trends of different grades of precipitation events to the total precipitation amount and frequency (ah) for the whole YRB and subregions from 1960 to 2017. Bold solid lines represent linear temporal trends.
Atmosphere 12 00413 g004
Table 1. The trends of the different grades of precipitation amounts and frequencies over the Yangtze River Basin (YRB) and its six subregions from 1960–2017 (%/10a).
RegionsSAMALAHATASDMDLDHDTD
I0.50 0.98 1.91 6.98 *1.20 −1.24 * 0.98 1.74 7.36 * −0.87
II−1.75 * −1.30 −0.66 −1.16 −1.27 −3.89 * −1.28 −0.76 −2.10 −3.41
III−2.25 * −2.02 * 0.01 5.33 * −0.50 −5.06 * −2.26 * −0.05 4.33 −4.38 *
IV−2.28 * −1.90 0.76 2.58 −0.46 −4.38 * −1.95 0.77 2.21 −3.61 *
V−1.41 −0.74 1.75 4.73 0.86 −3.52 * −0.85 1.64 4.07 −2.49 *
VI−0.98 −0.07 2.82 6.36 * 2.16 −4.84 * −0.11 2.72 5.84 * −3.12 *
YRB−1.22 *−0.62 1.51 4.27 * 0.71 −3.86 * −0.72 1.43 3.69 * −2.97 *
* Significant at the 0.05 level.
Table 2. Contributions of different categories of precipitation to the total precipitation over the YRB from 1960–2017 (%).
RegionsSAMALAHASDMDLDHD
I42.79 37.50 15.01 4.70 84.80 12.52 2.32 0.37
II28.81 27.00 21.13 23.06 81.94 11.85 4.22 1.99
III29.72 31.47 23.90 14.90 82.26 12.15 4.30 1.29
IV25.24 30.52 25.46 18.78 77.78 14.57 5.67 1.98
V21.69 31.60 27.99 18.72 72.70 17.56 7.39 2.36
VI19.97 29.11 26.42 24.50 71.95 17.49 7.43 3.13
YRB25.74 30.48 24.23 19.55 78.05 14.60 5.38 1.97
Table 3. Regional contribution rate trends for different grades of precipitation events to the total precipitation amounts and frequencies in the YRB(%/10a).
RegionsSAMALAHASDMDLDHD
I−0.31 −0.07 0.10 0.28 * −0.32 * 0.23 * 0.06 * 0.03 *
II−0.13 −0.02 0.13 0.01 −0.39 * 0.25 * 0.11 0.03
III−0.48 * −0.50 * 0.12 0.85 * −0.55 * 0.25 * 0.18 * 0.11 *
IV−0.45 * −0.48 * 0.30 0.63 * −0.60 * 0.24 * 0.25 * 0.12 *
V−0.51 * −0.48 * 0.21 0.77 * −0.74 * 0.29 * 0.30 * 0.16 *
VI−0.62 * −0.63 * 0.15 1.10 * −1.20 * 0.51 * 0.42 * 0.27 *
YRB−0.48 * −0.41 * 0.18 0.71 * −0.68 * 0.32 * 0.23 * 0.13 *
* Significant at the 0.05 level.
Table 4. Sensitivity of precipitation to the long-term trend of air temperature over the YRB and its six subregions from 1960–2017 (%/K).
RegionsSAMALAHATASDMDLDHDTD
I−0.63 1.14 3.71 17.67 * 1.56 −6.02 * 1.05 3.56 19.70 * −4.82 *
II−10.35 * −3.14 4.11 −7.63 −4.72 −13.00 * −3.724.31 −9.14 −11.10 *
III−10.33 * −5.06 0.24 10.73 −2.98 −16.53 * −5.93 −0.38 7.99 −14.24 *
IV−10.65 * −7.98 −4.35 1.71 −5.87 * −12.91 * −8.40 * −4.51 0.34 −11.52 *
V−11.24 * −6.44 3.56 12.91 −0.96 −12.01 * −6.89 2.84 10.36 −9.48 *
VI−4.57 * −2.70 1.56 6.80 0.43 −10.42 * −2.91 1.42 5.55 −7.74 *
YRB−6.14 * −2.35 5.09 13.35* 1.57 −11.63 * −2.85 4.72 11.01 * −9.03 *
* Significant at the 0.05 level.
Publisher’s Note: MDPI stays neutral with regard to jurisdictional claims in published maps and institutional affiliations.

