
Characterizing Bushfire Occurrences over Jamaica Using the MODIS C6 Fire Archive 2001–2019


Abstract
:1. Introduction

| Region | Fire Data Source/Fire Indices | Observations in Relation to Climate | References |
|---|---|---|---|
| Alaska | Alaska Fire Service Data (1955–2009) |
| [12] |
| Australia | Daily meteorological data (1973–2017) including maximum temperature (°C), relative humidity (%), wind speed (kmh−1); derived drought factor calculated using the Keetch Byram Drought Index (KBDI) for calculation of McArthur Forest Fire Danger Index (FFDI) |
| [10] |
| Hawai’i | Three local repositories of territorial and state reports of area burnt for 1901–2004. Fire occurrences from Hawai’i Wildfire Management Organization (1967–2003). Wildfire conditions obtained from HWMO records (2005–2011) for which complete records from all agencies are available |
| [14] |
| Mediterranean | Four state-of-the-art satellite fire products related to Moderate Resolution Imaging Spectroradiometer (MODIS) (2001–2016) and fourth generation of the Global Fire Emissions Database (1995–2016). Gridded, ground-based European Forest Fire Information System (EFFIS) dataset (1985–2015) |
| [13] |
| North America | Palmer Drought Severity Index; Standard Precipitation Index; KBDI; Fosberg fire weather index (FFWI). |
| [9] |
| Portugal | Local records |
| [11] |
2. Materials and Methods
2.1. Materials
2.1.1. Study Area
2.1.2. Fire and Climate Data
2.2. Methods
2.2.1. Validation of the MODIS Data
2.2.2. Characterizing Temporal and Spatial Variability
2.2.3. Exploring Climate Linkages
3. Results
3.1. Validating MODIS: Models and Climatology
3.2. Temporal and Spatial Variability
3.3. Climate Variability and Fire Frequency Activity
- Significant correlations are noted in relation to annual and July to November rainfall and temperature. Correlations peak for rainfall in September−November (−0.52) and for temperature in July-August (0.54). Lagged correlations are significant with respect to rainfall (−0.48) and temperature (0.49) for July−August. The low frequency rainfall timeseries showed significant correlations for JA (−0.64) and SON (−0.58).
- Annual and AMJ fire activity exhibits variability similar to the Atlantic Multidecadal Oscillation (0.63 and 0.50, respectively) and exhibits some association with the Pacific Decadal Oscillation (−0.50) for DJFM. Correlations are also significant with respect to low level winds for DJFM (0.47). These associations are likely through the influence of the AMO and PDO on Jamaica’s rainfall variability.
- JA fire variability correlates significantly with Nino-3 (0.57) and the TNA (−0.59) with a gradient index combining the two indices showing a correlation of 0.68.
- SON fire variability appears to be related to Nino-3 (0.69), the gradient index (−0.72) and low-level wind in the region of the Caribbean low-level jest (−0.54).
4. Conclusions
Author Contributions
Funding
Institutional Review Board Statement
Informed Consent Statement
Data Availability Statement
Acknowledgments
Conflicts of Interest
References
- The Jamaica Gleaner. Jamaica Fire Brigade Reporting an Increase in the Number of Bushfires. 18 April 2020. Available online: https://www.jamaica-gleaner.com/article/news/20200418/jamaica-fire-brigade-reporting-increase-number-bush-fires (accessed on 9 September 2020).
- Countryman, C.M. The Fire Environment Concept; Pacific Southwest Forest and Range Experiment Station: Berkeley, CA, USA, 1972. [Google Scholar]
- Johnson, E.A. Fire and Vegetation Dynamics; Cambridge University Press: Cambridge, UK, 1992. [Google Scholar]
- Swetnam, T.W. Fire History and Climate Change in Giant Sequoia Groves. Science 1993, 262, 885–889. [Google Scholar] [CrossRef] [PubMed]
- Weaver, P.; Gonzalez, K. (Eds.) Wildland Fire Management and Restoration: Proceedings of the 12th Meeting of the Caribbean Foresters in Puerto Rico, 7–11 June 2004; International Institute of Tropical Forestry, USDA Forest Service (IITF): Rio Piedras, Puerto Rico, 2005. [Google Scholar]
- Robbins, A.M.J. Global Forest Resources Assessment 2005—Report on Fires in the Caribbean and Mesoamerican Regions. Fire Management Working Paper 12; FAO—Food and Agriculture Organization: Rome, Italy, 2006. [Google Scholar]
- Robbins, A.M.J.; Eckelmann, C.-M.; Quinones, M. Forest Fires in the Insular Caribbean. Ambio 2008, 37, 528–534. [Google Scholar] [CrossRef] [PubMed]
- Akpinar-Elci, M.; Coomansingh, K.; Blando, J.; Mark, L. Household bush burning practice and related respiratory symptoms in Grenada, the Caribbean. J. Air Waste Manag. Assoc. 2015, 65, 1148–1152. [Google Scholar] [CrossRef] [PubMed] [Green Version]
- Litell, J.S.; Peterson, D.L.; Riley, K.L.; Liu, Y.; Luce, C.H. A review of the relationships between drought and forest fire in the United States. Glob. Change Biol. 2016, 22, 2353–2369. [Google Scholar] [CrossRef] [PubMed]
- Harris, S.; Lucas, C. Understanding the variability of Australian fire weather between 1973 and 2017. PLoS ONE 2019, 14, e0222328. [Google Scholar] [CrossRef] [PubMed]
- Parente, J.; Pereira, M.; Amraoui, M.; Tedim, F. Negligent and intentional fires in Portugal: Spatial distribution characterization. Sci. Total Environ. 2018, 624, 424–437. [Google Scholar] [CrossRef] [Green Version]
- Wendler, G.; Conner, J.; Moore, B.; Shulski, M.; Stuefer, M. Climatology of Alaskan wildfires with special emphasis on the extreme year of 2004. Theor. Appl. Climatol. 2011, 104, 459–472. [Google Scholar] [CrossRef]
- Turco, M.; Llasat, M.-C.; von Hardenberg, J.; Provenzale, A. Climate change impacts on wildfires in a Mediterranean environment. Clim. Chang. 2014, 125, 369–380. [Google Scholar] [CrossRef]
- Trauernicht, C.; Pickett, E.; Giardina, C.P.; Litton, C.M.; Cordell, S.; Beavers, A. The Contemporary Scale and Context of Wildfire in Hawaii. Pac. Sci. 2015, 69, 427–444. [Google Scholar] [CrossRef]
- Mouillot, F.; Field, C. Fire history and the global carbon budget: A 1° × 1° fire history reconstruction for the 20th century. Glob. Change Biol. 2005, 11, 398–420. [Google Scholar] [CrossRef]
- Koutsias, N.; Xanthopoulos, G.; Founda, D.; Xystrakis, F.; Nioti, F.; Pleniou, M.; Mallinis, G.; Arianoutsou, M. On the relationships between forest fires and weather conditions in Greece from long-term national observation (1894–2010). Int. J. Wildland Fire 2013, 22, 493–507. [Google Scholar] [CrossRef] [Green Version]
- Pereira, M.; Malamud, B.; Trigo, R.; Alves, P. The history and characteristics of the 1980–2005 portuguese rural fire database. Nat. Hazards Earth Syst. Sci. 2011, 11, 3343–3358. [Google Scholar] [CrossRef]
- Short, K. Sources and implications of bias and uncertainty in a century of US wildfire activity data. Int. J. Wildland Fire 2015, 24, 883–891. [Google Scholar] [CrossRef]
- Turco, M.; Llasat, M.; Tudela, A.; Castro, X.; Provenzale, A. Decreasing fires in a Mediterranean region (1970–2010, NE Spain). Nat. Hazards Earth Syst. Sci. 2013, 13, 649–652. [Google Scholar] [CrossRef] [Green Version]
- Stephenson, T.; Vincent, L.; Allen, T.; Van Meerbeeck, C.; Mclean, N.; Peterson, T.; Taylor, M.A.; Aaron-Morrison, A.P.; Auguste, T.; Bernard, D.; et al. Changes in extreme temperature and precipitation in the Caribbean region. Int. J. Climatol. 2014, 34, 2957–2971. [Google Scholar] [CrossRef]
- Peterson, T.C.; Taylor, M.A.; Demeritte, R.; Duncombe, D.L.; Burton, S.; Thompson, F.; Porter, A.; Mercedes, M.; Villegas, E.; Semexant Fils, R.; et al. Recent changes in climate extremes in the Caribbean region. J. Geophys. Res. Space Phys. 2002, 107, 4601. [Google Scholar] [CrossRef]
- IPCC. Managing the Risks of Extreme Events and Disasters to Advance Climate Change Adaptation; Cambridge University Press: Cambridge, UK, 2012. [Google Scholar]
- McSweeney, C.; Lizcano, G.; New, M.; Lu, X. The UNDP Climate Change Country Profiles: Improving the accessibility of observed and projected climate information for studies of climate change in developing countries. Bull. Am. Meteorol. Soc. 2010, 91, 157–166. [Google Scholar] [CrossRef] [Green Version]
- Hall, T.C.; Sealy, A.M.; Stephenson, T.; Kusunoki, S.; Taylor, M.; Chen, A.; Kitoh, A. Future climate of the Caribbean from a super-high-resolution atmospheric general circulation model. Theor. Appl. Climatol. 2013, 113, 271–287. [Google Scholar] [CrossRef]
- Mclean, N.; Stephenson, T.; Taylor, M.; Campbell, J. Characterization of Future Caribbean Rainfall and Temperature Extremes across Rainfall Zones. Adv. Meteorol. 2015, 2015, 1–18. [Google Scholar] [CrossRef]
- Jones, P.D.; Harpham, C.; Harris, I.; Goodess, C.M.; Burton, A.; Centella-Artola, A.; Taylor, M.A.; Bezanilla-Morlot, A.; Campbell, J.D.; Stephenson, T.S.; et al. Long-term trends in precipitation and temperature across the Caribbean. Int. J. Climatol. 2016, 36, 3314–3333. [Google Scholar] [CrossRef] [Green Version]
- Karmalkar, A.V.; Taylor, M.A.; Campbell, J.; Stephenson, T.; New, M.; Centella, A.; Benzanilla, A.; Charlery, J. A Review of Observed and Projected Changes in Climate for the Islands in the Caribbean. Atmosfera 2013, 26, 283–309. [Google Scholar] [CrossRef] [Green Version]
- Campbell, J.D.; Taylor, M.A.; Stephenson, T.S.; Watson, R.A.; Whyte, F.S. Future climate of the Caribbean from a regional climate model. Int. J. Climatol. 2011, 31, 1866–1878. [Google Scholar] [CrossRef]
- Taylor, M.A.; Clarke, L.A.; Centella, A.; Bezanilla, A.; Stephenson, T.S.; Jones, J.J.; Campbell, J.; Vichot, A.; Charlery, J. Future Caribbean Climates in a World of Rising Temperatures: The 1.5 vs 2 Dilemma. J. Clim. 2018, 31, 2907–2926. [Google Scholar] [CrossRef]
- Walters, R.N. Examining Drought in Jamaica and the Caribbean. Unpublished Master’s thesis, University of the West Indies, Mona, Kingston, Jamaica, 2016. [Google Scholar]
- Douglas, C.A.; Stephenson, T.S.; Taylor, M.A.; Brown, A.A.; Campbell, J.D.; Stennett-Brown, R.K.; Walters, R. Investigating decadal variability in Jamaica’s Rainfall: A Case Study for the Caribbean. Theoret. Appl. Climatol. 2020. Submitted. [Google Scholar]
- Chen, A.A.; Roy, A.; McTavish, J.; Taylor, M.; Marx, L. Using sea surface temperature anomalies to predict flood and drought conditions for the Caribbean. COLA Rep. 1997, 49, 24. [Google Scholar]
- Taylor, M.A.; Enfield, D.B.; Chen, A.A. Influence of the tropical Atlantic versus the tropical Pacific on Caribbean rainfall. J. Geophys. Res. Space Phys. 2002, 107, 3127. [Google Scholar] [CrossRef] [Green Version]
- Justice, C.; Gigliob, L.; Korontzia, S.; Owens, J.; Morisette, J.; Roy, D.; Descloitres, J.; Alleaume, S.; Petitcolin, F.; Kaufman, Y. The MODIS fire product. Remote Sens. Environ. 2002, 83, 244–262. [Google Scholar] [CrossRef]
- Giglio, L.; Descloitres, J.; Justice, C.O.; Kaufman, Y.J. An Enhanced Contextual Fire Detection Algorithm for MODIS. Remote Sens. Environ. 2003, 87, 273–282. [Google Scholar] [CrossRef]
- Enfield, D.B.; Mestas-Nunez, A.M.; Mayer, D.A.; Cid-Serrano, L. How ubiquitous is the dipole relationship in the tropical Atlantic Sea Surface Temperatures? J. Geophys. Res. Ocean 1999, 104, 7841–7848. [Google Scholar] [CrossRef]
- Jury, M.; Malmgren, B.A.; Winter, A. Subregional precipitation climate of the caribbean and relationship with ENSo and NAO. J. Geophys. Res. Space Phys. 2007, 112. [Google Scholar] [CrossRef]
- Gouirand, I.; Jury, M.R.; Sing, B. An analysis of low- and high-frequency summer climate variability around the caribbean antilles. J. Clim. 2012, 25, 3942–3952. [Google Scholar] [CrossRef]
- Ren, H.; Zuo, J.; Deng, Y. Statistical predictability of Nino indices for two stages of ENSO. Clim. Dyn. 2019, 52, 5361–5382. [Google Scholar] [CrossRef] [Green Version]
- Hossain, I.; Rasel, H.M.; Imteaz, M.A.; Mekanik, F. Long term seasonal rainfall forecasting using linear and non linear modelling approaches: A case study for Western Australia. Meteorol. Atmos. Phys. 2020, 132, 131–141. [Google Scholar] [CrossRef]
- Whyte, F.S.; Taylor, M.A.; Stephenson, T.A.; Campbell, J.D. Features of the Caribbean Low level jet. Int. J. Climatol. 2008, 28, 119–128. [Google Scholar] [CrossRef]
- Cook, K.; Vizy, E. Hydrodynamics of the Caribbean low-level jet and its relationship to precipitation. J. Clim. 2010, 23, 1477–1494. [Google Scholar] [CrossRef]
- Chen, A.A.; Taylor, M.A. Investigating the link between early season Caribbean rainfall and the El Nino+1 year. Int. J. Climatol. 2002, 22, 87–106. [Google Scholar] [CrossRef]
- Enfield, D.B.; Mestas-Nunez, A.M.; Trimble, P.J. The Atlantic multidecadal oscillation and its relation to rainfall and river flows in the continental U.S. Geophys. Res. Lett. 2001, 28, 2077–2080. [Google Scholar] [CrossRef] [Green Version]
- Zhang, Y.; Wallace, J.; Battisti, D. Enso-like interdecadal variability. J. Clim. 1997, 10, 1004–1020. [Google Scholar] [CrossRef]
- Frankcombe, L.; Dijkstra, H. Coherent multidecadal variability in North Atlantic sea level. Geophys. Res. Lett. 2009. [Google Scholar] [CrossRef] [Green Version]
- Zuur, A.; Ieno, E.N.; Walker, N.; Saveliev, A.A.; Smith, G.M. Mixed Effects Models and Extensions in Ecology in R; Springer Science & Business Media: New York, NY, USA, 2009. [Google Scholar]
- Climate Studies Group, Mona (CSGM). State of the Jamaican Climate 2015: Information for Resilience Building; Produced for the Planning Institute of Jamaica (PIOJ): Kingston, Jamaica, 2017. [Google Scholar]
- Mann, H. Non-parametric tests against trend. Econometrica 1945, 13, 245–259. [Google Scholar] [CrossRef]
- Kendall, M. Rank Correlation Methods, 4th ed.; Charles Griffin: London, UK, 1975. [Google Scholar]
- Yilmaz, A.G.; Hossain, I.; Perera, B.J.C. Effect of climate change and variability on extreme rainfall intensity–frequency–duration relationships: A case study of Melbourne. Hydrol. Earth Syst. Sci. 2014, 18, 4065–4076. [Google Scholar] [CrossRef] [Green Version]
- Sen, P. Estimates of the Regression Coefficient based on Kendall’s Tau. J. Am. Stat. Assoc. 1968, 63, 1379–1389. [Google Scholar] [CrossRef]
- Tan, X.; Gan, T.Y.; Shao, D. Wavelet analysis of precipitation extremes over Canadian ecoregions and teleconnections to large-scale climate anomalies. J. Geophys. Res. Atmos. 2016, 121, 14469–14486. [Google Scholar] [CrossRef]
- Kuo, C.-C.; Gan, T.Y.; Yu, P.-S. Wavelet Analysis on the Variability, Teleconnectivity, and Predictability of the Seasonal Rainfall of Taiwan. Mon. Weather Rev. 2010, 138, 162–174. [Google Scholar] [CrossRef]
- Huang, B.; Torne, P.; Banzon, V.; Boyer, T.; Chepurin, G.; Lawrimore, J.; Menne, M.; Smith, T.; Vose, R.; Zhang, H. Extended Reconstructed Sea Surface Temperature, Version 5 (ERSSTv5): Upgrades, Validations, and Intercomparisons. J. Clim. 2017, 30, 8179–8204. [Google Scholar] [CrossRef]
- Dee, D.; Uppala, S.; Simmons, A.; Berrisford, P.; Poli, P.; Kobayashi, S.; Andrae, U.; Balmaseda, M.; Balsamo, G.; Bauer, P.; et al. The ERA-Interim reanalysis: Configuration and performance of the data assimilation system. Q. J. R. Meteorol. Soc. 2011, 137, 553–597. [Google Scholar] [CrossRef]
- Curtis, S. The El Niño–Southern Oscillation and Global Precipitation. Geogr. Compass 2008, 2, 600–619. [Google Scholar] [CrossRef]
- Mantua, N.; Hare, S.; Zhang, Y.; Wallace, J.; Francis, R. A pacific interdecadal climate oscillation with impacts on salmon production. Bull. Am. Meteorol. Soc. 1997, 78, 1069–1079. [Google Scholar] [CrossRef]
- Mantua, N.J.; Hare, S.R. The Pacific Decadal Oscillation. J. Oceanogr. 2002, 58, 35–44. [Google Scholar] [CrossRef]
- Hurrell, J.W. Decadal Trends in the North Atlantic Oscillation: Regional Temperatures and Precipitation. Science 1995, 269, 676–679. [Google Scholar] [CrossRef] [PubMed] [Green Version]
- Markovic, D.; Koch, M. Wavelet and scaling analysis of monthly precipitation extremes in Germany in the 20th century: Interannual to interdecadal oscillations and the North Atlantic Oscillation influence. Water Resour. Res. 2005, 41. [Google Scholar] [CrossRef] [Green Version]


| Year | Location | Total Area Burned | Estimated Loss | Climate Event |
|---|---|---|---|---|
| 2014 | Bull Bay, St Thomas to Mavis Bank, St Andrew | 200 Acres | Approximately JMD 136 Million | Meteorological Drought (MD) Source: CIMH Caribbean Drought Bulletin Vol 1 Issue 6 November 2014 |
| 2015 | St Thomas Blue Mountain (Mavis Bank) | >247 Acres 500 Acres | Approximately JMD 146 Million Approximately JMD 300 Million | Very Strong El Nino Source: http://www.bom.gov.au/climate/enso/enlist/ (accessed on 18 August 2020) |
| 2016 | Bull Bay, St Thomas Mount Charles, St Andrew Craig Hill, St Andrew | - | - | - |
| 2017 | Roselle, St Thomas Pangully-Glengoffe, Cassava River St Catherine | >100 Acres | - | - |
| 2019 | Flagaman, St Elizabeth | >200 Acres | JMD 45 Million | El Niño Source: https://origin.cpc.ncep.noaa.gov/products/analysis_monitoring/ensostuff/ONI_v5.php (accessed on 18 August 2010) |
| Climate Indices | Definition | Reference |
|---|---|---|
| TNA | Area average of monthly sea surface temperature (SST) anomalies over 5.5° N–23.5° N and 15° W–57.5° W. Data: HadISST and NOAA OI 1° × 1°. Source: https://psl.noaa.gov/data/correlation/tna.data (accessed on 10 February 2020) | [36] |
| TSA | Area average of monthly SST anomalies over 0°–20° S and 10° E–30° W. Data: HadISST and NOAA OI 1° × 1° Source: https://psl.noaa.gov/data/correlation/tsa.data (accessed on 10 February 2020) | [36] |
| NINO 3.0 | Area average of monthly SST anomalies over 5° N–5° S and 150° W–90° W. Monthly ERSSTv5 are used to create index. Source: https://www.cpc.ncep.noaa.gov/data/indices/ersst5.nino.mth.81-10.ascii (accessed on 10 February 2020) | [39,40] |
| Low level winds | Area average of monthly zonal wind anomalies over 70°–80° W, 12.5°–17.5° N Data: NCEP/NCAR Reanalysis 2.5° × 2.5° | [41,42] |
| NAO | The index is obtained by projecting the NAO loading pattern, 1st mode of the Rotated Empirical Orthogonal Function, to the daily anomaly 500 mb height field over 0°–90° N. Source: https://www.cpc.ncep.noaa.gov/data/teledoc/nao.shtml (accessed on 10 February 2020) | [43] |
| AMO | An area weighted average of anomalies calculated over the North Atlantic Ocean (0° to 70° N) on the Kaplan SST dataset (5° × 5°) and the 1951–1980 interpolated NOAA ERSST V2 SST climatology was added back in. Data is unsmoothed and not detrended. Source: https://www.esrl.noaa.gov/psd/data/timeseries/AMO/ (accessed on 25 March 2020) | [44] |
| PDO | Standardised values of the PDO index are derived as the leading Principal Component of monthly sea surface temperature anomalies in the North Pacific Ocean (poleward of 20° N). Source: http://research.jisao.washington.edu/pdo/PDO.latest.txt (accessed on 25 March 2020) | [45,46] |
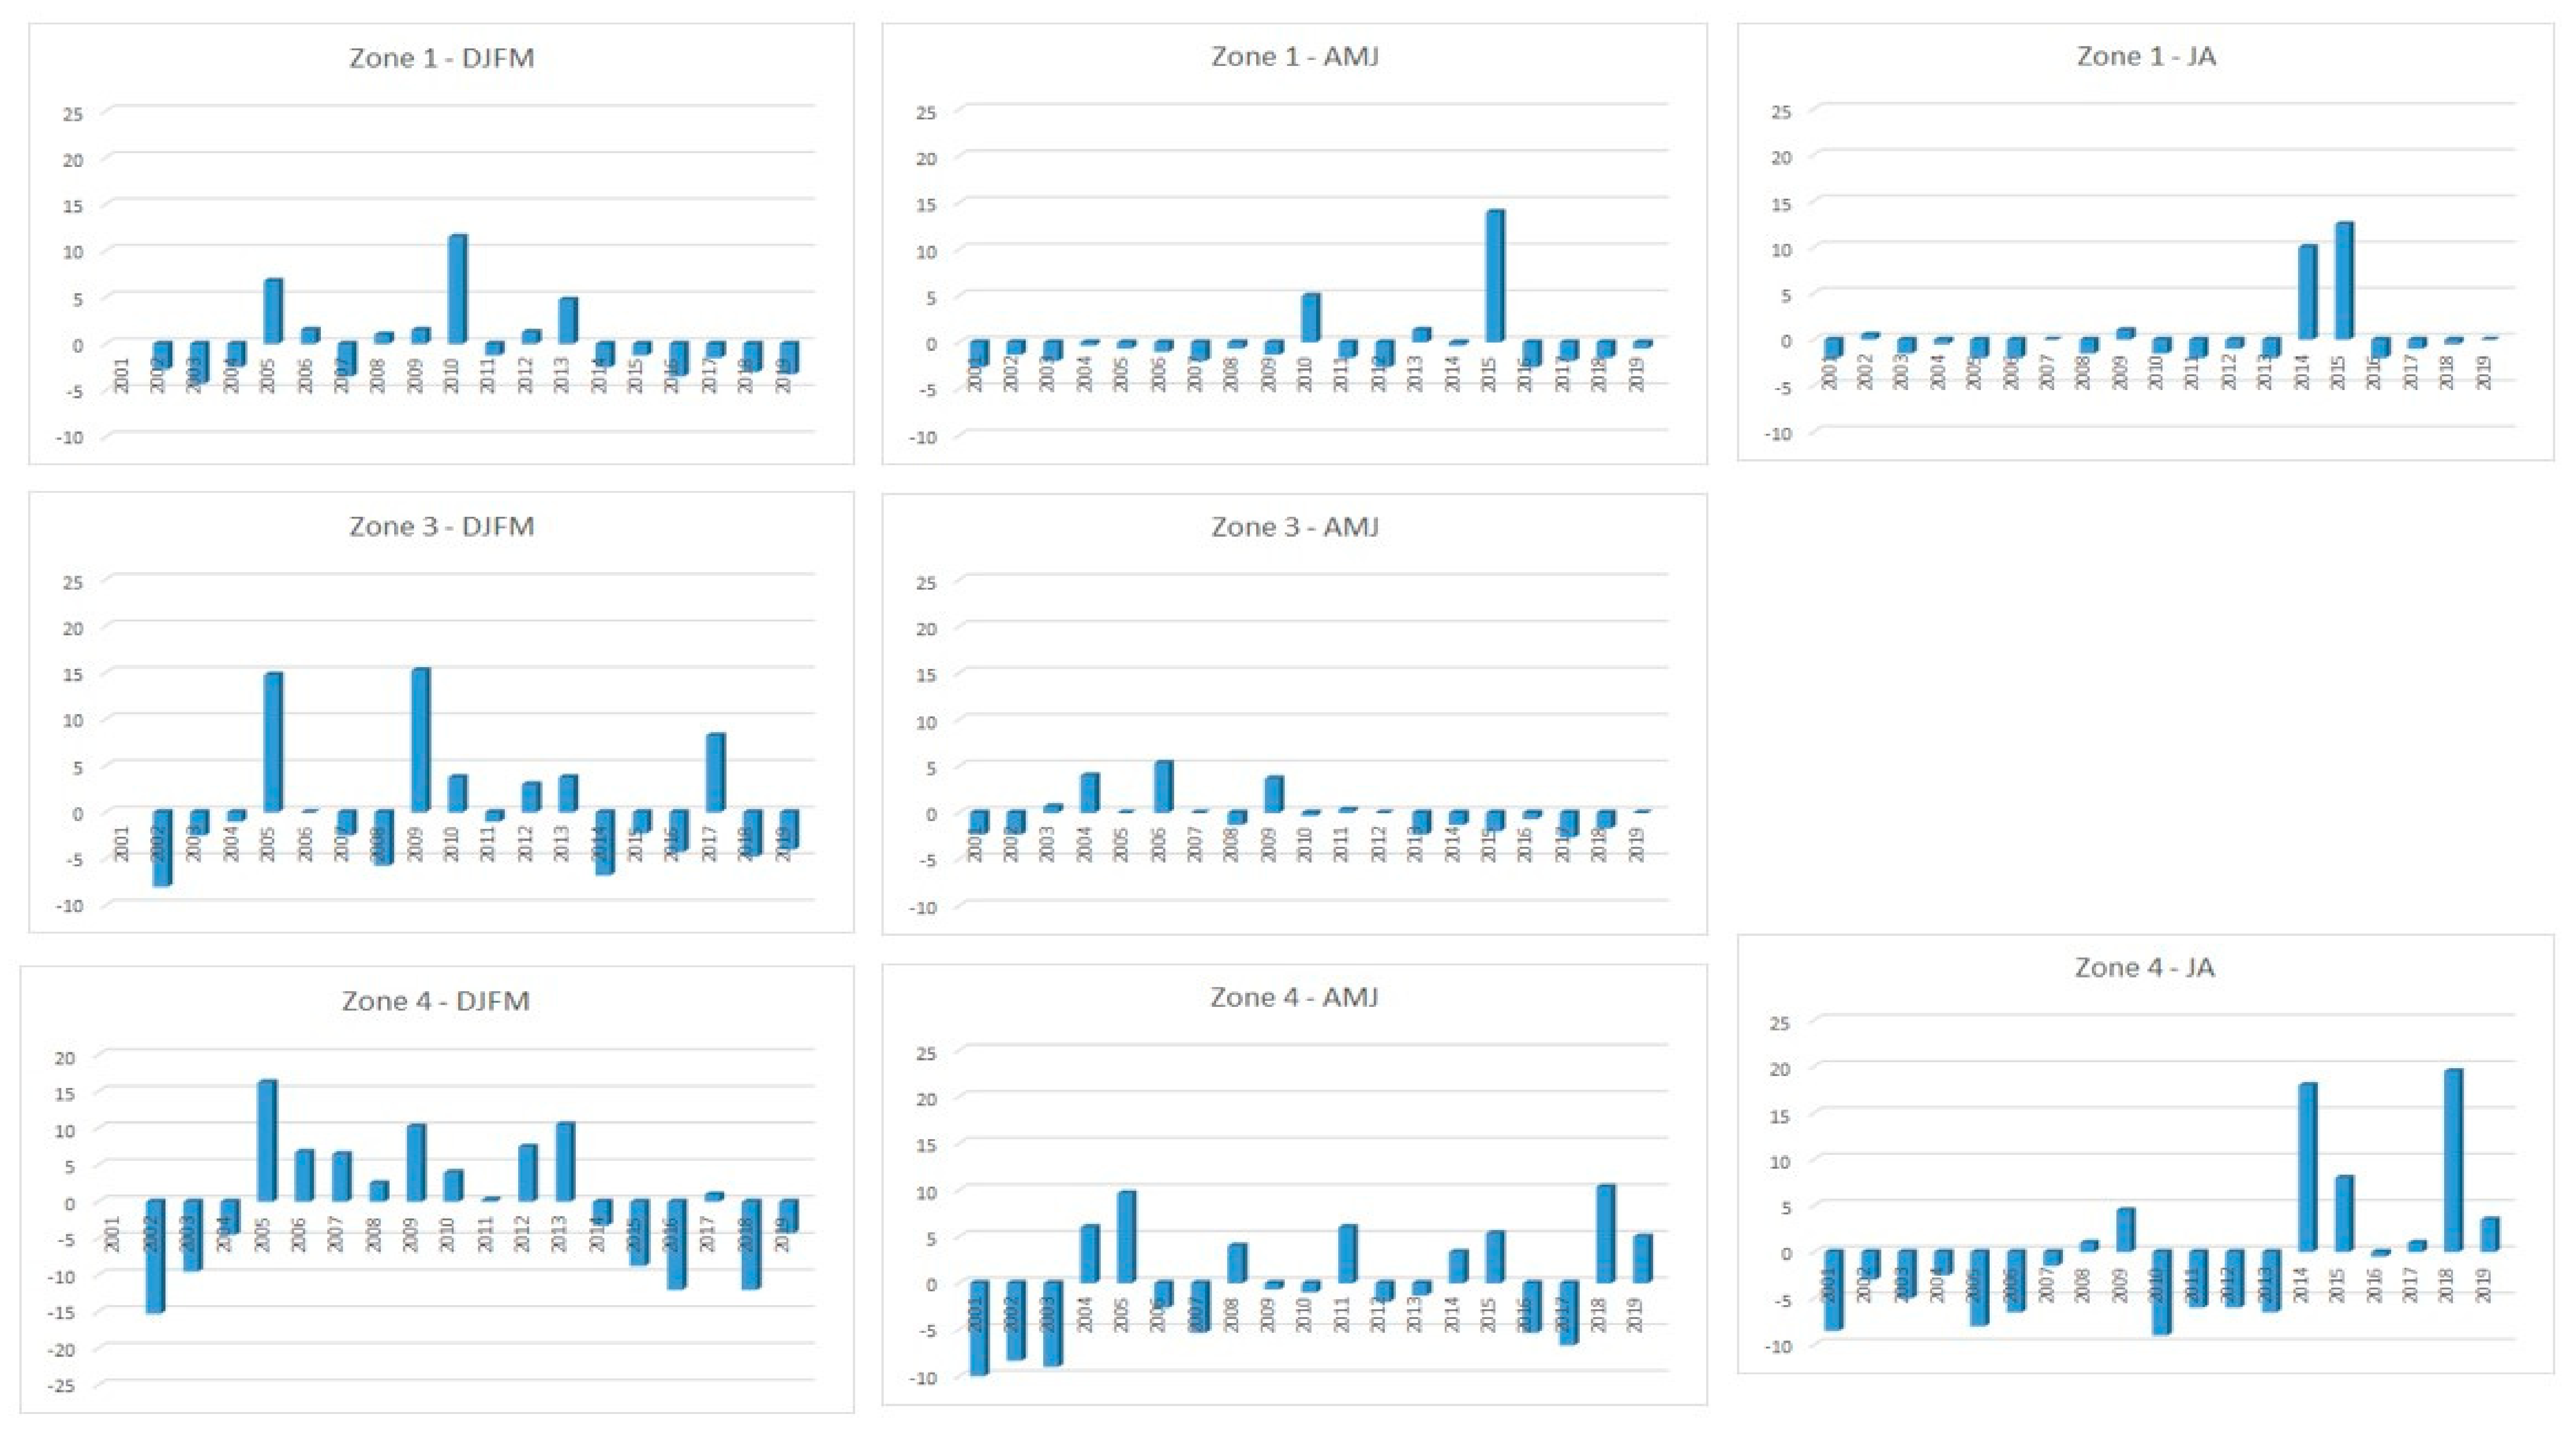
| Periods | Trend in Monthly Mean (per year) | R2 |
|---|---|---|
| Annual | 0.3 | 0.06 |
| DJFM | −0.6 | 0.02 |
| AMJ | 0.4 | 0.09 |
| JA | 0.9 | 0.30 |
| SON | 0.1 | 0.09 |
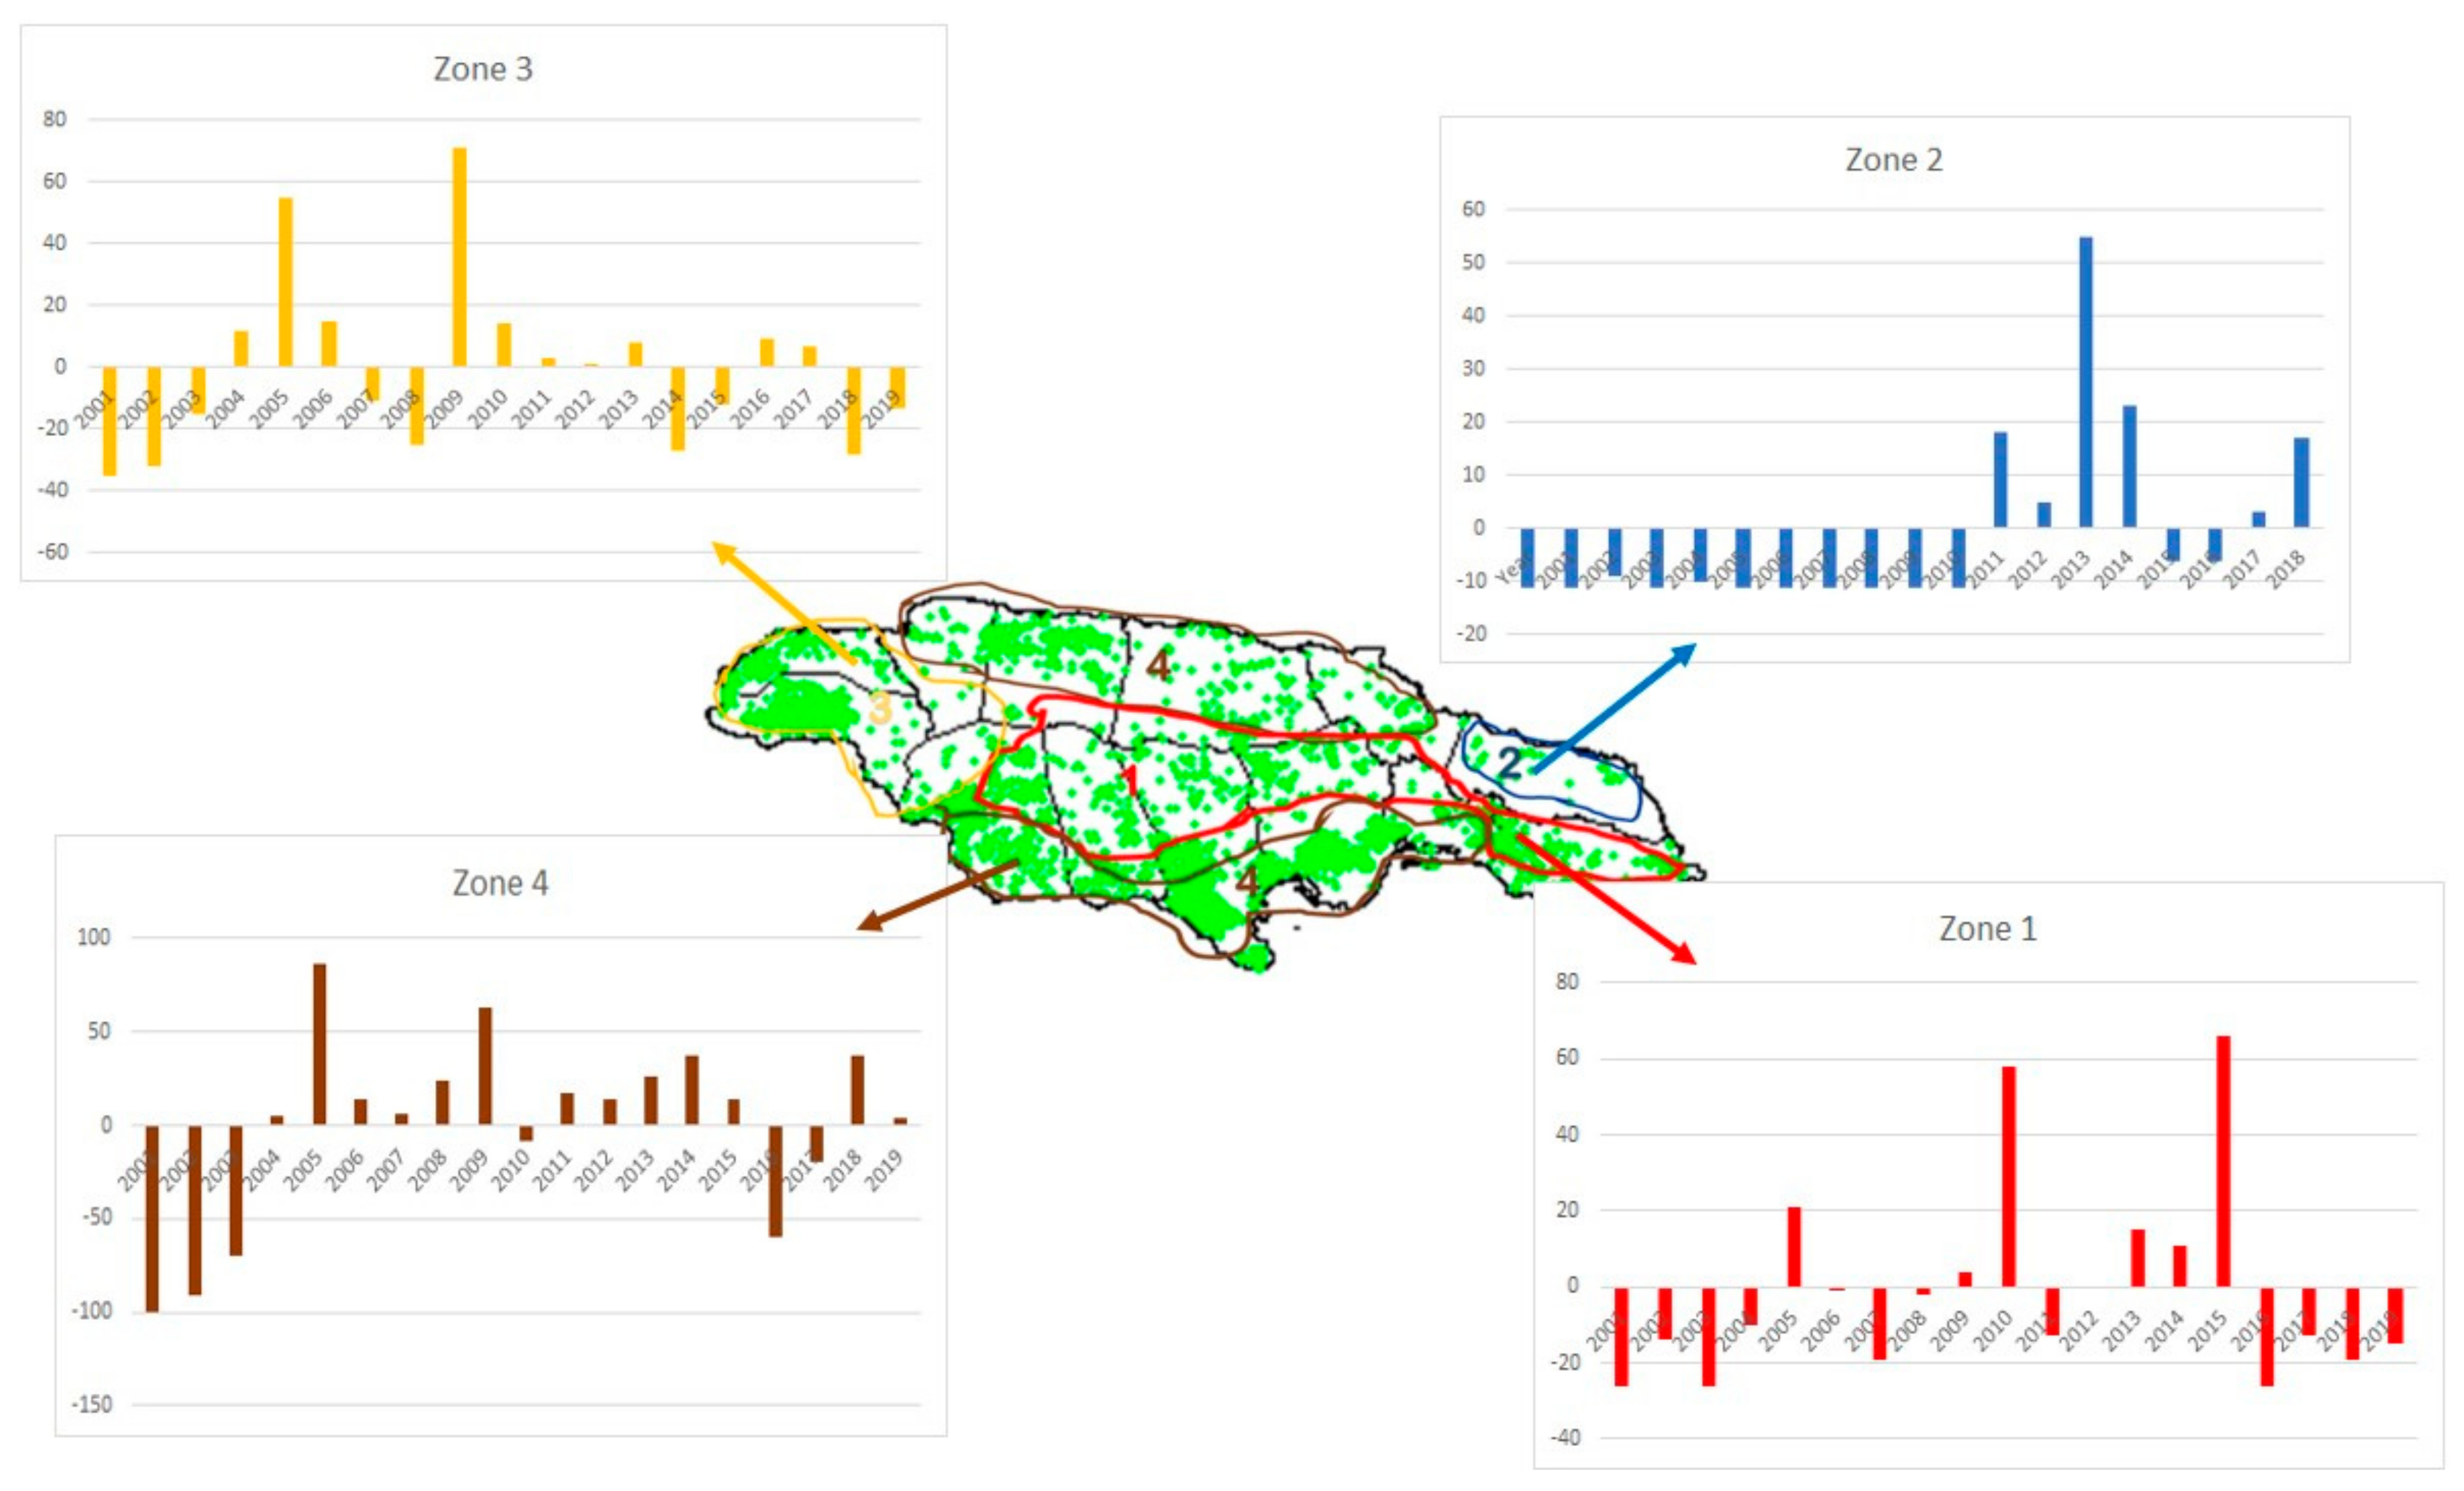
| Zones | Location | Trend in Monthly Mean (per year) | R2 |
|---|---|---|---|
| 1 | Interior | 0.6 | 0.03 |
| 2 | East | 0.1 | 0.29 |
| 3 | West | 0 | 0 |
| 4 | North and South | 0.2 | 0.11 |
| Annual | DJFM | AMJ | JA | SON | ||||||
|---|---|---|---|---|---|---|---|---|---|---|
| Lag-0 | Lag-1 | Lag-0 | Lag-1 | Lag-0 | Lag-1 | Lag-0 | Lag-1 | Lag-0 | Lag-1 | |
| Rainfall | −0.05 | 0.16 | −0.27 | 0.19 | −0.08 | 0.12 | −0.43 | −0.48 | −0.52 | −0.38 |
| Temp | 0.01 | −0.44 | −0.45 | 0.57 | 0.04 | −0.27 | 0.54 | 0.49 | 0.43 | 0.31 |
| Rainfall-f | 0.34 | 0.53 | 0.14 | −0.34 | −0.04 | 0.32 | −0.64 | −0.55 | −0.58 | −0.49 |
| NAO | −0.15 | −0.15 | −0.45 | −0.29 | −0.02 | 0.03 | −0.52 | 0.34 | 0.41 | 0.17 |
| TNA | 0.25 | 0.13 | 0.47 | 0.19 | 0.14 | 0.00 | −0.59 | −0.18 | −0.41 | −0.04 |
| Nino3 | 0.10 | −0.21 | −0.34 | −0.14 | 0.35 | −0.23 | 0.57 | −0.12 | 0.69 | −0.13 |
| TNA-Nino3 | 0.01 | −0.22 | 0.45 | 0.19 | −0.22 | 0.19 | 0.68 | −0.03 | 0.72 | 0.09 |
| TSA | −0.10 | −0.03 | 0.08 | −0.20 | 0.04 | 0.11 | 0.10 | 0.01 | −0.27 | −0.02 |
| LLW | 0.20 | 0.33 | 0.47 | 0.44 | 0.09 | 0.14 | −0.66 | −0.33 | −0.54 | −0.02 |
| PDO-f | −0.30 | −0.33 | −0.50 | −0.47 | −0.16 | −0.17 | 0.45 | 0.37 | 0.32 | −0.20 |
| AMO-f | 0.63 | 0.47 | 0.39 | 0.35 | 0.50 | 0.30 | 0.22 | 0.22 | 0.20 | 0.18 |
| NAO-f | −0.39 | −0.41 | −0.32 | −0.47 | −0.36 | −0.27 | 0.08 | 0.25 | 0.27 | 0.16 |
| All Island | Zone 1 | Zone 2 | Zone 3 | Zone 4 | |
|---|---|---|---|---|---|
| NAO | −0.15 | −0.31 | 0.18 | −0.32 | 0.05 |
| TNA | 0.25 | 0.45 | −0.36 | 0.43 | 0.05 |
| Nino | 0.10 | 0.32 | 0.39 | −0.01 | −0.05 |
| TNA-Nino3 | 0.01 | −0.10 | −0.46 | 0.17 | 0.06 |
| TSA | −0.10 | −0.01 | −0.16 | −0.01 | −0.14 |
| LLW | 0.20 | 0.12 | −0.47 | 0.34 | 0.16 |
| PDO-f | −0.30 | −0.05 | 0.36 | −0.26 | −0.34 |
| AMO-f | 0.63 | 0.33 | 0.17 | 0.47 | 0.66 |
| NAO-f | −0.39 | −0.06 | 0.11 | −0.27 | −0.46 |
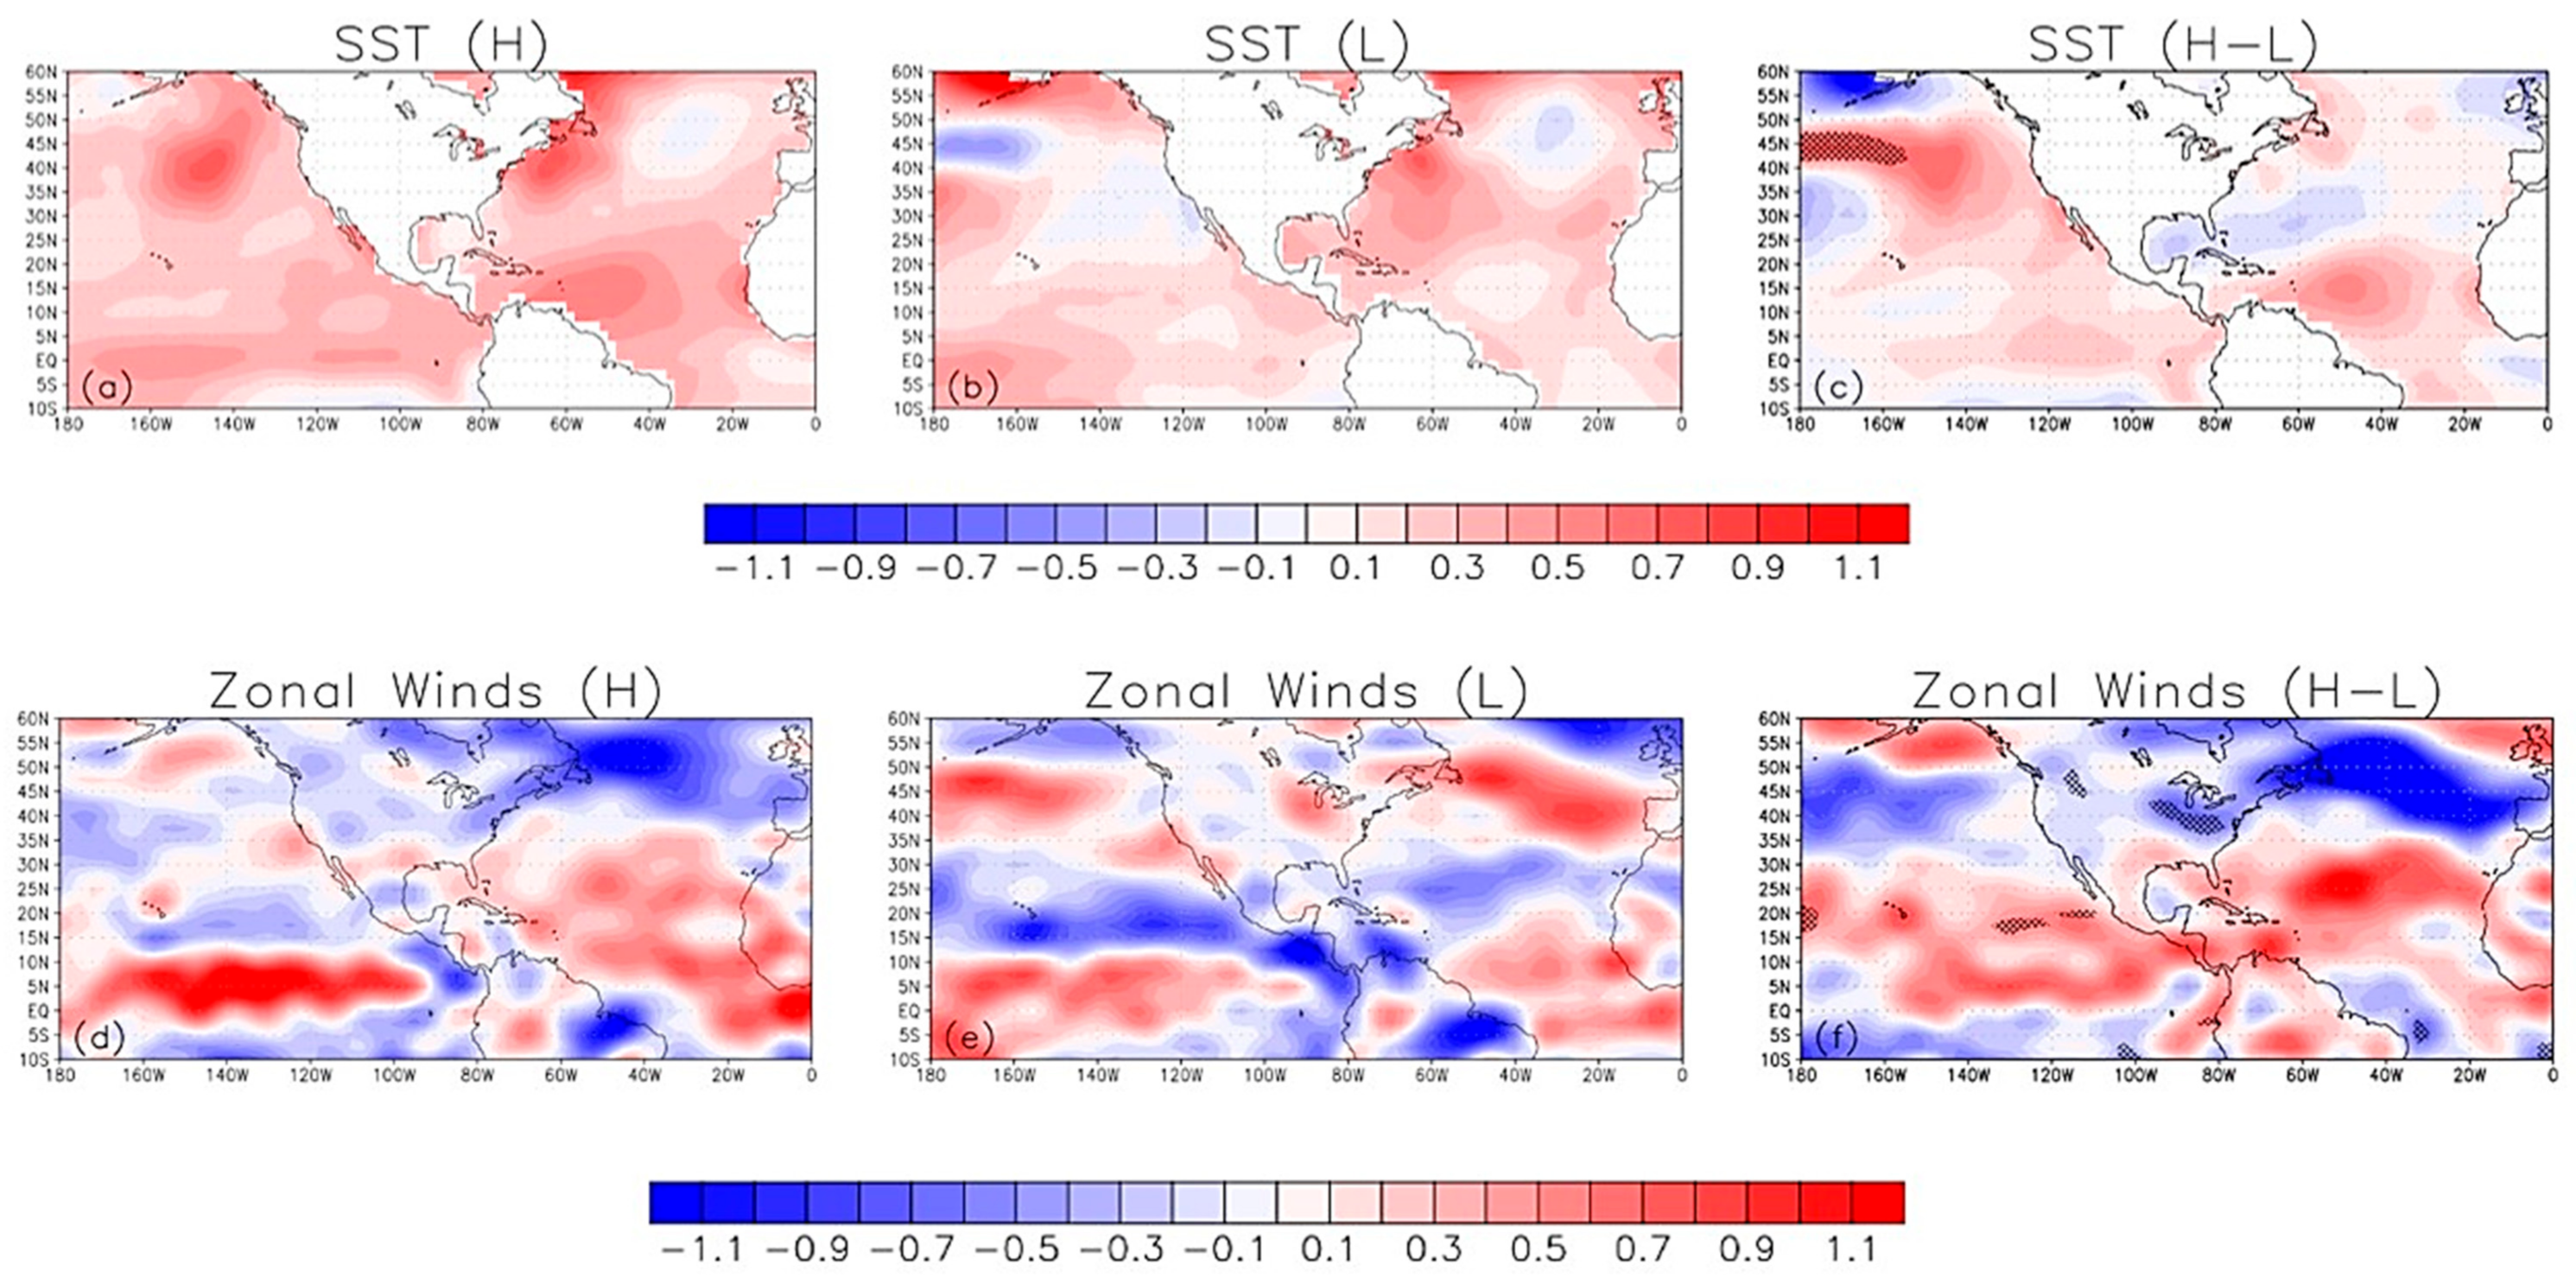
| Events | High Fire Years | Low Fire Years |
|---|---|---|
| El Niño | 2006–2007, 2009–2010, 2015–2016 | 2002–2003 |
| La Niña | 2010–2012 | 2001, 2007–2008, 2008–2009 |
| Neutral | 2005 | 2004 |
Publisher’s Note: MDPI stays neutral with regard to jurisdictional claims in published maps and institutional affiliations. |
© 2021 by the authors. Licensee MDPI, Basel, Switzerland. This article is an open access article distributed under the terms and conditions of the Creative Commons Attribution (CC BY) license (http://creativecommons.org/licenses/by/4.0/).
Share and Cite
Charlton, C.S.; Stephenson, T.S.; Taylor, M.A.; Douglas, C.A. Characterizing Bushfire Occurrences over Jamaica Using the MODIS C6 Fire Archive 2001–2019. Atmosphere 2021, 12, 390. https://doi.org/10.3390/atmos12030390
Charlton CS, Stephenson TS, Taylor MA, Douglas CA. Characterizing Bushfire Occurrences over Jamaica Using the MODIS C6 Fire Archive 2001–2019. Atmosphere. 2021; 12(3):390. https://doi.org/10.3390/atmos12030390
Chicago/Turabian StyleCharlton, Candice S., Tannecia S. Stephenson, Michael A. Taylor, and Christina A. Douglas. 2021. "Characterizing Bushfire Occurrences over Jamaica Using the MODIS C6 Fire Archive 2001–2019" Atmosphere 12, no. 3: 390. https://doi.org/10.3390/atmos12030390