Article

Asymmetric Effect of El Niño—Southern Oscillation on the Spring Precipitation over South China

1
College of Intelligent Science and Control Engineering, Jingling Institute of Technology, Nanjing 210000, China
2
College of Oceanography/Key Laboratory of Marine Hazards Forecasting, Ministry of Natural Resources/Key Laboratory of Ministry of Education for Coastal Disaster and Protection, Hohai University, Nanjing 210098, China
3
State Key Laboratory of Loess and Quaternary Geology, Institute of Earth Environment, Chinese Academy of Sciencess, Xi’an 710000, China
4
Southern Marine Science and Engineering Guangdong Laboratory (Zhuhai), Zhuhai 519082, China
5
School of Atmospheric Sciences, and Guangdong Province Key Laboratory for Climate Change and Natural Disaster Studies, Sun Yat-sen University, Zhuhai 519082, China
6
Jiangsu Meteorological Observatory, Nanjing 210000, China
7
School of Atmospheric Sciences, Nanjing University of Information Science and Technology, Nanjing 210000, China
*
Author to whom correspondence should be addressed.
Atmosphere 2021, 12(3), 391; https://doi.org/10.3390/atmos12030391
Submission received: 3 February 2021 / Revised: 13 March 2021 / Accepted: 14 March 2021 / Published: 17 March 2021
(This article belongs to the Special Issue ENSO Prediction)

Abstract

:
South China is one of the most densely populated and agriculture-based regions in China. Local spring precipitation is crucial to the people’s livelihood and social economic development. Using the observed and reanalysis datasets for the period 1958–2019, this study revealed an asymmetric effect of El Niño—Southern Oscillation (ENSO) on the following spring precipitation over South China. During the years with positive ENSO phases, a strong positive correlation between spring precipitation and the preceding winter ENSO sea surface temperature (SST) anomalies existed over Guangdong province. For the years with negative ENSO phases, such a strong positive correlation shifts westwards to Guangxi province. To be specific, the El Niño events usually result in a precipitation surplus in the decaying spring over Guangdong province, while the La Niña events usually lead to a precipitation deficit in the decaying spring over Guangxi province. This is attributed to the nonlinear effects of ENSO on the atmospheric circulation. Compared with El Niño, the abnormal center of La Niña evidently extends westwards, inducing a westward movement of the anomalous low-level atmospheric circulation, which eventually results in a westward-shifted effect on the following spring precipitation over South China. Our findings emphasize the nonlinear responses of spring precipitation over South China to ENSO. This has important implications for the seasonal climate predictions over South China.

1. Introduction

South China is one of the most densely populated and developed regions in China. It is located in a conjoining zone between the northwestern Pacific and East Asian monsoon regions, and suffers from drought and flood disasters [1,2,3]. Spring is the first rainy season over South China [4], and spring precipitation contributes more than 30% of the total annual precipitation over this region [5,6]. The South China spring precipitation exists with a large interannual variability, usually leading to severe droughts and floods [7,8,9]. Thus, studying the causes of the local spring precipitation anomaly is vitally important for the people’s livelihood and socio-economy in South China.
It is well known that the El Niño—Southern Oscillation (ENSO) is one of the most important drivers of natural interannual climate variability [10]. It not only exerts a great influence on the tropical marine environment and weather/climate states, but also affects the global climate, and even leads to variations in extreme weather events globally [11,12,13,14,15,16]. Therefore, as the most important climatic phenomenon in the tropical Pacific, ENSO has attracted lots of attention from scholars [17,18]. In particular, El Niño is an oceanic warming phenomenon over the tropical eastern Pacific Ocean. On the contrary, the oceanic cooling phenomenon over the tropical eastern Pacific Ocean is La Niña. The ENSO sea surface temperature (SST) anomalies can lead to complex precipitation anomaly patterns [19,20,21,22,23]. For example, when an El Niño event occurs, the abnormally warmer SST over the tropical eastern Pacific enhances the local convective activities and precipitation, while there is less precipitation over the maritime continent and tropical western Pacific [24,25,26,27].
For South China, the local precipitation is also evidently affected by ENSO [20,28,29]. During the decaying phase of El Niño, there obviously exists an anomalous low-level anticyclone over the western North Pacific, which usually results in an abnormally stronger southwesterly wind over South China. This would bring excessive moisture, favoring local precipitation [30,31]. Some previous studies have documented that such an anomalous anticyclone is associated with the abnormally colder SST over the western North Pacific, as a Rossby wave response to ENSO [20].
The ENSO-induced climatic variations are sensitive to the spatial structure and strength of the SST anomaly center. Owing to the nonlinearities existing in the climate system, the El Niño and La Niña events are not completely opposite, but exhibit evident asymmetries [32]. Normally, the SST anomalies of El Niño are stronger than those of La Niña [33]. In addition, compared with El Niño, the abnormal SST center during the mature phase of La Niña is more westward [34]. There is even an evident asymmetry in their duration: El Niño tends to decay rapidly by the following summer after its mature phase, while the La Niña SST anomalies usually persist much longer [35]. The asymmetries also exist in the climatic responses to ENSO [36,37,38]. For instance, Li et al. [39] recently explored precipitation anomalies over the Indo-China Peninsula associated with ENSO and found that La Niña exerts a larger effect on the decaying spring precipitation than El Niño does over this region. Therefore, the nonlinearities in ENSO and its asymmetric effects bring great challenges for regional climate predictions.
South China mainly includes Guangdong and Guangxi provinces, which are located over the east and west parts over the southern coastal area of China, respectively. The agriculture of those two provinces has a strong dependence on the change in spring precipitation. In the present study, we aim to investigate the asymmetric effects of ENSO on the decaying spring precipitation over South China. The results show that El Niño has significant impacts on spring precipitation over Guangdong province, while the spring precipitation over Guangxi province is evidently affected by La Niña. This is mainly due to the westward shift of the La Niña SST anomalies in comparison with El Niño, which results in a westward movement of the abnormal low-level atmospheric circulation. Although Guangdong and Guangxi are two neighboring provinces, such different climate responses to ENSO are of vital importance to local social and economic developments. The rest of this paper is arranged as follows. Section 2 introduces the data and methods. Section 3 presents the spring precipitation over eastern China and its related atmospheric background. Section 4 presents the asymmetries between the positive and negative ENSO phases. Section 5 illustrates the asymmetric responses of atmospheric circulation. Section 6 confirms an asymmetric relationship between the South China spring precipitation and ENSO. Section 7 is the summary with discussions.

2. Data and Methods

In the current study, we utilized a 0.5° × 0.5° ground-based observational monthly precipitation dataset from the Climatic Research Unit at the University of East Anglia (https://crudata.uea.ac.uk/cru/data/hrg/cru_ts_4.04/, accessed on 15 March 2021). The 1.0° × 1.0° monthly SST dataset is from the Hadley Center Sea Ice and SST dataset (https://www.metoffice.gov.uk/hadobs/hadisst/data/download.html, accessed on 15 March 2021). The Japan Meteorological Agency provides the Japanese 55-year reanalysis dataset, which includes 1.25° × 1.25° atmospheric fields, such as the wind velocity and humidity (https://jra.kishou.go.jp/JRA-55/index_en.html, accessed on 15 March 2021). To denote the ENSO phase and intensity in the mature winter, we employed the Oceanic Niño Index (ONI) from the Climate Prediction Center of the United States (http://origin.cpc.ncep.noaa.gov/products/analysis_monitoring/ensostuff/ONI_v5.php, accessed on 15 March 2021).
The air moisture flux (Q) is vertically integrated from the surface (1000 hPa) to the upper level (300 hPa), which is based on the following equation:
Q = 1 g 300 1000 q V d P
where g, q, V , and P are the gravitational acceleration, the specific humidity, the horizontal wind velocity, and the atmospheric pressure, respectively.
This study mainly adopts the correlation and composite analyses, and covers the period 1958–2019 due to the limitation of all datasets.
The Pearson correlation coefficient is a statistical index of the linear relationship between two meteorological variables. With two variables, x i and y i (i = 1, 2, …, n), their correlation coefficient (r) can be expressed as:
r = i = 1 n ( x i x ¯ ) ( y i y ¯ ) i = 1 n ( x i x ¯ ) 2 i = 1 n ( y i y ¯ ) 2
where x ¯ and y ¯ are the averages of x i and y i , and r is between −1.0 and ~1.0. If r is close to 1.0 or −1.0, it would indicate that the variables are positively or negatively linearly related. When r is equal to 0, it indicates that the two variables are independent of each other.
For the composite analysis, we selected the 10 strongest El Niño events and the 10 strongest La Niña events based on the ONI, and Table 1 illustrates their decaying years. The composite anomalies for the variables are calculated by the deviations apart from the climatology of 62-year mean states. To avoid the possible influence of climate change, such as global warming, the long-term trends of all data were removed in the statistical calculations.
The selection of the decaying years was based on the preceding winter ONI. For example, 1958 is based on the mean ONI during the period from December 1957 to February 1958.

3. Spring Precipitation over Eastern China and the ENSO Effects on Atmospheric Circulation

Figure 1a shows the multi-year averaged precipitation in spring (March, April, and May) over eastern China. Before the monsoon season, spring precipitation exhibits an evident meridional gradient: it rapidly decreases from the south to the north. In particular, over the southeastern coastal area, the total spring precipitation even reaches about 600 mm. Meanwhile, the interannual variability of spring precipitation there is also relatively larger (Figure 1b), which reaches about 100–160 mm. In general, the interannual variations in spring precipitation contribute more than 20% of the total spring precipitation over South China (Figure 1c). Considering that South China is densely populated and largely dependent on agriculture, such a strong variability in spring precipitation is worthy of attention. Generally speaking, precipitation anomalies are mainly attributed to atmospheric circulation variations [1,2,3,4]. As shown in Figure 1d, the water source of spring precipitation over the southern part of China is mainly due to the moisture transport associated with the southwesterly wind. Over South China, there is a convergence center of water vapor, forming a relatively larger local spring precipitation. This is easily affected by low-level atmospheric circulation changes, leading to precipitation anomalies [30].
As mentioned above, ENSO is one of the most important climatic driving factors, and evidently affects the atmospheric circulation, especially over a tropical area [10,11,20,40]. Figure 2 demonstrates the correlation distribution of high- and low-level atmospheric circulation in the decaying spring with the preceding winter ONI. At the 200 hPa level, the velocity potential exists for strong negative and positive correlations over the tropical eastern and western Pacific, respectively (Figure 2a). Accordingly, the high-level wind diverges and converges over the eastern and western Pacific, respectively. Under this circumstance, there usually is an abnormal upward motion associated with the abnormally warmer SST over the tropical eastern Pacific in the decaying spring. On the other hand, above the western Pacific, the air features an abnormal downward motion, which is a response of the Walker circulation system to the El Niño events [41,42,43]. The low-level atmospheric circulation is also affected by the anomalous ENSO SST. Over the western North Pacific, coupled with the abnormal descent, an anomalous anticyclone forms at 850 hPa to the southeast of China during the decaying spring (Figure 2b). Theoretically, the low-level circulation anomaly affects the spring water vapor flux. In the decaying spring of El Niño, the enhanced southwesterly wind would transport excessive moisture from the South China Sea to South China, increasing the local precipitation [30]. The whole situation generally turns to be the opposite in the decaying spring of La Niña.

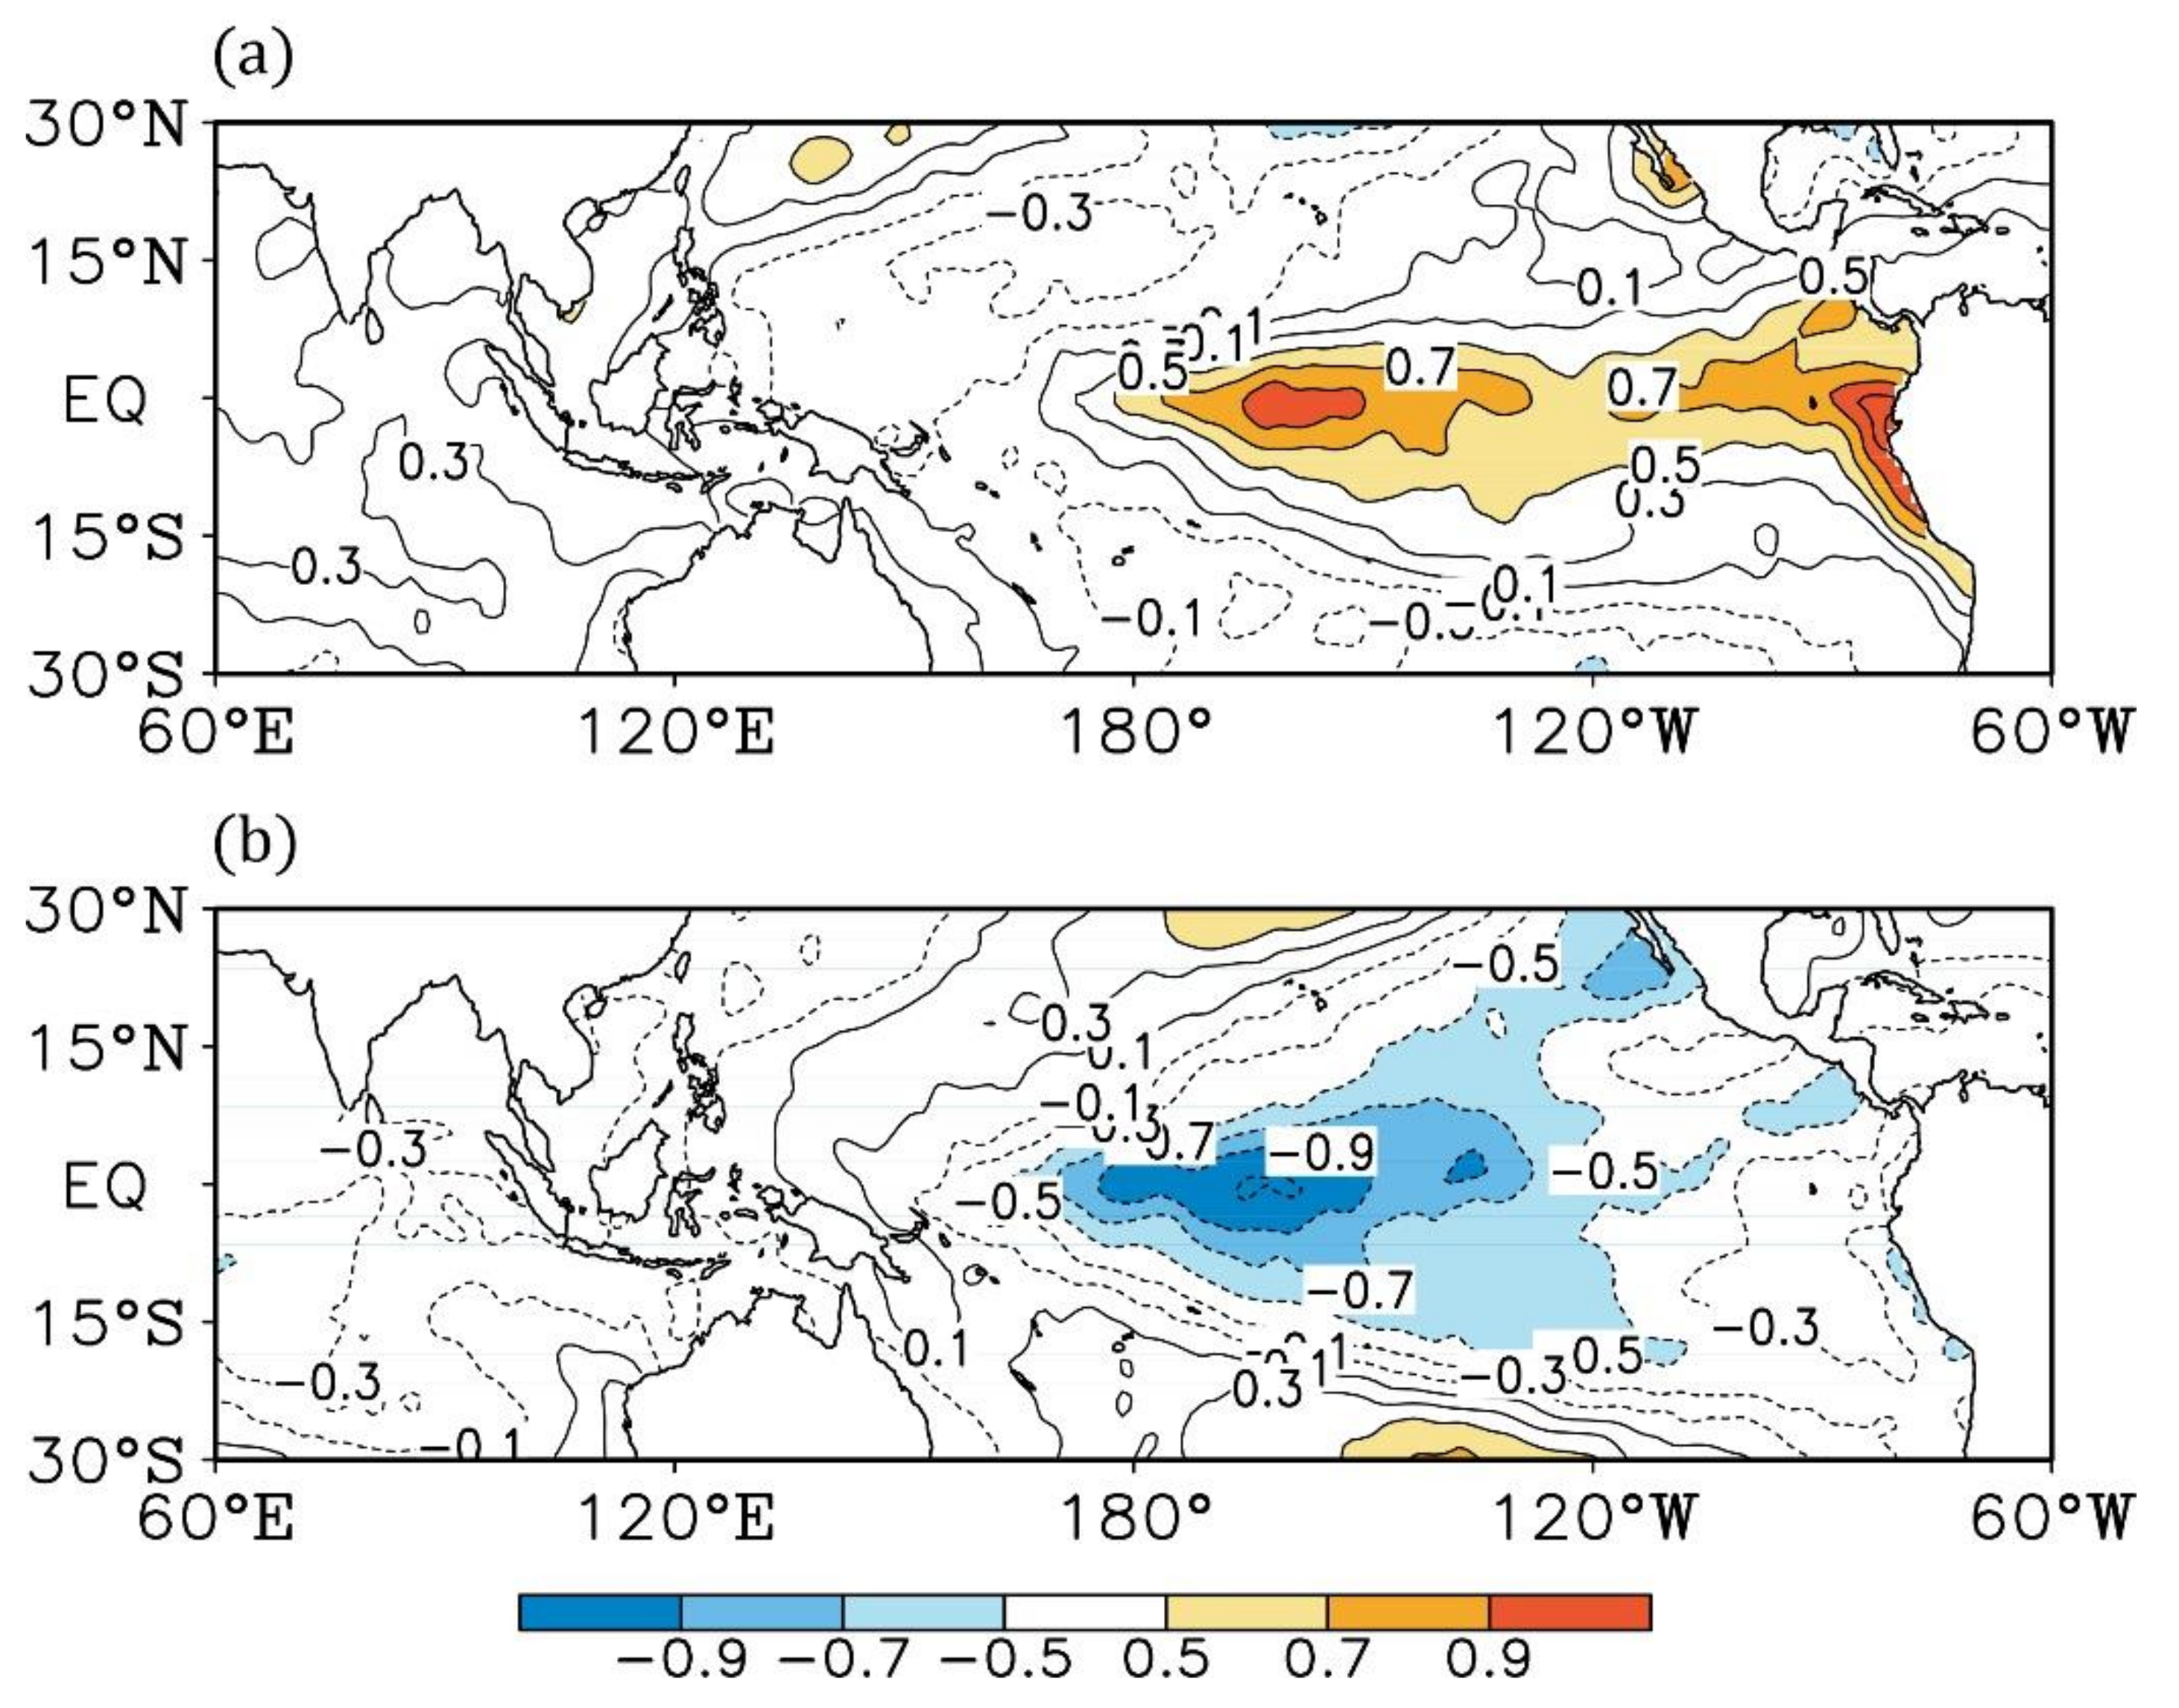
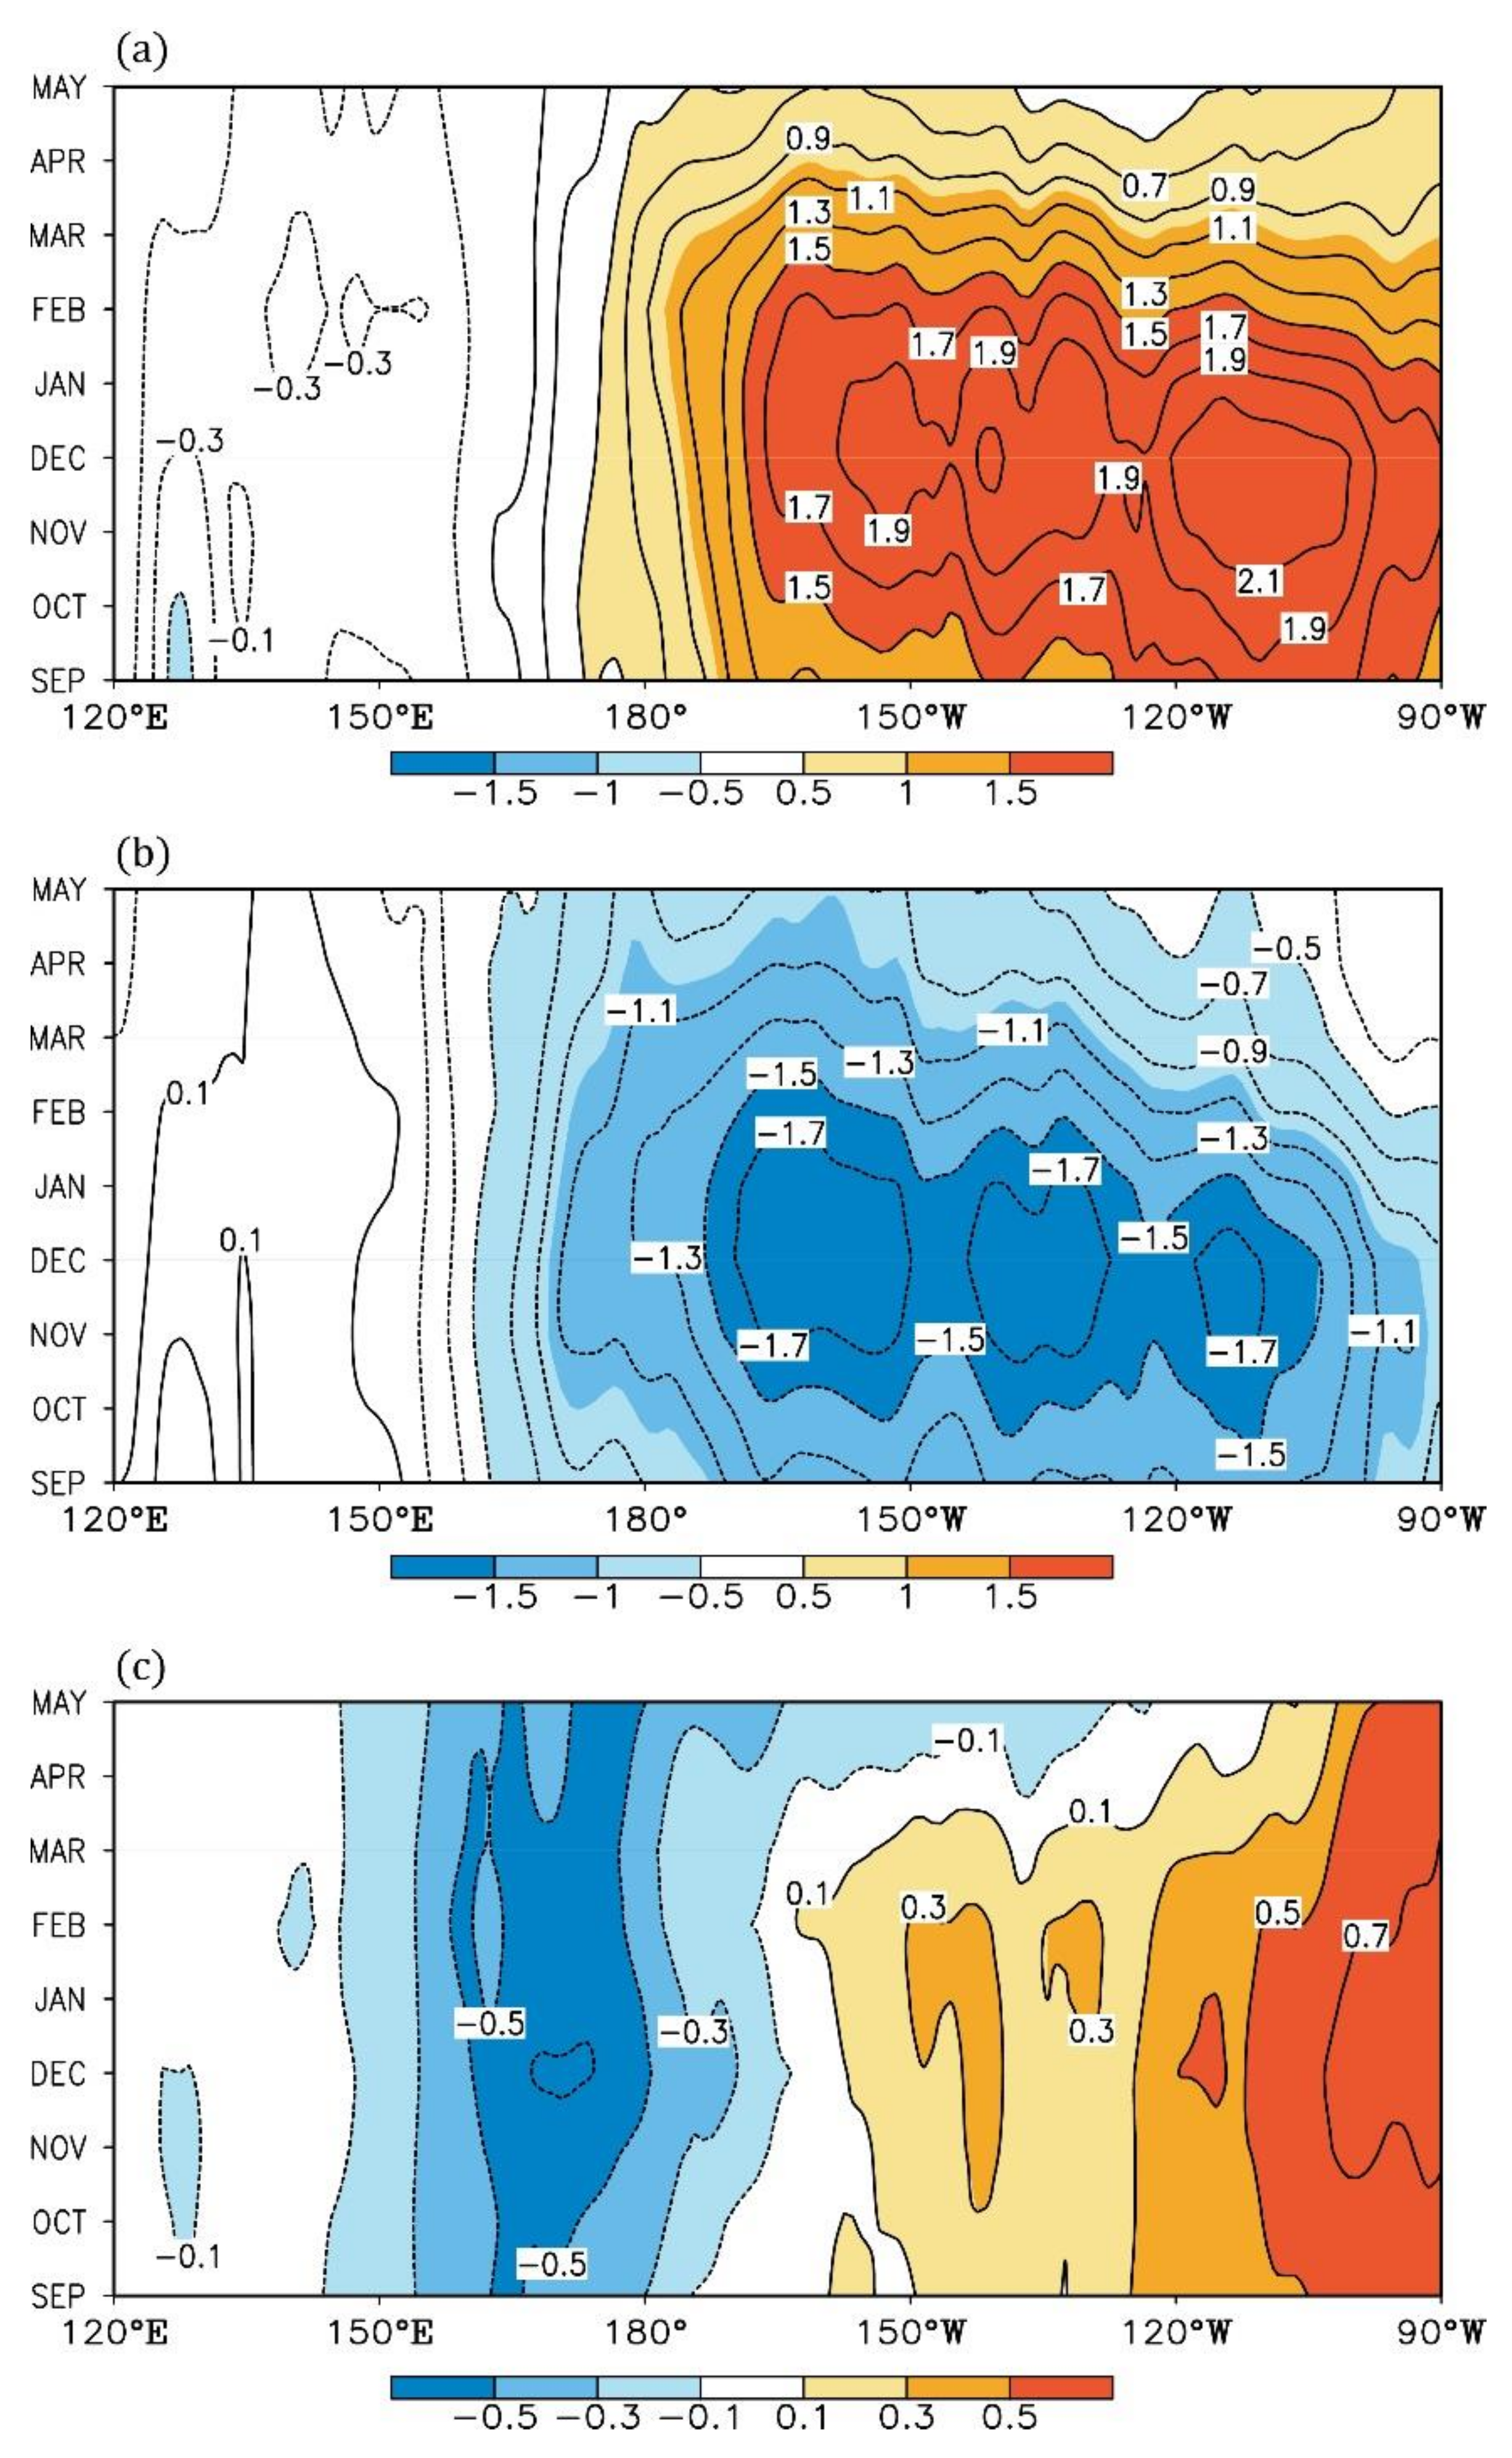
4. Asymmetries of the ENSO SST Anomalies

To further explore the asymmetric effects of ENSO on spring precipitation, we firstly examine the asymmetries in the ENSO pattern during the decaying spring based on the composite analysis (Figure 3). In the El Niño events, the abnormally warmer SST covers the tropical eastern Pacific and extends to the center Pacific (Figure 3a). In contrast, the negative SST anomaly mainly dominates the tropical central Pacific, and even slightly extends to the tropical western Pacific in the La Niña events (Figure 3b). This implies that the ENSO SST anomalies during the decaying spring of La Niña move westwards compared to that of El Niño. This is similar to previous studies focused on the asymmetries in the mature phases (boreal winter) of the El Niño and La Niña events [32,33,34].
In general, the abnormal ENSO SST patterns in the decaying spring maintain their mature phases due to the strong persistence of the SST anomalies. Figure 4 further shows the evolution of SST anomalies along the equator in the Pacific Ocean from the developing autumn to the decaying spring. In the El Niño events, the SST over the equatorial eastern Pacific is abnormally warmer, and the abnormal SST center is generated from the east to the west during the developing autumn to the decaying spring (Figure 4a). On the other hand, the situation in the La Niña events is mainly the opposite: the SST is abnormally colder over the equatorial eastern Pacific (Figure 4b). Meanwhile, we also note that the SST anomalies move westwards in the La Niña events. The summation of the El Niño and La Niña SST anomalies can highlight their nonlinearities [34]. Therefore, Figure 4c shows a relatively warmer and colder SST over the tropical eastern and central Pacific, respectively. This indicates that the SST anomalies in El Niño are relatively stronger over the eastern Pacific, while the ones in La Niña are stronger over the central Pacific from the developing autumn to decaying spring. This indicates a westward shift of the SST anomalies during the La Niña events compared to El Niño.

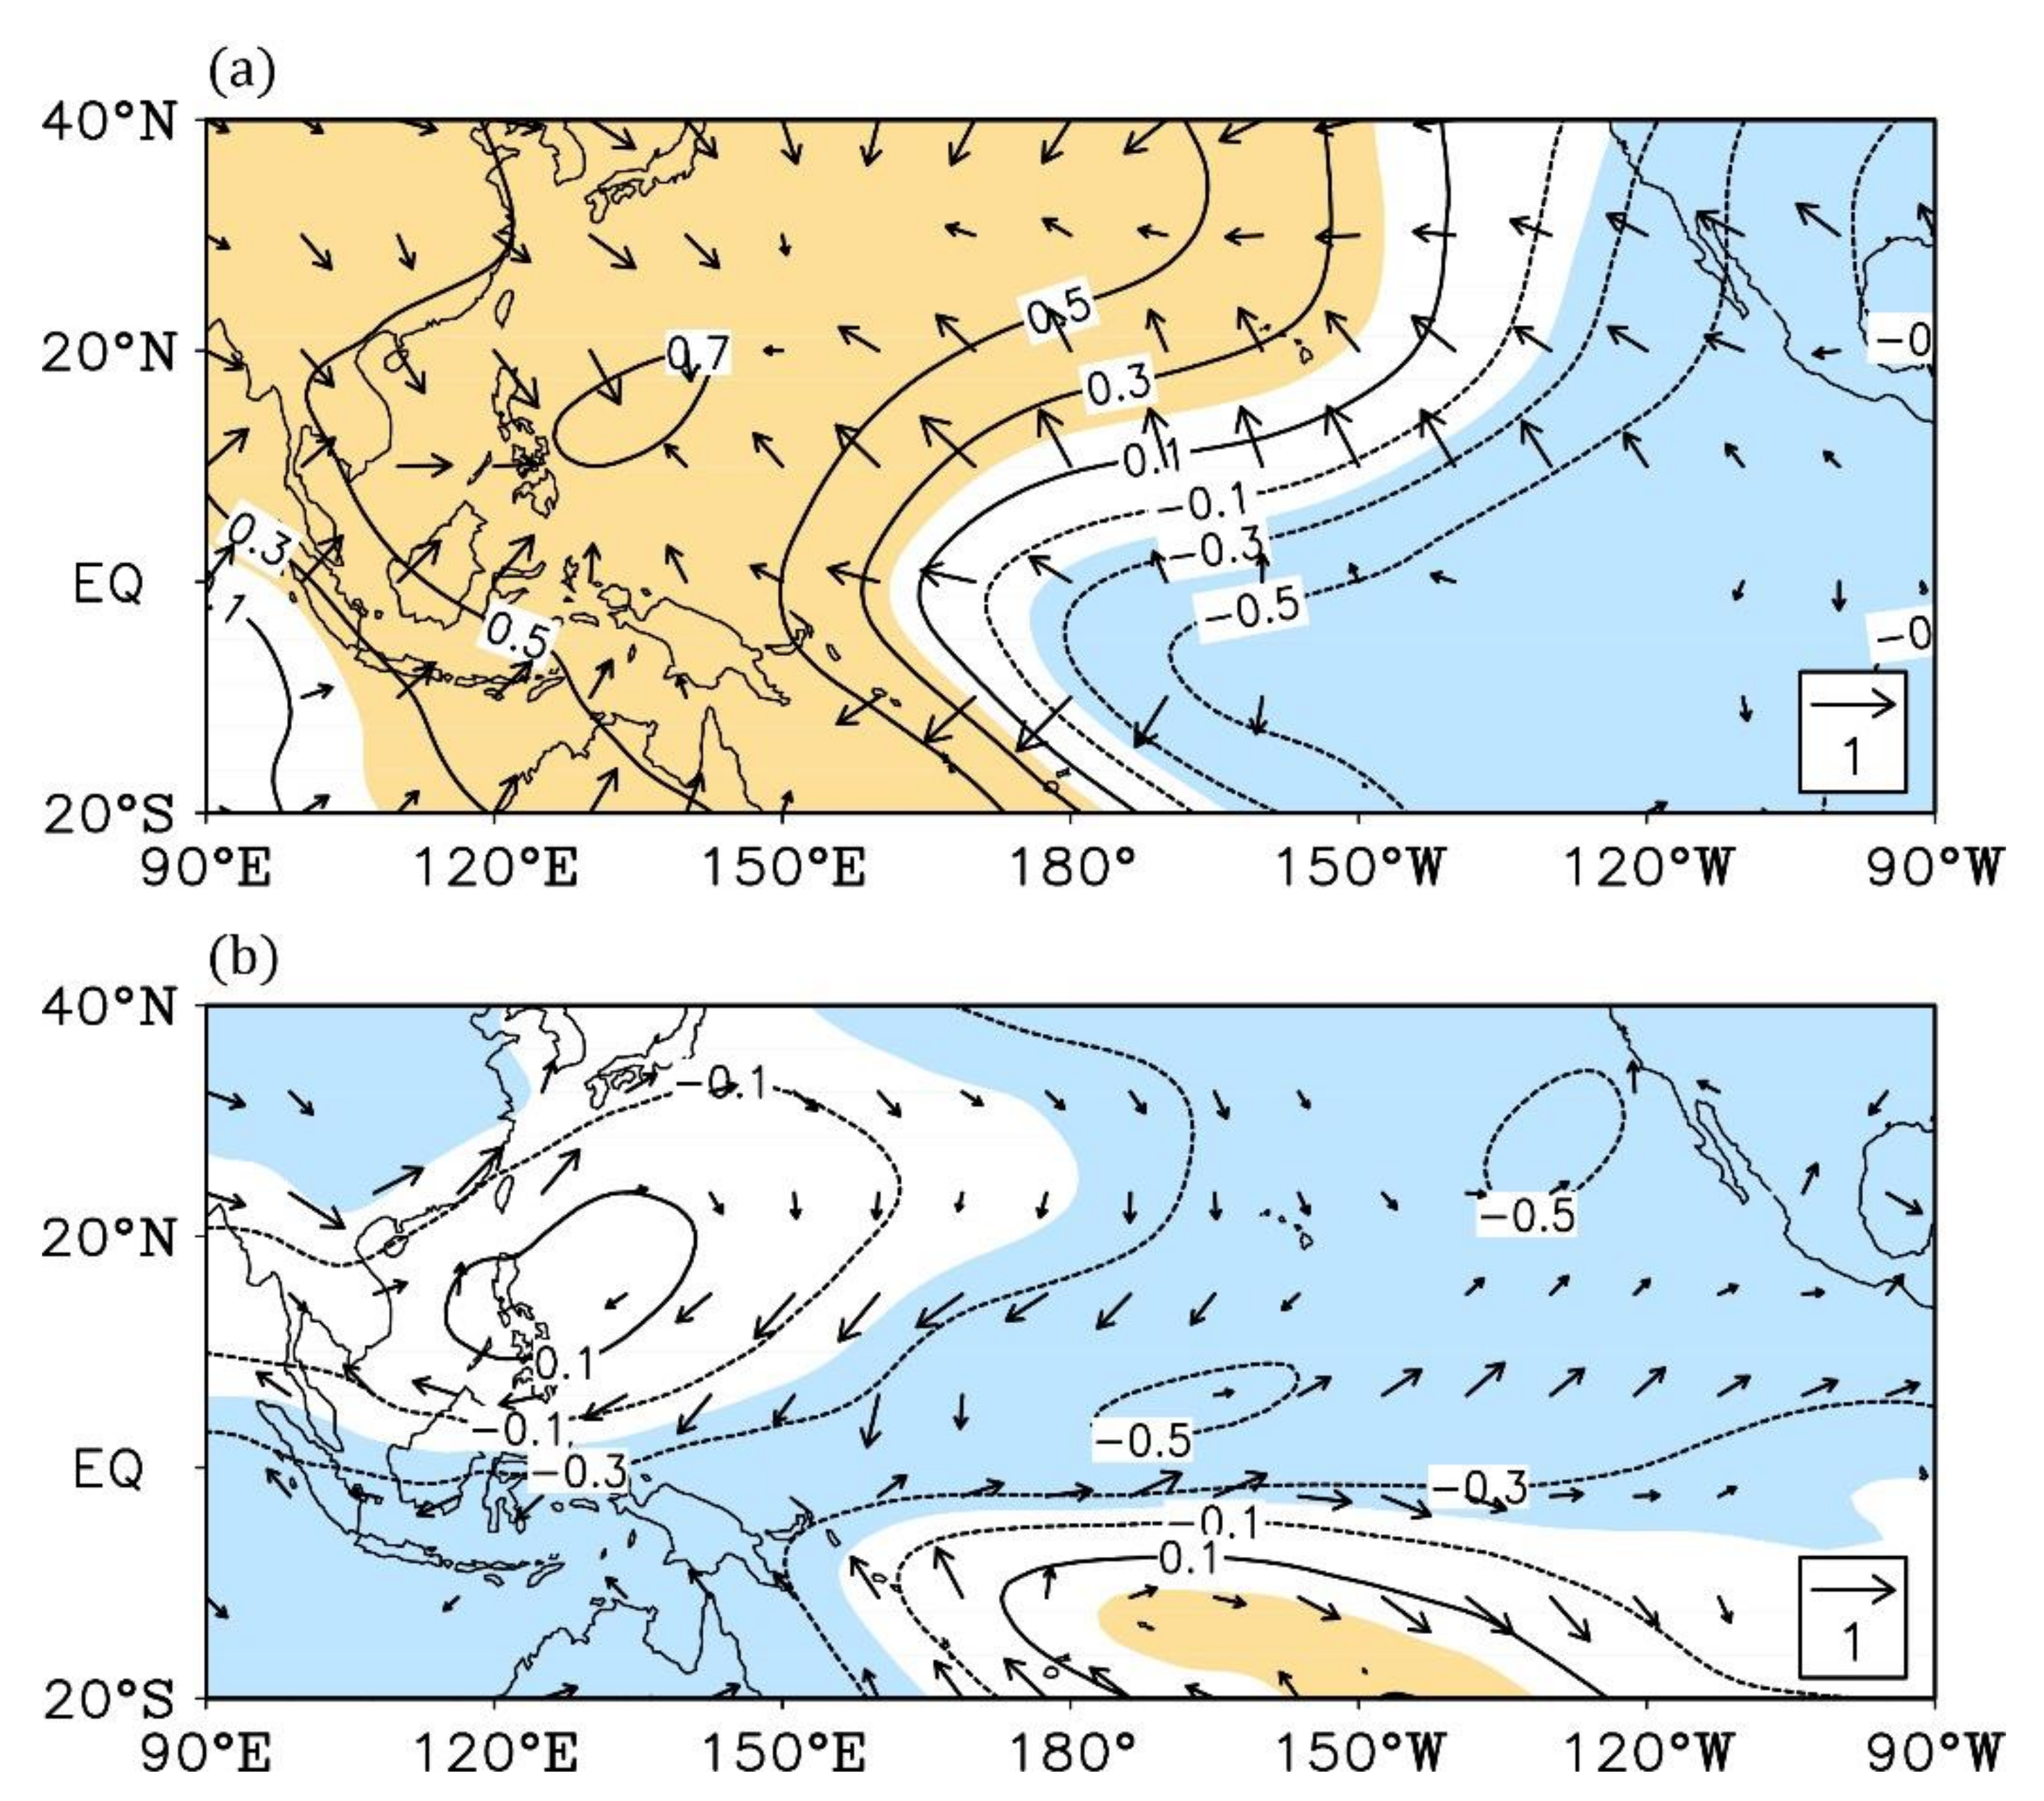
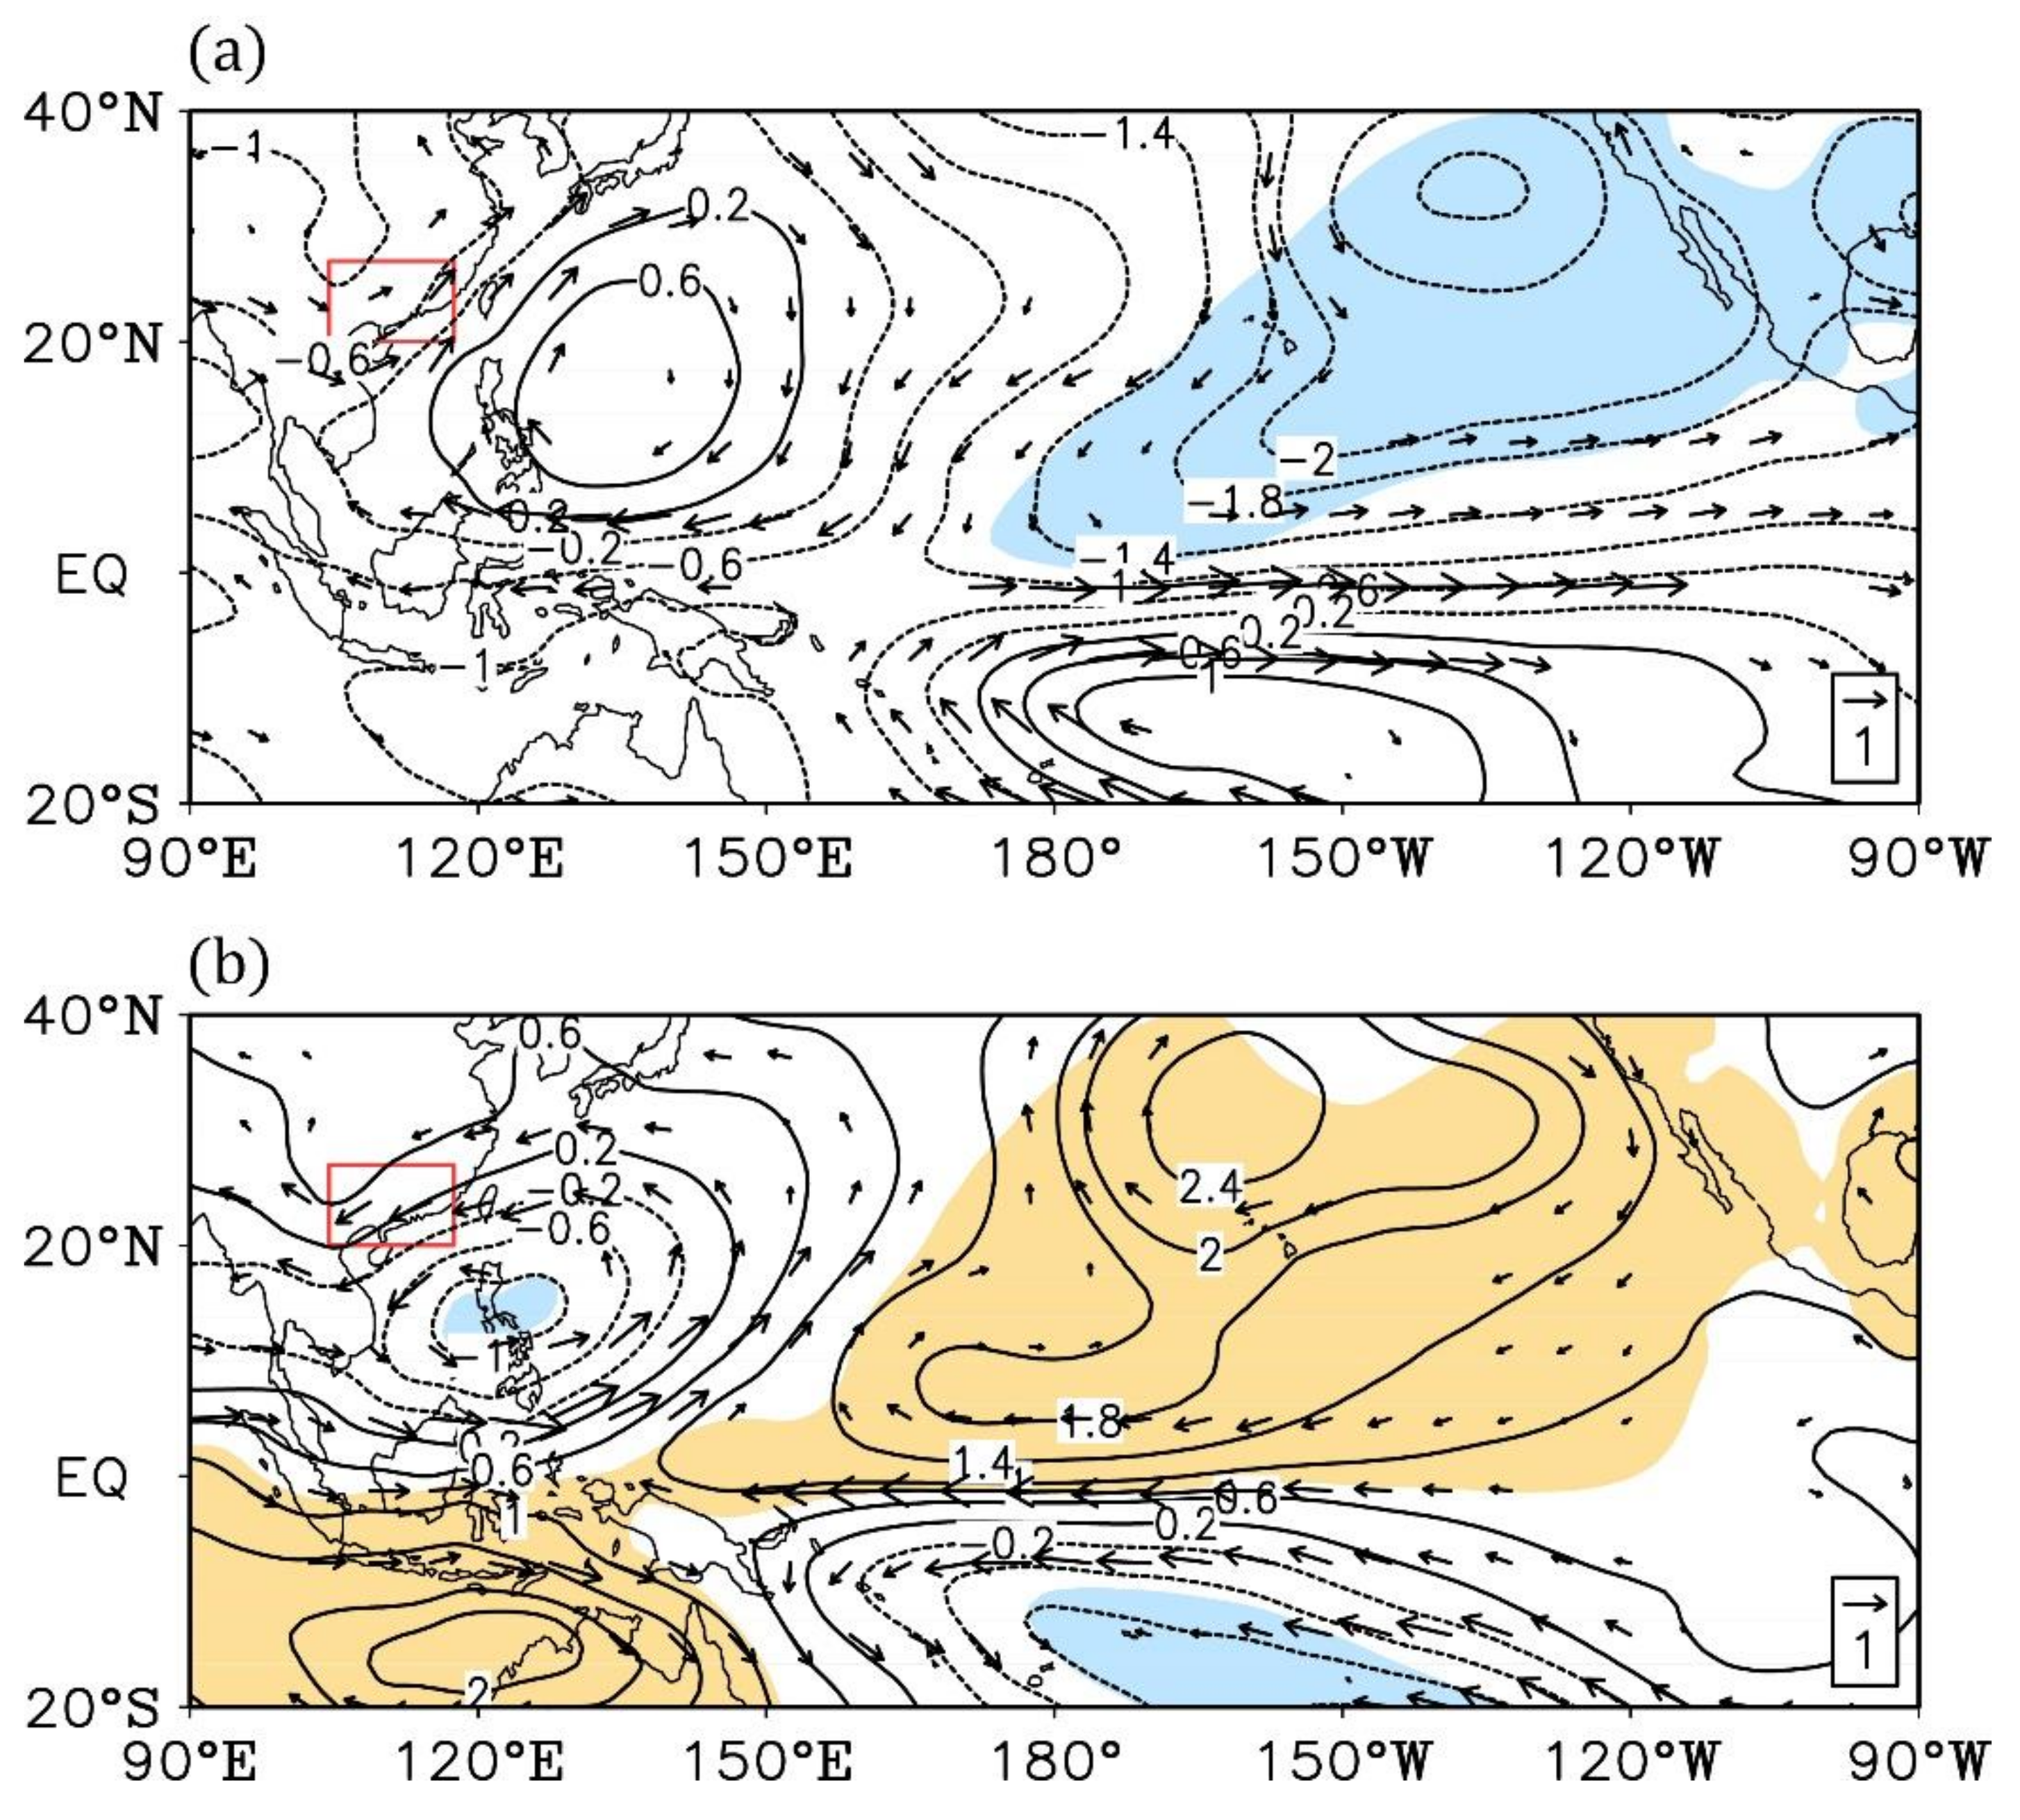
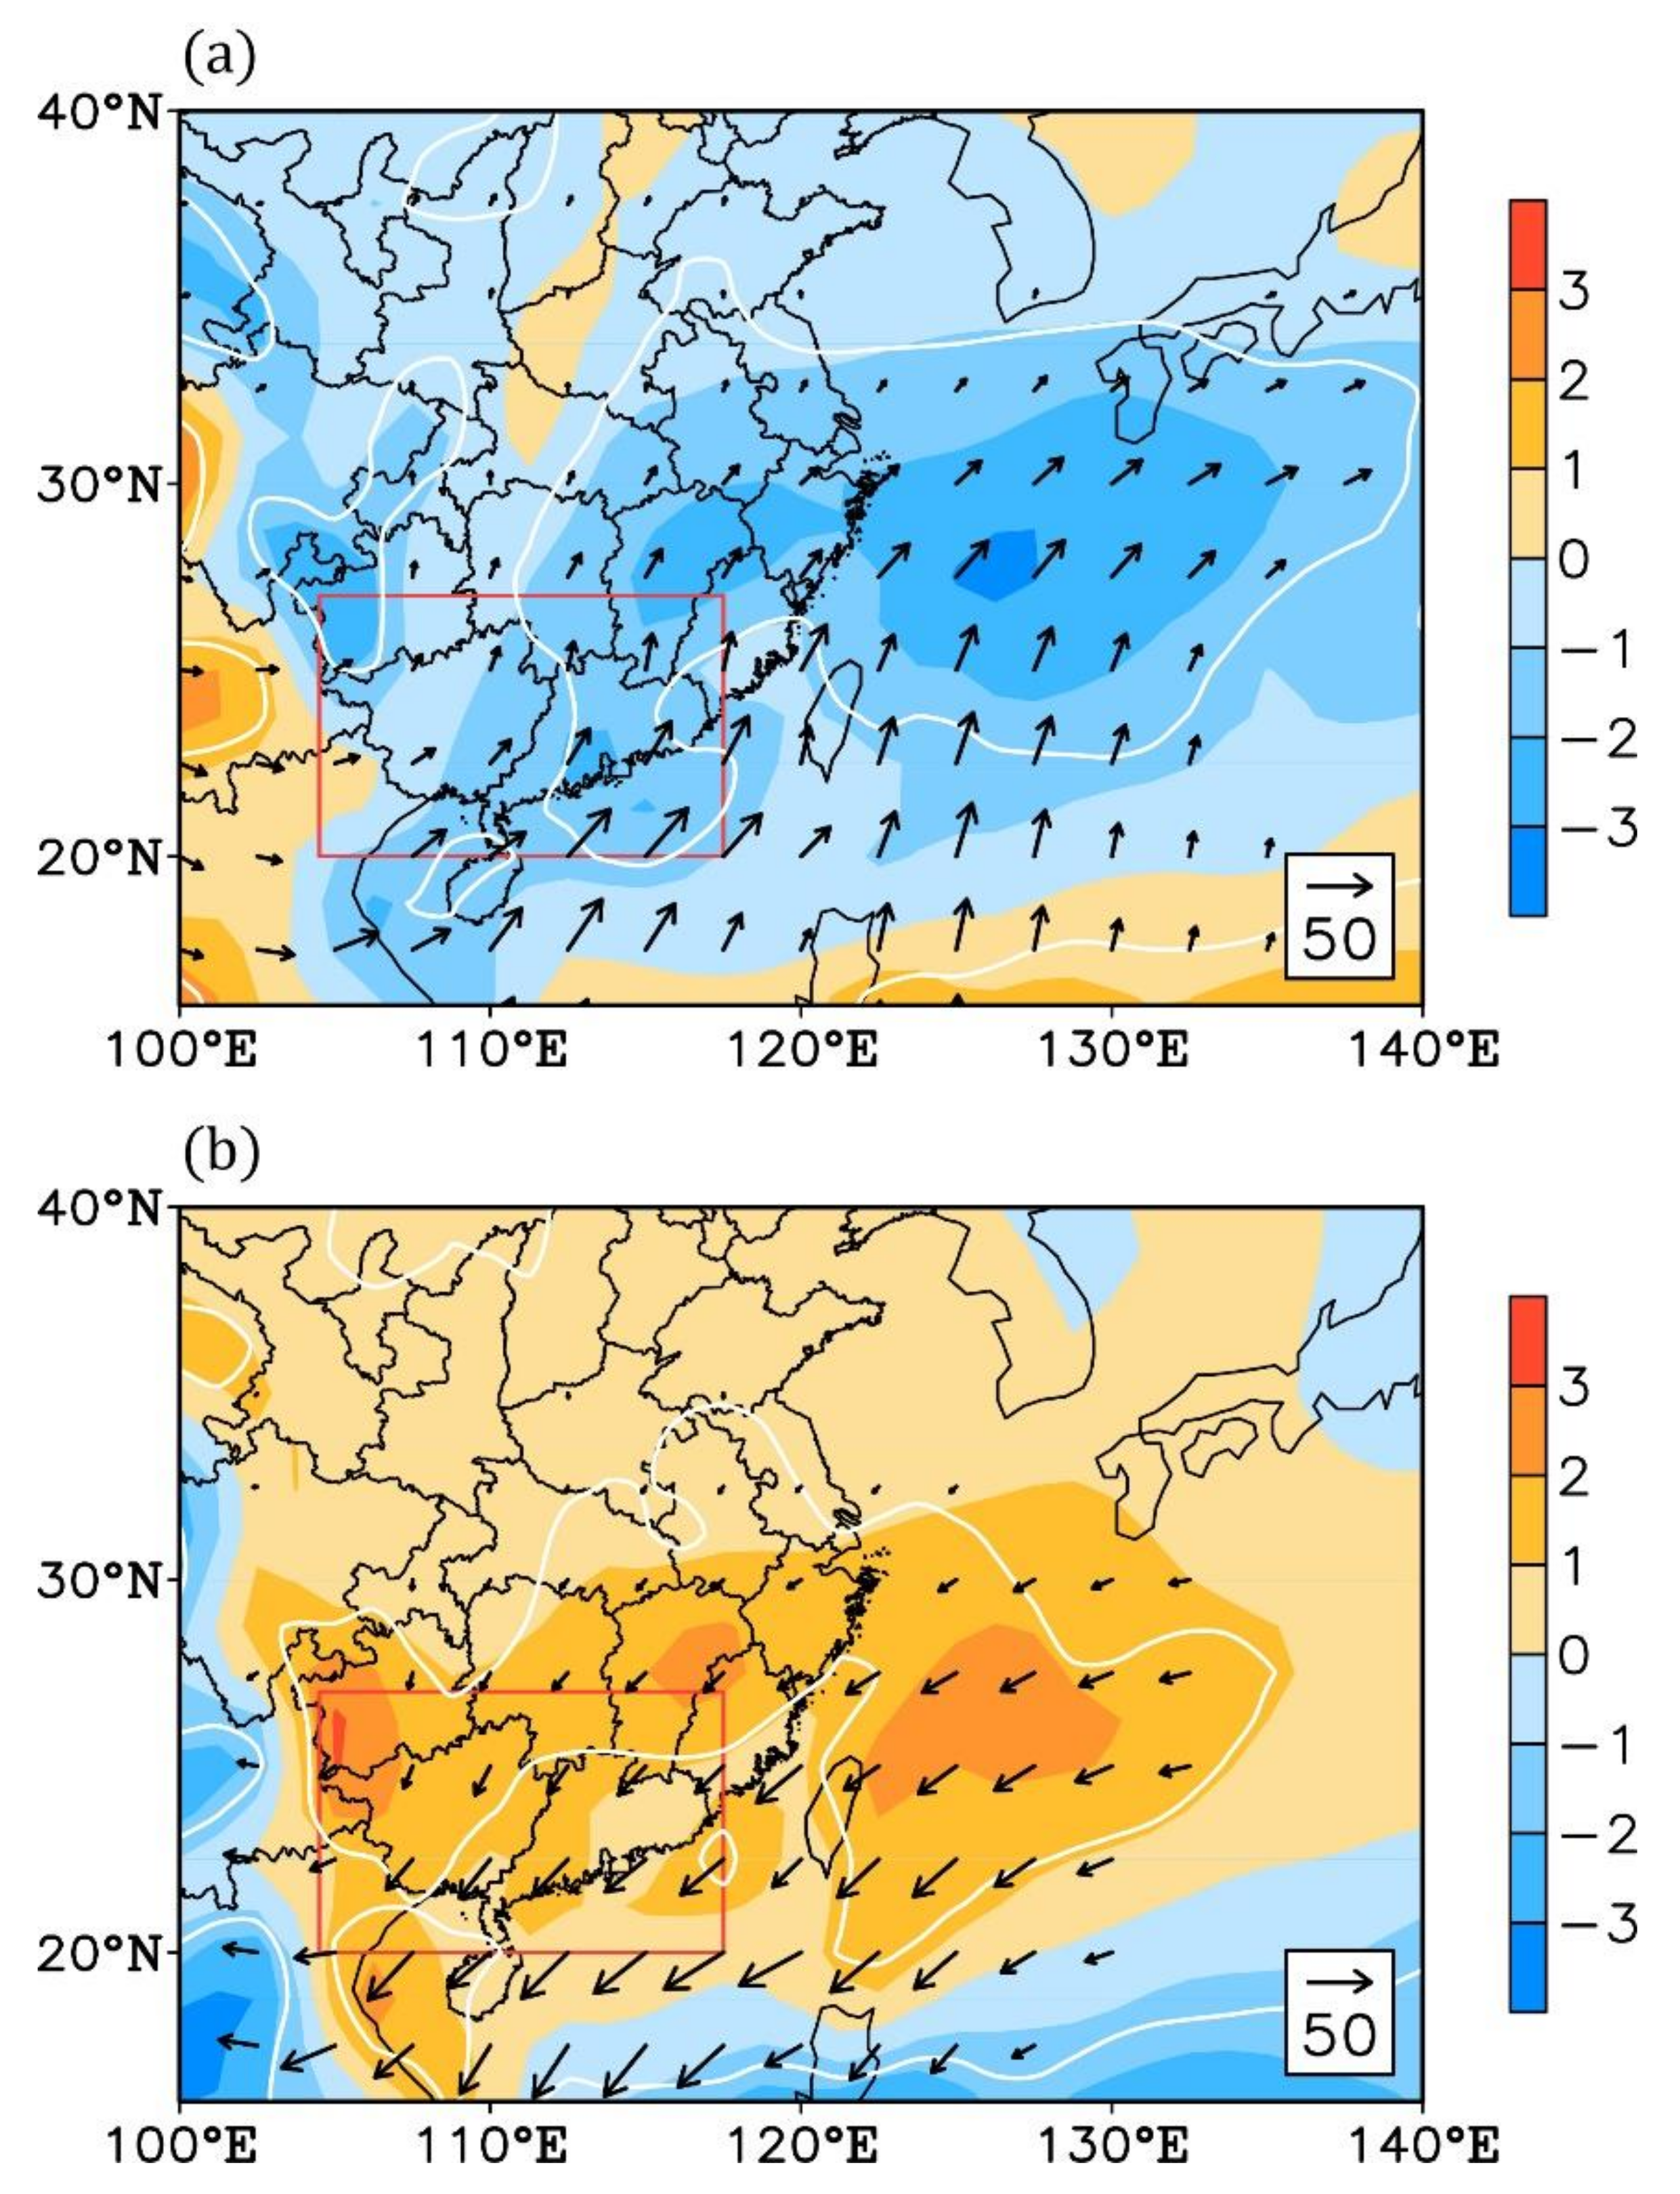
5. Asymmetries in the ENSO-induced Atmospheric Circulation Anomalies

The westward shift of the La Niña SST anomalies hints that the abnormal atmospheric circulation responses may move westwards in the decaying spring of La Niña. To verify such an assumption, the stream function and rotational wind anomalies at 850 hPa in different cases are shown in Figure 5. For the El Niño decaying spring, the rotational wind field exhibits an obvious anomalous low-level anticyclone over the western North Pacific, with an abnormal stream function center to the east of the Philippine islands (Figure 5a). South China is on the edge of the abnormal southwesterly wind field. On the contrary, there is a strong anomalous low-level cyclone over the western North Pacific during the La Niña decaying spring (Figure 5b). More importantly, the abnormal stream function center shifts westwards, crossing the Philippine islands, and the abnormal wind field extends westwards accordingly. Under such conditions, South China is affected by a strong abnormal northeasterly wind.
As we mentioned before, the low-level circulation anomaly plays a decisive role in the air moisture transport. In the decaying spring of the El Niño events, the abnormally stronger southwesterly wind brings excessive moisture from the South China Sea to southeastern China (Figure 6a). Along with the abnormal water vapor flux, there is evident moisture convergence over the East China Sea to eastern China. For the South China region, the significant abnormal moisture convergence only covers the eastern part, i.e., Guangdong province, which would favor local spring precipitation. On the other hand, in the decaying spring of the La Niña events, the abnormal northeasterly wind hampers the water vapor transporting to South China (Figure 6b). In this case, the abnormal water vapor flux field exhibits a westward shift compared with the El Niño events. Correspondingly, the abnormal moisture divergence region also moves westwards, and the significant moisture divergence only covers the western part of South China, i.e., Guangxi province, which would lead to a deficit in local spring precipitation.

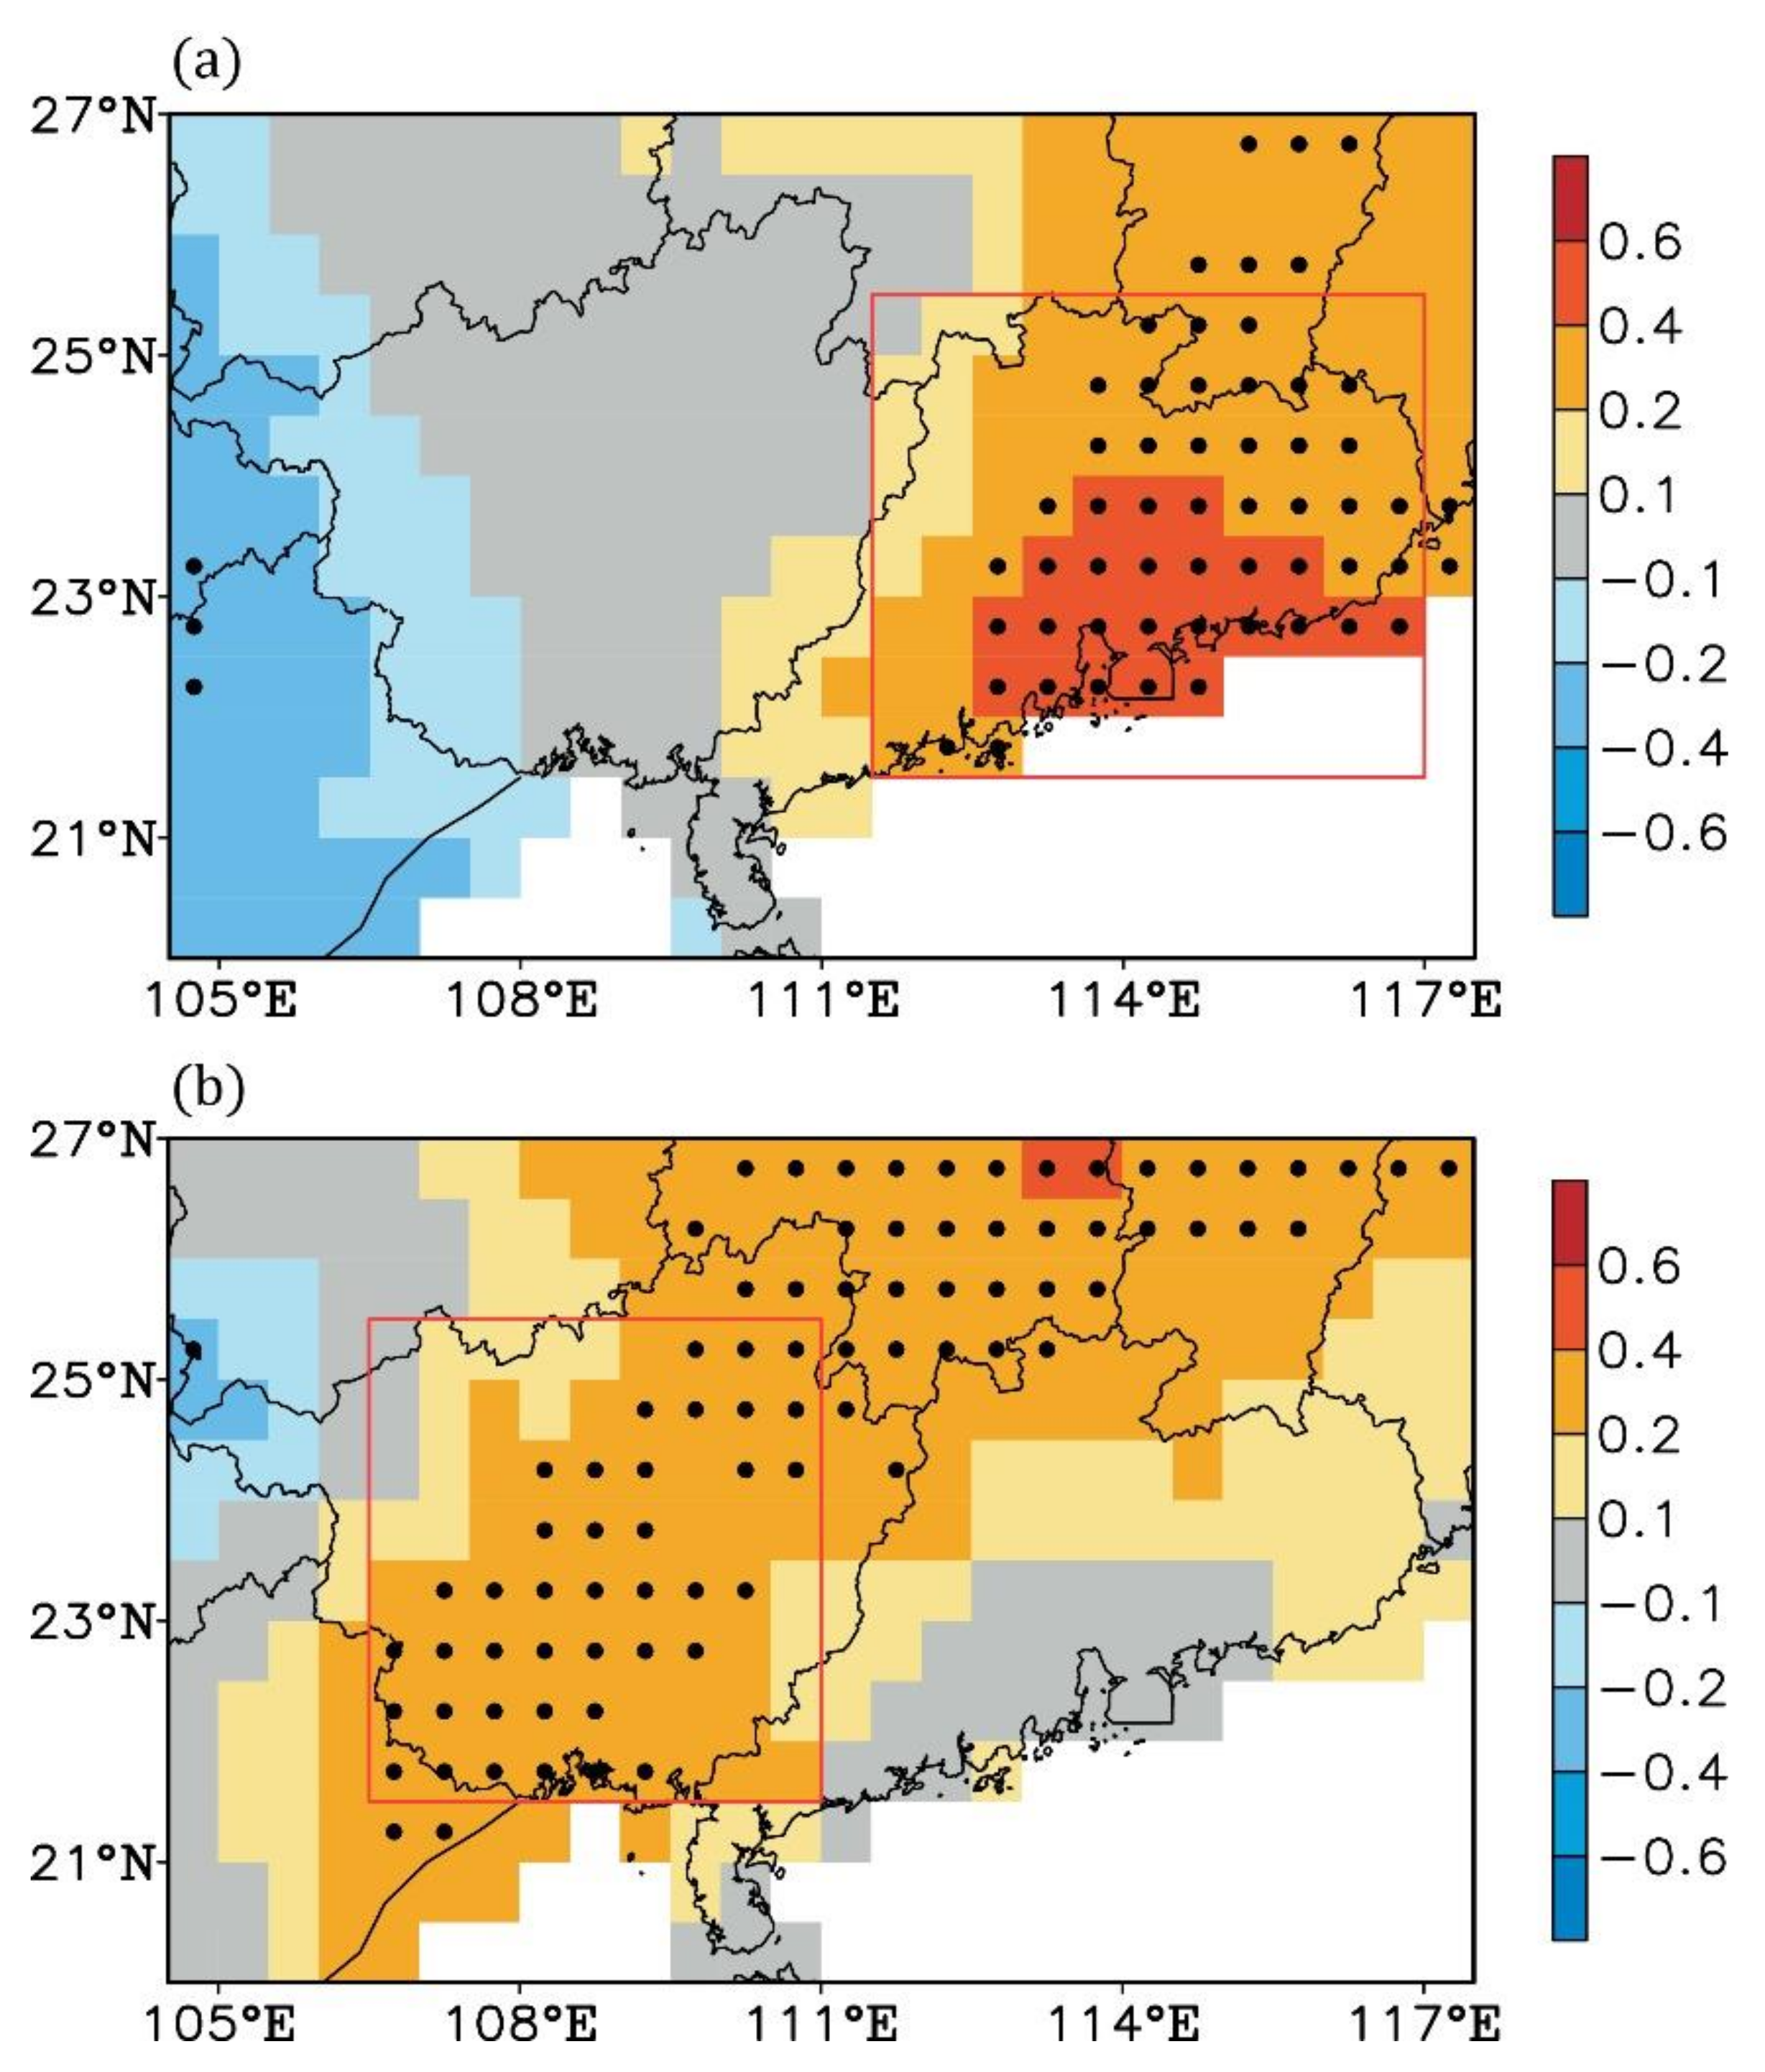
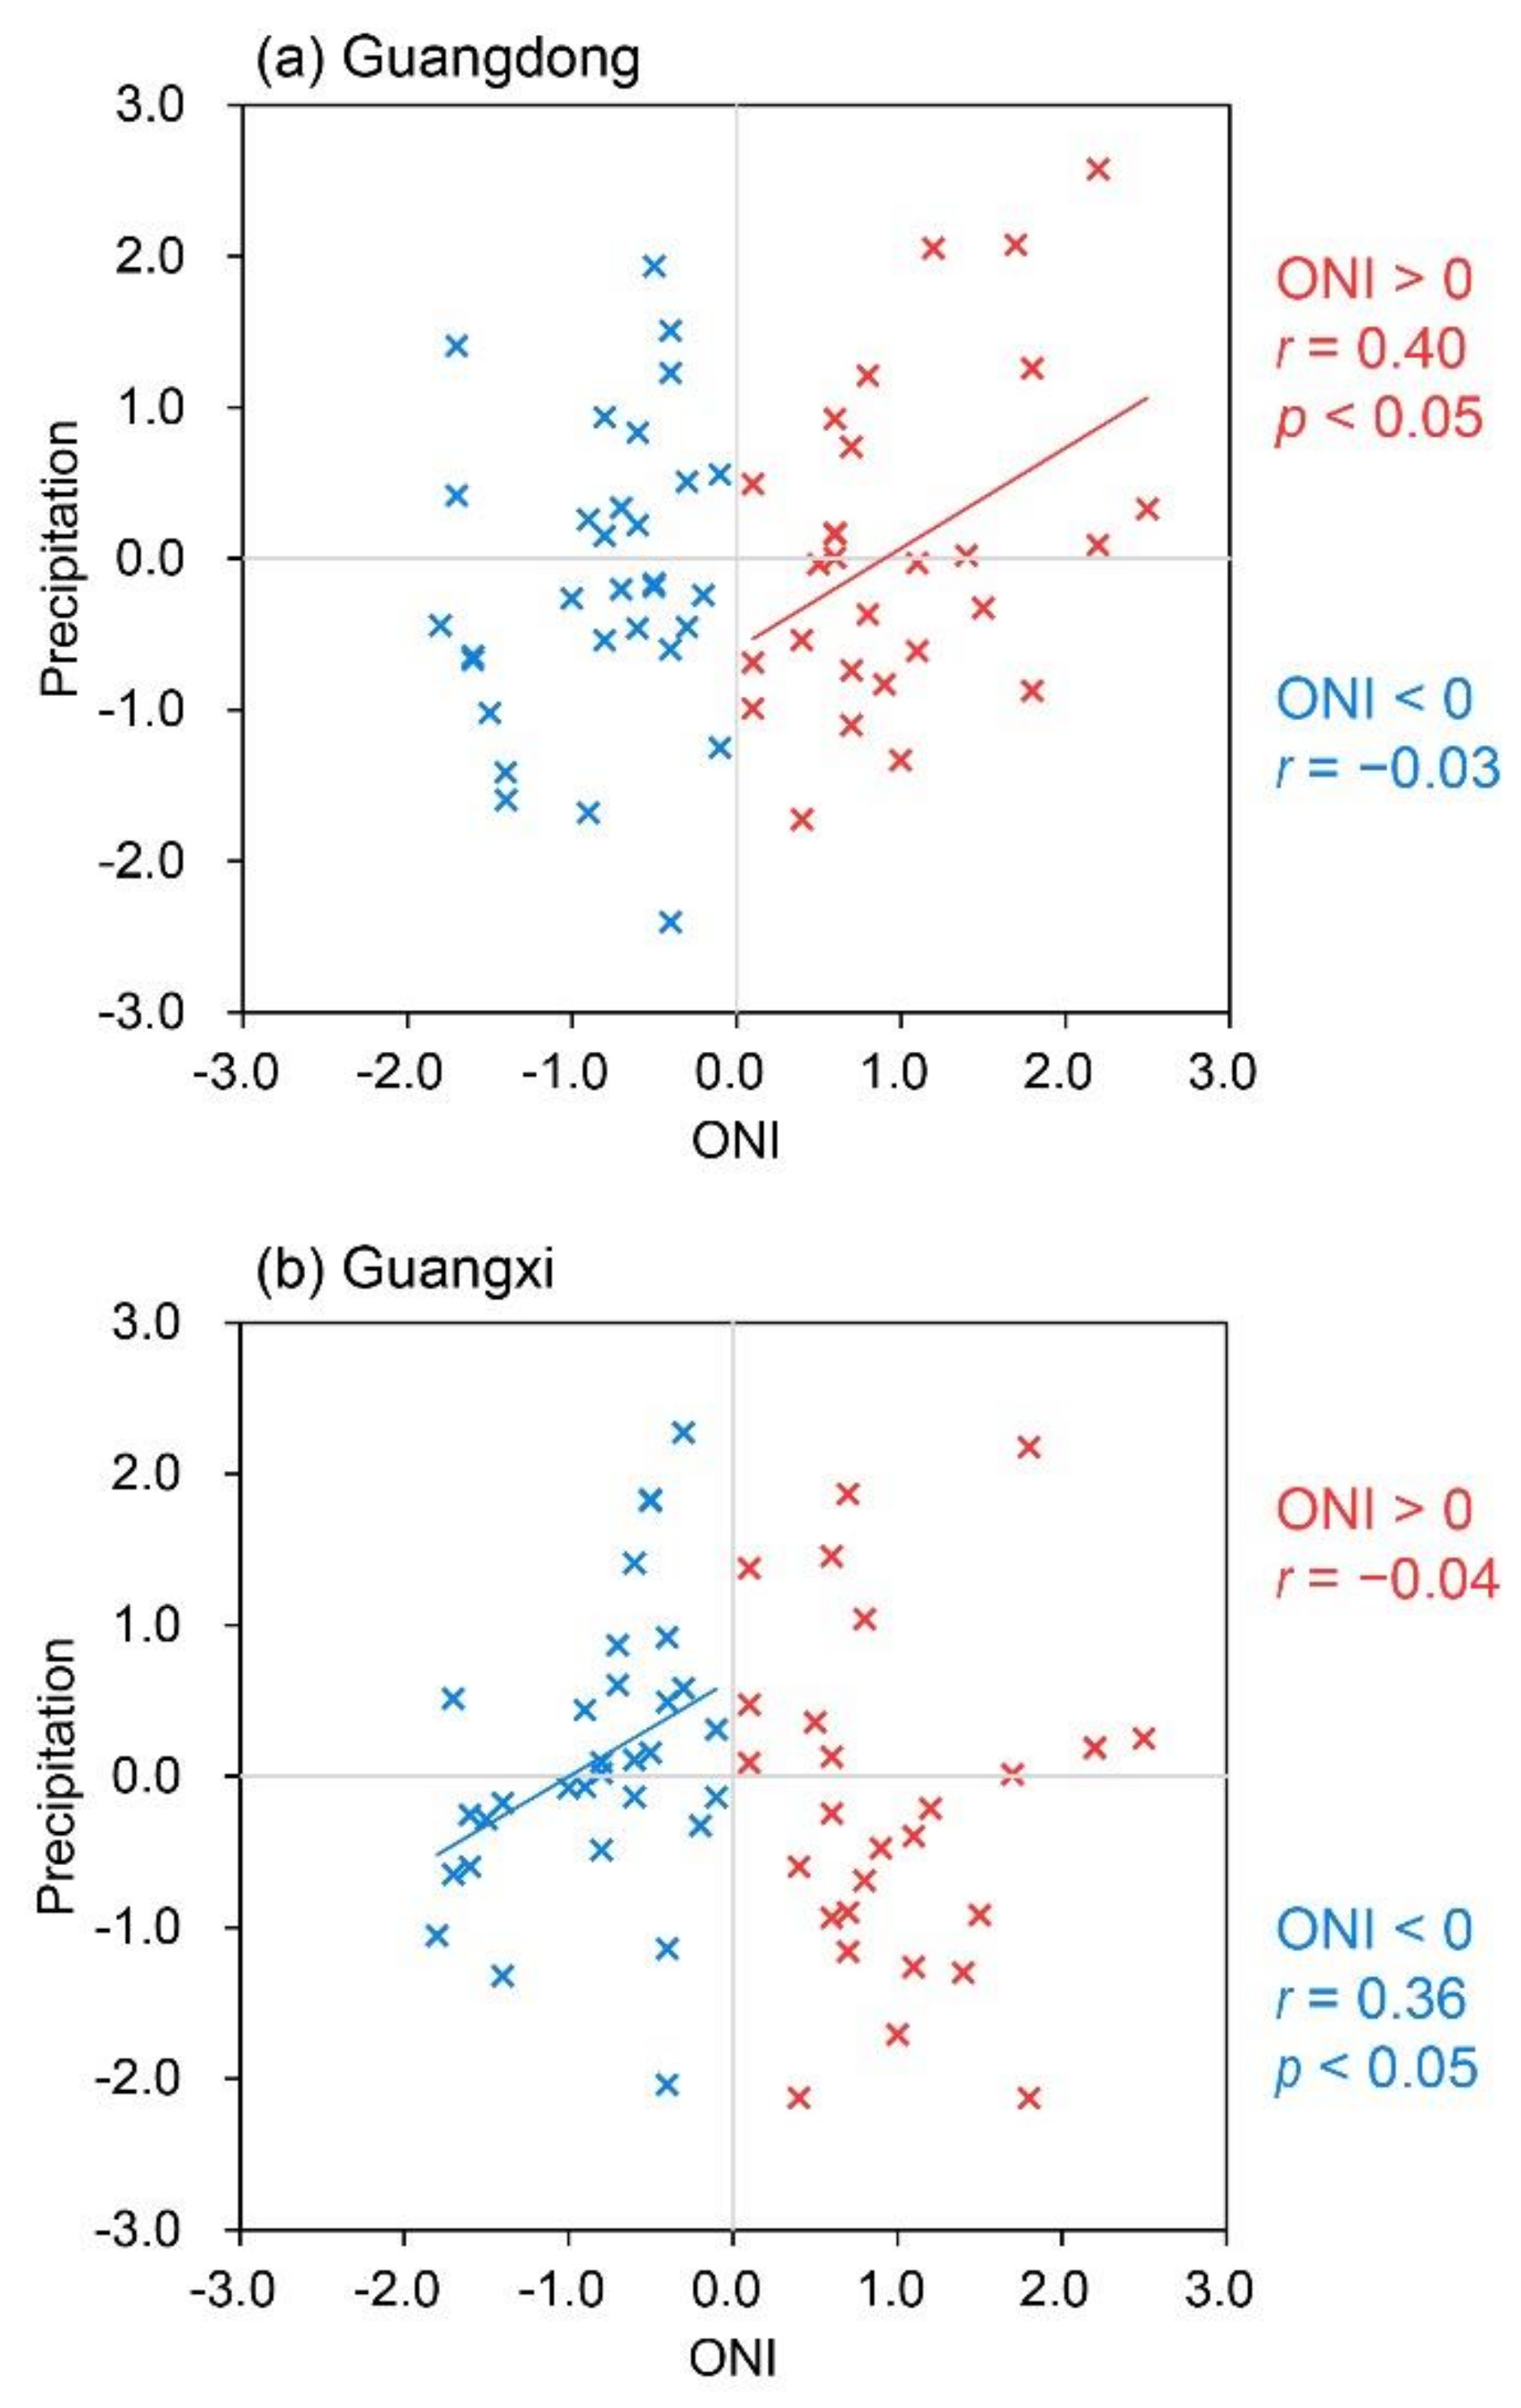
6. Asymmetric Responses of the South China Spring Precipitation to ENSO

The above findings exhibit obvious asymmetries in the two types of ENSO SST anomaly phases and their atmospheric circulation responses in the decaying spring. The ENSO-induced atmospheric circulation anomalies suggest that El Niño potentially affects spring precipitation over Guangdong province, while La Niña potentially exerts an effect on spring precipitation over Guangxi province. As shown in Figure 7, the relationship between the South China spring precipitation and the ENSO SST anomalies exhibits evident asymmetries. For the years with ONI > 0, i.e., the positive ENSO phases, the winter ONI only bears a strong positive correlation with the decaying spring precipitation over Guangdong province (Figure 7a). However, during the years with ONI < 0, i.e., the negative ENSO phases, such a strong positive correlation shifts westwards to Guangxi province (Figure 7b), while it is much weaker over the Guangdong province. This implies that the effect of ENSO on the decaying spring precipitation over South China moves westwards in La Niña compared to El Niño.
To clarify the asymmetric responses of the decaying spring precipitation to the ENSO SST anomalies, we further calculated the regional averaged spring precipitation anomalies over Guangdong (111.5–117° E, 21.5–25.5° N) and Guangxi (106.5–111° E, 21.5–25.5° N) provinces along with the preceding winter ONI, respectively (Figure 8). As shown in Figure 8a, the correlation coefficient of the preceding winter ONI with spring precipitation anomalies reaches 0.40 over Guangdong province during the positive ENSO phases, which is statistically significant with p < 0.05. Meanwhile, the correlation coefficient is only −0.03 during the negative ENSO phases. This indicates that Guangdong province usually has a precipitation surplus in the spring following an El Niño event, while the local spring precipitation barely changes when associated with La Niña events. For Guangxi province, the situation is quite the opposite: the local spring precipitation is closely associated with the ENSO SST anomalies during the negative ENSO phases. This is reflected by a significant (p < 0.05) correlation coefficient of 0.36 between the spring precipitation anomaly and the preceding winter ONI (Figure 8b). Moreover, there is little spring precipitation change over Guangxi province with the ENSO SST anomalies during the positive ENSO phases (the correlation coefficient is −0.04). In other words, Guangxi province usually exhibits a strong precipitation deficit in the spring following a La Niña event, while the effect of El Niño on local spring precipitation is much weaker. The results here also confirm a strong asymmetric effect of ENSO on the decaying spring precipitation over South China: the effect of La Niña shifts westwards from Guangdong province to Guangxi province compared with that of El Niño.

7. Summary and Discussion

In the densely populated and agriculture-based South China region, spring precipitation anomalies are vitally important to the local people’s livelihood and socio-economy. Hence, this study focuses on the South China spring precipitation and its asymmetric responses to ENSO. Generally speaking, South China is one of the most moisture-rich regions in China with a relatively stronger precipitation in spring. The water vapor comes from the South China Sea and the Indochinese Peninsula, accompanied by the southwesterly wind prevailing over the southern part of China during springtime. ENSO is closely related to the atmospheric circulation during its decaying spring. For example, the warm ENSO SST anomalies (i.e., the El Niño events) motivate an anomalous low-level anticyclone over the western North Pacific in the decaying spring, enhancing the southwesterly wind, and vice versa. Thus, ENSO exerts evident impacts on spring precipitation over South China.
However, there are asymmetries in the ENSO events, which would cause asymmetric effects on the atmosphere. Normally, the abnormal warm SST in the El Niño events exists in the tropical eastern Pacific during the developing to decaying phases. There, an anomalous low-level anticyclone forms over the western North Pacific to the east of the Philippine islands in the decaying spring. The enhanced southwesterly wind brings excessive moisture across South China, leading to an abnormal moisture convergence in Guangdong province. In contrast, the abnormal cold SST in the La Niña events slightly extends westwards. Particularly in the decaying spring, the SST anomaly center evidently exhibits a westward shift. This results in a westward movement of the anomalous low-level cyclone over the western North Pacific. The resultant abnormal northeasterly wind field moves westward correspondingly, which causes an abnormal moisture divergence over Guangxi province in spring. The tropical Pacific SST anomaly pattern is very important for regional climate variabilities [44], simulations [45,46], and projections [47,48]. As a result, the spring precipitation anomaly, in response to the negative ENSO phases, exhibits a westward shift. To be specific, in the El Niño decaying spring, Guangdong province will have a precipitation surplus, while Guangxi province usually experiences a precipitation deficit during the La Niña decaying spring. Our analyses further confirm that the responses of spring precipitation over South China to ENSO exhibit obvious asymmetries. A strong positive correlation between the spring precipitation and the preceding winter ONI only exists over Guangdong province in the years with positive ENSO SST anomalies (i.e., El Niño). For the years with negative ENSO SST anomalies (i.e., La Niña), such a strong positive correlation shifts westwards to Guangxi province.
In this study, we highlight the asymmetric effects of ENSO on the South China spring precipitation and, in particular, El Niño, which mainly affects the decaying spring precipitation over Guangdong province, while the effect of La Niña usually exists in Guangxi province. Such a distinct discrepancy in spring precipitation responses to the warm and cold ENSO SST anomalies is crucial to the seasonal predications over South China. Our findings can improve the East Asian climate predictions, benefiting numerous people living in South China.

Author Contributions

Investigation, B.X. and G.L.; methodology, C.G. and G.L.; supervision, G.L. and H.Y.; data curation, Y.L. and S.Z.; writing—original draft, B.X. and C.G.; Writing—review and editing, G.L. and Z.W. All authors have read and agreed to the published version of the manuscript.

Funding

This work was supported by the Start-up Research Fund for the High-level Talents of Jingling Institute of Technology (jit-b-202114), the Fundamental Research Funds for the Central Universities (B210201015), the Natural Science Foundation of China (41905054, 41905075, 41831175, and 41975080), the China Postdoctoral Science Foundation (2020T130168 and 2018M632335), and the Open Research Fund of the State Key Laboratory of Loess and Quaternary Geology of China (SKLLQG2035).

Institutional Review Board Statement

Not applicable.

Informed Consent Statement

Not applicable.

Data Availability Statement

The datasets used in this study are publicly available online.

Acknowledgments

The authors would like to thank the Editor and three anonymous reviewers for their insightful comments and suggestions.

Conflicts of Interest

The authors declare no conflict of interest.

References

  1. Ding, Y.; Chan, J.C.L. The East Asian summer monsoon: An overview. Meteorol. Atmos. Phys. 2005, 89, 117–142. [Google Scholar]
  2. Chen, J.; Wen, Z.; Wu, R.; Chen, Z.; Zhao, P. Interdecadal changes in the relationship between Southern China winter-spring precipitation and ENSO. Clim. Dyn. 2014, 43, 1327–1338. [Google Scholar] [CrossRef]
  3. Yang, Y.-M.; Wang, B.; Li, J. Improving seasonal prediction of East Asian summer rainfall using NESM3.0: Preliminary results. Atmosphere 2018, 9, 487. [Google Scholar] [CrossRef] [Green Version]
  4. Tian, S.F.; Yasunari, T. Climatological aspects and mechanism of spring persistent rains over central China. J. Meteorol. Soc. Jpn. 1998, 76, 57–71. [Google Scholar] [CrossRef] [Green Version]
  5. Linho, L.H.; Huang, X.; Lau, N.C. Winter-to-spring transition in East Asia: A planetary-scale perspective of the South China spring rain onset. J. Clim. 2008, 21, 3081–3096. [Google Scholar] [CrossRef]
  6. Wu, X.; Mao, J. Interdecadal modulation of ENSO-related spring rainfall over South China by the Pacific Decadal Oscillation. Clim. Dyn. 2016, 47, 3203–3220. [Google Scholar] [CrossRef]
  7. Lau, K.M.; Li, M.T. The monsoon of East Asia and its global associations-A survey. Bull. Am. Meteorol. Soc. 1984, 65, 114–125. [Google Scholar] [CrossRef]
  8. Li, Q.; Wei, F.; Li, D. Interdecadal variation of East Asian summer monsoon and drought/flood distribution over eastern China in the last 159 years. J. Geogr. Sci. 2011, 21, 579–593. [Google Scholar] [CrossRef]
  9. Chu, Q.; Wang, Q.; Feng, G. The roles of moisture transports in intraseasonal precipitation during the preflood season over South China. Int. J. Climatol. 2020, 40, 2239–2252. [Google Scholar] [CrossRef]
  10. Rasmusson, E.M.; Wallace, J.M. Meterological aspects of the El Niño/Southern Oscillation. Science 1983, 222, 1195–1202. [Google Scholar] [CrossRef] [PubMed]
  11. Wallace, J.M.; Rasmusson, E.M.; Mitchell, T.P.; Kousky, V.E.; Sarachik, E.S.; Storch, H.V. On the structure and evolution of ENSO-related climate variability in the tropical Pacific: Lessons from TOGA. J. Geophys. Res. Ocean. 1998, 103, 14241–14259. [Google Scholar] [CrossRef]
  12. Neelin, J.D.; Battisti, D.S.; Hirst, A.C.; Jin, F.-F.; Wakata, Y.; Yamagata, T.; Zebiak, S.E. ENSO theory. J. Geophys. Res. Ocean. 1998, 103, 14261–14290. [Google Scholar] [CrossRef]
  13. Lyon, B.; Barnston, A.G. ENSO and the spatial extent of interannual precipitation extremes in tropical land areas. J. Clim. 2005, 18, 5095–5109. [Google Scholar] [CrossRef]
  14. Lin, L.; Chen, C.; Luo, M. Impacts of El Niño-Southern Oscillation on heat waves in the Indochina peninsula. Atmos. Sci. Lett. 2018, 19, e856. [Google Scholar] [CrossRef]
  15. Luo, M.; Lau, N.-C. Amplifying effect of ENSO on heat waves in China. Clim. Dyn. 2019, 52, 3277–3289. [Google Scholar] [CrossRef]
  16. Liu, Y.; Yoon, S.-K.; Kim, J.-S.; Xiong, L.; Lee, J.-H. Changes in intensity and variability of tropical cyclones over the western North Pacific and their local impacts under different types of El Niños. Atmosphere 2021, 12, 59. [Google Scholar] [CrossRef]
  17. Philander, S.G.H. El Niño/Southern Oscillation phenomena. Nature 1983, 302, 295–301. [Google Scholar] [CrossRef]
  18. Wang, C.; Deser, C.; Yu, J.-Y.; DiNezio, P.; Clement, A. El Niño and Southern Oscillation (ENSO): A Review. In Coral Reefs of the World; Springer: Dordrecht, The Netherlands, 2017; pp. 85–106. [Google Scholar]
  19. Dai, A.; Wigley, T.M.L. Global patterns of ENSO-induced precipitation. Geophys. Res. Lett. 2000, 27, 1283–1286. [Google Scholar] [CrossRef] [Green Version]
  20. Wang, B.; Wu, R.; Fu, X. Pacific–East Asian teleconnection: How does ENSO affect East Asian climate? J. Clim. 2000, 13, 1517–1536. [Google Scholar] [CrossRef]
  21. Juneng, L.; Tangang, F.T. Evolution of ENSO-related rainfall anomalies in Southeast Asia region and its relationship with atmosphere–ocean variations in Indo-Pacific sector. Clim. Dyn. 2005, 25, 337–350. [Google Scholar] [CrossRef]
  22. Hu, K.; Huang, G. The formation of precipitation anomaly patterns during the developing and decaying phases of ENSO. Atmos. Ocean. Sci. Lett. 2010, 3, 25–30. [Google Scholar]
  23. Jin, D.; Hameed, S.N.; Huo, L. Recent changes in ENSO teleconnection over the Western Pacific impacts the Eastern China precipitation dipole. J. Clim. 2016, 29, 7587–7598. [Google Scholar] [CrossRef]
  24. Ropelewski, C.F.; Halpert, M.S. Global and regional scale precipitation patterns associated with the El Niño/Southern Oscillation. Mon. Weather Rev. 1987, 115, 1606–1626. [Google Scholar] [CrossRef] [Green Version]
  25. Hendon, H.H. Indonesian rainfall variability: Impacts of ENSO and local air-sea Interaction. J. Clim. 2003, 16, 1775–1790. [Google Scholar] [CrossRef]
  26. Lau, N.-C.; Nath, M.J. Atmosphere–ocean variations in the Indo-Pacific sector during ENSO episodes. J. Clim. 2003, 16, 3–20. [Google Scholar] [CrossRef]
  27. Chang, C.P.; Wang, Z.; Ju, J.; Li, T. On the relationship between western maritime continent monsoon rainfall and ENSO during northern winter. J. Clim. 2004, 17, 665–672. [Google Scholar] [CrossRef] [Green Version]
  28. Wu, R.; Hu, Z.Z.; Kirtman, B.P. Evolution of ENSO-related rainfall anomalies in East Asia. J. Clim. 2003, 16, 3742–3758. [Google Scholar] [CrossRef]
  29. Zhou, L.T.; Wu, R. Respective impacts of the East Asian winter monsoon and ENSO on winter rainfall in China. J. Geophys. Res. 2010, 115, D02107. [Google Scholar] [CrossRef]
  30. Jiang, F.; Zhang, W.; Geng, X.; Stuecker, M.F.; Liu, C. Impacts of central Pacific El Niño on southern China spring precipitation controlled by its longitudinal position. J. Clim. 2019, 32, 7823–7836. [Google Scholar] [CrossRef]
  31. Wang, B.; Zhang, Q. Pacific—East Asian teleconnection. Part II: How the Philippine Sea anomalous anticyclone is established during El Niño development. J. Clim. 2002, 15, 3252–3265. [Google Scholar] [CrossRef] [Green Version]
  32. Timmermann, A.; An, S.-I.; Kug, J.-S.; Jin, F.-F.; Cai, W.; Capotondi, A.; Cobb, K.M.; Lengaigne, M.; McPhaden, M.J.; Stuecker, M.F.; et al. El Niño—Southern Oscillation complexity. Nature 2018, 559, 535–545. [Google Scholar] [CrossRef]
  33. An, S.I.; Jin, F.-F. Nonlinearity and asymmetry of ENSO. J. Clim. 2004, 17, 2399–2412. [Google Scholar] [CrossRef]
  34. Hoerling, M.P.; Kumar, A.; Min, Z. El Niño, La Niña, and the nonlinearity of their teleconnections. J. Clim. 1997, 10, 1769–1786. [Google Scholar] [CrossRef]
  35. Okumura, Y.M.; Deser, C. Asymmetry in the duration of El Niño and La Niña. J. Clim. 2010, 23, 5826–5843. [Google Scholar] [CrossRef] [Green Version]
  36. An, S.-I.; Ham, Y.-G.; Kug, J.-S.; Jin, F.-F.; Kang, I.-S. El Niño—La Niña asymmetry in the coupled model intercomparison project simulations. J. Clim. 2005, 18, 2617–2627. [Google Scholar] [CrossRef]
  37. Chou, C.; Lo, M.-H. Asymmetric responses of tropical precipitation during ENSO. J. Clim. 2007, 20, 3411–3433. [Google Scholar] [CrossRef]
  38. Ng, C.H.J.; Vecchi, G.A.; Muñoz, Á.G.; Murakami, H. An asymmetric rainfall response to ENSO in East Asia. Clim. Dyn. 2019, 52, 2303–2318. [Google Scholar] [CrossRef]
  39. Li, G.; Gao, C.; Lu, B.; Chen, H. Inter-annual variability of spring precipitation over the Indo-China Peninsula and its asymmetric relationship with El Niño-Southern Oscillation. Clim. Dyn. 2021, in press. [Google Scholar] [CrossRef]
  40. Gushchina, D.; Zheleznova, I.; Osipov, A.; Olchev, A. Effect of various types of ENSO events on moisture conditions in the humid and subhumid tropics. Atmosphere 2020, 11, 1354. [Google Scholar] [CrossRef]
  41. Ropelewski, C.F.; Halpert, M.S. Precipitation patterns associated with the high index phase of the Southern Oscillation. J. Clim. 1989, 2, 268–284. [Google Scholar] [CrossRef] [Green Version]
  42. Sasaki, W.; Doi, T.; Richards, K.J.; Masumoto, Y. The influence of ENSO on the equatorial Atlantic precipitation through the Walker circulation in a CGCM. Clim. Dyn. 2014, 44, 191–202. [Google Scholar] [CrossRef]
  43. Philander, S.G. El Niño, La Niña, and the Southern Oscillation; Academic Press: New York, NY, USA, 1990. [Google Scholar]
  44. Li, G.; Gao, C.; Xu, B.; Lu, B.; Chen, H.; Ma, H.; Li, X. Strengthening influence of El Niño on the following spring precipitation over the IndoChina Peninsula. J. Clim. 2021. under review. [Google Scholar]
  45. Li, G.; Du, Y.; Xu, H.; Ren, B. An Intermodel Approach to Identify the Source of Excessive Equatorial Pacific Cold Tongue in CMIP5 Models and Uncertainty in Observational Datasets. J. Clim. 2015, 28, 7630–7640. [Google Scholar] [CrossRef]
  46. Li, G.; Jian, Y.; Yang, S.; Du, Y.; Wang, Z.; Li, Z.; Zhuang, W.; Jiang, W.; Huang, G. Effect of excessive equatorial Pacific cold tongue bias on the El Niño-Northwest Pacific summer monsoon relationship in CMIP5 multimodel ensemble. Clim. Dyn. 2019, 52, 6195–6212. [Google Scholar] [CrossRef]
  47. Li, G.; Xie, S.-P.; Du, Y.; Luo, Y. Effect of excessive equatorial cold tongue bias on the projections of the tropical Pacific climate change. Part I: The warming pattern in CMIP5 multi-model ensemble. Clim. Dyn. 2016, 47, 3817–3831. [Google Scholar] [CrossRef]
  48. Li, G.; Xie, S.-P.; He, C.; Chen, Z. Western Pacific emergent constraint lowers projected increase in Indian summer monsoon rainfall. Nat. Clim. Chang. 2017, 7, 708–712. [Google Scholar] [CrossRef]
Figure 1. (a) Total precipitation (units: mm) in spring (March, April, and May) for the period 1958–2019. The red box denotes the South China area. (b) Standard deviation of spring precipitation (units: mm) during 1958–2019. (c) Proportion (units: %) of the standard deviation of precipitation in total precipitation in spring during 1958–2019. (d) Mean water vapor flux (arrows; units: kg m−1 s−1) integrated from 300 to 1000 hPa and its divergence (colors; units: 1e5 kg m−2 s−1) in spring during 1958–2019.
Atmosphere 12 00391 g001
Figure 2. (a) Correlation coefficients of velocity potential (contours; the colored areas are significant with p < 0.1) and divergent wind (arrows; only arrows significant with p < 0.1 are shown) anomalies in spring at 200 hPa with the preceding winter Oceanic Niño Index (ONI) during 1958–2019. (b) Same as in (a), but for the spring stream function (contours; the colored areas are significant with p < 0.1) and rotational wind (arrows; only arrows significant with p < 0.1 are shown) anomalies at 850 hPa.
Atmosphere 12 00391 g002
Figure 3. Composite anomalies of the decaying spring sea surface temperature (SST) (contours and colors; units: °C) for the (a) El Niño cases and (b) La Niña cases. All data are linearly detrended.
Atmosphere 12 00391 g003
Figure 4. Composite monthly evolutions of SST anomalies (contours and colors; units: °C) averaged over 2°S–2°N from developing autumn (SEP) to decaying spring (MAY) in the (a) El Niño cases and (b) La Niña cases. (c) The summation of (a) and (b). All data are linearly detrended.
Atmosphere 12 00391 g004
Figure 5. Composite anomalies of the decaying spring stream function (contours; units: m2 s−1; the colored areas are significant with p < 0.1) and rotational wind (arrows; units: m s−1; only arrows significant with p < 0.1 are shown) at 850 hPa for the (a) El Niño cases and (b) La Niña cases. All data are linearly detrended. The red boxes denote the South China region.
Atmosphere 12 00391 g005
Figure 6. Composite anomalies of spring water vapor flux (arrows; units: kg m−1 s−1; only arrows significant with p < 0.1 are shown) integrated from 300 to 1000 hPa and its divergence (colors; units: 1 e5 kg m−2 s−1; the areas within white lines are significant with p < 0.1) in the (a) El Niño cases and (b) La Niña cases. All data are linearly detrended. The red boxes denote the South China region.
Atmosphere 12 00391 g006
Figure 7. Correlation coefficients between the spring precipitation anomalies and the preceding winter ONI for the years with (a) ONI > 0 and (b) ONI < 0. The dotted areas are significant with p < 0.1. All data are linearly detrended. The red boxes in (a) and (b) denote the Guangdong province and Guangxi province regions, respectively.
Atmosphere 12 00391 g007
Figure 8. Relationships of spring precipitation anomalies over the (a) Guangdong province and (b) Guangxi province with the preceding winter ONI for the period of 1958–2019. The blue and red colors are for the years with ONI < 0 (31 years) and ONI > 0 (28 years), respectively. The r is the correlation coefficient between spring precipitation anomalies and the preceding winter ONI. Precipitation data are linearly detrended and standardized.
Atmosphere 12 00391 g008
Table 1. List of the El Niño and La Niña decaying years during 1958–2019 used in the composite analysis.
El Niño19581964196619731983
19871992199820102016
La Niña19711974197619851989
19961999200020082011
Publisher’s Note: MDPI stays neutral with regard to jurisdictional claims in published maps and institutional affiliations.

