Article

Mechanisms for Severe Drought Occurrence in the Balsas River Basin (Mexico)

1
Posgrado en Ciencias de la Tierra, Universidad Nacional Autónoma de México, Mexico City 04510, Mexico
2
Centro de Ciencias de la Atmósfera, Universidad Nacional Autónoma de México, Mexico City 04510, Mexico
3
Environmental Physics Laboratory (EPhysLab), CIM–UVigo, Universidade de Vigo, 32004 Ourense, Spain
4
Departamento de Sistemas Físicos, Químicos y Naturales, Universidad Pablo de Olavide, 41013 Sevilla, Spain
5
Departamento de Ciencias de la Tierra y Astrofísica, Facultad de Ciencias Físicas, Universidad Complutense de Madrid, 28040 Madrid, Spain
6
Instituto de Geociencias (CSIC-UCM), 28040 Madrid, Spain
*
Author to whom correspondence should be addressed.
Atmosphere 2021, 12(3), 368; https://doi.org/10.3390/atmos12030368
Submission received: 7 January 2021 / Revised: 26 February 2021 / Accepted: 2 March 2021 / Published: 11 March 2021
(This article belongs to the Special Issue Central America and Caribbean Hydrometeorology and Hydroclimate)

Abstract

:
This work provides an assessment of the two most intense seasonal droughts that occurred over the Balsas River Basin (BRB) in the period 1980–2017. The detection of the drought events was performed using the 6 month scale standardized precipitation–evapotranspiration index (SPEI-6) and the 6 month standardized precipitation index (SPI-6) in October. Both indices were quite similar during the studied period, highlighting the larger contribution of precipitation deficits vs. temperature excess to the drought occurrence in the basin. The origin of the atmospheric water arriving to the BRB (1 May 1980–31 October 2017) was investigated by using a Lagrangian diagnosis method. The BRB receives moisture from the Caribbean Sea and the rest of the tropical Atlantic, the Gulf of Mexico, the eastern north Pacific and from three terrestrial evaporative sources: the region north of BRB, the south of BRB and the BRB itself. The terrestrial evaporative source of the BRB itself is by far the main moisture source. The two most intense drought events that occurred in the studied period were selected for further analysis. During the severe drought of 2005, the summertime sea surface temperature (SST) soared over the Caribbean Sea, extending eastward into a large swathe of tropical North Atlantic, which was accompanied by the record to date of hurricane activity. This heating generated a Rossby wave response with westward propagating anticyclonic/cyclonic gyres in the upper/lower troposphere. A cyclonic low-level circulation developed over the Gulf of Mexico and prevented the moisture from arriving to the BRB, with a consequent deficit in precipitation. Additionally, subsidence also prevented convection in most of the months of this drought period. During the extreme drought event of 1982, the Inter Tropical Convergence Zone (ITCZ) remained southern and stronger than the climatological mean over the eastern tropical Pacific, producing an intense regional Hadley circulation. The descent branch of this cell inhibited the development of convection over the BRB, although the moisture sources increased their contributions; however, these were bounded to the lower levels by a strong trade wind inversion.

1. Introduction

Numerous severe drought events have been witnessed around the world during the last decades [1], such as the 2007–2009 drought in the Fertile Crescent [2], the 2010 Amazon drought [3], the long drought of the first decade of the current century in Australia [4] or the 2011 record-setting Texas drought [5]. In the case of Mexico, the frequency and extension of drought conditions have been evaluated during the period 1950–1999 by using the Palmer Drought Severity Index (PDSI) [6], with more frequent episodes found in north-western Mexico [7]. However, it is important to mention that the time scale was not defined in PDSI, and this method was replaced by others that better detect the start and end of a drought event [8]. Regarding future drought conditions, the climate model outputs archived in the Coupled Model Intercomparison Project phase 5 (CMIP5) revealed increased drought in a few regions around the world, with one of them being Central America and Mexico [9]. Droughts would affect forestry and hydropower sectors in Mexico, but the biggest impacts are projected to occur in agriculture [10]. In fact, in the Special Report on Managing the Risks of Extreme Events and Disasters to Advance Climate Change Adaptation by the Intergovernmental Panel on Climate Change (IPCC) [11], the Central America/Mexico region is one of the key regions projected to be more strongly affected by droughts.
Overall, there is a lack of scientific studies about the severity, propagation and socio-economic impacts of droughts in Mexico [12]. Furthermore, the attention given to drought events is focused on the response to these events but not their risk management, which makes certain locations very vulnerable to droughts. Information about the origin of droughts is of the utmost importance in order to be able to manage the risks and assess the potential impacts and in general terms for proper decision-making in relation to droughts [13].
The Hydrological Region “Balsas”—hereafter referred to as Balsas River Basin (BRB)—is one of the 13 so-called Hydrological Administrative Regions into which Mexico is divided [14]. The BRB region (Figure 1a) comprises eight states partially or totally (Jalisco, Michoacán, Tlaxcala, Morelos, Puebla, Guerrero, Estado de México and Oaxaca). The BRB in general gets around 95% of its annual precipitation between May and October (Figure 1b) [15], but due to the orography, the basin has a variety of climatic characteristics [16]. The BRB has an extension of 116,436 km2 [17], and it is the most important Pacific slope river in the country, supplying water to big conurbation areas such as Puebla, Tlaxcala and Cuernavaca-Cuautla, among others. Additionally, the hydroelectric installed capacity in Mexico, which contributes 48% of the annual clean energy generation, is mainly concentrated in the Balsas, Lerma Santiago and Grijalva basins, with the former being the most vulnerable to suffer a lack of water availability [18].
The BRB is a drought-prone region [19]. For example, during 2015, a strong drought caused losses of up to 80% in the sowing of jamaica, sesame, sorghum and corn [20]. According to the climate change vulnerability index [21], the Balsas region presents a high degree of hydric vulnerability. Heavy erosion processes caused by the combination of heavy rainfall and deforestation have also had an impact on the local hydrological cycle [22]. For example, in the state of Morelos, which belongs completely to the BRB, close to 60% of the original vegetation (seasonally dry tropical forests) has been lost [23].
On the other hand, rainfall is generally more directly related to moisture supply in the tropics, whereas in the extratropics, the role of stability and dynamical forcing mechanisms normally gain relative importance [24,25]. To investigate the relative importance of moistening in the BRB, we take advantage of the use of the Lagrangian dispersion model FLEXPART (flexible particle dispersion model) [26,27]. This Lagrangian approach allows us to determine large-scale water vapor advection by tracking evaporation minus precipitation (E–P) from a region forwards or backwards in time, thereby facilitating the determination of the source–receptor relationships of water.
The main goal of this work is to analyze the origin of severe drought events over the BRB since 1980. For this purpose, this study has three specific objectives: first, to rank the hydrological droughts that occurred over the BRB during the period 1980–2017; second, to implement a dynamical analysis of moisture transport over the BRB for the selected severe or extreme droughts; and finally, to assess the role played by the sea surface temperature (SST) and atmospheric stability in these droughts.

2. Data and Methods

2.1. Drought Indices

The standardized precipitation index (SPI) relies on the difference of precipitation from the mean for a specified time period divided by the standard deviation [28]. This method takes into account the fact that the time period from the arrival of precipitation until water is available in each useable form (soil moisture, ground water, snowpack, streamflow and reservoir storage) differs greatly [28]. The SPI can be calculated over different precipitation accumulation periods, and the averaging period (1, 3, 6, 12, 24 or 48 months) is selected depending on the type of drought in which user is interested (i.e., meteorological, agricultural, hydrological or ecological). A disadvantage of this simple method is that precipitation is typically not normally distributed for accumulation periods of 12 months or less, but this is overcome by applying a transformation to the distribution [28,29]. Many studies using the SPI have been undertaken, as the SPI provides information on precipitation deficit, average percentage and probability. However, in recent years, some shortcomings in the index have become apparent due to the fact that it does not take into account variables such as evapotranspiration or temperature [30,31], which can be crucial in order to assess the occurrence of droughts.
The standardized precipitation–evapotranspiration index (SPEI) takes into account the potential evapotranspiration (PET), besides the precipitation, in order to determine the occurrence of droughts [32]. The SPEI is able to capture the impact of temperature on the atmospheric evaporative demand of water [33]. The method used to compute the SPEI is similar to that for the SPI. However, while the SPI adjusts precipitation to a certain distribution, in the case of the SPEI, it is the difference between precipitation and PET that is adjusted. The SPEI can also be calculated over different time-scales for the estimation of the diverse potential impacts of water deficit accumulation occurring over time periods of different lengths.
The response of the hydrological system to precipitation is time-lagged and not known a priori [34], but in general the SPEI and SPI average accumulation periods (e.g., 3 to 12 months) can be used as an indicator for reduced stream flow and reservoir storage [35,36]. We computed 6 month scale indices in October (SPI-6 and SPEI-6) to analyze the seasonal scale droughts. The 6 month indices at the end of October provide a very good indication of the amount of precipitation that has fallen during the wet season for the BRB. In this way, we can even take into account the impact in the early stages on water reservoirs. In this work, 1 month indices (SPEI-1 and SPI-1) were also used to determine the months within the drought period with the most severe meteorological drought.
Monthly rainfall data from the University of East Anglia Climate Research Unit (CRU) database [15] were used to generate the SPEI and SPI for a 38 year period (1980–2017) with a 0.5° resolution in longitude and latitude. The PET from the CRU database, which employs the FAO (Food and Agricultural Organization) Penman–Monteith formula [15], was also used to compute SPEI.

2.2. E–P Backward Tracking

FLEXPART v9 (flexible particle dispersion model) was used here to identify the large-scale water vapor advection toward the region of study. Although the model was originally created to determine pollutant dispersion, it was adapted also to diagnose any change of different variables along the trajectories. Over the last decades, the model has largely been used to determinate moisture transport that generates precipitation over continents based on the methodology by Stohl and James [37,38]. FLEXPART is supported by a large number of peer-reviewed publications [39] and has been validated for the atmospheric branch of the water cycle of major river catchments [38]. The model has also been used to study water vapor transport variability toward several hydrologic basins, such as the Amazon [40], Niger River basin [41] or the Danube river basin [42], among others.
FLEXPART generates the trajectories of a large number of particles (2 million) into which the atmosphere is divided; each particle moves by using a three-dimensional wind field with a constant mass. FLEXPART uses meteorological data from the European Centre for Medium-Range Weather Forecasts (ECMWF) [43] every 6 h with a 1° × 1° resolution on 60 vertical levels to calculate the grid-scale advection. To determine moisture sources and sinks, the position of each particle is tracked backward or forward, respectively, in combination with the particle loss of specific humidity by precipitation (p) or gain by evaporation (e). The (E–P) differences of all particles in a column are amassed, and then the total (E–P) field is obtained, where (E) is the evaporation rate and (P) the precipitation rate per unit area. This method therefore diagnoses E–P, but not E or P individually [37].
In this work, the trajectories were followed in backward mode, which means that we were interested in determining the origin of the humidity over the BRB. By integrating the changes of all particles aimed towards the BRB region, we found the areas where those particles had either gained (E–P > 0) or lost moisture (E–P < 0) along their path. We limited the transport to 10 days as this is the optimal particle travel time for the BRB region during our study period using the database by Nieto and Gimeno [44]. Then, a general view of the moisture sources was attained by adding the net freshwater flux from day −1 to day −10, ((E–P)1–10 from now on). When a long enough period is analyzed, the mean moisture sources for the region can be described from a climatological perspective.

2.3. Climatic Fields Data

The COBE (Centennial in situ Observation-Based Estimates) SST v2 monthly dataset was used from 1980 to 2017 [45,46] at 1° latitude × 1° longitude spatial resolution. COBE incorporates ICOADS (International Comprehensive Ocean-Atmosphere Data Set) data [47] and includes some additional observational datasets mainly for recent periods.
ERA-Interim reanalysis monthly means of horizontal wind, vertically integrated moisture flux, geopotential height and vertical velocity (omega) at several tropospheric levels [43] were used for the period 1980 to 2017 at a 1° resolution in longitude and latitude. In addition, temperature and relative humidity were obtained from the same reanalysis database. These variables were employed to compute the equivalent potential temperature (θE) according to Equation (38) in [48], allowing us to assess the moisture content and thermal properties of the air column.
Seasonal anomalies were computed with respect to the climatology of May 1981–October 2010, referred to hereafter as 1981–2010 climatology.

3. Results

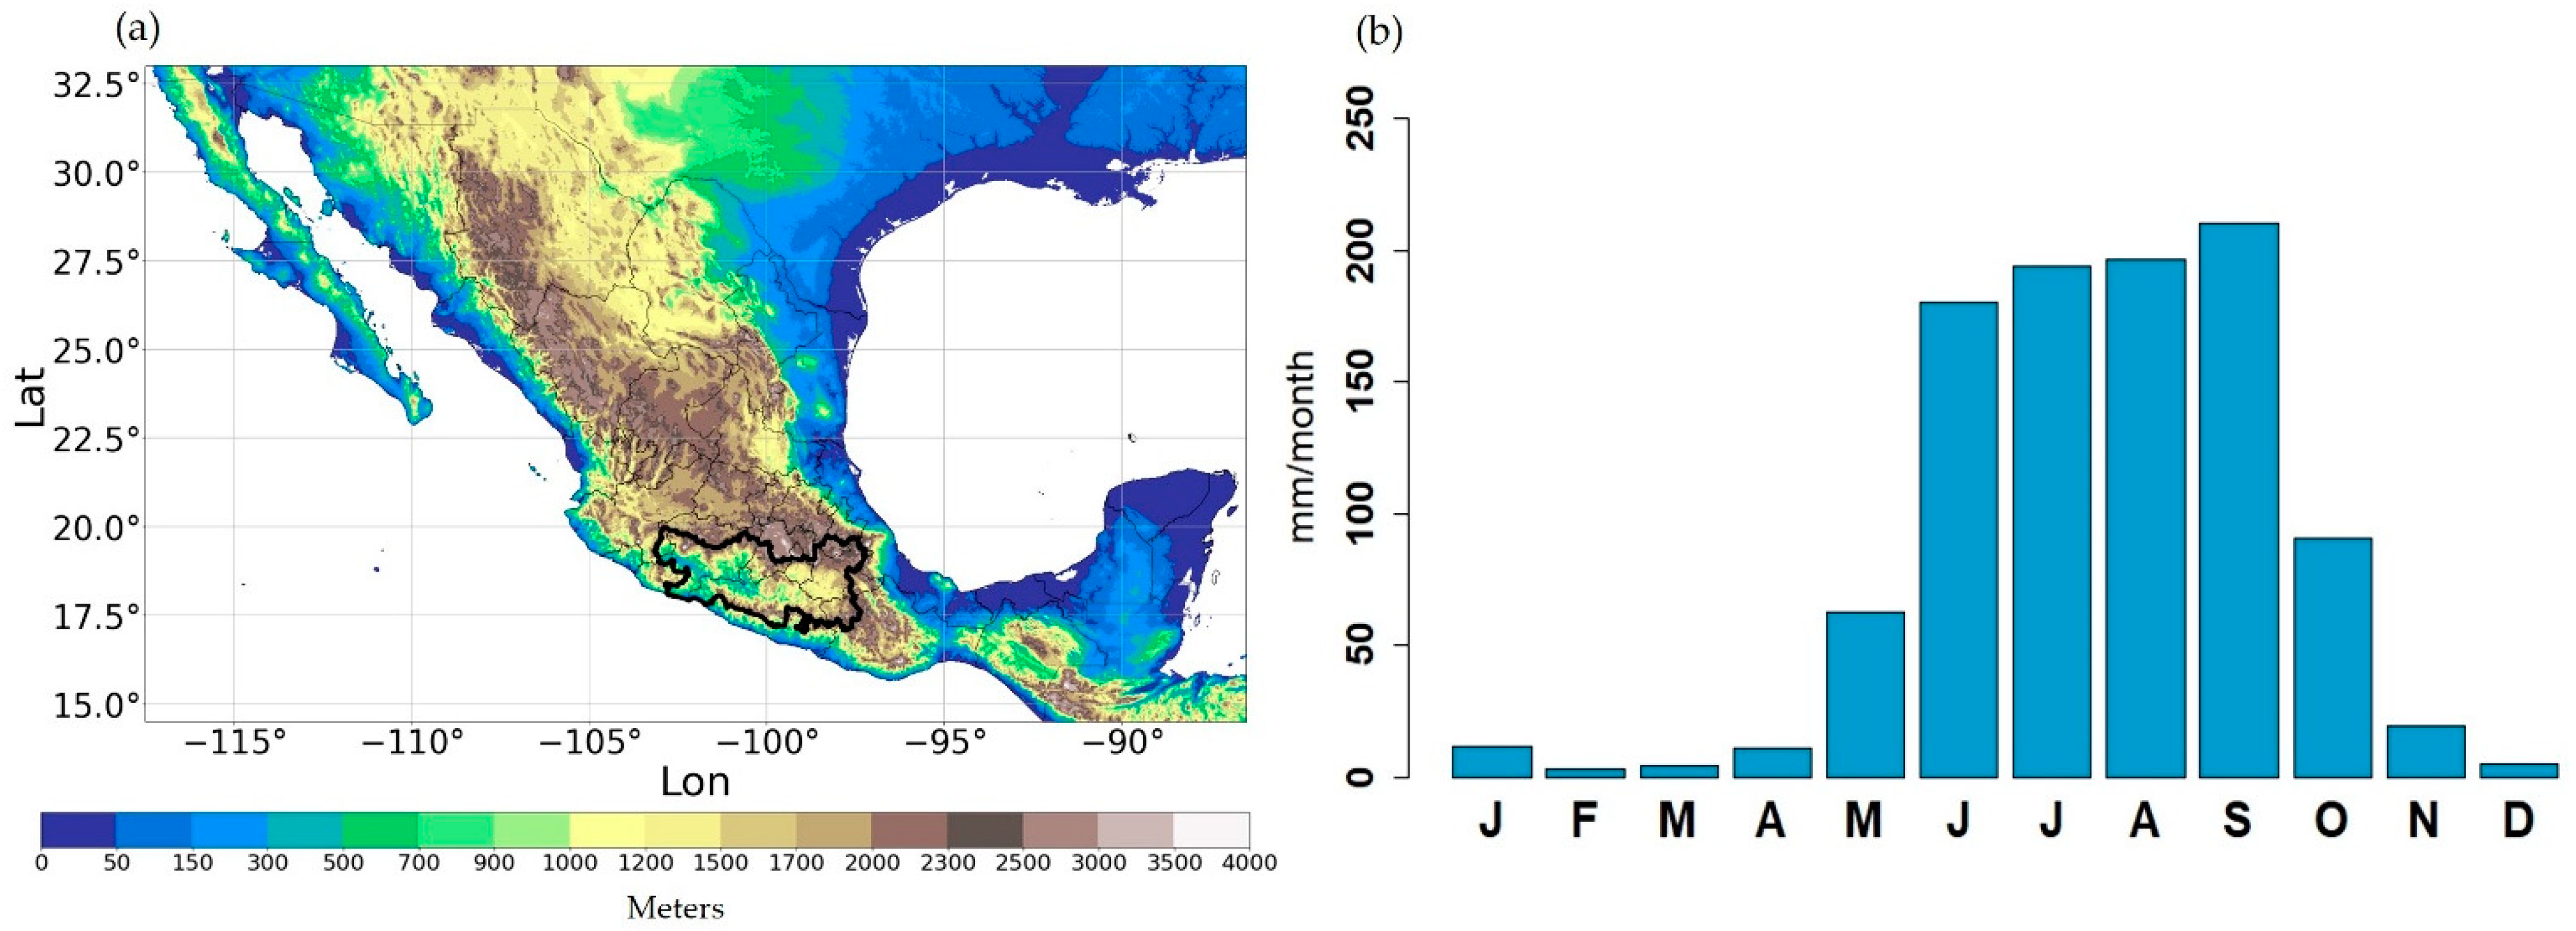
3.1. Drought Characteristics during the Period of 1980–2017

The temporal variation of SPI-6 and SPEI-6 in October for the period 1980–2017 is depicted in Figure 2. Both indices are very similar, with the Pearson correlation coefficient between them being ρ = 0.99, and both match the same dry periods. This indicates that the contribution of precipitation deficits to the drought severity in the BRB prevails over the temperature excess, unlike other regions, such as the Mediterranean region, where the increase in the atmospheric evaporative demand driven by increasing temperatures in the last decades has enhanced droughts, independently of the precipitation evolution in the region [49,50]. In fact, the link between droughts and heat waves is widely known: high temperatures accelerate soil drying and dry soils in turn warm the atmosphere by retaining less water for evapotranspiration [51]. Studies examining the coupling between the land surface and extreme temperature have shown that the soil moisture/temperature relationship is geographically widespread [52]. This area of research has held a predominant European focus [51]. For example, it is known that the intensity of the 2003 heatwave was increased by dry conditions by up to 40% [53,54], while the record-breaking drought that affected Europe in 2016/2017 has been found to have been caused by decreased precipitation and increased sunshine duration in the northern part, whereas the main contributors to the drought in the south were thermodynamic processes, mostly associated with high temperatures [55].
According to [28], the intensity of a drought event is arbitrarily defined for values of the SPI with the following categories: mild drought if 0 ≤ SPI ≤ −0.99, moderate drought if −1.00 ≤ SPI ≤ −1.49, severe drought if 1.50 ≤ SPI ≤ −1.99 and extreme drought for SPI ≤ −2. Recent studies—e.g., [42,56,57,58,59]—classified drought events with identical thresholds for SPEI and SPI. Therefore, we identified seven moderate to extreme events in the years 1982, 1986, 1987, 1994, 1997, 2005 and 2009.
Table 1 summarizes the main characteristics of these drought events, including the year and average intensity, based on SPEI-6 and the number of months with meteorological drought and the driest months based on SPEI-1 (in bold letter). As mentioned before, SPI values are very similar and they are not shown. The year 1982 is identified as the year with the most intense drought episode for the study period. All episodes had meteorological droughts with a duration of roughly 4 months. June was the peak month for 2005 and July was the peak month for 1986, 1994 and 2009. The droughts of 1982 and 1997 peaked in August, and that of 1987 peaked in October. It is interesting to mention that five of these top-seven drought events occurred during El Niño - Southern Oscillation (ENSO) warm phases (1982, 1987, 1994, 1997, 2009) being three of them during strong El Niño years (1982, 1987, 1997). The other two drought events developed under ENSO neutral conditions (1986, 2005). It is widely accepted that dry conditions prevail in the southern part of Mexico during El Niño summers, and wetter conditions dominate during La Niña throughout the American tropical regions including southern parts of Mexico [60,61,62].
Severe and extreme drought events that occurred in the period 1980–2017 were selected for analysis in this study, corresponding to events in 1982 and 2005. The spatial representations of SPEI-6 values in October for these two episodes show different patterns (Figure 3). During 1982 (Figure 3a), drought conditions covered an extensive area over central Mexico, and wet conditions remained confined over Baja California and a portion of the Yucatan Peninsula. By contrast, in 2005 (Figure 3b), the eastern coast of central Mexico and the north–central part of the country also showed wet conditions. Both episodes were particularly severe over the BRB.

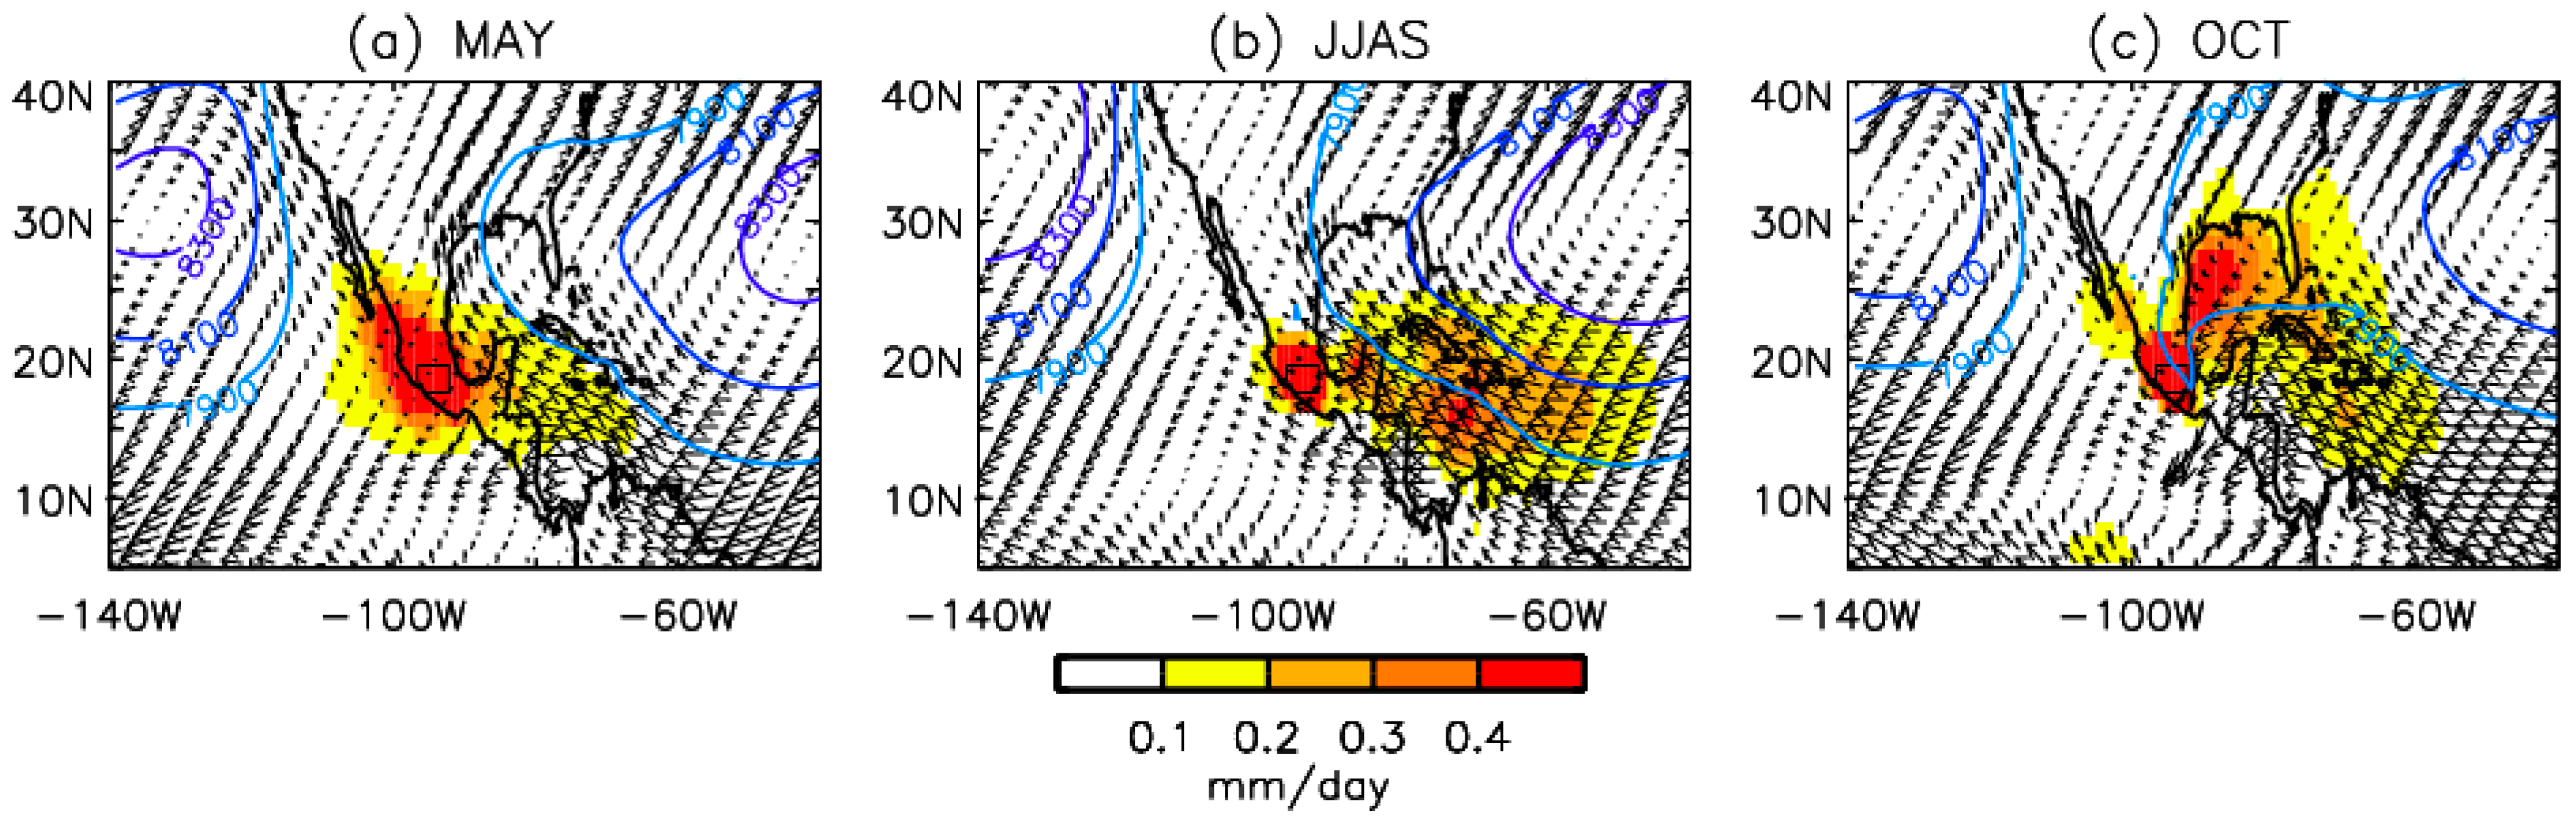
3.2. Water Vapor Transport toward the Balsas River Basin

To better understand the origin of the precipitation deficits, we analyzed the anomalies of moisture transport toward the BRB during the drought events. Figure 4 shows the sum of (E–P)n > 0 up to 10 days (n = 1, …, 10) before an air mass that moved towards the BRB reached the area ((E–P)1–10 > 0 from now on) from May to October for the study period 1980–2017. Figure 4 also depicts the vertically integrated moisture flux (VIMF) and geopotential height isolines at 925 hPa for the same study period and the same months. In May, positive water vapor values were found in the northern and north-western BRB along the Pacific coast (Figure 4a), linked to the circulation of the North Pacific Subtropical High (NPSH). A smaller amount of moisture arrived following the Caribbean Low-Level Jet (CLLJ) region. From June to September (JJAS) the distribution of water vapor fluxes during each month was fairly similar; therefore, the 4 month average is shown in Figure 4b. The NPSH system moved northwestward, the influence of the North Atlantic Subtropical High (NASH) on the Caribbean was stronger and the trade winds intensified along its southern flank. Particles transporting moisture spread from the Yucatan Peninsula to the Caribbean Sea, extending to the tropical North Atlantic Ocean. Our results confirm that the CLLJ core south of the Greater Antilles [63,64] is an important moisture source for the BRB during boreal summer (Figure 4b), as pointed out by other previous research works [62,65]. During October, the NASH migrates north-eastward, and its western flank causes more water vapour to arrive to the BRB from the north of the Gulf of Mexico (Figure 4c). From May to October (Figure 4a–c), evaporation clearly dominates over precipitation in the air masses located over the basin itself and the surrounding areas.
To quantify water vapor contributions, it is necessary to define the moisture source regions independently. The threshold of the 95th percentile of the (E–P)1–10 > 0 values averaged from May to October during the study period (1980–2017) was used to delimit the source regions in which the water vapor recharge was most intense. Seven main moisture sources that were potentially important for precipitation development over BRB were defined (Figure 5a), comprising four oceanic and three terrestrial sources. The moisture arriving from the ocean was divided into four regions: the Caribbean Sea (CAR), the Gulf of Mexico (GOM), the rest of the tropical Atlantic (ATL) and the Pacific (PAC) from the west. The terrestrial evaporative moisture source regions were classified into three categories: north of the BRB (NORTH), the southern BRB region including the Yucatan Peninsula (SOUTH), and finally the BRB itself (BRB). The monthly evolution of (E–P)1–10 > 0 integrated over these seven areas is shown in Figure 5b. As expected, the evaporative source of BRB itself is highly significant, representing by far the main atmospheric moisture source during the wet season (note that the y-axis of Figure 6b is in a logarithmic scale). NORTH is the second moisture source during the beginning (May) and the end (October) of the wet season. However, from June to September, the contributions of SOUTH and CAR are slightly higher.
According to these results, the importance of the available moisture in the atmosphere of the BRB itself must be decisive compared with the rest of the moisture sources. For simplicity, we limited the analysis to the source regions delineated by the 99.5th percentile of the (E–P)1–10 > 0 values (black contours in Figure 5a). Three moisture sources were obtained: the terrestrial evaporative source of the BRB, the Yucatan Peninsula inner SOUTH and the central area of CAR.
The above moisture sources show interannual variability. The bars in Figure 6 represent the accumulated monthly anomalies of the water vapor supplied by these three moisture sources (BRB: blue, SOUTH: pink and CAR: red; black solid lines in Figure 5a) for the severe and the extreme drought events that occurred in the period 1980–2017. In 1982 (Figure 6a), unexpected positive anomalies of moisture supplies were found for the three sources during the 6 months, including the month of August, when the peak value of SPEI-1 occurred (see Table 1). In contrast, during 2005 (Figure 6b), all source regions showed lower contributions compared with the climatological mean; therefore, the lack of water vapor was associated with precipitation deficits. It is worth pointing out that the large-scale circulation variability in local BRB conditions was far more important than the moisture transport variability from the other two top-contributing external sources, SOUTH and CAR. To explain the drought signal in 1982 despite the positive anomalies found in moisture transport, we also analyzed the evolution of omega anomalies at 500-hPa averaged over the BRB area (Figure 6a). This drought event was associated with positive anomalies of omega from June to October, indicating a general meteorological pattern of subsidence that inhibits the upward movement needed to generate precipitation. In 2005, besides the negative anomalies of water vapor transport found, subsidence was also present at a 500 hPa level over the basin during most of the months.

3.3. Climatic Fields Anomalies during the Droughts of 1982 and 2005

A more detailed examination of the underlying causes of moisture advection and subsidence anomalies during the droughts of 1982 and 2005 could be performed through the assessment of the atmospheric circulation and vertical motions.

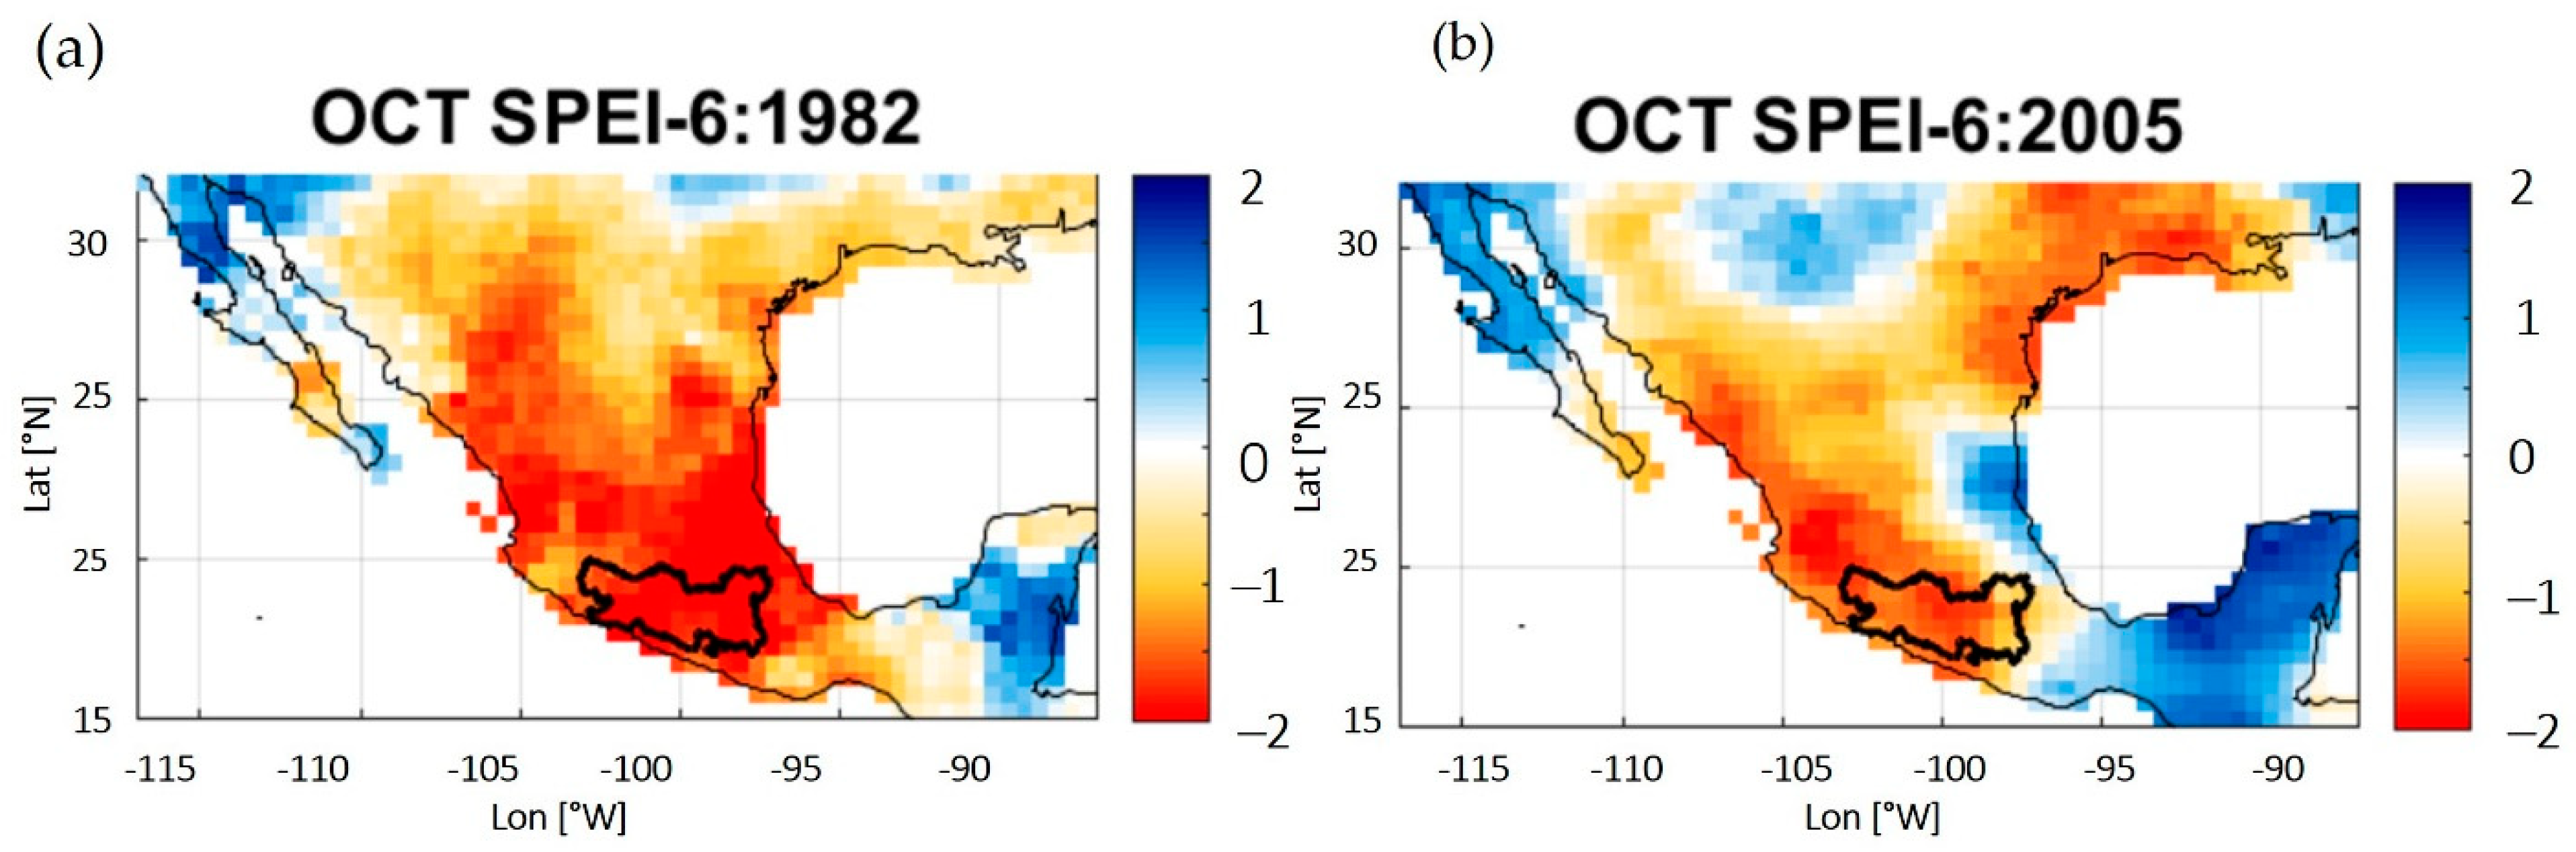
3.3.1. Drought Event in 1982

Anomalies of horizontal wind at 850 hPa and SST for the drought of 1982 are shown in Figure 7a. The SST pattern shows El Niño-like conditions over the tropical Pacific Ocean (Figure 7a). SST anomalies over the eastern tropical Pacific and those over the tropical North Atlantic (TNA) showed opposite signs. The SST gradients between the tropical Pacific and the TNA favor a stronger southern branch of the CLLJ via Walker circulation [66]. Other authors have previously shown similar results; that is, a strong southern branch of the CLLJ occurring in conjunction with warm Pacific SST anomalies and cold SST anomalies in the TNA [64,66,67,68,69,70,71,72,73]. This configuration favors greater moisture transport toward the BRB, although it is important to keep in mind that CLLJ is a secondary moisture source for the BRB, as stated in the previous section.
Negative vertical velocity (upward movement, in green) anomalies at 600 hPa (Figure 7b) were found over the southern part of the Pacific Inter Tropical Convergence Zone (ITCZ—the ITCZ is marked approximately by the blue line in Figure 7b). Positive anomalies (subsidence, in pink) were present in the Atlantic ITCZ and northern South America. Over the northern areas of the eastern Pacific ITCZ, positive anomalies were also present and reached the BRB region, which is consistent with a southward displacement of the Pacific ITCZ. Other authors have shown similar results for El Niño years. For example, global ENSO-altered Walker and Hadley circulations have been shown by analyzing atmospheric reanalysis products [74,75], with the eastern Pacific ITCZ moving closer to the equator during El Niño summers. Intense convection in the eastern tropical Pacific around 5°N has been reported to produce an intense regional Hadley cell with anomalously strong subsidence over Mexico that inhibits the development of deep convective activity [43]. Nevertheless, it is unclear how an increase of moisture and simultaneous subsidence over the BRB can be compatible.
The Atlantic trade wind areas are sometimes dominated by extensive inversions that form in the descending branches of the Hadley circulation, resulting from the interaction between this large-scale subsiding air and convection-driven rising air from the lower levels [76,77,78,79]. Trade wind inversions (TWIs) limit vertical development, confining the humidity in the lower levels. Criteria for inversion identification have been traditionally based on temperature, relative humidity and mixing ratio profiles in tropical and subtropical areas [78]. Equivalent potential temperature (θE) profiles have been recently used to capture the signature of TWIs in Puerto Rico [25,80]. Figure 8 depicts the 1982 seasonal anomalies of θE, temperature and relative humidity profiles averaged over the BRB region. The value of θE sharply decreases with height from 850 to 500 hPa due to the strong decrease in relative humidity with height compared with the subtle increase in temperature across the inversion. To the best of our knowledge, no previous studies of TWIs exist in Mexico, making it difficult to assess the intensity of this seasonal mean inversion. IN comparison with the Caribbean, where the strength of the inversions during July ranges between 0.5 to 1.0 °C [76], the mean value of ΔT = 0.2 °C (Figure 8) seems to be weak. Therefore, it could be possible that this TWI should allow some cloud development to produce moderate rains that weaken rapidly by the entrainment of dry air due to subsidence in the free troposphere [25]. Anomalies of relative humidity are positive below 700 hPa, which is consistent with the increase in the column content of moisture diagnosed by FLEXPART. Anomalous subsidence prevailed over the BRB in almost all vertical levels during almost all seasons (Figure 8) except May, as also shown in Figure 6a for the mid troposphere.
In summary, in 1982, despite a higher moisture contribution, convection was inhibited further over the BRB, leading to precipitation deficits. The reason was the development of a southern and intense ITCZ over the eastern tropical Pacific, producing an anomalous ascent that resulted in a strengthened regional Hadley circulation to the north. The anomalous Hadley circulation generated stronger subsidence over the BRB, inhibiting the development of deep convection. However, a greater moisture content was trapped below an anomalous trade wind inversion.
ENSO provides a clear connection with the position of the ITCZ in the equatorial eastern Pacific, typically migrating southward from its northerly position during El Niño events [74,81]. Five of the seven moderate to extreme drought events identified in the present work took place under El Niño conditions, suggesting the ENSO index to be a useful predictor of droughts over the BRB. However, over the past two decades, El Niño events have weakened, and their SST anomalies have shifted westward towards the central Pacific, impeding southward migration toward the Equator of the ITCZ [82]. In fact, although the 2015 event was classified as canonical El Niño, this event exhibited several features distinct from the previous strong El Niño, and the eastern Pacific ITCZ failed to cross south of the Equator even at the El Niño peak. Despite the large magnitude of the 2015 event, the drought over the BRB did not reach the category of moderate (see Figure 2). How ENSO phenomenon should change with anthropogenic warming is still an ongoing research [83].

3.3.2. Drought Event in 2005

Regarding the 2005 wet season (Figure 9a) the most significant signal was that SST anomalies over the Caribbean Sea and the TNA were high (>0.8 °C). Negative anomalies of low-level wind over the CLLJ core and a cyclonic circulation over the Gulf of Mexico were evident, inhibiting the water transport from the CAR region, which is in agreement with the lower moisture over BRB, SOUTH and CAR found during this drought event in the previous section.
High SST anomalies (Figure 9a) over the TNA increase the atmospheric water vapor content and are critical to promote disturbances that can develop into tropical storms. Consistently, positive vertical velocity anomalies (upward motion) over the Caribbean Sea and the TNA are found in Figure 9b. In fact, the 2005 Atlantic hurricane season was the most active on record until the 2020 season, which exceeded that season [84]. The year 2005 also reached the highest SST anomalies (0.9 °C) and the largest numbers of named storms and hurricanes recorded [85].
Figure 9b also shows negative geopotential height anomalies at 850 hPa (red lines) and positive anomalies at 200 hPa (blue lines) north of the convective regions (green contours). These anomalies are consistent with Gill’s model of off-equatorial heating [86], whose solution is a Rossby wave propagating westward from the forcing region with negative/positive pressure anomalies at the lower/upper levels. Gill’s model also explains the occurrence of subsidence elsewhere around the rising motion associated with the warming region.
Finally, it is also necessary to mention that, in this case, we found inter-monthly variations of θE profiles, with TWI-like profiles in May, June and September driven by large-scale subsidence (Figure 6b), and these types of profiles were not observed during July, August and October (figures not shown).
As an overview, the 2005 drought was mainly associated with a reduced moisture supply from the main sources. A cyclonic circulation over the Gulf of Mexico resulted from the atmospheric response to a Caribbean Sea-persistent SST heating anomaly and prevented the moisture from reaching the BRB. Besides this water vapor scarcity, general subsidence took place over the BRB during the majority of the months, also inhibiting potential convection.
Data from observations and model simulations suggest that there is little historical precedent for the 2005 SST event [87]. The contribution of natural climate variability and anthropogenic forcing to this key event has been evaluated. The interaction of three independent climate teleconnections has been related to this anomalously high SST in the southern Caribbean [88], tropical North Atlantic (TNA), Atlantic multidecadal oscillation (AMO) and Atlantic meridional mode (AMM) climate indices. Donner et al. [88] found that thermal stress reaching the 2005 level would be extremely rare without any anthropogenic forcing. In this case, in contrast with the mechanism promoting the 1982 drought, the influence of global warming provides a background level that increases the risk of future drought events similar to that in 2005.

4. Summary and Conclusions

In this paper, the 6 month standardized precipitation–evapotranspiration index (SPEI-6) in October and the 6 month standardized precipitation index (SPI-6) in the same month were used to identify and rank drought episodes over the Balsas River Basin (BRB) from 1980 to 2017. According to the classification of McKee et al. [28], drought events were classified into mild, moderate, severe and extreme, and the most intense events (severe and extreme) were selected for study. The anomalies in moisture supply during the selected drought periods were evaluated by using a Lagrangian approach. Finally, climatic fields at several levels were analyzed in order to investigate the physical mechanisms of severe drought occurrence. The main conclusions of this study are summarized as follows:
  • The evolution of SPEI-6 and SPI-6 averaged over the BRB are quite similar during the studied period, suggesting a larger contribution of precipitation deficit than temperature excess to the drought occurrence.
  • Two major drought events—one severe (2005) and another of extreme intensity (1982)—were found in the period 1980–2017. The differences between the spatial patterns obtained by both indices (SPEI-6 and SPI-6) were much reduced, confirming the important role of precipitation in these two events vs. atmospheric evaporative demand driven by temperature increase in the Mexican territory.
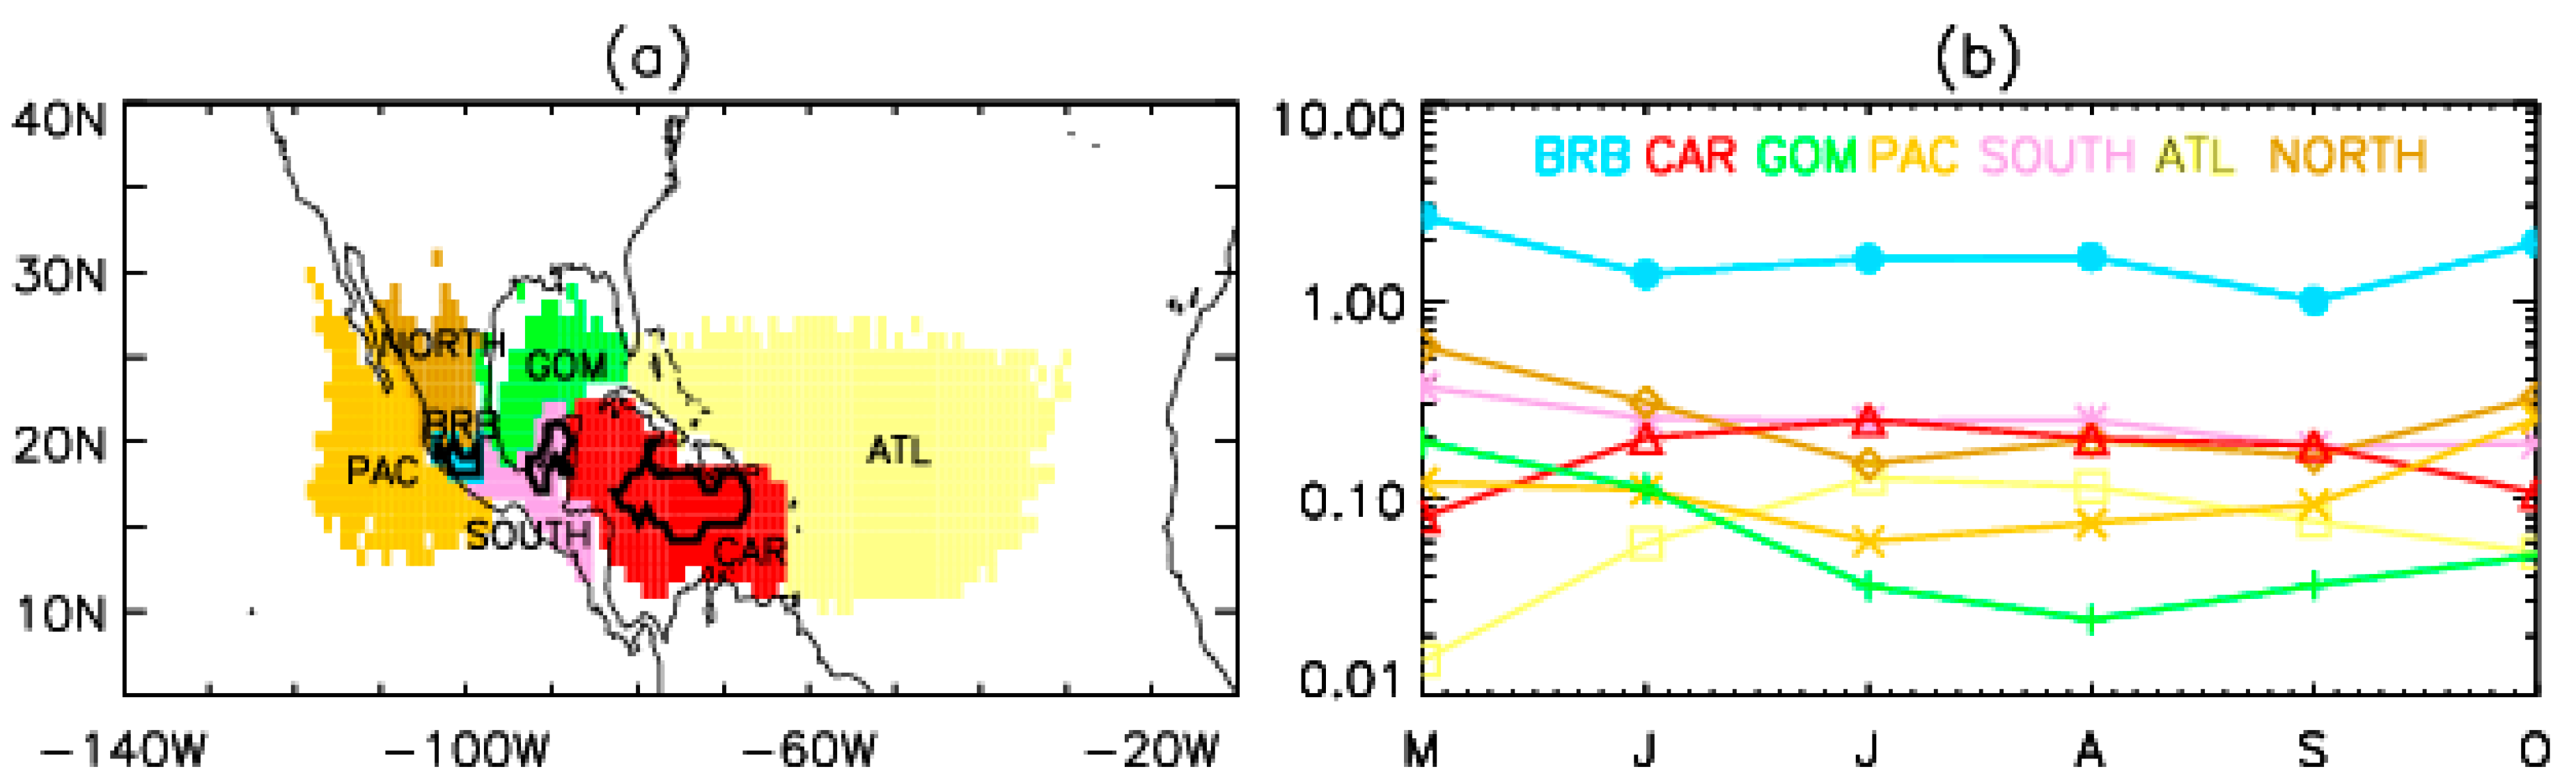
  • The main moisture sources during the wet season (May–October) for the BRB were identified. The terrestrial evaporative source of BRB itself was shown to be by far the main moisture source during the entire wet season, followed by the southern BRB terrestrial region and the Caribbean Low-Level Jet (CLLJ) core region, which are more active from June to September.
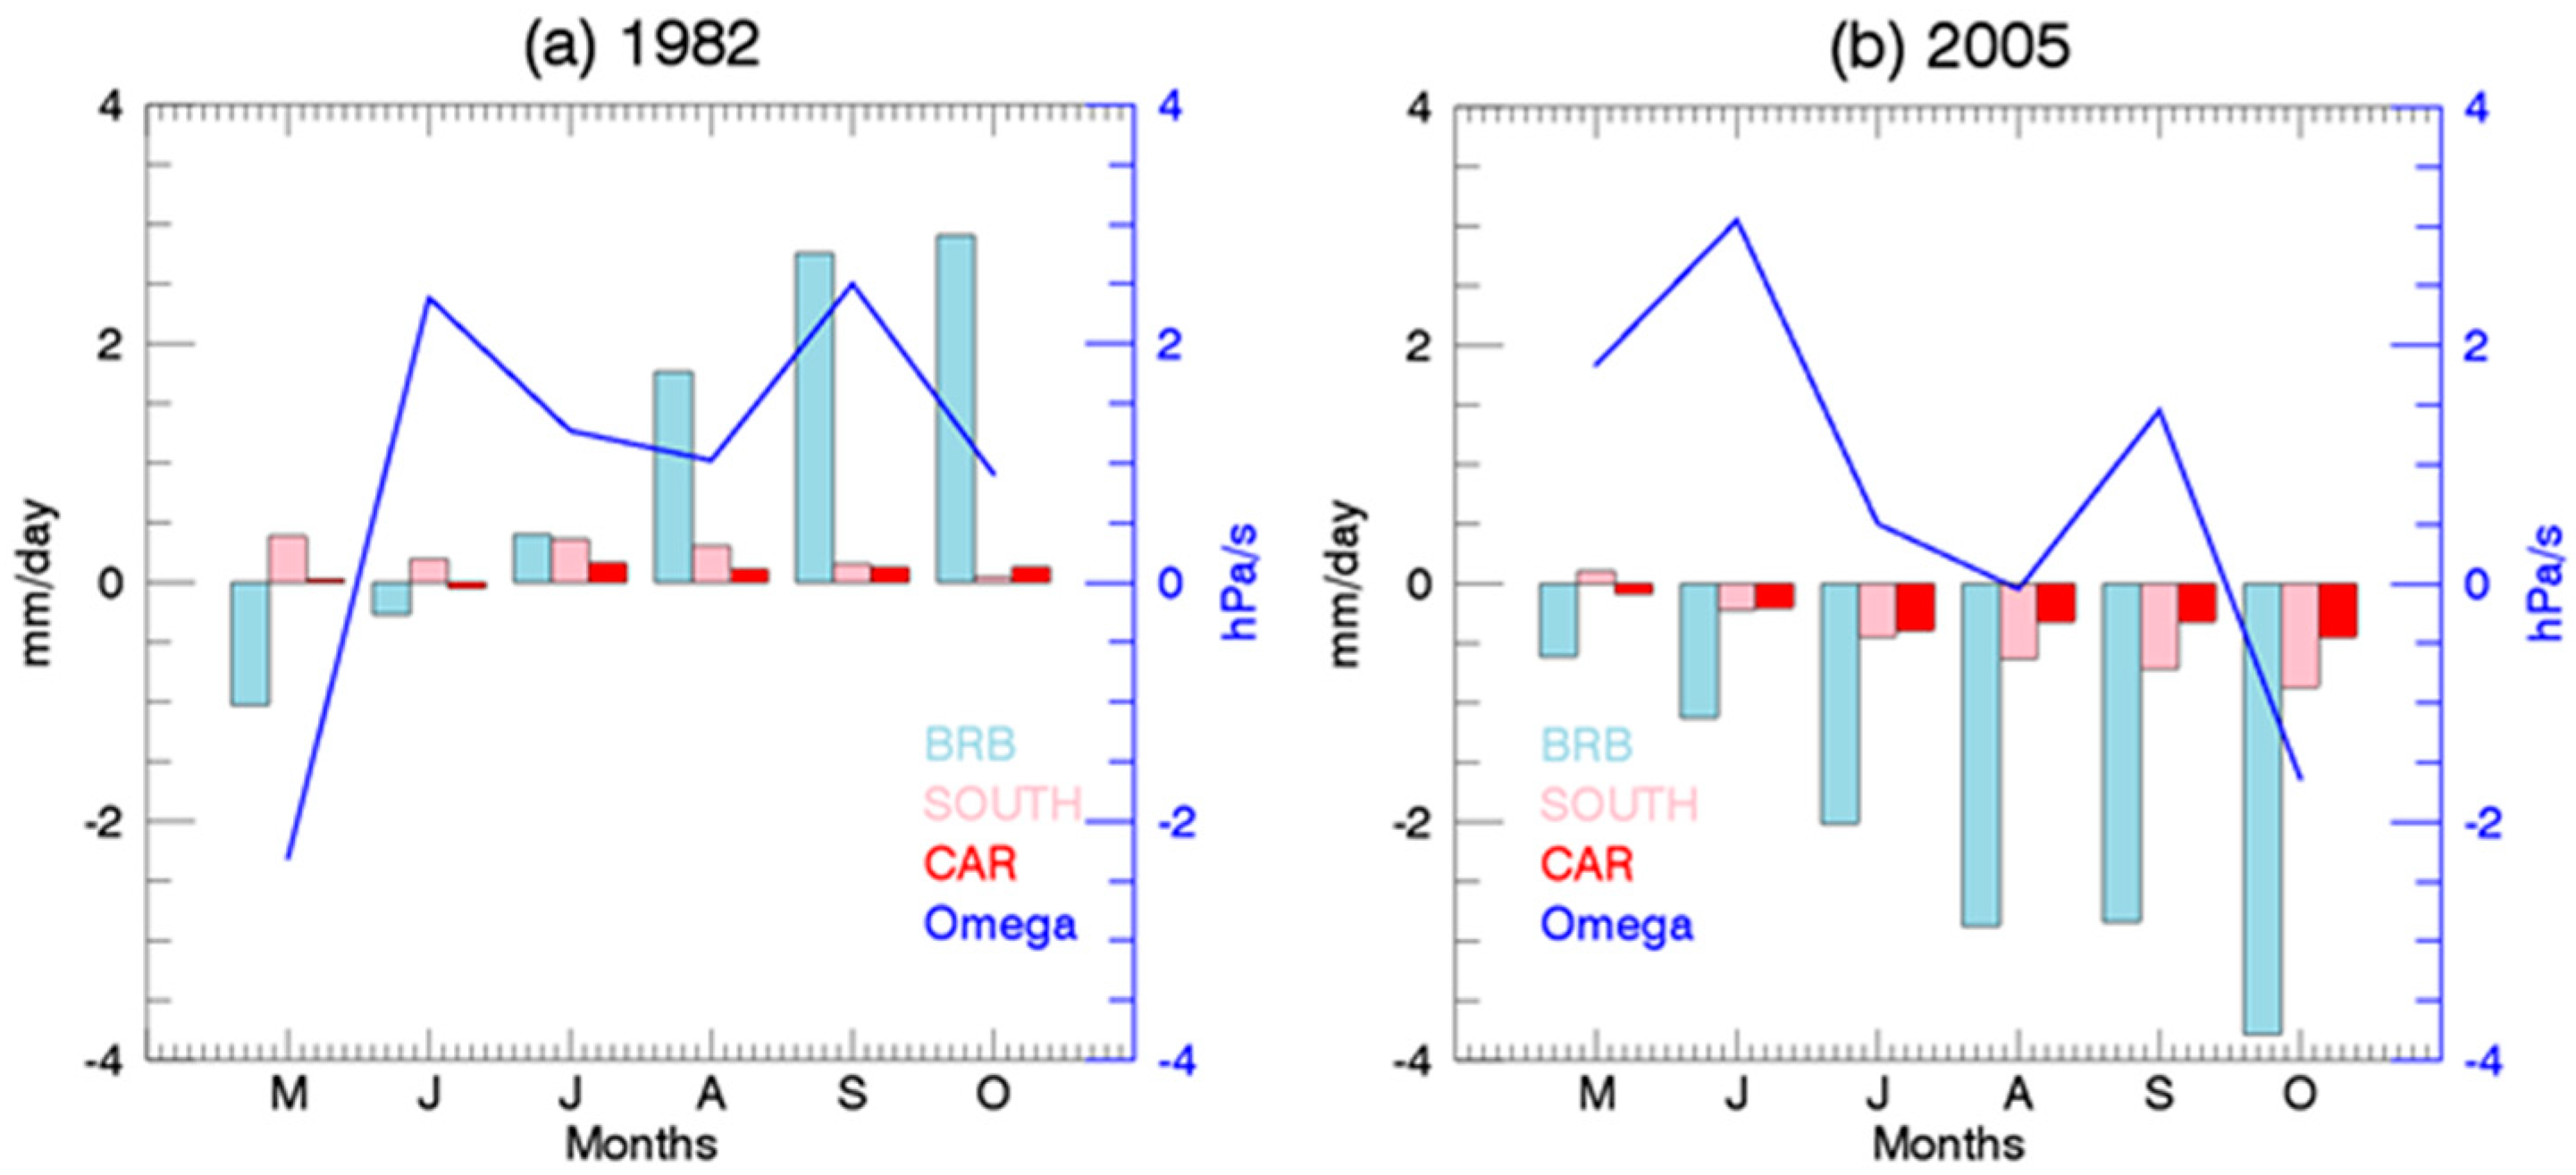
  • During the drought event of 2005, an anomalously warm SST emerged over the Caribbean Sea. A persistent elevated SST over the Atlantic warm pool favored hurricane activity during this year. As a response to this heating, lower-level negative pressure anomalies and upper tropospheric positive pressure anomalies developed to the northwest, consistent with Gill’s model. As a consequence of the lower level cyclonic circulation over the Gulf of Mexico, negative anomalies of the CLLJ winds arose, and the BRB itself, CLLJ and SOUTH provided a decreased water vapor contribution. Additionally, this drought event was associated with subsidence that also prevented convection over the BRB in four of the six months.
  • The mechanisms associated with the the top drought event, which occurred in 1982, were also determined. An intense and southward-shifted Inter Tropical Convergence Zone (ITCZ) over the eastern tropical Pacific produced an intense regional Hadley circulation that generated anomalously strong subsidence over the BRB. This descent branch of the Hadley cell inhibited the development of deep convection, although this drought episode was concurrent with an increase in the moisture supply. A strong trade wind inversion (TWI) driven by this large-scale subsiding air from the upper troposphere confined the moisture content in the lower layers.
A better understanding of drought causes is clearly of major scientific and social value. This work identifies the underlying physical mechanisms behind severe droughts in the BRB and generates an understanding that may help to address the major challenge of their prediction. Seasonal forecasts of severe droughts would give an advance warning to manage the detrimental impacts on crops, livestock farming and household food insecurity associated with a decline in production. An additional knowledge of the water-hydroelectric supply nexus in combination with seasonal forecasts of droughts in the BRB would also give the opportunity to manage drought impacts in the energy sector early. Finally, Mexico’s vulnerability to drought by climate change has been highlighted in the literature. This work presents a starting point to study the evolution of physical mechanisms causing droughts in a changing environment.

Author Contributions

L.G., R.N. and P.O. conceived and designed the experiments. A.E.M. developed the formal analysis. A.E.M. and P.O. prepared the original draft. R.N., C.P.-O., R.G.-H. reviewed and edited the manuscript. All authors have read and agreed to the published version of the manuscript.

Funding

This research was funded by the project PAPIIT (DGAPA-UNAM) IN116120 “Caracterización climática y sinóptica de las olas de calor en México”. EPhysLab is partially funded by Xunta de Galicia under the project “Programa de Consolidación e Estructuración de Unidades de Investigación Competitivas (Grupos de Referencia Competitiva)” (no. ED431C 2017/64-GRC), co-funded by the ERDF, in the agenda of the Operational Program Galicia 2014–2020.

Institutional Review Board Statement

Not applicable.

Informed Consent Statement

Not applicable.

Data Availability Statement

Not applicable.

Conflicts of Interest

The authors declare no conflict of interest.

References

  1. Sheffield, J.; Wood, E.F. Drought: Past Problems and Future Scenarios; Earthscan Publications Ltd.: London, UK, 2011. [Google Scholar]
  2. Trigo, R.M.; Gouveia, C.M.; Barriopedro, D. The intense 2007–2009 drought in the Fertile Crescent: Impacts and associated atmospheric circulation. Agric. For. Meteorol. 2010, 150, 1245–1257. [Google Scholar] [CrossRef]
  3. Lewis, S.; Brando, P.; Phillips, O.; van der Heijden, G.; Nepstad, D. The 2010 Amazon Drought. Science 2011, 331, 554. [Google Scholar] [CrossRef]
  4. McGrath, G.S.; Sadler, R.; Fleming, K.; Tregoning, P.; Hinz, C.; Veneklaas, E.J. Tropical cyclones and the ecohydrology of Australia’s recent continental-scale drought. Geophys. Res. Lett. 2012, 39, L03404. [Google Scholar] [CrossRef] [Green Version]
  5. Hoerling, M.; Kumar, A.; Dole, R.; Nielsen-Gammon, J.W.; Eischeid, J.; Perlwitz, J.; Quan, X.-W.; Zhang, T.; Pegion, P.; Chen, M. Anatomy of an Extreme Event. J. Clim. 2012, 26, 2811–2832. [Google Scholar] [CrossRef]
  6. Palmer, W.C. Meteorological Drought; US Department of Commerce Weather Bureau Research Paper No. 45; U.S. Weather Bureau: Washington, DC, USA, 1965.
  7. Wehner, M.; Easterling, D.R.; Lqwrimore, J.H.; Heim, R.R., Jr.; Vose, R.S. Projections of Future Drought in the Continental United States and Mexico. J. Hidrometeorol. 2011, 12, 1359–1377. [Google Scholar] [CrossRef]
  8. Wu, H.; Hayes, M.J.; Wilhite, D.A.; Svoboda, M.D. The effect of the length of record on the standardized precipitation index calculation. Int. J. Climatol. 2005, 25, 505–520. [Google Scholar] [CrossRef] [Green Version]
  9. Orlowsky, B.; Seneviratne, S.I. Elusive drought: Uncertainty in observed trends and short-and long-term CMIP5 projections. Hydrol. Earth Syst. Sci. 2013, 17, 1765–1781. [Google Scholar] [CrossRef] [Green Version]
  10. Ibarrarán, M.E.; Malone, E.L.; Brenkert, A.L. Climate change vulnerability and resilience: Current status and trends for Mexico. Environment. Dev. Sustain. 2010, 12, 365–388. [Google Scholar] [CrossRef]
  11. Seneviratne, S.I.; Nicholls, N.; Easterling, D.; Goodess, C.; Kanae, S.; Kossin, J.; Luo, Y.; Marengo, J.; McInnes, K.; Rahimi, M.; et al. Changes in climate extremes and their impacts on the natural physical environment. In Managing the Risks of Extreme Events and Disasters to Advance Climate Change Adaptation. A Special Report of Working Groups I and II of the Intergovernmental Panel on Climate Change (IPCC); Field, C.B., Barros, V., Stocker, T., Qin, D., Dokken, D., Ebi, K., Mastrandrea, M., Mach, K., Plattner, G.-K., Allen, S., et al., Eds.; Cambridge University Press: Cambridge, UK; New York, NY, USA, 2012; pp. 109–230. [Google Scholar]
  12. Ortega-Gaucin, D.; Velasco, I. Aspectos socioeconómicos y ambientales de las sequías en México. Aqua-LAC 2013, 5, 78–90. [Google Scholar] [CrossRef]
  13. Kim, T.-K.; Jehanzaib, M. Drought Risk Analysis, Forecasting and Assessment under Climate Change. Water 2020, 12, 1862. [Google Scholar] [CrossRef]
  14. CONAGUA. Situación de los Recursos Hídricos. Available online: http://sina.conagua.gob.mx/sina/tema.php?tema=regionesHidrologicas (accessed on 4 January 2021).
  15. Harris, I.; Jones, P.D.; Osborn, T.J.; Lister, D.H. Updated high-resolution grids of monthly climatic observations–the CRU TS3. 10 Dataset. Int. J. Climatol. 2014, 34, 623–642. [Google Scholar] [CrossRef] [Green Version]
  16. Ortiz Pérez, M.A.; Hernández Santana, J.R.; Figueroa Mah Eng, J.M. Cambios de la línea costera en el delta del río Balsas, Pacífico mexicano, entre los años 1943–2009. Investig. Geogr. 2017, 94, 1–17. [Google Scholar] [CrossRef]
  17. CONAGUA. Estadísticas del Agua en México. Edición 2018; Secretaría de Medio Ambiente y Recursos Naturales: Ciudad de México, México, 2018; p. 303. [Google Scholar]
  18. IMTA. Bases Centro Mexicano en Innovación de Energía Hidroeléctrica. In Primera Parte: Infraestructura Hidroeléctrica Actual. Primera Edición; Instituto Mexicano de Tecnología del Agua: Jiutepec, Mexico, 2017; p. 74. [Google Scholar]
  19. CONAGUA. Estadísticas del Agua en la Cuenca del Río Balsas. Primera Edición; Secretaría del Medio Ambiente y Recursos Naturales: Ciudad de México, Mexico, 2010; p. 169. [Google Scholar]
  20. Vive Cuenca del Río Balsas la Peor Sequía de los Últimos 50 Años. Available online: https://agua.org.mx/vive-cuenca-del-rio-balsas-la-peor-sequia-de-los-ultimos-50-anos/ (accessed on 4 January 2021).
  21. IMTA. Atlas de vulnerabilidad hídrica en México ante el cambio climático. In Efectos del Cambio Climático en el Recurso Hídrico de México. Primera Edición; Instituto Mexicano de Tecnología del Agua: Jiutepec, Mexico, 2015; p. 147. [Google Scholar]
  22. Valencia-Vargas, J.C. Desarrollo de la región hidrológica del Balsas mediante la modificación de su veda. Tecnol. Cienc. Del Agua 2015, 6, 81–97. [Google Scholar]
  23. Trejo, I.; Dirzo, R. Deforestation of seasonally dry tropical forest: A national and local analysis in Mexico. Biol. Conserv. 2000, 94, 133–142. [Google Scholar] [CrossRef]
  24. Miller, P.W.; Mote, T.L.; Ramseyer, C.A. An Empirical Study of the Relationship between Seasonal Precipitation and Thermodynamic Environment in Puerto Rico. Weather Forecast. 2019, 34, 277–288. [Google Scholar] [CrossRef]
  25. The Gálvez-Davison Index for Tropical Convection. Available online: https://www.wpc.ncep.noaa.gov/international/gdi/GDI_Manuscript_V20161021.pdf (accessed on 4 January 2021).
  26. Stohl, A.; Hittenberger, M.; Wotawa, G. Validation of the Lagrangian particle dispersion model FLEXPART against large-scale tracer experiment data. Atmos. Environ. 1998, 32, 4245–4264. [Google Scholar] [CrossRef]
  27. Stohl, A.; Forster, C.; Frank, A.; Seibert, P.; Wotawa, C. Technical note: The Lagrangian particle dispersion model FLEXPART version 6.2. Atmos. Chem. Phys. 2005, 5, 2461–2474. [Google Scholar] [CrossRef] [Green Version]
  28. McKee, T.B.; Doesken, N.J.; Kleist, J. The relationship of drought frequency and duration to time scales. In Proceedings of the 8th Conference on Applied Climatology, Anaheim, CA, USA, 17–22 January 1993; Volume 17, pp. 179–183. [Google Scholar]
  29. Guenang, G.M.; Kamga, M. Computation of the Standardized Precipitation Index (SPI) and Its Use to Assess Drought Occurrences in Cameroon over Recent Decades. J. Appl. Meteorol. Climatol. 2014, 53, 2310–2324. [Google Scholar] [CrossRef]
  30. Hayes, M.; Svoboda, M.; Wall, N.; Widhalm, M. The Lincoln declaration on drought indices: Universal meteorological drought index recommended. Bull. Am. Meteorol. Soc. 2011, 92, 485–488. [Google Scholar] [CrossRef] [Green Version]
  31. Vicente-Serrano, S.M.; Beguería, S.; López-Moreno, J.I. A multiscalar drought index sensitive to global warming: The standardized precipitation evapotranspiration index. J. Clim. 2010, 23, 1696–1718. [Google Scholar] [CrossRef] [Green Version]
  32. Vicente-Serrano, S.M.; Van der Schrier, G.; Beguería, S.; Azorin-Molina, C.; Lopez-Moreno, J.I. Contribution of precipitation and reference evapotranspiration to drought indices under different climates. J. Hydrol. 2015, 526, 42–54. [Google Scholar] [CrossRef] [Green Version]
  33. Skøien, J.O.; Bloschl, G. Characteristic space scales and timescales in hydrology. Water Resour. Res. 2003, 39, 1304. [Google Scholar] [CrossRef]
  34. Vicente-Serrano, S.M.; López-Moreno, J.I. Hydrological response to different time scales of climatological drought: An evaluation of the Standardized Precipitation Index in a mountainous Mediterranean basin. Hydrol. Earth Syst. Sci. 2005, 9, 523–533. [Google Scholar] [CrossRef] [Green Version]
  35. Edossa, D.C.; Babel, M.S.; Gupta, A.D. Drought analysis in the Awash river basin, Ethiopia. Water Resour. Manag. 2010, 24, 1441–1460. [Google Scholar] [CrossRef]
  36. Tabrizi, A.A.; Khalili, D.; Haghighi, A.A.K. Utilization of time-based meteorological droughts to investigate occurrence of streamflow droughts. Water Resour. Manag. 2010, 24, 4287–4306. [Google Scholar] [CrossRef]
  37. Stohl, A.; James, P. A Lagrangian analysis of the atmospheric branch of the global water cycle. Part I: Method description, validation, and demonstration for the August 2002 flooding in central Europe. J. Hydrometeorol. 2004, 5, 656–678. [Google Scholar] [CrossRef]
  38. Stohl, A.; James, P. A Lagrangian analysis of the atmospheric branch of the global water cycle. Part II: Moisture transports between Earth’s ocean basins and river catchments. J. Hydrometeorol. 2005, 6, 961–984. [Google Scholar] [CrossRef]
  39. Gimeno, L.; Stohl, A.; Trigo, R.M.; Dominguez, F.; Yoshimura, K.; Yu, L.; Drumond, A.; Duran-Quesada, A.M.; Nieto, N. Oceanic and Terrestrial Sources of Continental Precipitation. Rev. Geophys. 2012, 50, 1–41. [Google Scholar] [CrossRef]
  40. Sorí, R.; Marengo, J.A.; Nieto, R.; Drumond, A.; Gimeno, L. The atmospheric branch of the hydrological cycle over the Negro and Madeira river basins in the Amazon Region. Water 2018, 10, 738. [Google Scholar] [CrossRef] [Green Version]
  41. Sorí, R.; Nieto, R.; Drumond, A.; Gimeno, L. The Niger River Basin Moisture Sources: A Lagrangian Analysis. Atmosphere 2017, 8, 38. [Google Scholar] [CrossRef] [Green Version]
  42. Stojanovic, M.; Drumond, A.; Nieto, R.; Gimeno, L. Moisture transport anomalies over the Danube River basin during two drought events: A Lagrangian analysis. Atmosphere 2017, 8, 193. [Google Scholar] [CrossRef] [Green Version]
  43. Dee, D.P.; Uppala, S.M.; Simmons, A.J.; Berrisford, P.; Poli, P.; Kobayashi, S.; Bechtold, P. The ERA-Interim reanalysis: Configuration and performance of the data assimilation system. Q. J. R. Meteorol. Soc. 2011, 137, 553–597. [Google Scholar] [CrossRef]
  44. Nieto, R.; Gimeno, L. A database of optimal integration times for Lagrangian studies of atmospheric moisture sources and sinks. Sci. Data 2019, 6, 1–10. [Google Scholar] [CrossRef] [Green Version]
  45. Ishii, M.; Shouji, A.; Sugimoto, S.; Matsumoto, T. Objective analyses of sea-surface temperature and marine meteorological variables for the 20th century using ICOADS and the Kobe collection. Int. J. Climatol. 2005, 25, 865–879. [Google Scholar] [CrossRef]
  46. Hirahara, S.; Ishii, M.; Fukuda, Y. Centennial-scale sea surface temperature analysis and its uncertainty. J. Clim. 2014, 27, 57–75. [Google Scholar] [CrossRef]
  47. Woodruff, S.D.; Worley, S.J.; Lubker, S.J.; Ji, Z.; Freeman, J.E.; Berry, D.I.; Brohan, P.; Kent, E.C.; Reynolds, R.W.; Smith, S.R.; et al. ICOADS Release 2.5: Extensions and enhancements to the surface marine meteorological archive. Int. J. Climatol. 2011, 31, 951–967. [Google Scholar] [CrossRef] [Green Version]
  48. Bolton, D. The computation of Equivalent Potential Temperature. Mon. Weather Rev. 1980, 108, 1046–1053. [Google Scholar] [CrossRef] [Green Version]
  49. Peña-Angulo, D.; Vicente-Serrano, S.M.; Domínguez-Castro, F.; Murphy, C.; Reig, F.; Tramblay, Y.; Trigo, R.M.; Luna, M.Y.; Turco, M.; Noguera, I.; et al. Long-term precipitation in Southwestern Europe reveals no clear trend attributable to anthropogenic forcing. Environ. Res. Lett. 2020, 15, 094070. [Google Scholar] [CrossRef]
  50. Vicente-Serrano, S.M.; Domínguez-Castro, F.; Murphy, C.; Hannaford, J.; Reig, F.; Peña-Angulo, D.; Tramblay, Y.; Trigo, R.M.; Mac Donald, N.; Yolanda Luna, M.; et al. Long-term variability and trends in meteorological droughts in Western Europe (1851–2018). Int. J. Climatol. 2021, 41, E690–E717. [Google Scholar] [CrossRef]
  51. Perkins, S.E. A review on the scientific understanding of heatwaves—Their measurement, driving mechanisms, and changes at the global scale. Atmos. Res. 2015, 164–165, 242–267. [Google Scholar] [CrossRef]
  52. Mueller, B.; Seneviratne, S.I. Hot days induced by precipitation deficits at the global scale. Proc. Natl. Acad. Sci. USA 2012, 109, 12398–12403. [Google Scholar] [CrossRef] [Green Version]
  53. Fischer, E.M.; Seneviratne, S.I.; Vidale, P.L.; Lüthi, D.; Schär, C. Soil moisture–atmosphere interactions during the 2003 European summer heat wave. J. Clim. 2007, 20, 5081–5099. [Google Scholar] [CrossRef]
  54. Fischer, E.M.; Seneviratne, S.I.; Lüthi, D.; Schär, C. Contribution of land–atmosphere coupling to recent European summer heat waves. Geophys. Res. Lett. 2007, 34, L06707. [Google Scholar] [CrossRef] [Green Version]
  55. García-Herrera, R.; Garrido-Perez, J.M.; Barriopedro, D.; Ordóñez, C.; Vicente-Serrano, S.M.; Nieto, R.; Gimeno, L.; Sori, R.; Yiou, P. The European 2016/2017 drought. J. Clim. 2019, 32, 3169–3187. [Google Scholar] [CrossRef]
  56. Meresa, H.K.; Osuch, M.; Romanowicz, R. Hydro-meteorological drought projections into the 21-st century for selected polish catchments. Water 2016, 8, 206. [Google Scholar] [CrossRef] [Green Version]
  57. Rhee, J.; Im, J. Meteorological drought forecasting for ungauged areas based on machine learning: Using long-range climate forecast and remote sensing data. Agric. For. Meteorol. 2017, 237, 105–122. [Google Scholar] [CrossRef]
  58. Abbasi, A.; Khalili, K.; Behmanesh, J.; Shirzad, A. Drought monitoring and prediction using SPEI index and gene expression programming model in the west of Urmia Lake. Theor. Appl. Climatol. 2019, 138, 553–567. [Google Scholar] [CrossRef]
  59. Polong, F.; Chen, H.; Sun, S.; Ongoma, V. Temporal and spatial evolution of the standard precipitation evapotranspiration index (SPEI) in the Tana River basin, Kenya. Theor. Appl. Climatol. 2019, 138, 777–792. [Google Scholar] [CrossRef]
  60. Magaña, V.; Vázquez, J.; Pérez, J.; Pérez, J. Impact of El Niño on precipitation in Mexico. Geofis. Int. 2003, 42, 313–330. [Google Scholar]
  61. Seager, R.; Ting, M.; Davis, M.; Cane, M.; Naik, N.; Nakamura, J.; Li, C.; Cook, E.; Stahle, D.W. Mexican drought: An observational modeling and tree ring study of variability and climate change. Atmosfera 2009, 22, 1–31. [Google Scholar]
  62. Melgarejo, A.E.; Ordoñez, P.; Nieto, R.; Gimeno, L.; Ribera, P. Moisture transport related to the ENSO effects in the Mexican precipitation. In Proceedings of the First International Electronic Conference on the Hydrological Cycle, 12–16 November 2017; Multidisciplinary Digital Publishing Institute: Basel, Switzerland, 2017; p. 4884. [Google Scholar]
  63. Muñoz, E.; Busalacchi, A.J.; Nigam, S.; Ruiz-Barradas, A. Winter and summer structure of the Caribbean low-level jet. J Clim. 2008, 21, 1260–1276. [Google Scholar] [CrossRef]
  64. Wang, C. Variability of the Caribbean low-level jet and its relations to climate. Clim. Dyn. 2007, 29, 411–422. [Google Scholar] [CrossRef] [Green Version]
  65. Perdigón-Morales, J.; Romero-Centeno, R.; Ordoñez, P.; Nieto, R.; Gimeno, L.; Barret, B.S. Influence of the Madden-Julian Oscillation on moisture transport by the Caribbean Low Level Jet during the Midsummer Drought in Mexico. Atmos. Res. 2021, 48, 105243. [Google Scholar] [CrossRef]
  66. Whyte, F.S.; Taylor, M.A.; Stephenson, T.S.; Campbell, J.D. Features of the Caribbean low-level jet. Int. J. Climatol. 2008, 28, 119–128. [Google Scholar] [CrossRef]
  67. Chiang, J.C.H.; Kushnir, Y.; Zebiak, S.E. Interdecadal changes in eastern Pacific ITCZ variability and its influence on the Atlantic ITCZ. Geophys. Res. Lett. 2000, 27, 3687–3690. [Google Scholar] [CrossRef] [Green Version]
  68. Chiang, J.C.H.; Kushnir, Y.; Giannini, A. Deconstructing Atlantic ITCZ variability: Influence of the local cross-equatorial SST gradient, and remote forcing from the eastern equatorial Pacific. J. Geophys. Res. 2002, 107, 148–227. [Google Scholar]
  69. Giannini, A.; Kushnir, Y.; Cane, M.A. Interannual variability of Caribbean rainfall, ENSO, and the Atlantic Ocean. J. Clim. 2000, 13, 297–311. [Google Scholar] [CrossRef]
  70. Amador, J.A.; Alfaro, E.J.; Lizano, O.G.; Magaña, V.O. Atmospheric forcing of the eastern tropical Pacific: A review. Prog. Oceanogr. 2006, 69, 101–142. [Google Scholar] [CrossRef]
  71. Wang, C.; Lee, S.-K.; Enfield, D.B. Impact of the Atlantic Warm Pool on the Summer Climate of the Western Hemisphere. J. Clim. 2007, 20, 5021–5040. [Google Scholar] [CrossRef]
  72. Wang, C.; Lee, S.-K. Atlantic warm pool, Caribbean low-level jet, and their potential impact on Atlantic hurricanes. Geophys. Res. Lett. 2007, 34, L02703. [Google Scholar] [CrossRef] [Green Version]
  73. Amador, J.A. The Intra-Americas Sea Low-level Jet. Overview and Future Research. Trends and Directions in Climate Research. Ann. N. Y. Acad. Sci. 2008, 1146, 153–188. [Google Scholar] [CrossRef] [PubMed] [Green Version]
  74. Wang, C. Atmospheric circulation cells associated with the El Nino–Southern Oscillation. J. Clim. 2002, 15, 399–419. [Google Scholar] [CrossRef]
  75. Wang, C. Atlantic climate variability and its associated atmospheric circulation cells. J. Clim. 2002, 15, 1516–1536. [Google Scholar] [CrossRef]
  76. Gutnick, M. Climatology of the trade-wind inversion in the Caribbean. Bull. Am. Meteorol. Soc. 1958, 39, 410–420. [Google Scholar] [CrossRef] [Green Version]
  77. Malkus, J.S. On the maintenance of the trade winds. Tellus 1956, 8, 335–350. [Google Scholar] [CrossRef]
  78. Cao, G.; Giambelluca, T.W.; Stevens, D.E.; Schroeder, T.A. Inversion Variability in the Hawaiian Trade Wind Regime. J. Clim. 2007, 20, 1145–1160. [Google Scholar] [CrossRef] [Green Version]
  79. Carrillo, J.; Guerra, J.C.; Cuevas, E.; Barrancos, J. Characterization of the Marine Boundary Layer and the Trade-Wind Inversion over the Sub-tropical North Atlantic. Bound. Layer Meteorol. 2015, 158, 311–330. [Google Scholar] [CrossRef]
  80. Mote, T.L.; Ramseyer, C.A.; Miller, P.W. The Saharan Air Layer as an early rainfall season suppressant in the eastern Caribbean: The 2015 Puerto Rico drought. J. Geophys. Res. Atmos. 2017, 122, 10966–10982. [Google Scholar] [CrossRef]
  81. Leduc, G.; Vidal, L.; Tachikawa, K.; Bard, E. ITCZ rather than ENSO signature for abrupt climate changes across the tropical Pacific? Quat. Res. 2009, 72, 123–131. [Google Scholar] [CrossRef]
  82. Hu, S.; Fedorov, A.V. Cross-equatorial winds control El Niño diversity and change. Nat. Clim. Chang. 2018, 8, 798–802. [Google Scholar] [CrossRef]
  83. Yeh, S.-W.; Cai, W.; Min, S.-K.; McPhaden, M.J.; Dommenget, D.; Dewitte, B.; Collins, M.; Ashok, K.; An, S.-I.; Yim, J.-S.; et al. ENSO Atmospheric Teleconnections and Their Response to Greenhouse Gas Forcing. Rev. Geophys. 2018, 56, 185–206. [Google Scholar] [CrossRef]
  84. Record-Breaking Atlantic Hurricane Season Draws to an End. Available online: https://www.noaa.gov/media-release/record-breaking-atlantic-hurricane-season-draws-to-end (accessed on 4 January 2021).
  85. Trenberth, K.E.; Shea, D.J. Atlantic hurricanes and natural variability in 2005. Geophys. Res. Lett. 2006, 33, L12704. [Google Scholar] [CrossRef] [Green Version]
  86. Gill, A.E. Some simple solutions for heat-induced tropical circulation. Q. J. R. Meteorol. Soc. 1980, 106, 447–462. [Google Scholar] [CrossRef]
  87. Donner, S.; Knutson, T.R.; Oppenheimer, M. Model-based assessment of the role of human-induced climate change in the 2005 Caribbean coral bleaching event. Proc. Natl. Acad. Sci. USA 2007, 104, 5483–5488. [Google Scholar] [CrossRef] [PubMed] [Green Version]
  88. Simonti, A.L.; Eastman, R.J. 2005 Caribbean mass coral bleaching event: A sea surface temperature empirical orthogonal teleconnection analysis. J. Geophys. Res. 2010, 115, C11009. [Google Scholar] [CrossRef] [Green Version]
Figure 1. (a) Map of the study region showing the Balsas River Basin (BRB) contoured in a black line. The elevation of the region is indicated in colors (units in meters). (b) Monthly mean precipitation for the average region of the Balsas River Basin for the period from 1980–2017 from the University of East Anglia Climate Research Unit (CRU) database [15].
Atmosphere 12 00368 g001
Figure 2. Time series of October’s standardized precipitation–evapotranspiration index (SPEI-6) and standardized precipitation index (SPI-6) averaged over the BRB during 1980–2017.
Atmosphere 12 00368 g002
Figure 3. SPEI-6 values in October for (a) 1982 and (b) 2005.
Atmosphere 12 00368 g003
Figure 4. Averaged values of (E–P)1−10 > 0 for all the particles moving towards the BRB region (color shades, mm∙day−1), vertically integrated moisture flux (vectors, kg·m−1·s−1) and geopotential isolines at 925 hPa (solid lines, m−2·s−2) in (a) May, (b) June–September (JJAS) and (c) October. Study period: 1980–2017.
Atmosphere 12 00368 g004
Figure 5. (a) Name and geographical limits of the moisture sources defined for the BRB region (in colors). Black solid lines delimit the regions whose contributions exceed the 99.5th percentile. (b) Monthly (E–P)1–10 > 0 values for the seven areas defined as moisture sources: Balsas River Basin (BRB), Caribbean Sea (CAR), Gulf of Mexico (GOM), tropical Atlantic (ATL), Pacific (PAC), north of the BRB (NORTH) and southern BRB (SOUTH).
Atmosphere 12 00368 g005
Figure 6. Monthly accumulated anomalies of (E–P)1−10 > 0 for the three moisture sources contoured by black solid lines in the Figure 5a (colored bars, left black y-axis) and omega anomalies (blue lines; right, blue y-axis) during the drought episodes of (a) 1982 and (b) 2005.
Atmosphere 12 00368 g006
Figure 7. (a) SST anomalies (°C, contours) and horizontal wind anomalies at 850 hPa (m·s−1, arrows), (b) vertical velocity anomalies (Pa∙s−1, contours) at 600 hPa. Period: wet season (May-October) during 1982. Blue lines show the seasonal mean (May–October) precipitation values in the 1981–2010 period greater than 5 mm in the ITCZ (Inter Tropical Convergence Zone).
Atmosphere 12 00368 g007
Figure 8. Vertical profile of monthly vertical velocity anomalies from 925 hPa to 300 hPa (hPa∙s−1, contours) over the BRB during the wet season (top x-axis). Seasonal mean (May–October) anomalies (bottom x-axis) of profiles of equivalent potential temperature (K, solid line), relative humidity (%, dotted line) and temperature (K, dashed line).
Atmosphere 12 00368 g008
Figure 9. (a) SST anomalies (°C, contours) and horizontal wind anomalies at 850 hPa (arrows) during 2005, (b) vertical velocity anomalies (Pa∙s−1, contours) at 600 hPa during 2005 with negative geopotential height anomalies at 850 hPa (red lines) and positive at 200 hPa (blue lines). Period: wet season (May–October).
Atmosphere 12 00368 g009
Table 1. Drought seasonal episodes observed over the BRB for the period 1980–2017.
YearSPEI-6Drought
Intensity
SPEI-1
May
SPEI-1
June
SPEI-1
July
SPEI-1
August
SPEI-1
September
SPEI-1
October
1982−2.15Extreme0.90−1.39−1.35−1.96−1.950.32
1986−1.36Moderate0.510.36−1.45−0.85−1.40−0.20
1987−1.41Moderate−0.93−0.551.02−1.03−0.15−1.86
1994−1.11Moderate−0.43−0.86−1.710.40−0.931.02
1997−1.40Moderate0.03−0.65−0.76−1.41−0.920.79
2005−1.61Severe−1.04−1.890.380.29−1.84−0.17
2009−1.30Moderate−0.16−0.50−1.86−1.360.441.05
Publisher’s Note: MDPI stays neutral with regard to jurisdictional claims in published maps and institutional affiliations.

