
Bulk Deposition and Source Apportionment of Atmospheric Heavy Metals and Metalloids in Agricultural Areas of Rural Beijing during 2016–2020

 ,
,
Abstract
:
1. Introduction
2. Experiments
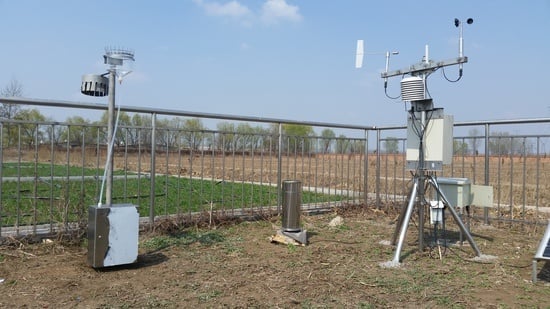
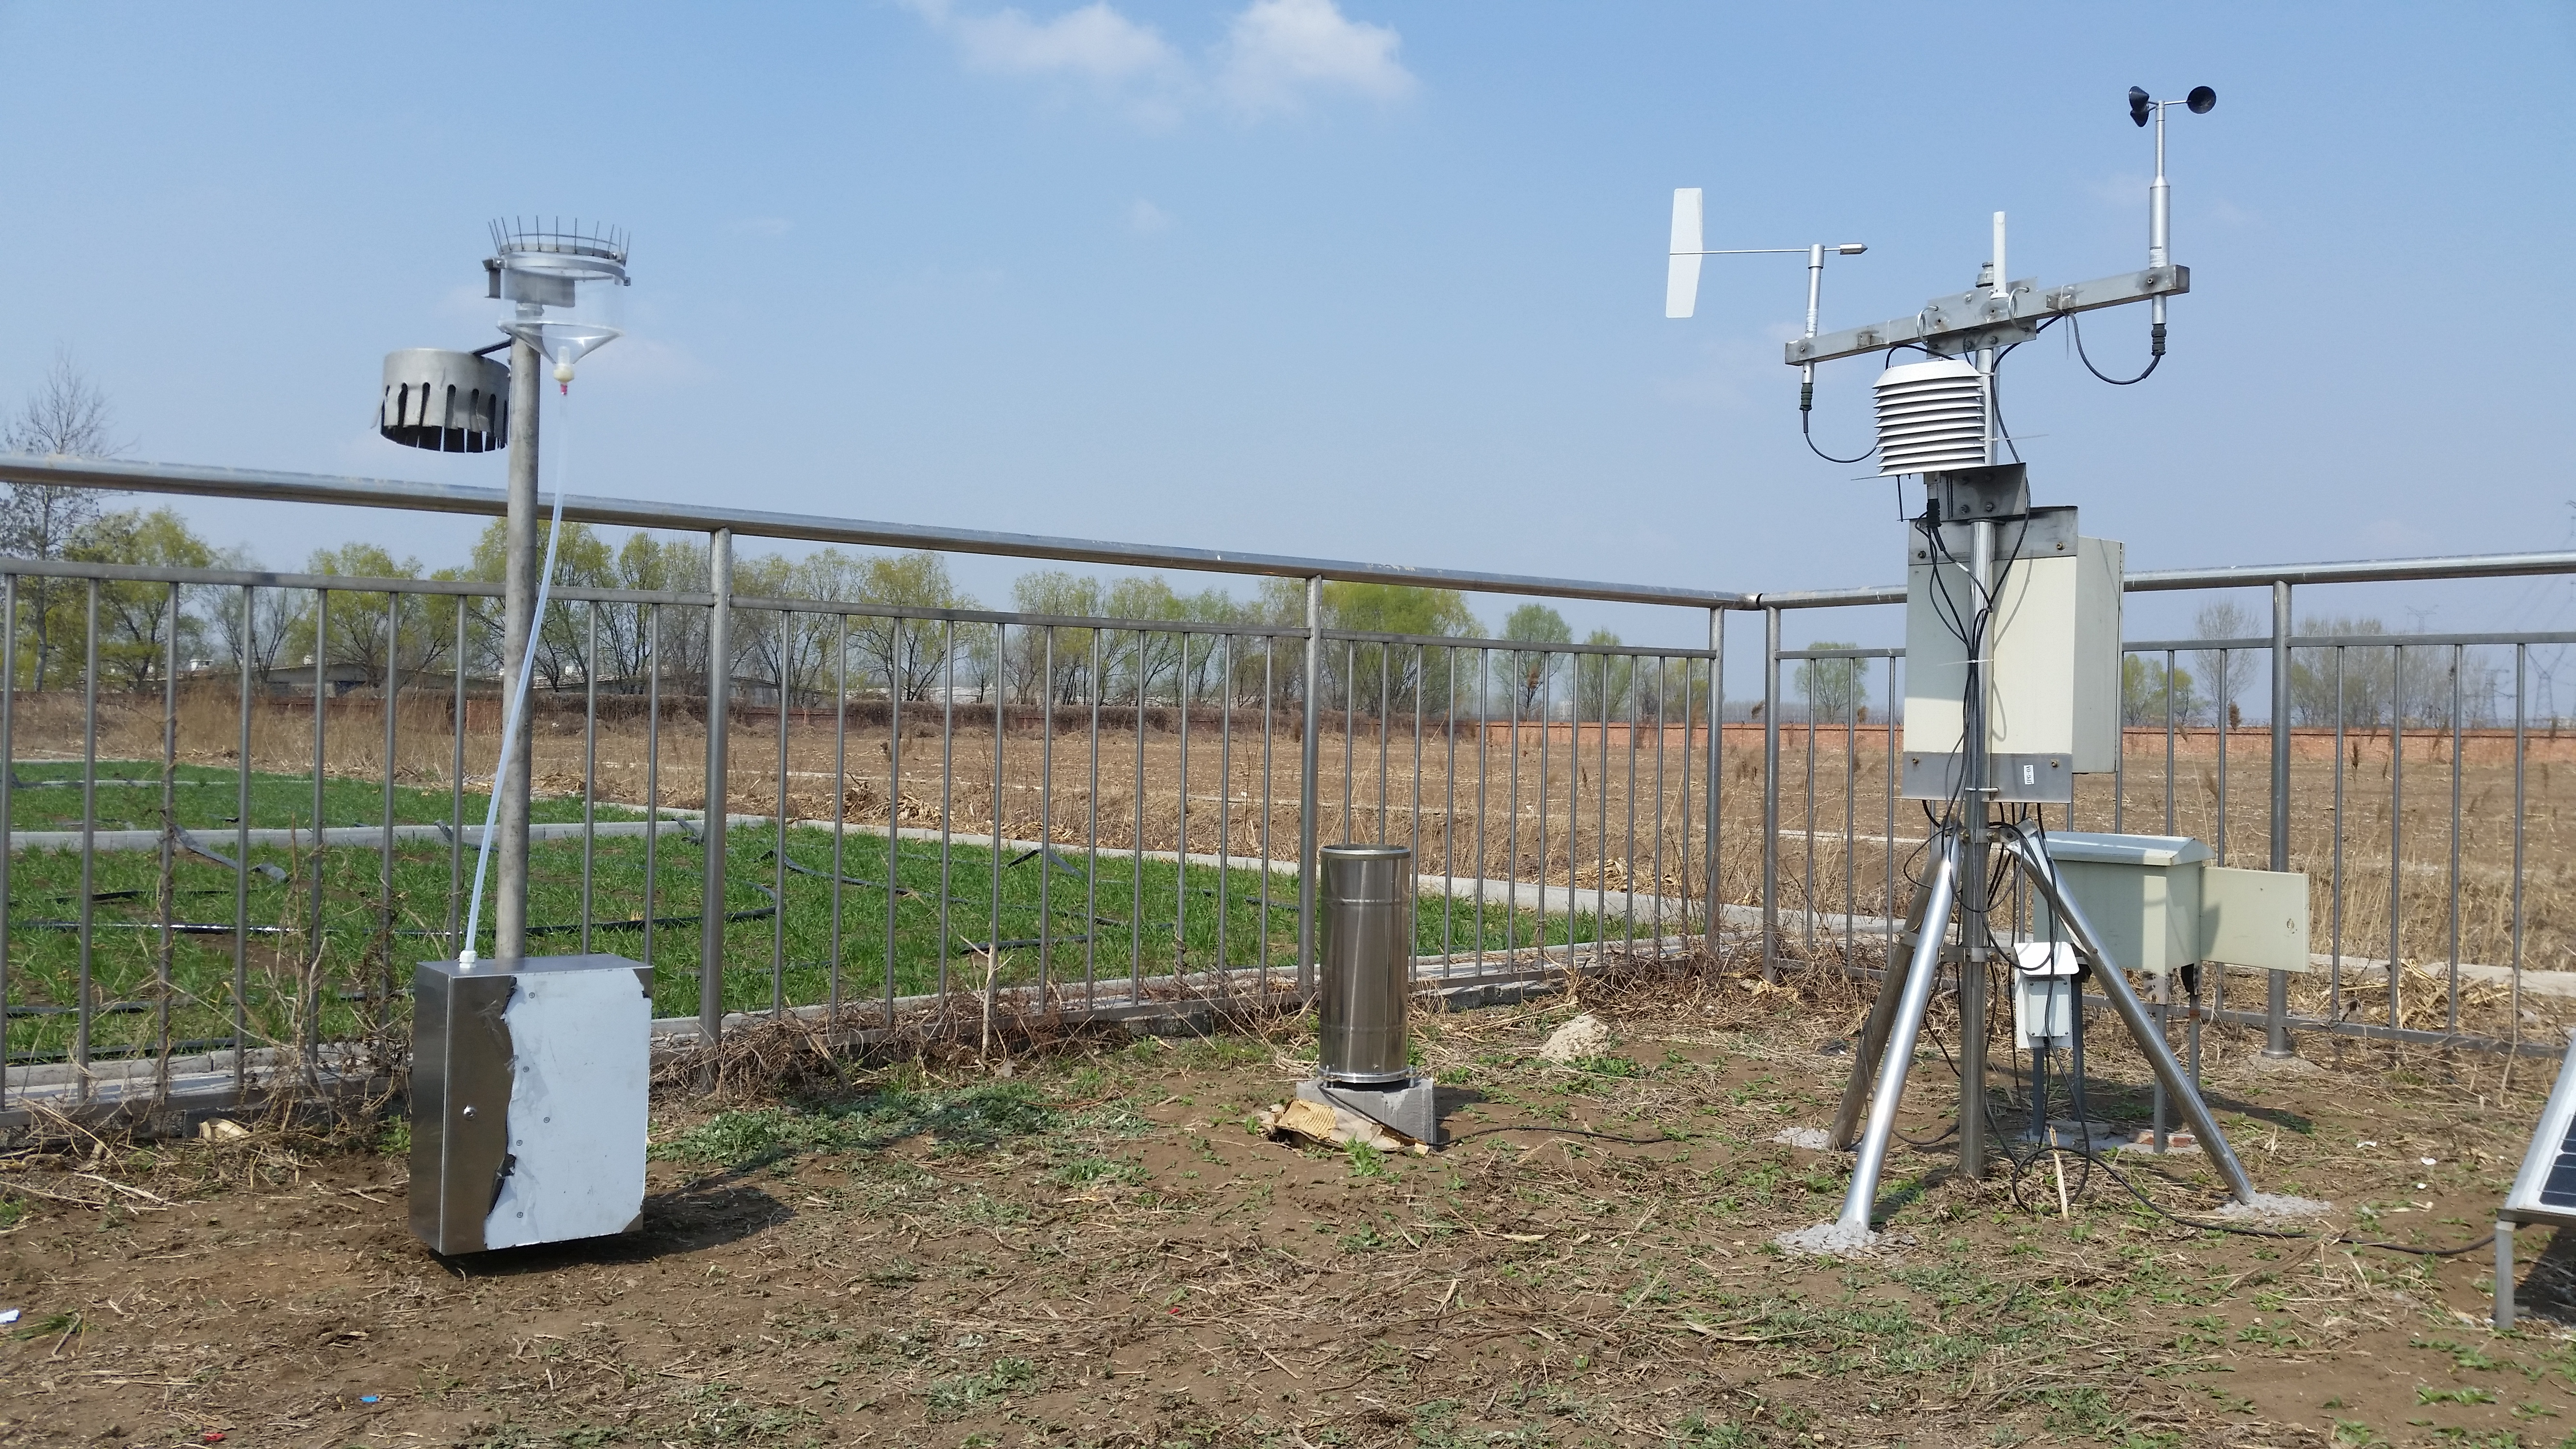
2.1. Site Description and Sampling Method
2.2. Chemical Analysis
2.3. PMF Model
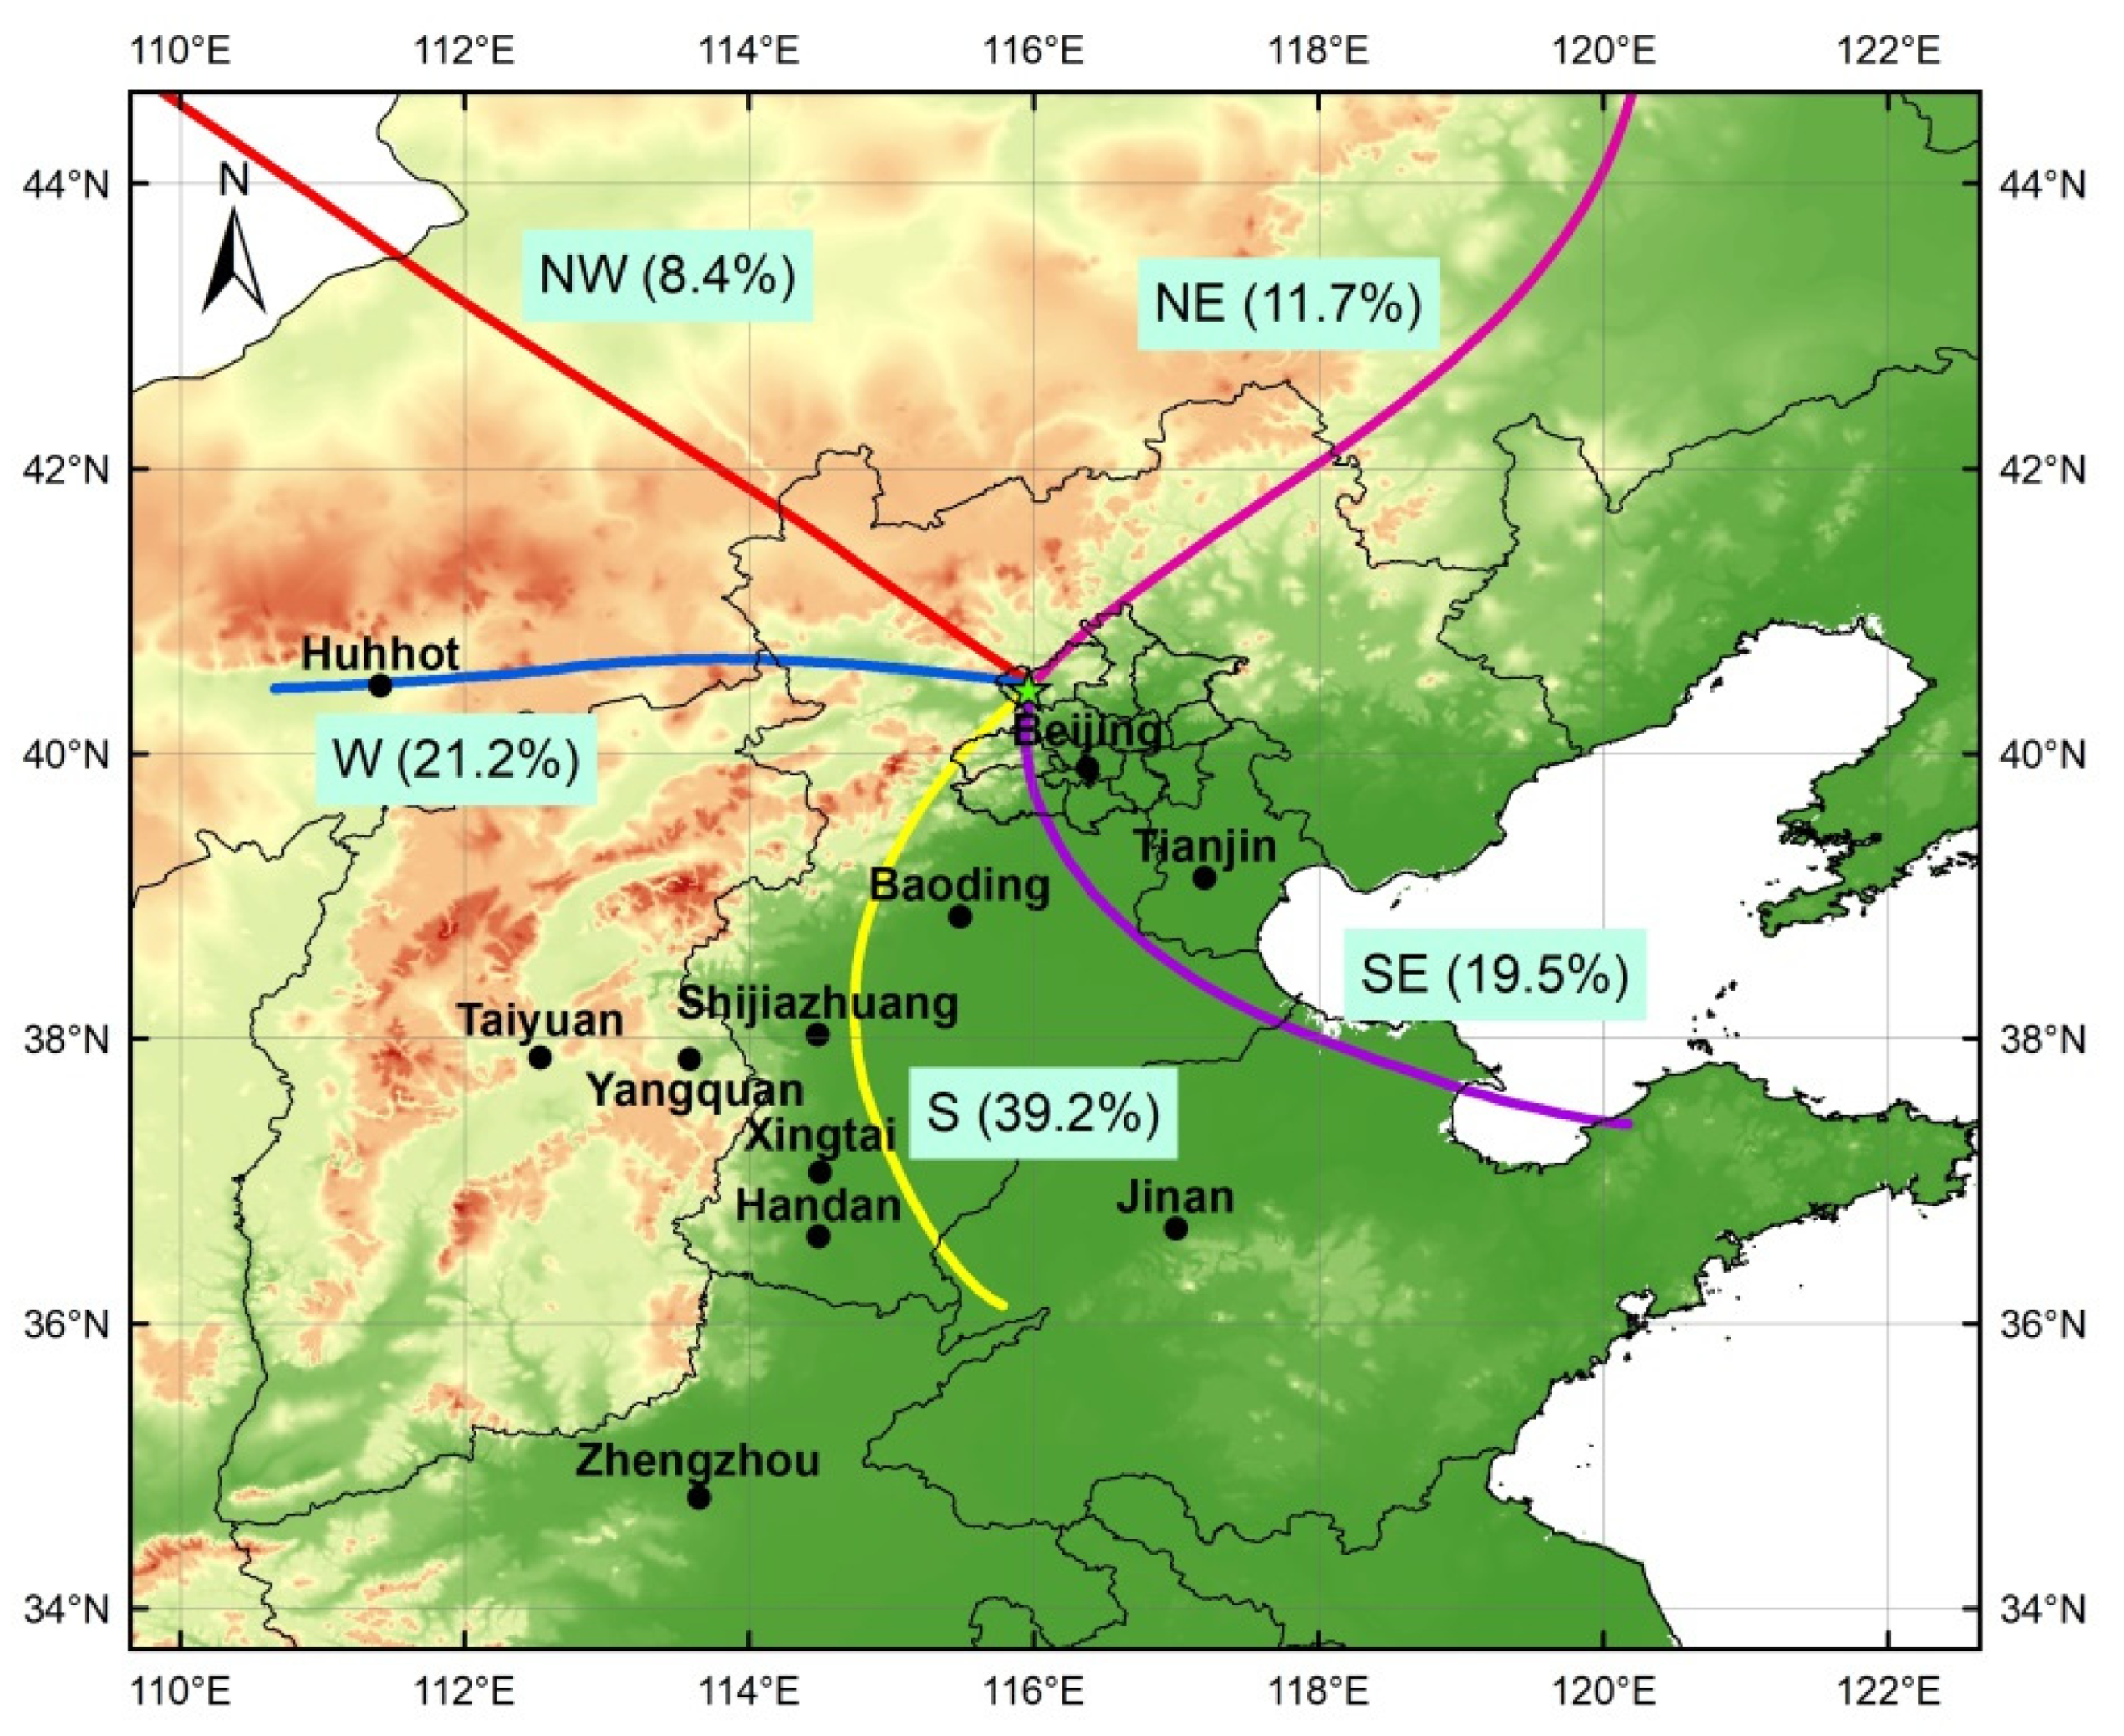
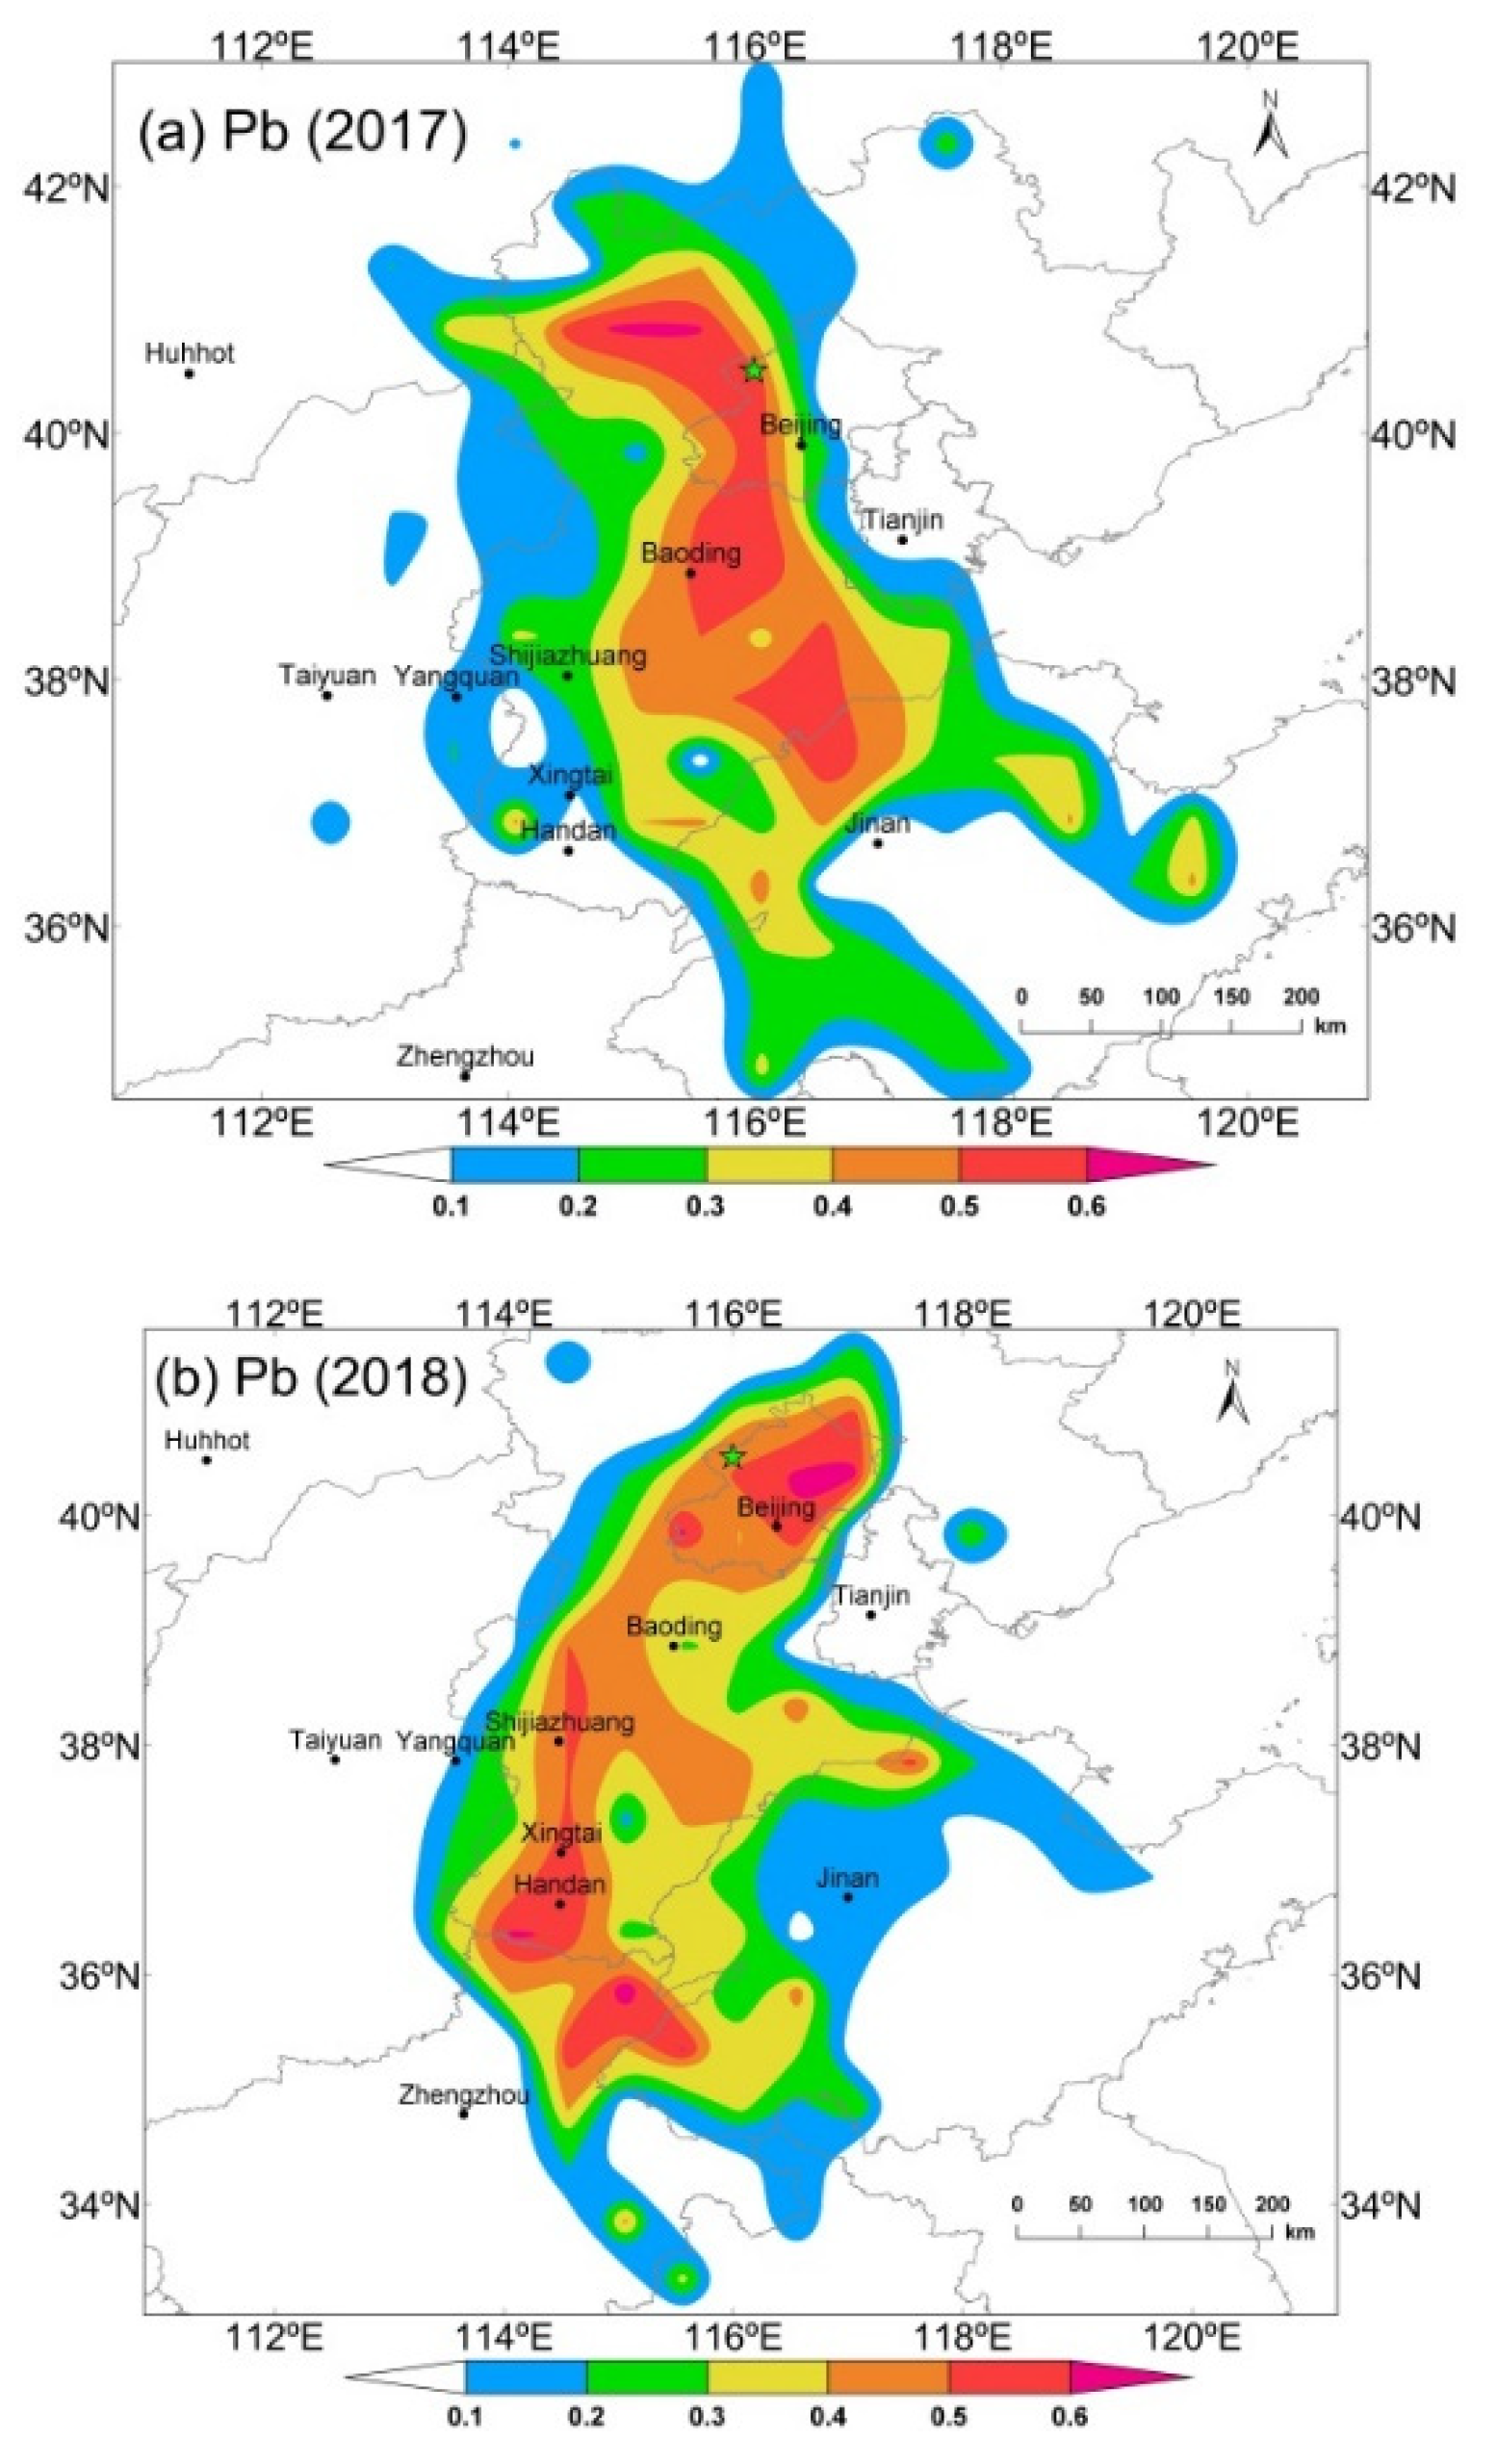
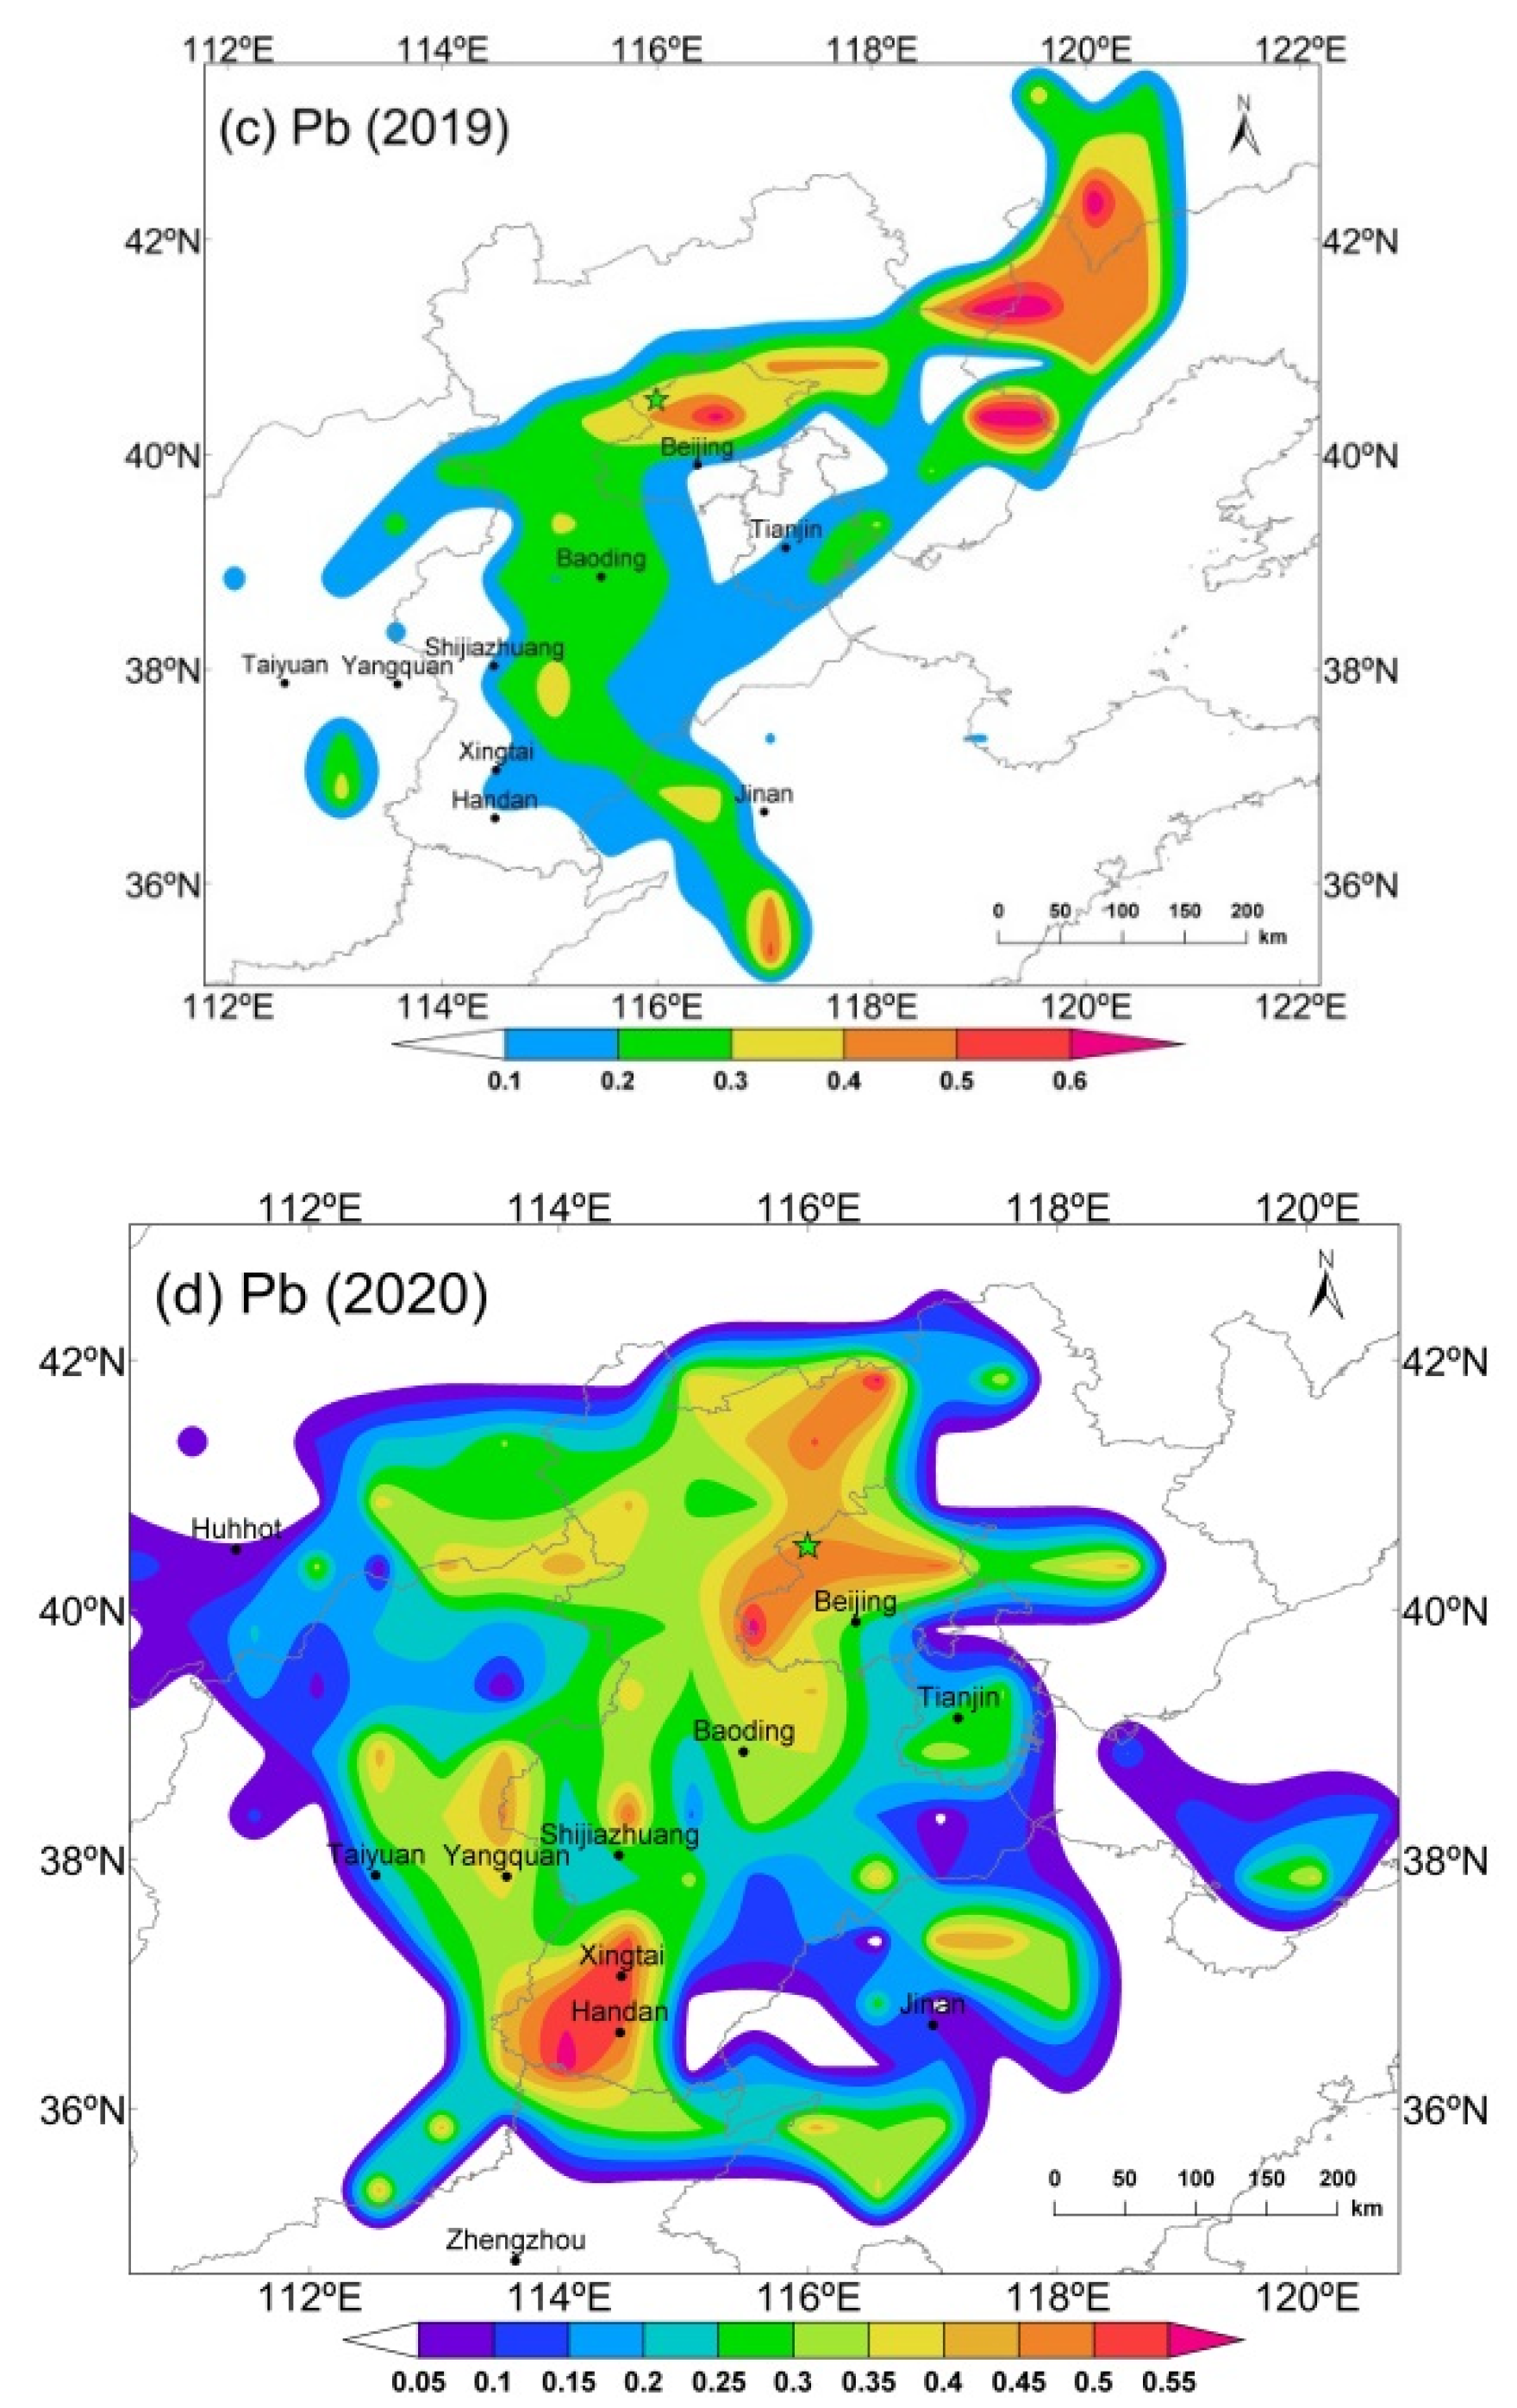
2.4. PSCF Analysis
3. Results and Discussion
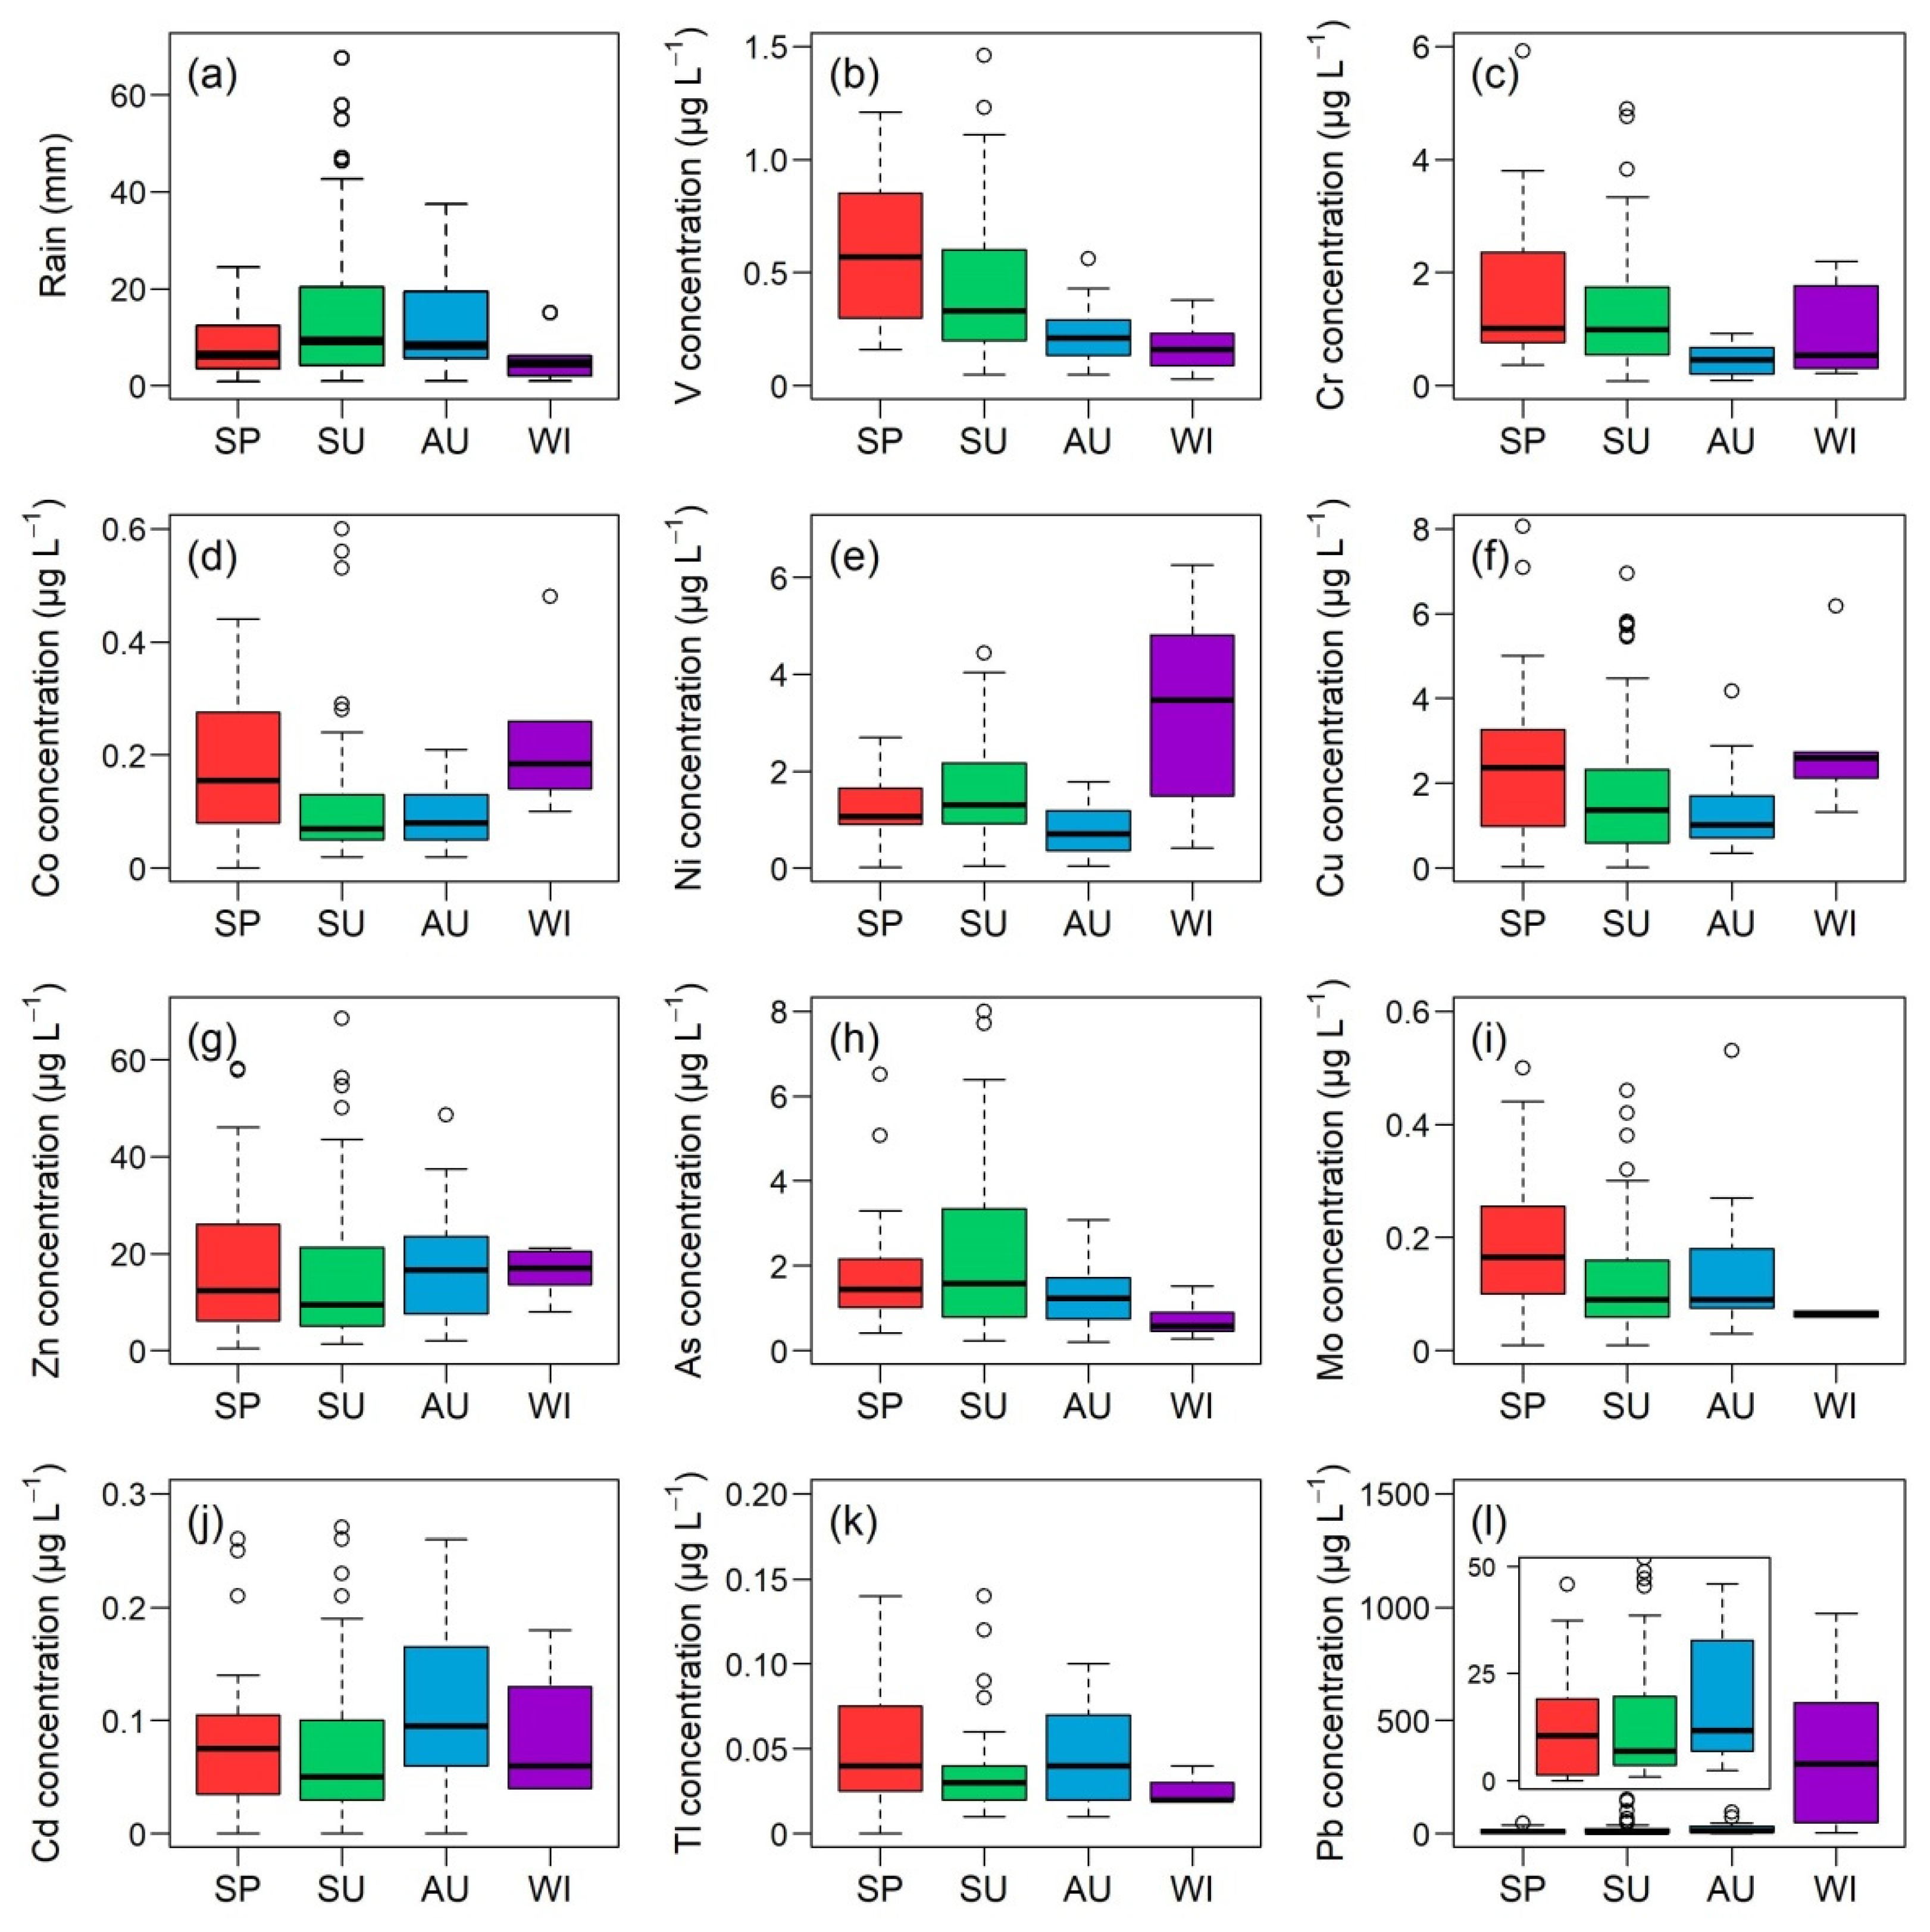
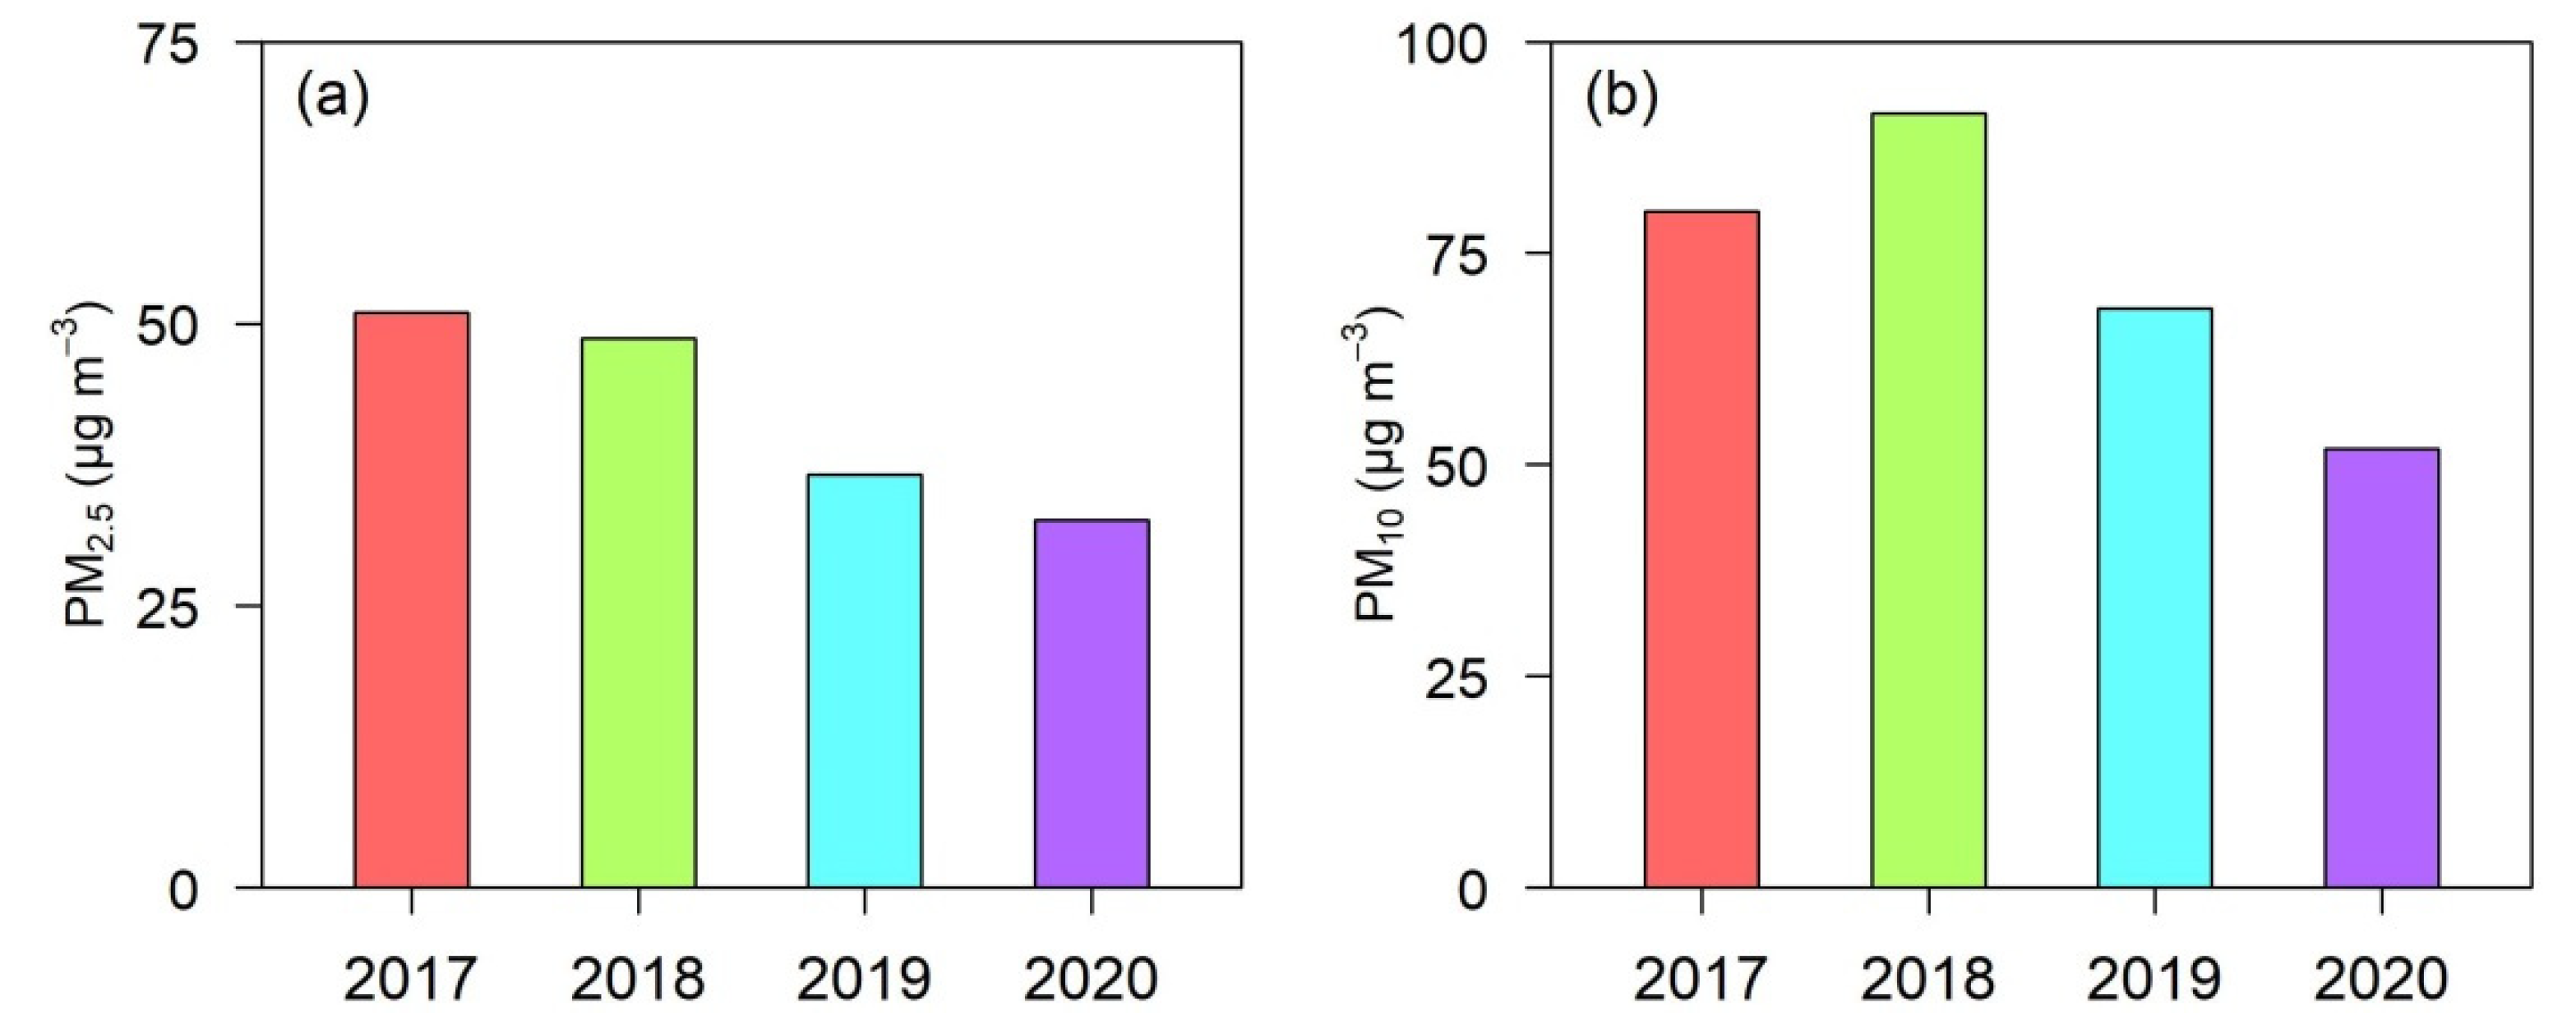
3.1. Concentration Variations
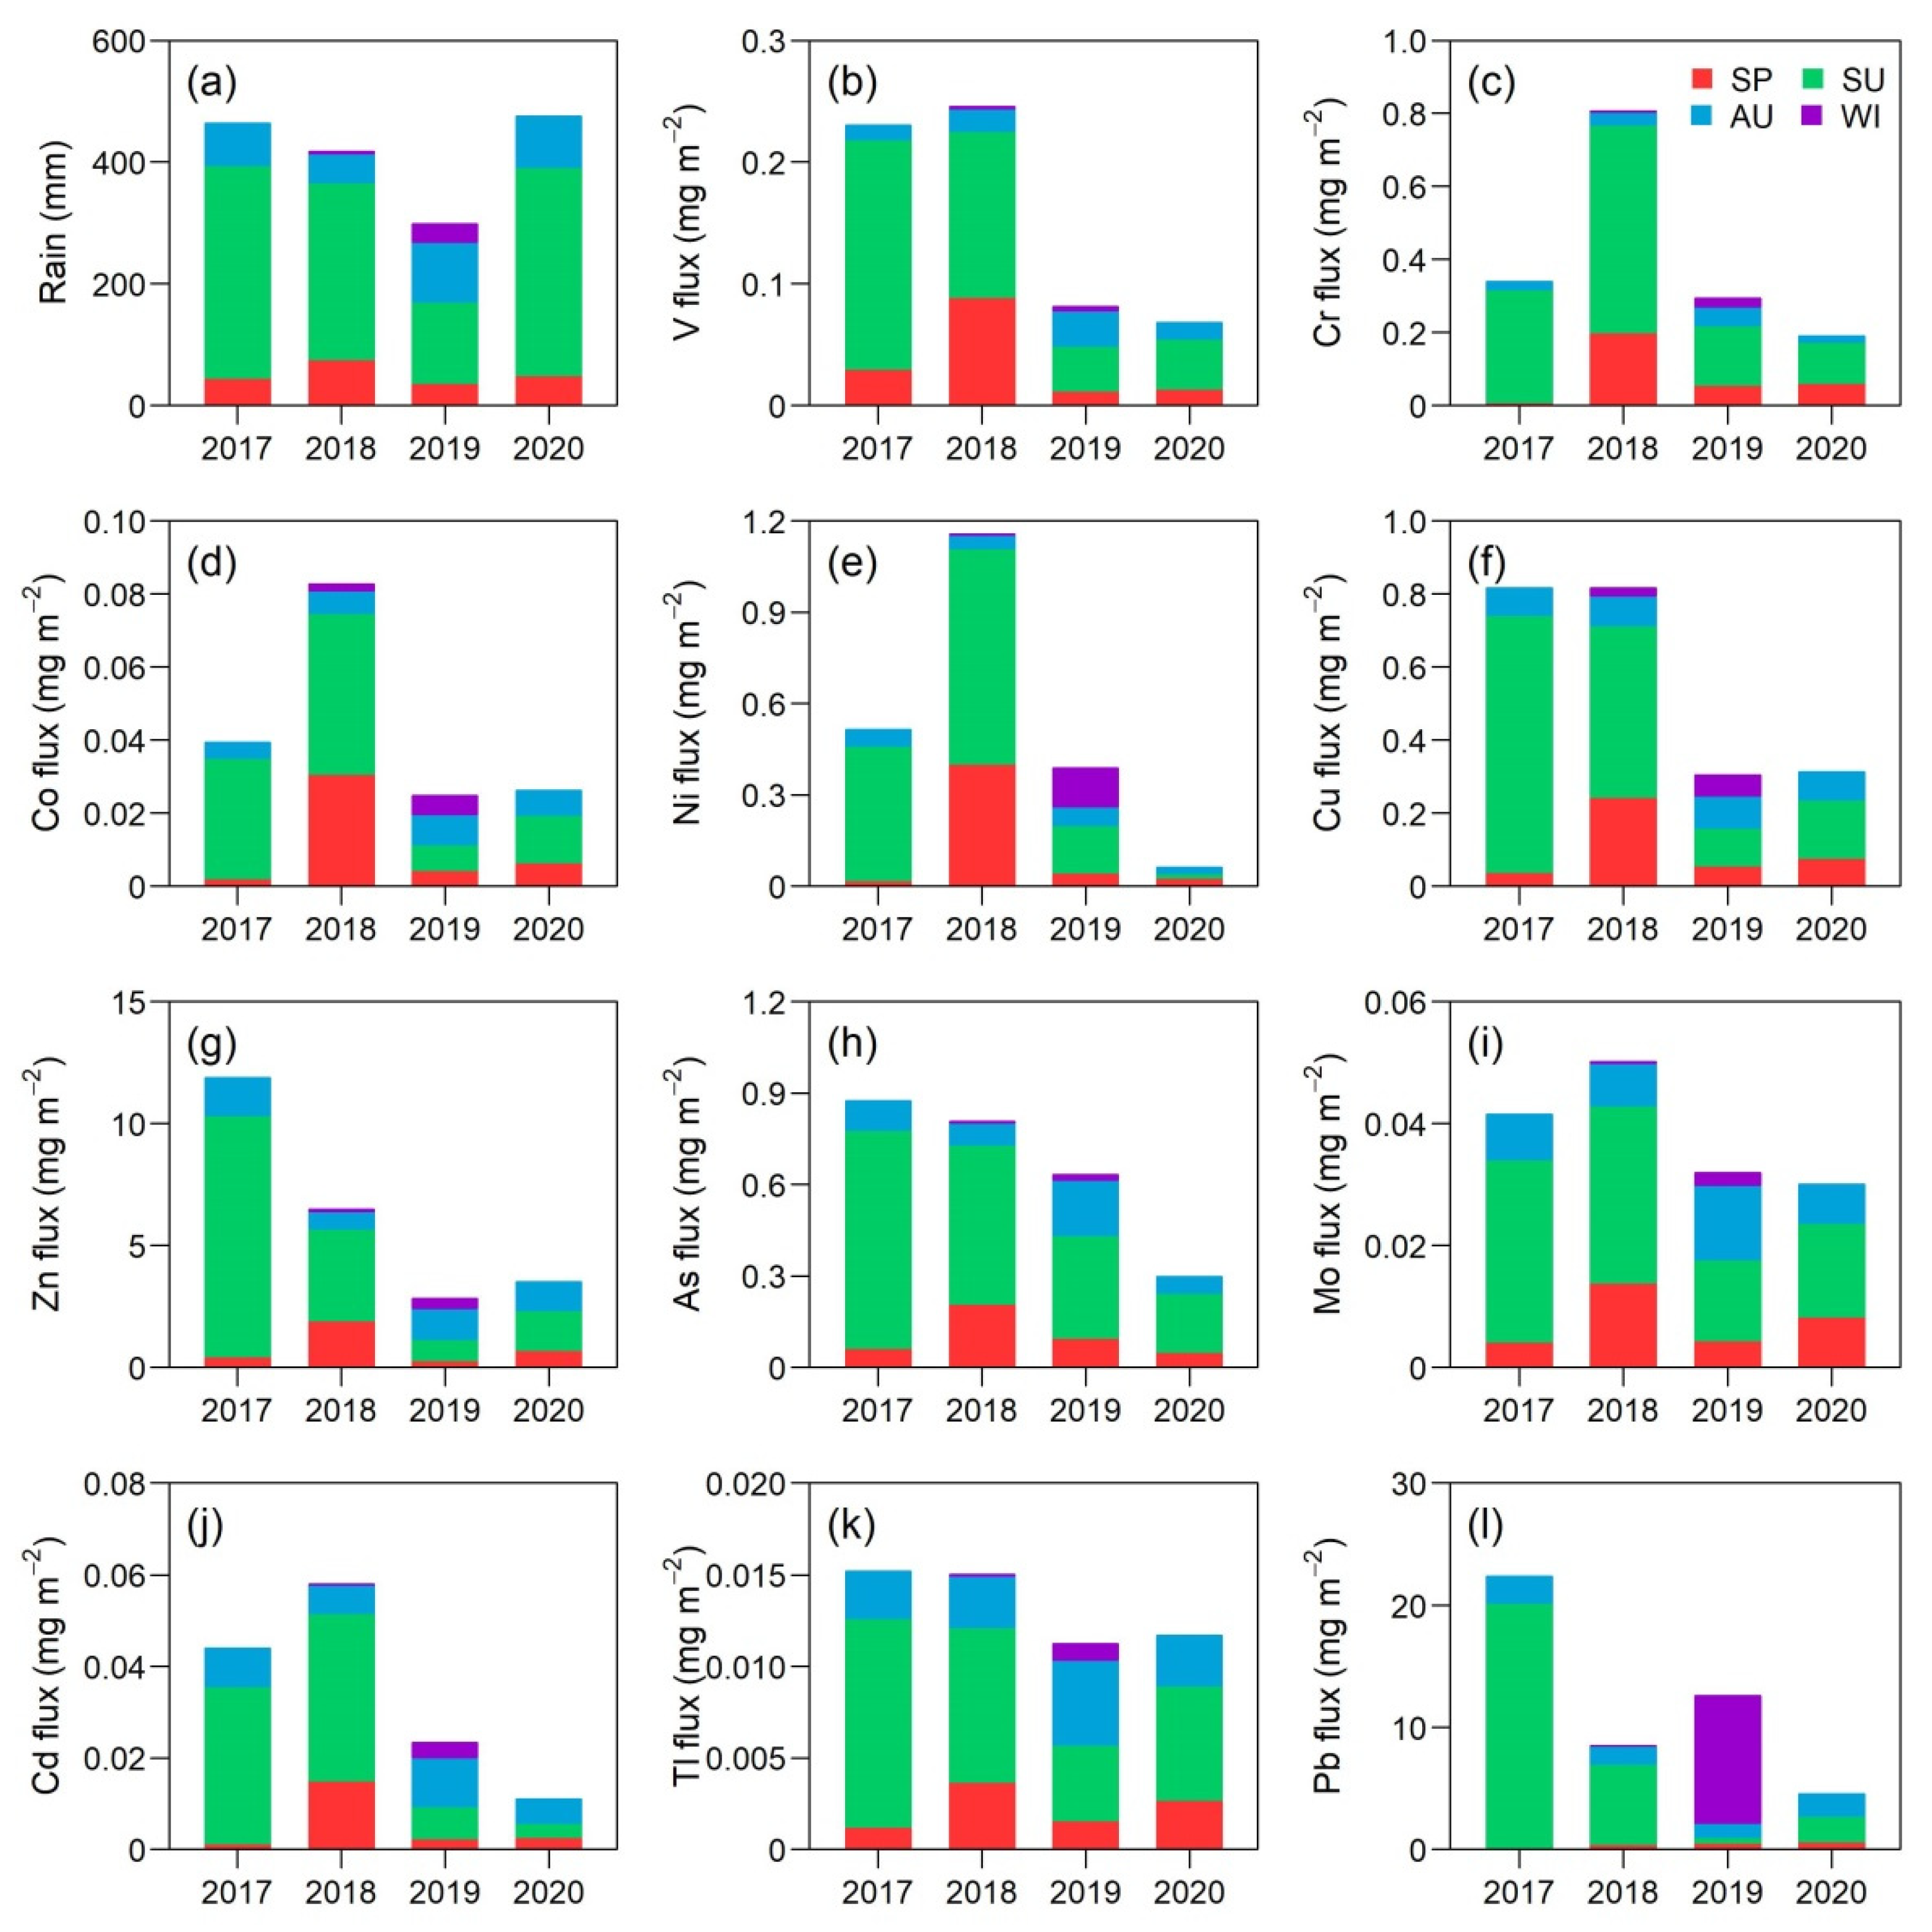
3.2. Bulk Deposition Flux
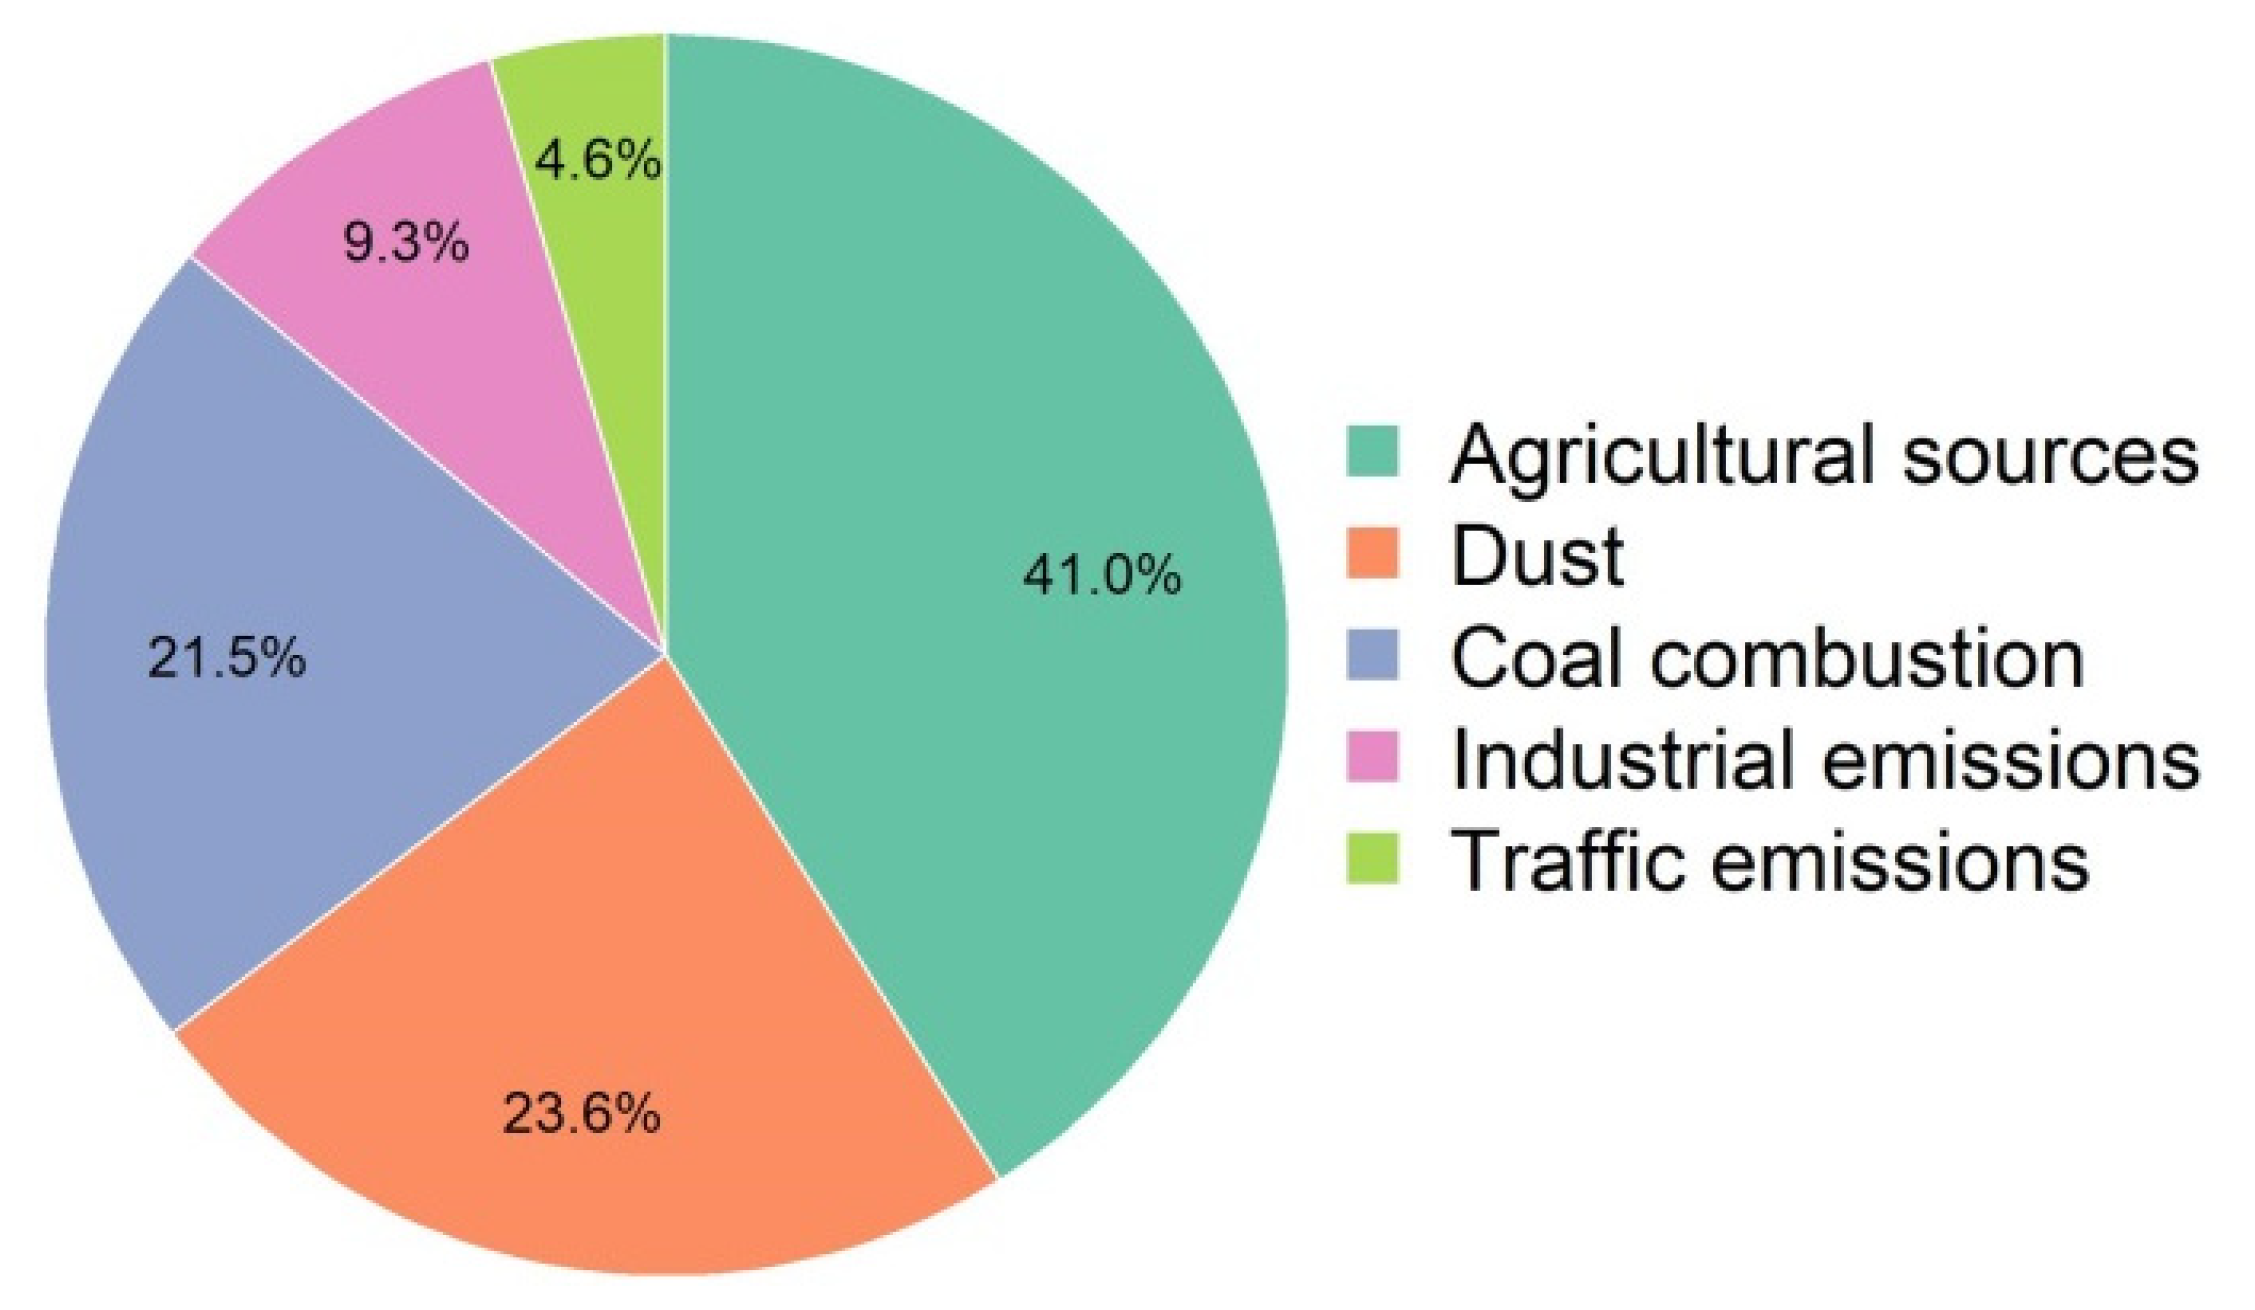
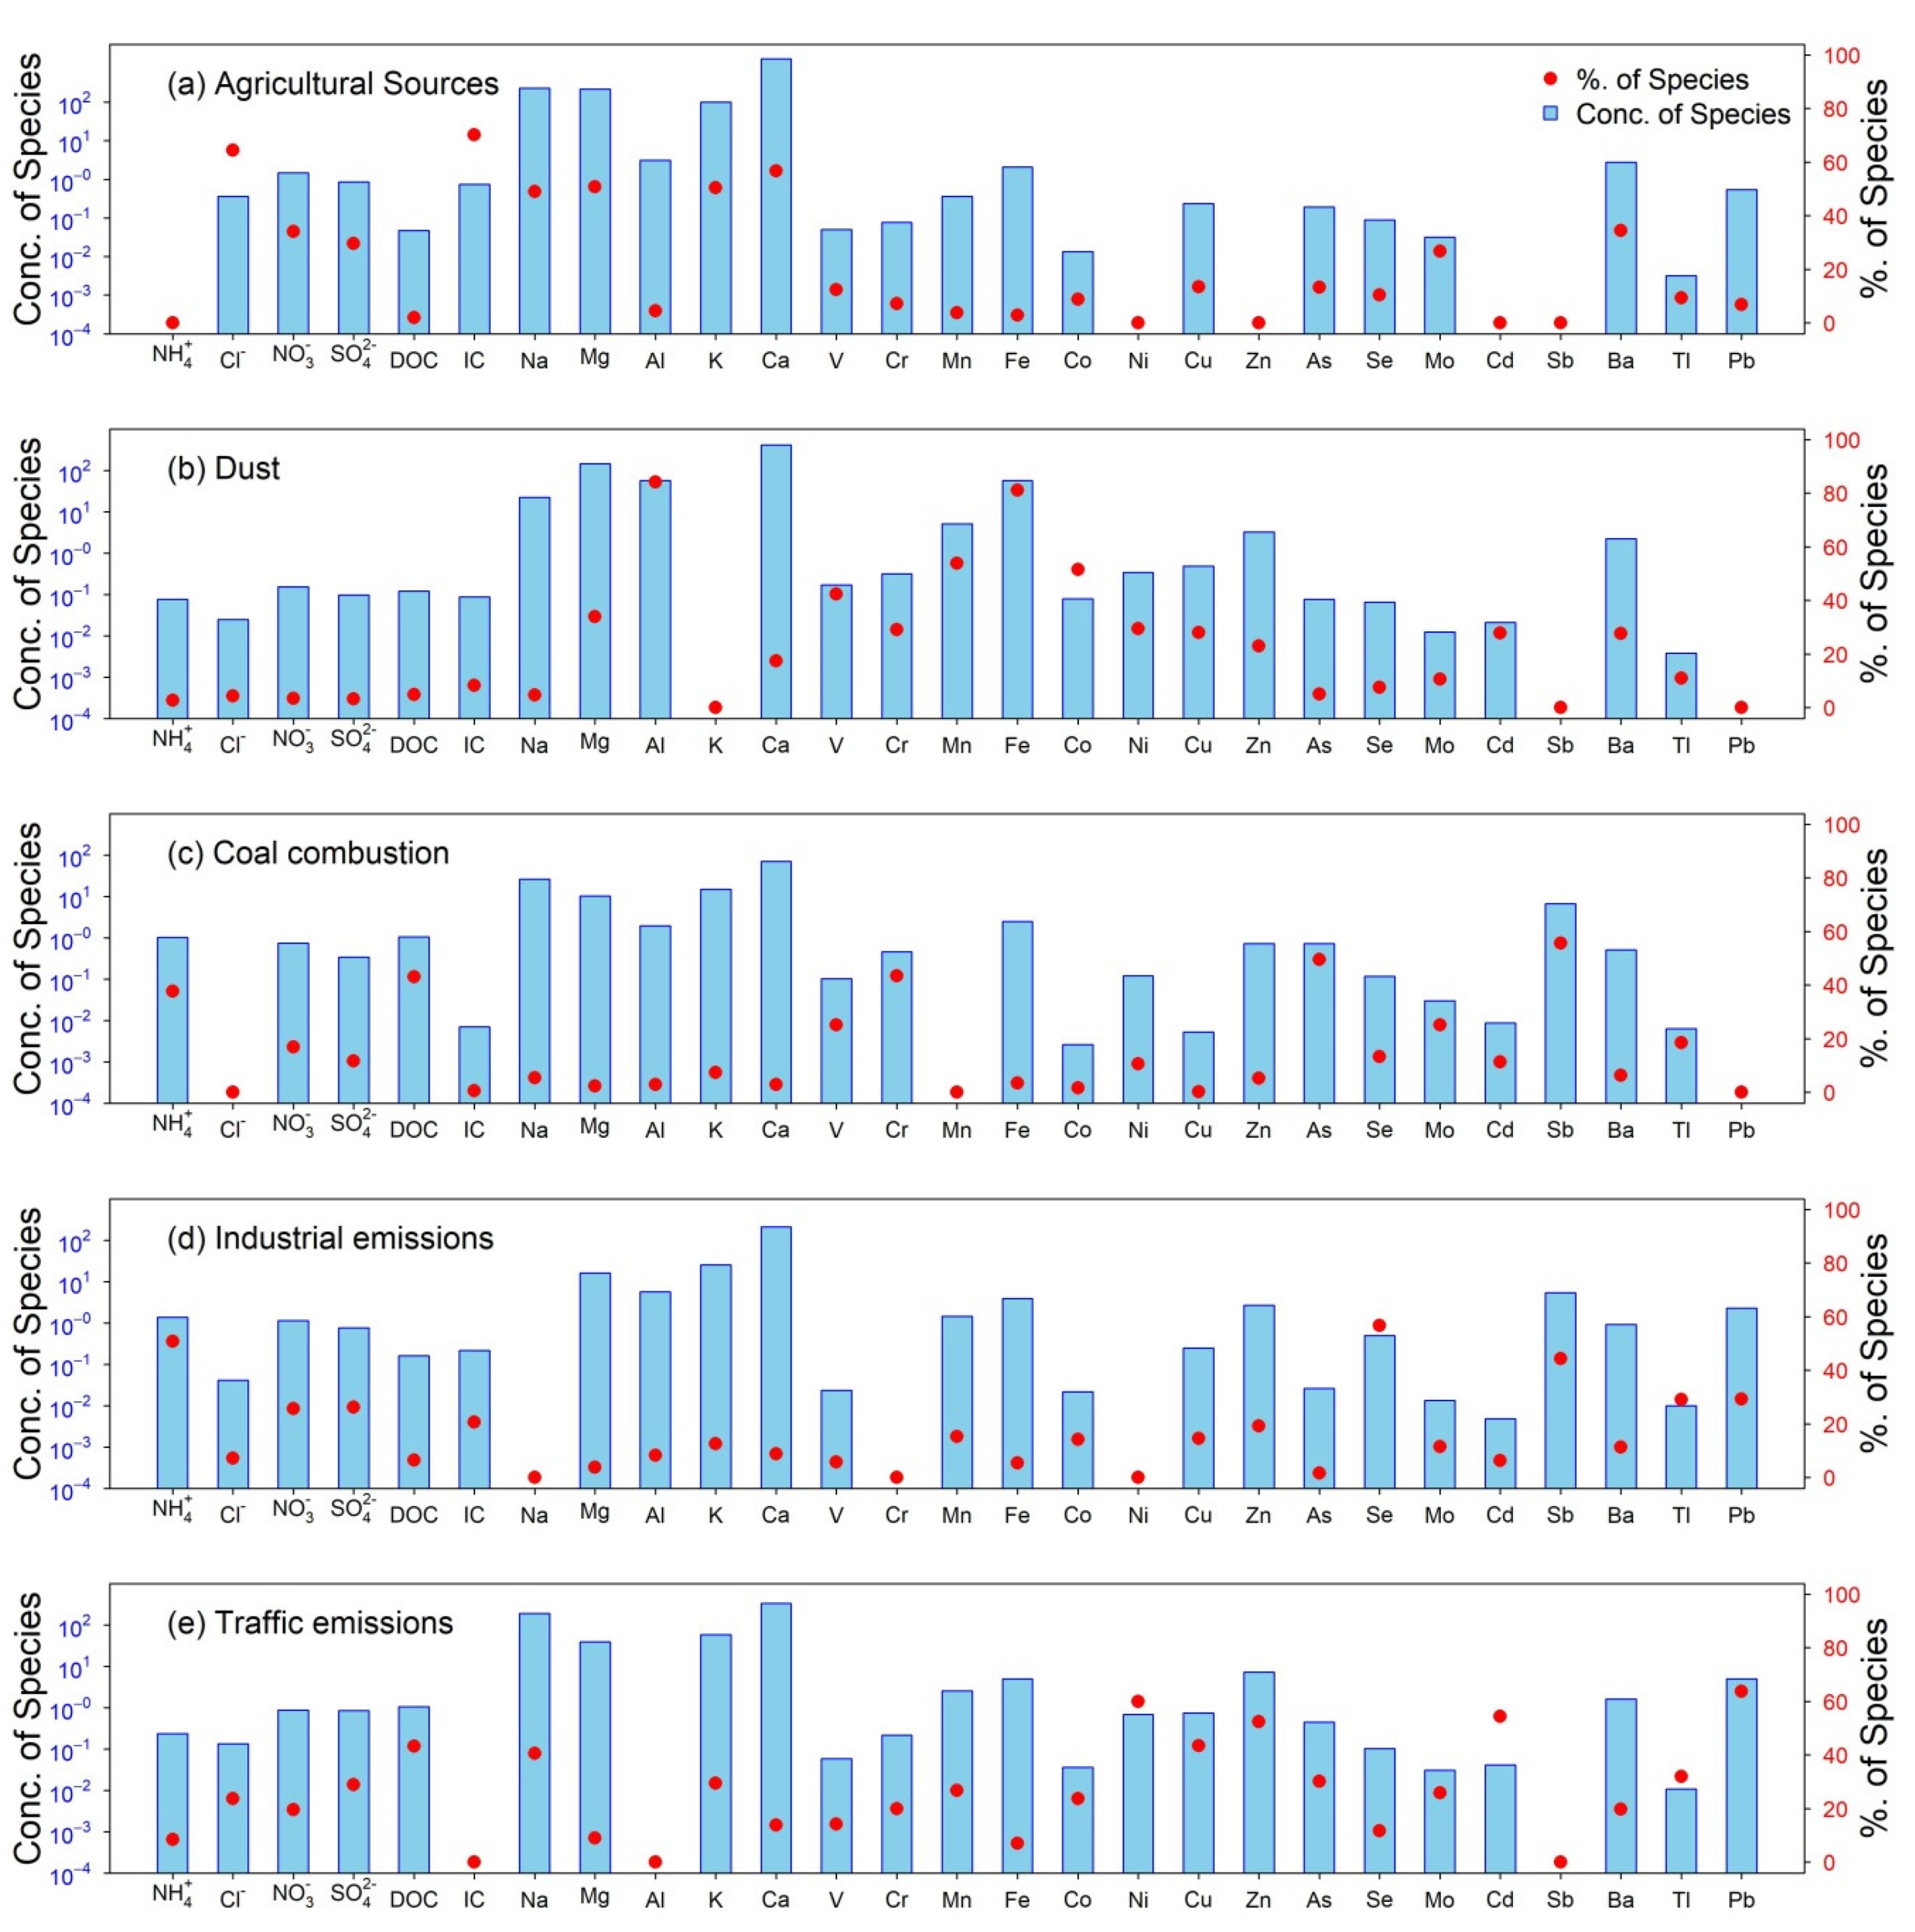
3.3. Source Apportionment
4. Conclusions
Supplementary Materials
Author Contributions
Funding
Institutional Review Board Statement
Informed Consent Statement
Data Availability Statement
Acknowledgments
Conflicts of Interest
References
- Qiao, Q.; Huang, B.; Zhang, C.; Piper, J.D.A.; Pan, Y.; Sun, Y. Assessment of heavy metal contamination of dustfall in northern China from integrated chemical and magnetic investigation. Atmos. Environ. 2013, 74, 182–193. [Google Scholar] [CrossRef]
- Hovmand, M.F.; Kemp, K.; Kystol, J.; Johnsen, I.; Riis-Nielsen, T.; Pacyna, J.M. Atmospheric heavy metal deposition accumulated in rural forest soils of southern Scandinavia. Environ. Pollut. 2008, 155, 537–541. [Google Scholar] [CrossRef]
- Nicholson, F.A.; Smith, S.R.; Alloway, B.J.; Carlton-Smith, C.; Chambers, B.J. An inventory of heavy metals inputs to agricultural soils in England and Wales. Sci. Total Environ. 2003, 311, 205–219. [Google Scholar] [CrossRef]
- Pan, Y.P.; Wang, Y.S. Atmospheric wet and dry deposition of trace elements at 10 sites in Northern China. Atmos. Chem. Phys. 2015, 15, 951–972. [Google Scholar] [CrossRef] [Green Version]
- Galloway, J.N.; Thornton, J.D.; Norton, S.A.; Volchok, H.L.; McLean, R.A.N. Trace metals in atmospheric deposition: A review and assessment. Atmos. Environ. 1982, 16, 1677–1700. [Google Scholar] [CrossRef]
- Pan, Y.P.; Tian, S.L.; Li, X.R.; Sun, Y.; Li, Y.; Wentworth, G.R.; Wang, Y.S. Trace elements in particulate matter from metropolitan regions of Northern China: Sources, concentrations and size distributions. Sci. Total Environ. 2015, 537, 9–22. [Google Scholar] [CrossRef] [PubMed]
- Mukherjee, A.B. Nickel: A review of occurrence, uses, emissions, and concentration in the environment in Finland. Environ. Rev. 1998, 6, 173–187. [Google Scholar] [CrossRef]
- Tian, H.Z.; Zhu, C.Y.; Gao, J.J.; Cheng, K.; Hao, J.M.; Wang, K.; Hua, S.B.; Wang, Y.; Zhou, J.R. Quantitative assessment of atmospheric emissions of toxic heavy metals from anthropogenic sources in China: Historical trend, spatial distribution, uncertainties, and control policies. Atmos. Chem. Phys. 2015, 15, 10127–10147. [Google Scholar] [CrossRef] [Green Version]
- Chen, R.; de Sherbinin, A.; Ye, C.; Shi, G. China’s Soil Pollution: Farms on the Frontline. Science 2014, 344, 691. [Google Scholar] [CrossRef]
- Geng, G.; Xiao, Q.; Zheng, Y.; Tong, D.; Zhang, Y.; Zhang, X.; Zhang, Q.; He, K.; Liu, Y. Impact of China’s Air Pollution Prevention and Control Action Plan on PM2.5 chemical composition over eastern China. Sci. China Earth Sci. 2019, 62, 1872–1884. [Google Scholar] [CrossRef]
- Dasch, J.M. Direct measurement of dry deposition to a polyethylene bucket and various surrogate surfaces. Environ. Sci. Technol. 1985, 19, 721–725. [Google Scholar] [CrossRef]
- Shannigrahi, A.S.; Fukushima, T.; Ozaki, N. Comparison of different methods for measuring dry deposition fluxes of particulate matter and polycyclic aromatic hydrocarbons (PAHs) in the ambient air. Atmos. Environ. 2005, 39, 653–662. [Google Scholar] [CrossRef]
- Wang, Y.; Yu, W.; Pan, Y.; Wu, D. Acid Neutralization of precipitation in Northern China. J. Air Waste Manag. 2012, 62, 204–211. [Google Scholar] [CrossRef] [PubMed] [Green Version]
- Pan, Y.; Wang, Y.; Xin, J.; Tang, G.; Song, T.; Wang, Y.; Li, X.; Wu, F. Study on dissolved organic carbon in precipitation in Northern China. Atmos. Environ. 2010, 44, 2350–2357. [Google Scholar] [CrossRef]
- Tian, S.; Pan, Y.; Liu, Z.; Wen, T.; Wang, Y. Size-resolved aerosol chemical analysis of extreme haze pollution events during early 2013 in urban Beijing, China. J. Hazard. Mater. 2014, 279, 452–460. [Google Scholar] [CrossRef]
- Karanasiou, A.A.; Siskos, P.A.; Eleftheriadis, K. Assessment of source apportionment by Positive Matrix Factorization analysis on fine and coarse urban aerosol size fractions. Atmos. Environ. 2009, 43, 3385–3395. [Google Scholar] [CrossRef]
- Tian, S.L.; Pan, Y.P.; Wang, Y.S. Size-resolved source apportionment of particulate matter in urban Beijing during haze and non-haze episodes. Atmos. Chem. Phys. 2016, 16, 1–19. [Google Scholar] [CrossRef] [Green Version]
- Wang, Y.Q.; Zhang, X.Y.; Draxler, R.R. TrajStat: GIS-based software that uses various trajectory statistical analysis methods to identify potential sources from long-term air pollution measurement data. Environ. Model. Softw. 2009, 24, 938–939. [Google Scholar] [CrossRef]
- Ashbaugh, L.L.; Malm, W.C.; Sadeh, W.Z. A residence time probability analysis of sulfur concentrations at grand Canyon National Park. Atmos. Environ. 1985, 19, 1263–1270. [Google Scholar] [CrossRef]
- Hopke, P.K.; Barrie, L.A.; Li, S.-M.; Cheng, M.-D.; Li, C.; Xie, Y. Possible sources and preferred pathways for biogenic and non-sea-salt sulfur for the high Arctic. J. Geophys. Res. Atmos. 1995, 100, 16595–16603. [Google Scholar] [CrossRef]
- Berg, T.; Aas, W.; Pacyna, J.; Uggerud, H.T.; Vadset, M. Atmospheric trace metal concentrations at Norwegian background sites during 25 years and its relation to European emissions. Atmos. Environ. 2008, 42, 7494–7501. [Google Scholar] [CrossRef]
- Xin, J.; Wang, Y.; Wang, L.; Tang, G.; Sun, Y.; Pan, Y.; Ji, D. Reductions of PM2.5 in Beijing-Tianjin-Hebei urban agglomerations during the 2008 Olympic Games. Adv. Atmos. Sci. 2012, 29, 1330–1342. [Google Scholar] [CrossRef]
- EMEP. Assessment of Transboundary Pollution by Toxic Substances: Heavy Metals and POPs. Part I. 2018. Available online: http://en.msceast.org/reports/1_2020_datrep.pdf (accessed on 31 December 2020).
- Zhu, J.; Wang, Q.; Yu, H.; Li, M.; He, N. Heavy metal deposition through rainfall in Chinese natural terrestrial ecosystems: Evidences from national-scale network monitoring. Chemosphere 2016, 164, 128–133. [Google Scholar] [CrossRef]
- Feng, W.L.; Guo, Z.H.; Peng, C.; Xiao, X.Y.; Shi, L.; Zeng, P.; Ran, H.Z.; Xue, Q.H. Atmospheric bulk deposition of heavy metal(loid)s in central south China: Fluxes, influencing factors and implication for paddy soils. J. Hazard. Mater. 2019, 371, 634–642. [Google Scholar] [CrossRef]
- Ma, Y.; Tang, Y.; Xu, H.; Zhang, X.; Liu, H.; Wang, S.; Zhang, W. Bulk/wet deposition of trace metals to rural, industrial, and urban areas in the Yangtze River Delta, China. Ecotoxicol. Environ. Saf. 2019, 169, 185–191. [Google Scholar] [CrossRef]
- Kim, J.-E.; Han, Y.-J.; Kim, P.-R.; Holsen, T.M. Factors influencing atmospheric wet deposition of trace elements in rural Korea. Atmos. Res. 2012, 116, 185–194. [Google Scholar] [CrossRef]
- Connan, O.; Maro, D.; Hebert, D.; Roupsard, P.; Goujon, R.; Letellier, B.; Le Cavelier, S. Wet and dry deposition of particles associated metals (Cd, Pb, Zn, Ni, Hg) in a rural wetland site, Marais Vernier, France. Atmos. Environ. 2013, 67, 394–403. [Google Scholar] [CrossRef]
- Morera-Gomez, Y.; Santamaria, J.M.; Elustondo, D.; Lasheras, E.; Alonso-Hernandez, C.M. Determination and source apportionment of major and trace elements in atmospheric bulk deposition in a Caribbean rural area. Atmos. Environ. 2019, 202, 93–104. [Google Scholar] [CrossRef]
- Cherednichenko, V.S.; Cherednichenko, A.V.; Cherednichenko, A.V.; Zheksenbaeva, A.K.; Madibekov, A.S. Heavy metal deposition through precipitation in Kazakhstan. Heliyon 2021, 7, e05844. [Google Scholar] [CrossRef]
- Mijic, Z.; Stojic, A.; Perisic, M.; Rajsic, S.; Tasic, M.; Radenkovic, M.; Joksic, J. Seasonal variability and source apportionment of metals in the atmospheric deposition in Belgrade. Atmos. Environ. 2010, 44, 3630–3637. [Google Scholar] [CrossRef]
- Oduber, F.; Calvo, A.I.; Castro, A.; Blanco-Alegre, C.; Alves, C.; Calzolai, G.; Nava, S.; Lucarelli, F.; Nunes, T.; Barata, J.; et al. Characterization of aerosol sources in León (Spain) using Positive Matrix Factorization and weather types. Sci. Total Environ. 2021, 754, 142045. [Google Scholar] [CrossRef]
- Du, H.; Kong, L.; Cheng, T.; Chen, J.; Du, J.; Li, L.; Xia, X.; Leng, C.; Huang, G. Insights into summertime haze pollution events over Shanghai based on online water-soluble ionic composition of aerosols. Atmos. Environ. 2011, 45, 5131–5137. [Google Scholar] [CrossRef]
- Desboeufs, K.; Bon Nguyen, E.; Chevaillier, S.; Triquet, S.; Dulac, F. Fluxes and sources of nutrients and trace metals atmospheric deposition in the northwestern Mediterranean. Atmos. Chem. Phys. 2018, 18, 1–27. [Google Scholar] [CrossRef] [Green Version]
- Titos, G.; Lyamani, H.; Pandolfi, M.; Alastuey, A.; Alados-Arboledas, L. Identification of fine (PM1) and coarse (PM10-1) sources of particulate matter in an urban environment. Atmos. Environ. 2014, 89, 593–602. [Google Scholar] [CrossRef] [Green Version]
- Vecchi, R.; Chiari, M.; D’Alessandro, A.; Fermo, P.; Lucarelli, F.; Mazzei, F.; Nava, S.; Piazzalunga, A.; Prati, P.; Silvani, F.; et al. A mass closure and PMF source apportionment study on the sub-micron sized aerosol fraction at urban sites in Italy. Atmos. Environ. 2008, 42, 2240–2253. [Google Scholar] [CrossRef]
- Tian, H.Z.; Wang, Y.; Xue, Z.G.; Cheng, K.; Qu, Y.P.; Chai, F.H.; Hao, J.M. Trend and characteristics of atmospheric emissions of Hg, As, and Se from coal combustion in China, 1980–2007. Atmos. Chem. Phys. 2010, 10, 11905–11919. [Google Scholar] [CrossRef] [Green Version]
- Kang, J.; Choi, M.-S.; Yi, H.-I.; Song, Y.-H.; Lee, D.; Cho, J.-H. A five-year observation of atmospheric metals on Ulleung Island in the East/Japan Sea: Temporal variability and source identification. Atmos. Environ. 2011, 45, 4252–4262. [Google Scholar] [CrossRef]
- Dall’Osto, M.; Querol, X.; Amato, F.; Karanasiou, A.; Lucarelli, F.; Nava, S.; Calzolai, G.; Chiari, M. Hourly elemental concentrations in PM2.5 aerosols sampled simultaneously at urban background and road site during SAPUSS-diurnal variations and PMF receptor modelling. Atmos. Chem. Phys. 2013, 13, 4375–4392. [Google Scholar] [CrossRef] [Green Version]
- Karnae, S.; John, K. Source apportionment of fine particulate matter measured in an industrialized coastal urban area of South Texas. Atmos. Environ. 2011, 45, 3769–3776. [Google Scholar] [CrossRef]
- Begum, B.A.; Kim, E.; Biswas, S.K.; Hopke, P.K. Investigation of sources of atmospheric aerosol at urban and semi-urban areas in Bangladesh. Atmos. Environ. 2004, 38, 3025–3038. [Google Scholar] [CrossRef]


| Heavy Metals | 4-Year Average Concentrations | Mean Concentrations by Backward Trajectories | |||||
|---|---|---|---|---|---|---|---|
| Volume-Weighted Mean | Geometric Mean | Northwest | South | Southeast | Northeast | West | |
| V | 0.41 | 0.33 | 0.36 | 0.54 | 0.54 | 0.48 | 0.45 |
| Cr | 1.38 | 0.89 | 0.71 | 2.06 | 1.93 | 1.30 | 1.36 |
| Co | 0.17 | 0.10 | 0.08 | 0.19 | 0.16 | 0.16 | 0.23 |
| Ni | 2.08 | 1.04 | 1.12 | 3.21 | 3.05 | 1.49 | 2.62 |
| Cu | 3.42 | 1.34 | 1.36 | 2.27 | 1.52 | 3.00 | 5.03 |
| Zn | 28.82 | 11.46 | 9.53 | 17.85 | 17.67 | 24.45 | 37.53 |
| As | 1.84 | 1.50 | 0.98 | 2.95 | 2.77 | 2.36 | 1.70 |
| Mo | 0.11 | 0.11 | 0.11 | 0.16 | 0.13 | 0.25 | 0.13 |
| Cd | 0.11 | 0.07 | 0.05 | 0.11 | 0.09 | 0.13 | 0.11 |
| Tl | 0.04 | 0.03 | 0.02 | 0.05 | 0.04 | 0.05 | 0.05 |
| Pb | 40.75 | 9.92 | 63.17 | 17.73 | 18.16 | 15.17 | 98.29 |
| Site | Period | V | Cr | Co | Ni | Cu | Zn | As | Mo | Cd | Tl | Pb | Reference |
|---|---|---|---|---|---|---|---|---|---|---|---|---|---|
| Rural Beijing, China | 2016–2020 | 0.16 | 0.41 | 0.04 | 0.53 | 0.56 | 6.18 | 0.65 | 0.04 | 0.03 | 0.01 | 12.02 | this study |
| Across China | 2013–2014 | - | 0.24–2.10 | - | - | - | - | - | - | 0.03–0.95 | - | 0.06–5.80 | [24] |
| South China | 2016–2018 | - | 2.68 | - | 1.69 | 4.20 | 24.07 | 5.92 | - | 1.29 | - | - | [25] |
| Yangtze River Delta, China | 2005–2018 | - | - | - | 23.49 | 11.07 | 29.66 | - | - | 0.26 | - | 12.27 | [26] |
| Chuncheon, Korea | 2006–2009 | 0.10 | - | - | 0.37 | 1.21 | 6.93 | 0.26 | - | 0.05 | - | 1.06 | [27] |
| Bay of the Seine, France | 2010–2011 | - | - | - | 0.32 | - | 2.85 | - | - | 0.01 | 0.10 | [28] | |
| Caribbean, Cuba | 2014–2016 | 3.91 | 1.02 | 0.10 | 1.28 | 3.21 | 21.90 | 0.44 | 0.11 | 0.03 | 0.005 | 2.34 | [29] |
| North Kazakhstan | 2013–2018 | - | - | - | - | 3.80 | - | 0.11 | - | 0.06 | - | 0.57 | [30] |
Publisher’s Note: MDPI stays neutral with regard to jurisdictional claims in published maps and institutional affiliations. |
© 2021 by the authors. Licensee MDPI, Basel, Switzerland. This article is an open access article distributed under the terms and conditions of the Creative Commons Attribution (CC BY) license (http://creativecommons.org/licenses/by/4.0/).
Share and Cite
Pan, Y.; Liu, J.; Zhang, L.; Cao, J.; Hu, J.; Tian, S.; Li, X.; Xu, W. Bulk Deposition and Source Apportionment of Atmospheric Heavy Metals and Metalloids in Agricultural Areas of Rural Beijing during 2016–2020. Atmosphere 2021, 12, 283. https://doi.org/10.3390/atmos12020283
Pan Y, Liu J, Zhang L, Cao J, Hu J, Tian S, Li X, Xu W. Bulk Deposition and Source Apportionment of Atmospheric Heavy Metals and Metalloids in Agricultural Areas of Rural Beijing during 2016–2020. Atmosphere. 2021; 12(2):283. https://doi.org/10.3390/atmos12020283
Chicago/Turabian StylePan, Yuepeng, Jin Liu, Lan Zhang, Jing Cao, Jiabao Hu, Shili Tian, Xingyu Li, and Wen Xu. 2021. "Bulk Deposition and Source Apportionment of Atmospheric Heavy Metals and Metalloids in Agricultural Areas of Rural Beijing during 2016–2020" Atmosphere 12, no. 2: 283. https://doi.org/10.3390/atmos12020283