Article

Association between Long-Term Exposure to PM2.5 and Lung Imaging Phenotype in CODA Cohort

1
Department of Pulmonary, Allergy and Critical Care Medicine, Hallym University Chuncheon Sacred Heart Hospital, Chuncheon-si 24253, Korea
2
Lung Research Institute, Hallym University College of Medicine, Chuncheon-si 24253, Korea
3
Department of Radiology, Kangwon National University Hospital, Kangwon National University School of Medicine, Chuncheon-si 24289, Korea
4
Biomedical Research Institute, Kangwon National University Hospital, Chuncheo-si 24289, Korea
5
Department of Epidemiology and Biostatistics, School of Public Health, Seoul National University, Seoul 08826, Korea
6
Department of Internal Medicine and Environmental Health Center, Kangwon National University, Chuncheon-si 24289, Korea
*
Author to whom correspondence should be addressed.
Atmosphere 2021, 12(2), 282; https://doi.org/10.3390/atmos12020282
Submission received: 31 December 2020 / Revised: 16 February 2021 / Accepted: 18 February 2021 / Published: 22 February 2021
(This article belongs to the Special Issue Impacts of Indoor Air Pollution on Cardiopulmonary System)

Abstract

:
Background and Aims: Ambient particulate matter (PM) is causing respiratory symptoms of individuals at all ages and reducing their lung functions. These individuals could develop chronic pulmonary disease. Recent studies have shown that short-term exposure to PM affects acute exacerbation of respiratory disease. However, evidence about the association between long-term exposure and progression of respiratory diseases remains insufficient. The purpose of this study was to examine the association between long-term exposure of air pollution (PM2.5) and the effect on lung imaging phenotype in dust-exposed Korean adults living near cement factories. Methods: We conducted a cross-sectional analysis on the Chronic Obstructive Pulmonary Disease (COPD) in Dusty Areas (CODA) cohort, which was recruited from 2012 to 2014. Emphysema index and mean wall area were measured using an in-house software program developed by the Korean obstructive lung disease study group based on chest CT scan. A satellite-based model was used to estimate the long-term PM2.5 concentration at each participant’s address. Results: Of 504 eligible participants, 400 participants were analyzed. Their mean age was 71.7 years. Most participants were men (N = 301, 75.3%). The emphysema index of the whole group was 6.63 ± 0.70, and the mean wall area was 68.8 ± 5.2. Image measurement and PM2.5 concentration showed no significant difference in the whole group; however, in the group of subjects with normal lung function, there were significant associations between long-term PM2.5 exposure and emphysema index measurement: 1-year (ß = 0.758, p = 0.021), 3-year (ß = 0.629, p = 0.038), and 5-year (ß = 0.544, p = 0.045). There was no significant association between long-term PM2.5 exposure and mean wall area measurement: 1-year (ß = −0.389, p = 0.832), 3-year (ß = −3.677, p = 0.170), and 5-year (ß = −3.769, p = 0.124). Conclusions: This study suggests that long-term exposure of PM2.5 may affect the emphysematous change in patients with normal lung functions.

1. Introduction

Particulate matter (PM) is a complicated mixture of chemical components and a widely studied air pollutant [1]. Fine PM can be inhaled and deposited into the lower bronchus and lung parenchyma, thus effecting the respiratory system. Ambient PM can induce an inflammatory reaction by increasing free radical production [2]. Such inflammatory response is known to cause acute exacerbations of respiratory or cardiovascular disease [3]. The Global Burden of Diseases, Injuries, and Risk Factors Study 2016 (GBD 2016) reported that about 7.5% of all deaths were caused by ambient PM pollution in 2016, globally [4].
Ambient PM not only brings respiratory symptoms at all ages [5,6], but also reduces lung function and leads to chronic pulmonary disease, such as chronic obstructive pulmonary disease [7]. In addition to previous studies about exacerbations of respiratory or cardiovascular diseases following short-term air pollution exposure, the effects of long-term air pollution exposure on lung function have also been reported recently. A cross-sectional study [7] has shown that PM concentration not only has associations with decreases in lung function indices, such as forced expiratory volume in one second (FEV1), forced vital capacity (FVC), and the ratio of forced expiratory volume in one second to forced vital capacity (FEV1/FVC ratio), but also has a weak correlation with Chronic Obstructive Pulmonary Disease (COPD) prevalence. On the other hand, according to the ESCAPE project (European Studies on Chronic Air Pollution Effects) [8], a significant association has not been observed between ambient PM exposure and COPD prevalence. Although several studies have been published about the association between ambient PM exposure and lung function decline, COPD development, or further lung development, their results have not been consistent, especially for PM2.5. Thus, the objective of this study was to examine the association between long-term exposure to air pollution (PM2.5) and lung imaging phenotype in dust-exposed Korean adults living near cement factories.

2. Methods and Materials

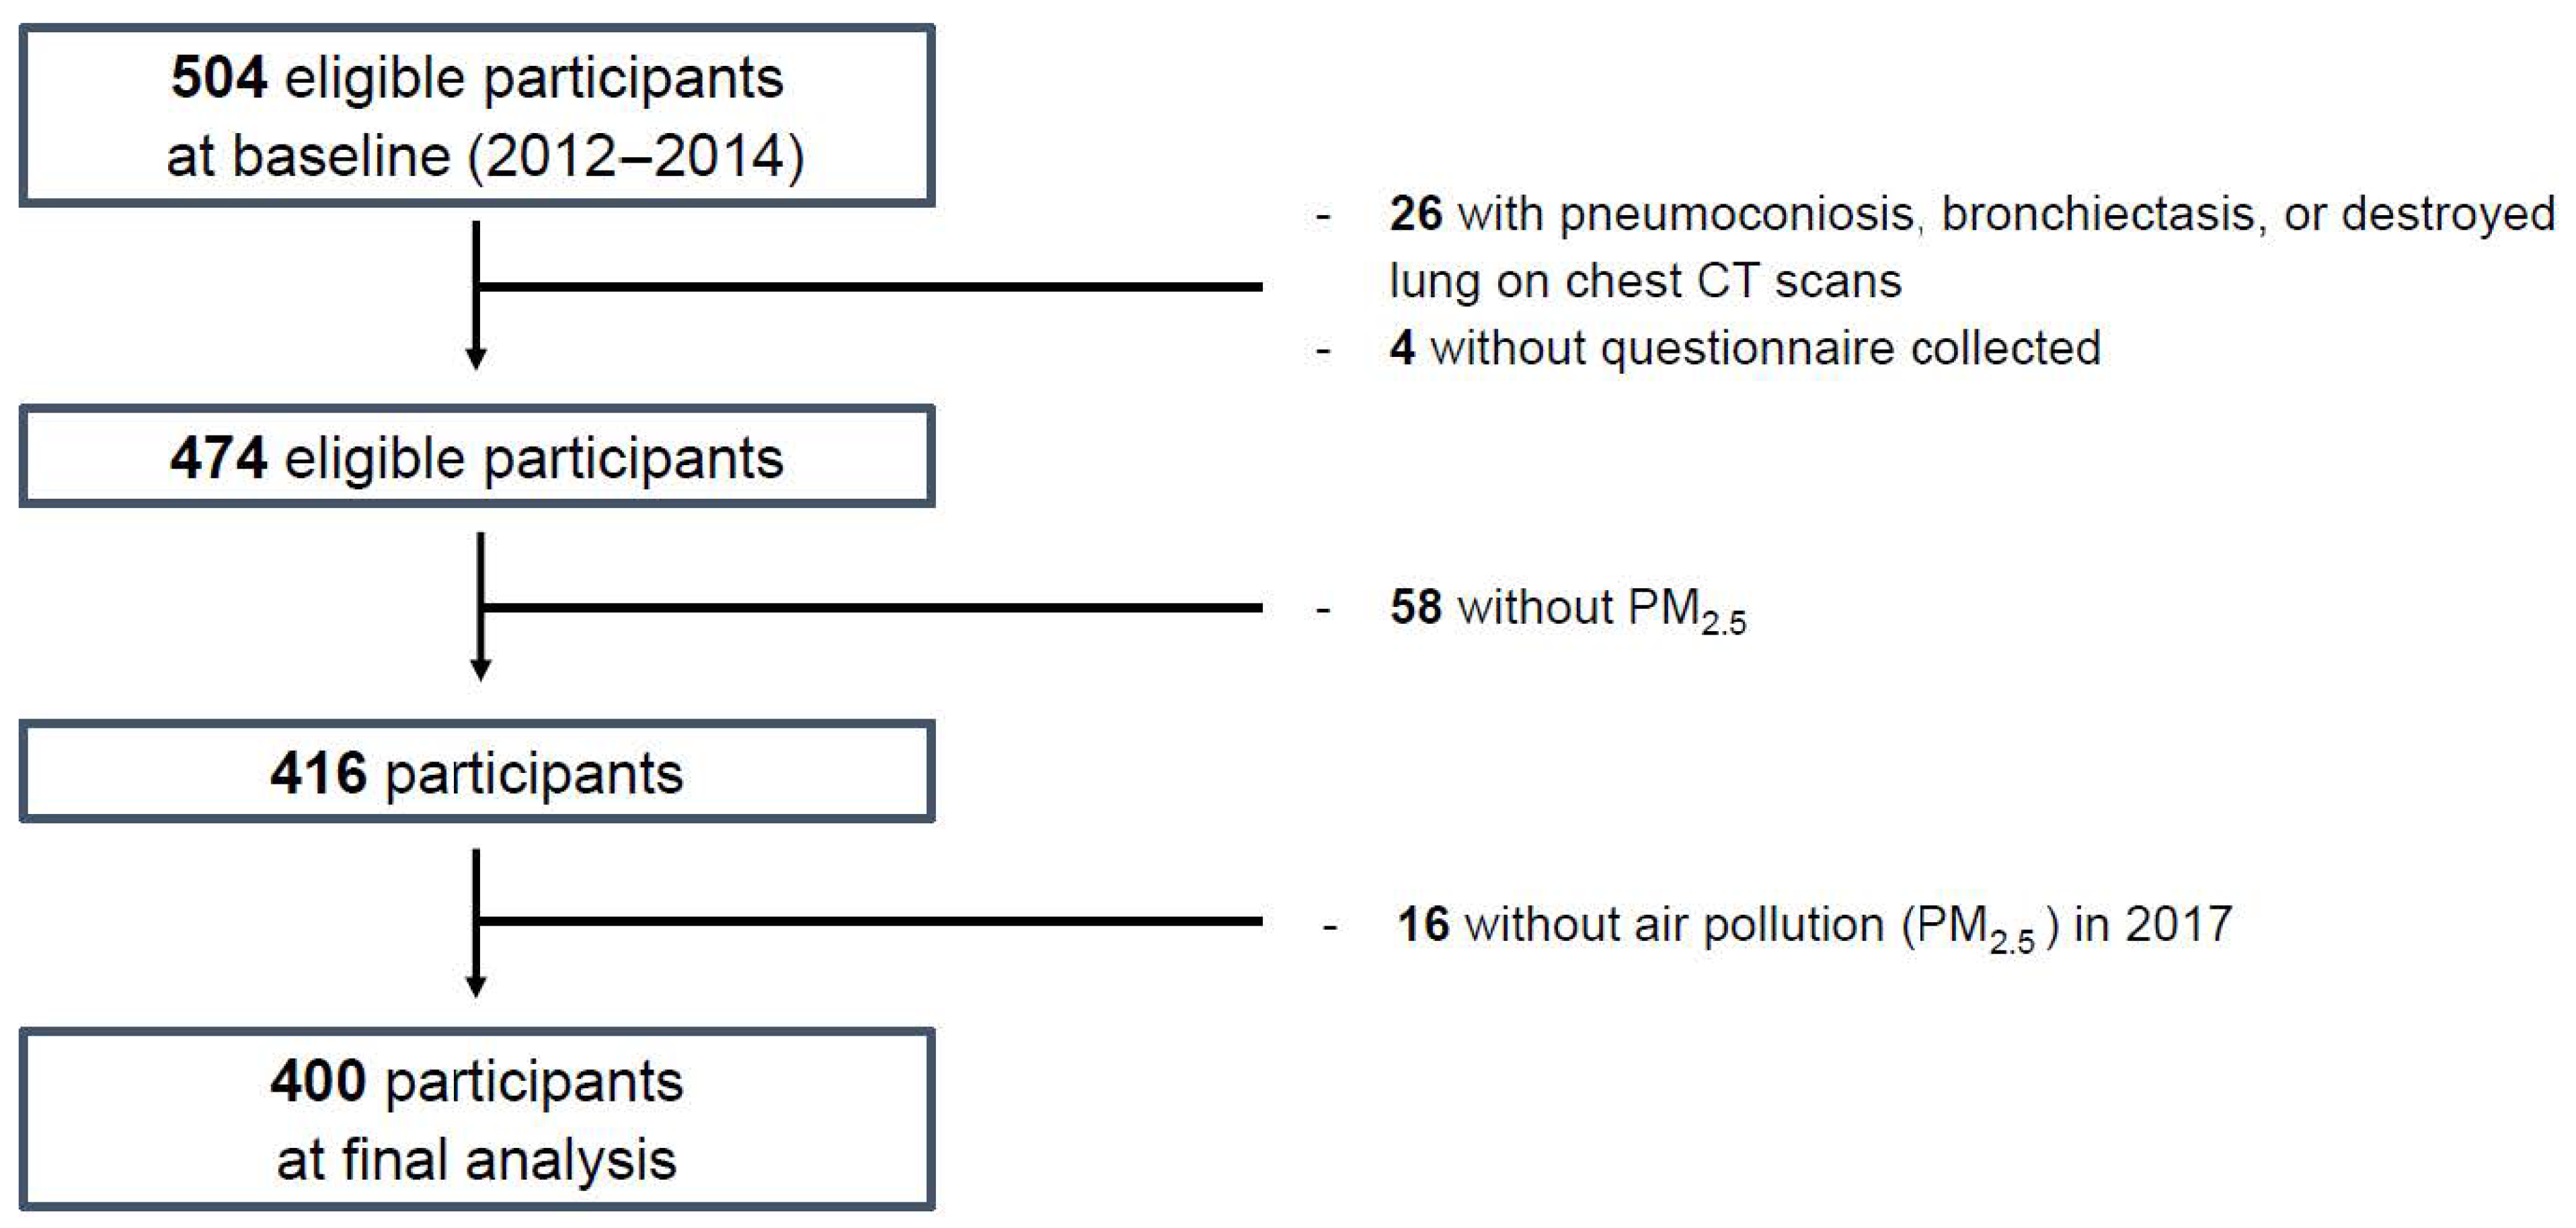
2.1. Study Design and Participants

A cross-sectional analysis was performed for subjects enrolled in the COPD in Dusty Areas (CODA) cohort from 2012 to 2014 [9,10,11]. The administrative districts were selected by the National Institute of Environmental Research of Korea and selected for the surveys on the health effects of cement dust on inhabitants, which were based on the distance from cement plants and wind direction, based on the meteorological data among areas surrounding cement plants since 2007. The CODA cohort study was a longitudinal observational study conducted in six cities (Gangneung, Donghae, Samcheok, Yeongwol, Danyang, and Jecheon) of Kangwon and Chungbuk provinces, South Korea, where cement plants were located. The administrative area is approximately 40–80 km2 wide. It has more than 20,000 residents. Subjects in this cohort study were composed of participants who had airflow limitations and healthy volunteers who agreed to participate in the study. There were more than 20,000 residents within six cities. Residents of each city who decided to participate in the study were enrolled for three years from 2012 to 2014 in a way that each city was enrolled at a different time. Airflow limitation was confirmed by a post-bronchodilator forced expiratory volume in 1 s over forced vital capacity value of less than 0.7 (FEV1/FVC < 0.7) in spirometry. We also collected data of the modified Medical Research Council (mMRC) dyspnea scale and patient-reported COPD assessment test (CAT) via a questionnaire to evaluate their respiratory symptoms and health-related quality of life. This study was approved by the Institutional Review Board (IRB) of Kangwon National University Hospital (IRB No. 2012-06-007). All participants provided written informed consent.

2.2. Lung Function and Image Measurements

Spirometry was performed at enrolled time as a baseline measurement using an Easy One Kit (NDD, Zurich, Switzerland). To check bronchodilator reversibility, spirometry was done before bronchodilation and at 15 min after 400 μg of salbutamol inhalation. Chest computed tomography (CT) scans were also taken at full inspiration and expiration using a first-generation dual source CT system (Somatom Definition, Siemens Healthcare, Forchheim, Germany) in enrollment as the baseline measurement. CT images were obtained without injecting a contrast medium. Imaging data were stored in Digital Imaging and Communications in Medicine format, the international standard for interconnecting medical imaging devices on standard networks. We measured emphysema index (EI: the percentage of low attenuation area 950 Hounsfield units (HU, %LAA-950HU)) and mean wall area percentage ((WA%) of two segmental bronchi) using an in-house software program developed by the Korean obstructive lung disease study group [12].

2.3. PM2.5 Concentration Using Satellite Data

To predict daily PM2.5 concentration, land-use regression was performed using a moderate resolution imaging spectroradiometer satellite aerosol optical depth with 1 km × 1 km, 3 km × 3 km, and 5 km × 5 km spatial resolutions. These grids (1 km × 1 km, 3 km × 3 km, and 5 km × 5 km) were determined to show the same trend regarding the long-term exposure of PM2.5. Aerosol optical depth is a quantitative measure of aerosol particles in the atmosphere. Estimates of PM2.5 using aerosol optical depth measurements from the satellite were calibrated daily using measurements from ground monitoring. These calibrations resulted in “out-of-sample” 10-fold cross-validated R2 (mean “out-of-sample” R2 = 0.85 or 0.87). Annual average PM2.5 concentrations were estimated for index year 2012. Based on the index year 2012, annual average PM2.5 concentrations were measured (note that “1-year” refers to the average value of PM2.5 concentrations for the previous year at the time of enrollment). By using an index year for each of the study participants, any differences in exposure between study participants would be attributable to different locations of residence and their nearby PM2.5 sources and would not be attributable to differences in the year when participants underwent examinations. We checked the geocoded addresses of CODA study participants and observed their long-term exposure to annual average PM2.5 concentrations for the previous year at the time of enrollment (“1-year”), for the previous three years at the time of enrollment (“3-year”), and for the previous five years at the time of enrollment (“5-year”) from the baseline examination.

2.4. Statistical Analysis

Age, gender, education (<elementary school, elementary school, middle school, ≥high school), smoking status (current smokers, former smokers, never smokers), pack-years of smoking, height, weight, drug history, history of asthma, and average PM 2.5 concentration at survey year were considered as covariates. Continuous variables are presented as mean and standard deviation or median with interquartile range (IQR). Categorical data are presented as number (percentage). Associations between air pollution and image measurements (emphysema index and mean wall area percentage) were examined using a multiple linear regression model after adjusting for potential confounders. All statistical data were analyzed using SAS version 9.4 (SAS Institute Inc., Cary, NC, USA).

3. Results

3.1. Baseline Characteristics of Study Groups

Of 504 eligible participants, 26 who had pneumoconiosis, bronchiectasis, or tuberculous destroyed lung on chest CT scans, 4 who had no questionnaire, and 74 who had no PM2.5 data were excluded. Finally, 400 participants were analyzed (Figure 1). Their mean age was 71.7 years (Table 1). Most participants were men (N = 301, 75.3%). Most subjects were ex-smokers or current smokers (N = 264, 66%). The average smoking amount was 18.4 pack-years. Mean FEV1/FVC was 0.65 ± 0.11. CAT score was 16.0 and mMRC dyspnea scale score was 1.37. Seventy patients had a previous history of asthma. The emphysema index of the whole group was 6.63 ± 0.70. The mean wall area was 68.8 ± 5.2 (Table 1). Additionally, baseline characteristics of normal healthy volunteers are shown in Table S5.

3.2. Association of Image Measurements with PM2.5 Concentration

There were no significant associations between image measurements and PM2.5 concentration in the whole group (Table 2). However, when a subgroup analysis was performed by dividing the subjects into a normal lung function group and a COPD group (Table 3), there were significant associations between annual PM2.5 exposure and emphysema index of the normal lung function group, even for measurements of different conditions: for the previous year at the time of enrollment (1-year: ß = 0.758, p = 0.021), for the previous three years at the time of enrollment (3-year: ß = 0.629, p = 0.038), and for the previous five years at the time of enrollment (5-year: ß = 0.544, p = 0.045) from the baseline examination. However, there were no significant associations between long-term PM2.5 exposure and mean wall area of the normal lung function group: 1-year (ß = −0.389, p = 0.832), 3-year (ß = −3.677, p = 0.170), and 5-year (ß = −3.769, p = 0.124) (Table 3). In the COPD group, the association between PM2.5 exposure and emphysema index or mean wall area was insignificant for various conditions. There was no statistically significant finding in the analysis of smoking status (Table S1), body mass index (BMI) (Table S2), or Charlson comorbidity index (Table S3). Except smoking status, there was an insignificant association between lung imaging and personal factors (resident cities, age, and sex) (Table S4).

4. Discussion

In this study, we investigated the lung imaging phenotype following prolonged PM2.5 exposure. Our study had some remarkable findings. First, specific findings in lung imaging phenotype were observed after long-term exposure to ambient PM2.5. Second, there was no significant association in emphysema index or mean wall area in COPD patients who already had clinical manifestations. However, significant difference in emphysema index was confirmed in the normal lung function group following the long-term exposure of PM2.5. This means that morphological changes induced by exposure to PM2.5 might precede the onset of clinical COPD disease.
PM arises from different sources, such as the construction industry, automobile use, and heating systems. It has recently become a social problem because it affects public health in various ways [13,14,15]. The association between short-term PM exposure and the acute exacerbation of respiratory or cardiovascular disease has been demonstrated [6,16]. Such exposure could increase daily mortality [6,16].
Recently, it has been reported that long-term air pollution exposure can cause lung function decline, COPD development due to decreased lung function, and lung growth abnormality [7,17,18,19,20]. The Multi-Ethnic Study of Atherosclerosis (MESA) has investigated the association between PM2.5 exposure and percent emphysema or lung function decline [21]. It showed that the association between air pollution and percent emphysema value was not conclusive. It also revealed that lung function decline was not significantly associated with ambient PM exposure. On the other hand, our study showed significant findings in lung imaging after long-term PM2.5 exposure.
One large-scale prospective study, the Swiss Cohort Study on Air Pollution and Lung Diseases in Adults (SAPALDIA) study, has concluded that reducing PM10 exposure to ambient pollution can improve the deterioration of lung function [19]. Another study from the Taiwan MJ Health Management Institution cohort has found that long-term exposure to PM2.5 pollution is associated with lung function reduction and the risk of prevalence of COPD [20]. Our study also investigated the effect of PM2.5 exposure on lung phenotype using the CODA cohort. Similar to previous studies, the present study also revealed important findings regarding lung imaging phenotype after PM2.5 exposure. Such findings were demonstrated by emphysema index. A notable finding of our study was that there was no statistically significant effect of long-term PM2.5 exposure on lung imaging phenotype in the COPD group. However, long-term PM2.5 exposure had a significant effect on the emphysema index value of the normal lung function group. Fine dust exposure is known to adversely affect the respiratory system through mechanisms such as oxidative stress and airway inflammation [1,2,3]. Persistent oxidative stress and inflammation can cause loss of alveolar tissue and changes in emphysema index values [22]. The change of alveolar tissue might be more pronounced in subjects with normal lung function before exposure than in those already diagnosed with COPD.
This study had some potential limitations. First, longitudinal lung function decline following changes in the emphysema index could not be analyzed together. As we mentioned in methods section, the baseline examinations, including chest CT scan, were perform at the enrollment, the time of enrollment was set as the index year, and the annual average PM2.5 concentrations were estimated for the previous year (“1-year”), three years (“3-year”), and five years (“5-year”) from the baseline examination. Second, ambient air pollution was not analyzed through daily changes such as temperature and humidity. In addition, PM was not measured in the place where each participant actually lives. However, in reality, such measurement is not easy. Thus, the value of ambient PM is usually acquired by measurements acquired from a station close to the area where the participant lives. To solve this problem, we used aerosol optical depth with 1 × 1 km, 3 × 3 km, and 5 × 5 km spatial resolutions instead of a 10 × 10 km resolution in order to narrow the measurement range in this study. Results of this study confirmed that PM2.5 could cause morphological changes in the lungs, indicating that morphological changes might have occurred before actual clinical diseases such as COPD.

5. Conclusions

Long-term PM2.5 exposure is significantly associated with lung imaging phenotype. Additionally, phenotypic imaging presented as emphysema index was found in the normal lung function group, not in the COPD group. Further studies are needed to determine accompanying lung function change in addition to longitudinal imaging phenotype change.

Supplementary Materials

The following are available online at https://www.mdpi.com/2073-4433/12/2/282/s1, Table S1: Image measurement & PM2.5 concentration (per 5 ug.m3 increase) by smoking status, Table S2: Image measurement & PM2.5 concentration (per 5 ug.m3 increase) by overweight/obese, Table S3: Image measurement & PM2.5 concentration (per 5 ug.m3 increase) by CCI (≥1), Table S4: Association between lung imaging and personal factors, Table S5: Baseline characteristics of normal healthy volunteers.

Author Contributions

Conceptualization, W.J.K. and C.Y.L.; methodology, S.O.K., and H.K.; software, H.K.; validation, H.K.; formal analysis, S.O.K.; investigation, Y.K.; resources, H.K.; data curation, S.O.K.; writing—original draft preparation, Y.K.; writing—review and editing, Y.K., W.J.K., and C.Y.L.; visualization, Y.K., and S.H.B.; supervision, C.Y.L.; project administration, W.J.K.; funding acquisition, W.J.K. All authors have read and agreed to the published version of the manuscript.

Funding

This research received no external funding.

Institutional Review Board Statement

Not applicable.

Informed Consent Statement

Not applicable.

Data Availability Statement

Not applicable.

Acknowledgments

We deeply appreciated Myoung-Nam Lim for supporting us in our research, including statistical analysis.

Conflicts of Interest

The authors have reported that no potential conflicts of interest exist with any companies/organizations whose products or services may be discussed in this article.

References

  1. Jia, Y.-Y.; Wang, Q.; Liu, T. Toxicity Research of PM2.5 Compositions In Vitro. Int. J. Environ. Res. Public Health 2017, 14, 232. [Google Scholar] [CrossRef] [Green Version]
  2. Donaldson, K.; Stone, V.; Borm, P.J.; Jimenez, L.A.; Gilmour, P.S.; Schins, R.P.; Knaapen, A.M.; Rahman, I.; Faux, S.P.; Brown, D.M.; et al. Oxidative stress and calcium signaling in the adverse effects of environmental particles (PM10). Free. Radic. Biol. Med. 2003, 34, 1369–1382. [Google Scholar] [CrossRef]
  3. Feng, S.; Gao, D.; Liao, F.; Zhou, F.; Wang, X. The health effects of ambient PM2.5 and potential mechanisms. Ecotoxicol. Environ. Saf. 2016, 128, 67–74. [Google Scholar] [CrossRef] [PubMed]
  4. Lei, Y.C.; Chan, C.C.; Wang, P.Y.; Lee, C.T.; Cheng, T.J. Effects of Asian dust event particles on inflammation markers in peripheral blood and bronchoalveolar lavage in pulmonary hypertensive rats. Environ. Res. 2004, 95, 71–76. [Google Scholar] [CrossRef]
  5. GBD 2016 Risk Factors Collaborators. Global, regional, and national comparative risk assessment of 84 behavioural, environmental and occupational, and meta-bolic risks or clusters of risks, 1990-2016: A systematic analysis for the Global Burden of Disease Study 2016. Lancet 2017, 390, 1345–1422. [Google Scholar] [CrossRef] [Green Version]
  6. Chen, L.; Yang, W.; Jennison, B.L.; Omaye, S.T. Air particulate pollution and hospital admissions for chronic obstructive pulmonary disease in Reno, Nevada. Inhal. Toxicol. 2000, 12, 281–298. [Google Scholar]
  7. Choi, J.; Oh, J.Y.; Lee, Y.S.; Min, K.H.; Hur, G.Y.; Lee, S.Y.; Kang, K.H.; Shim, J.J. Harmful impact of air pollution on severe acute exacerbation of chronic obstructive pulmonary disease: Particulate matter is hazardous. Int. J. Chron. Obstruct. Pulmon. Dis. 2018, 13, 1053–1059. [Google Scholar] [CrossRef] [PubMed] [Green Version]
  8. Liu, S.; Zhou, Y.; Liu, S.; Chen, X.; Zou, W.; Zhao, D.; Li, X.; Pu, J.; Huang, L.; Chen, J.; et al. Association between exposure to ambient particulate matter and chronic obstructive pulmonary disease: Results from a cross-sectional study in China. Thorax 2017, 72, 788–795. [Google Scholar] [CrossRef] [PubMed] [Green Version]
  9. Schikowski, T.; Adam, M.; Marcon, A.; Cai, Y.; Vierkötter, A.; Carsin, A.E.; Jacquemin, B.; Al Kanani, Z.; Beelen, R.; Birk, M.; et al. Association of ambient air pollution with the prevalence and incidence of COPD. Eur. Respir. J. 2014, 44, 614–626. [Google Scholar] [CrossRef] [Green Version]
  10. Han, Y.; Heo, Y.; Hong, Y.; Kwon, S.O.; Kim, W.J. Correlation between Physical Activity and Lung Function in Dusty Areas: Results from the Chronic Obstructive Pulmo-nary Disease in Dusty Areas (CODA) Cohort. Tuberc. Respir. Dis. 2019, 82, 311–318. [Google Scholar] [CrossRef]
  11. Kwon, S.O.; Hong, S.H.; Han, Y.-J.; Bak, S.H.; Kim, J.; Lee, M.K.; London, S.J.; Kim, W.J.; Kim, S.-Y. Long-term exposure to PM10 and NO2 in relation to lung function and imaging phenotypes in a COPD cohort. Respir. Res. 2020, 21, 1–11. [Google Scholar] [CrossRef] [PubMed]
  12. Jin, Y.H.W.; Hong, Y.; Kwon, J.-W.; Lee, S.-A.; Han, Y.J.; Moon, J.Y.; Kim, H.Y.; Han, S.-S.; Lee, S.-J.; Kim, W.J. Methodology of an Observational Cohort Study for Subjects with Chronic Obstructive Pulmonary Disease in Dusty Areas Near Cement Plants. J. Pulm. Respir. Med. 2014, 4, 1–5. [Google Scholar] [CrossRef]
  13. Bak, S.H.; Kwon, S.O.; Han, S.-S.; Kim, W.J. Computed tomography-derived area and density of pectoralis muscle associated disease severity and longitudinal changes in chronic obstructive pulmonary disease: A case control study. Respir. Res. 2019, 20, 1–12. [Google Scholar] [CrossRef] [Green Version]
  14. Ogundele, L.T.; Owoade, O.K.; Hopke, P.K.; Olise, F.S. Heavy metals in industrially emitted particulate matter in Ile-Ife, Nigeria. Environ. Res. 2017, 156, 320–325. [Google Scholar] [CrossRef] [PubMed]
  15. Son, J.-Y.; Lee, J.-T.; Kim, K.-H.; Jung, K.; Bell, M.L. Characterization of Fine Particulate Matter and Associations between Particulate Chemical Constituents and Mortality in Seoul, Korea. Environ. Health Perspect. 2012, 120, 872–878. [Google Scholar] [CrossRef] [Green Version]
  16. Kim, W.J.L.C. Environmental exposures and chronic obstructive pulmonary disease. Mol. Cell Toxicol. 2017, 13, 251–255. [Google Scholar] [CrossRef]
  17. Liu, C.; Chen, R.; Sera, F.; Vicedo-Cabrera, A.M.; Guo, Y.; Tong, S.; Coelho, M.S.Z.S.; Saldiva, P.H.N.; Lavigne, E.; Matus, P.; et al. Ambient Particulate Air Pollution and Daily Mortality in 652 Cities. N. Engl. J. Med. 2019, 381, 705–715. [Google Scholar] [CrossRef] [PubMed]
  18. Bloemsma, L.D.; Hoek, G.; Smit, L.A. Panel studies of air pollution in patients with COPD: Systematic review and meta-analysis. Environ. Res. 2016, 151, 458–468. [Google Scholar] [CrossRef] [PubMed]
  19. Gauderman, W.J.; Avol, E.; Gilliland, F.; Vora, H.; Thomas, D.; Berhane, K.; McConnell, R.; Kuenzli, N.; Lurmann, F.; Rappaport, E.; et al. The Effect of Air Pollution on Lung Development from 10 to 18 Years of Age. New Engl. J. Med. 2004, 351, 1057–1067. [Google Scholar] [CrossRef] [PubMed] [Green Version]
  20. Downs, S.H.; Schindler, C.; Liu, L.-J.S.; Keidel, D.; Bayer-Oglesby, L.; Brutsche, M.H.; Gerbase, M.W.; Keller, R.; Künzli, N.; Leuenberger, P.; et al. Reduced Exposure to PM10and Attenuated Age-Related Decline in Lung Function. New Engl. J. Med. 2007, 357, 2338–2347. [Google Scholar] [CrossRef] [PubMed] [Green Version]
  21. Guo, C.; Zhang, Z.; Lau, A.K.H.; Lin, C.Q.; Chuang, Y.C.; Chan, J.; Jiang, W.K.; Tam, T.; Yeoh, E.-K.; Chan, T.-C.; et al. Effect of long-term exposure to fine particulate matter on lung function decline and risk of chronic obstructive pulmonary disease in Taiwan: A longitudinal, cohort study. Lancet Planet Health 2018, 2, e114–e125. [Google Scholar] [CrossRef]
  22. Adar, S.D.; Kaufman, J.D.; Diez-Roux, A.V.; Hoffman, E.A.; D’Souza, J.; Stukovsky, K.H.; Rich, S.S.; Rotter, J.I.; Guo, X.; Raffel, L.J.; et al. Air Pollution and Percent Emphysema Identified by Computed Tomography in the Multi-Ethnic Study of Atherosclerosis. Environ. Health Perspect. 2015, 123, 144–151. [Google Scholar] [CrossRef] [PubMed] [Green Version]
Figure 1. Flow diagram of analytical sample selection criteria: Korean CODA (Chronic Obstructive Pulmonary Disease in Dusty Areas) cohort study (2012–2017).
Atmosphere 12 00282 g001
Table 1. Baseline characteristics of subjects.
CharacteristicsTotal (N = 400)
Sex, male (%)301 (75.3)
Age (years)71.7 ± 7.4
Patients in each age group (%)
44–59 years old27 (6.7)
60–69 years old96 (24.0)
70–79 years old232 (58.0)
80–96 years old45 (11.3)
Height (cm)159.7 ± 9.2
Weight (kg)60.0 ± 10.5
BMI (kg/m2)23.5 ± 3.3
<23.0184 (46.0)
23.0–24.992 (23.0)
≥25.0124 (31.0)
Smoking status
Never smoker136 (34.0)
Ex-smoker174 (43.5)
Current smoker90 (22.5)
Smoking amount (pack-years)18.4 ± 23.9
Education
<Elementary school125 (31.5)
Elementary school149 (37.5)
Middle school59 (14.9)
≥High school64 (16.1)
Income per month (×104 won)
≤49250 (64.4)
50–9961 (15.7)
≥10077 (19.9)
Pulmonary function test, post-bronchodilator response
FVC, L3.03 ± 0.82
FVC, % predicted97.1 ± 19.0
FEV1, L1.96 ± 0.61
FEV1, %predicted86.2 ± 22.3
FEV1/FVC0.65 ± 0.11
Asthma history (yes, %)70 (17.6)
Emphysema index6.63 ± 0.70
Mean wall area68.8 ± 5.2
CAT16.0 ± 9.6
mMRC dyspnea scale score1.37 ± 1.13
093 (23.3)
1164 (41.0)
261 (15.3)
366 (16.5)
416 (4.0)
Physical activity (yes, %)299 (74.7)
Previous exacerbation history (≥1, %)12 (3.0)
Charlson comorbidity index
0225 (56.7)
191 (22.9)
≥281 (20.4)
Data are expressed as mean ± standard deviation or N (%), BMI: body mass index; FVC: forced vital capacity; FEV1: forced expiratory volume in 1 s; CAT: Chronic Obstructive Pulmonary Disease (COPD) assessment test; mMRC dyspnea scale score: modified medical research council dyspnea scale score.
Table 2. Image measurements and PM2.5 concentration (per 5 ug/m3 increase).
Total (N = 400)Emphysema IndexMean Wall Area (%)
β (95% CI)p Valueβ (95% CI)p Value
1-year +, 1 km−0.393 (−2.817, 2.032)0.7500.042 (−2.035, 2.118)0.969
1-year +, 3 km0.748 (−2.244, 3.739)0.6230.468 (−2.094, 3.030)0.720
1-year +, 5 km−1.366 (−4.140, 1.407)0.3330.489 (−1.888, 2.867)0.686
3-year ++, 1 km−0.978 (−3.225, 1.269)0.393−0.816 (−2.754, 1.122)0.408
3-year ++, 3 km−0.197 (−2.955, 2.562)0.889−0.550 (−2.928, 1.828)0.650
3-year ++, 5 km−1.980 (−4.499, 0.539)0.123−0.635 (−2.814, 1.544)0.567
5-year #, 1 km−0.921 (−2.983, 1.141)0.381−0.802 (−2.588, 0.983)0.377
5-year #, 3 km−0.337 (−2.844, 2.169)0.791−0.644 (−2.814, 1.525)0.560
5-year #, 5 km−1.801 (−4.080, 0.478)0.121−0.690 (−2.669, 1.288)0.493
PM: particulate matter; CI: confidence interval. + 1-year: annual average PM2.5 concentrations for the previous year at the time of enrollment from the baseline examination. ++ 3-year: annual average PM2.5 concentrations for the previous three years at the time of enrollment from the baseline examination. # 5-year: annual average PM2.5 concentrations for the previous five years at the time of enrollment from the baseline examination. Adjusted for age, gender, education, height, weight, smoking, pack-years, medication use, asthma history, and annual average PM2.5 concentration for survey year.
Table 3. Image measurements and PM2.5 concentration (per 5 ug/m3 increase) by COPD.
Total (N = 400)EIr ¥Mean Wall Area (%)
β (95% CI)p Valueβ (95% CI)p Value
Normal (N = 132)
1-year +, 1 km0.585 (0.024, 1.146)0.041−4.646 (−9.339, 0.048)0.052
1-year +, 3 km1.181 (0.404, 1.958)0.003−3.943 (−10.733, 2.847)0.251
1-year +, 5 km0.758 (0.118, 1.398)0.021−0.589 (−6.114, 4.935)0.832
3-year ++, 1 km0.498 (−0.020, 1.015)0.059−6.572 (−10.980, −2.164)0.004
3-year ++, 3 km1.051 (0.305, 1.797)0.006−7.088 (−13.763, −0.413)0.038
3-year ++, 5 km0.629 (0.035, 1.222)0.038−3.677 (−8.963, 1.609)0.170
5-year #, 1 km0.433 (−0.031, 0.897)0.067−5.689 (−9.754, −1.624)0.007
5-year #, 3 km0.880 (0.218, 1.541)0.010−6.622 (−12.643, −0.600)0.032
5-year #, 5 km0.544 (0.012, 1.077)0.045−3.769 (−8.597, 1.059)0.124
COPD (N = 268)
1-year +, 1 km−0.074 (−0.286, 0.139)0.4940.987 (−1.352, 3.327)0.407
1-year +, 3 km−0.097 (−0.348, 0.154)0.4481.112 (−1.656, 3.881)0.429
1-year +, 5 km−0.245 (−0.482, −0.009)0.0420.977 (−1.649, 3.603)0.464
3-year ++, 1 km−0.147 (−0.344, 0.050)0.1420.359 (−1.806, 2.525)0.744
3-year ++, 3 km−0.183 (−0.413, 0.047)0.1180.421 (−2.108, 2.950)0.743
3-year ++, 5 km−0.304 (−0.518, −0.090)0.0060.273 (−2.109, 2.654)0.822
5-year #, 1 km−0.136 (−0.318, 0.046)0.1430.259 (−1.738, 2.255)0.799
5-year #, 3 km−0.167 (−0.378, 0.044)0.1200.296 (−2.019, 2.612)0.801
5-year #, 5 km−0.263 (−0.458, −0.067)0.0090.180 (−1.984, 2.344)0.870
PM: particulate matter; COPD: chronic obstructive pulmonary disease; CI: confidence interval. ¥ EIr is the log transformation of the emphysema index. + 1-year: annual average PM2.5 concentrations for the previous year at the time of enrollment from the baseline examination. ++ 3-year: annual average PM2.5 concentrations for the previous three years at the time of enrollment from the baseline examination. # 5-year: annual average PM2.5 concentrations for the previous five years at the time of enrollment from the baseline examination. Adjusted for age, gender, education, height, weight, smoking, pack-years, medication use, asthma history, and annual average PM2.5 concentration for survey year.
Publisher’s Note: MDPI stays neutral with regard to jurisdictional claims in published maps and institutional affiliations.

