Article

Projected Elevated [CO2] and Warming Result in Overestimation of SPAD-Based Rice Leaf Nitrogen Status for Nitrogen Management

1
State Key Laboratory of Soil and Sustainable Agriculture, Institute of Soil Science, Chinese Academy of Sciences, Nanjing 210008, China
2
University of Chinese Academy of Sciences, Beijing 100010, China
*
Author to whom correspondence should be addressed.
These authors contributed equally to the article.
Atmosphere 2021, 12(12), 1571; https://doi.org/10.3390/atmos12121571
Submission received: 16 August 2021 / Revised: 28 October 2021 / Accepted: 25 November 2021 / Published: 27 November 2021
(This article belongs to the Special Issue Advanced Climate Simulation and Observation)

Abstract

:
Nitrogen (N) has a unique place in agricultural systems with large requirements. To achieve optimal nitrogen management that meets the needs of agricultural systems without causing potential environmental risks, it is of great significance to increase N use efficiency (NUE) in agricultural systems. A chlorophyll meter, for example, the SPAD-502, can provide a simple, nondestructive, and quick method for monitoring leaf N status and NUE. However, the SPAD-based crop leaf’s N status varies greatly due to environmental factors such as CO2 concentration ([CO2]) or temperature variations. In this study, we conducted [CO2] (ambient and enriched up to 500 μmol moL1) and temperature (ambient and increased by 1.5~2.0 °C) controlled experiments from 2015 to 2017 and in 2020 in two Free-Air CO2 Enrichment (FACE) sites. Leaf characters (SPAD readings, chlorophyll a + b, N content, etc.) of seven rice cultivars were measured in this four year experiment. Here, we provide evidence that SPAD readings are significantly linearly correlated with rice leaf chlorophyll a + b content (chl a + b) and N content, while the relationships are profoundly affected by elevated [CO2] and warming. Under elevated [CO2] treatment (E), the relationship between chl a + b content and N content remains unchanged, but SPAD readings and chl a + b content show a significant difference to those under ambient (A) treatment, which distorts the SPAD-based N monitoring. Under warming (T), and combined elevated [CO2] and warming (ET) treatments, both of the relationships between SPAD and leaf a + b content and between leaf a + b content and N content show a significant difference to those under A treatment. To deal with this issue under the background of global climate change dominated by warming and elevated [CO2] in the future, we need to increase the SPAD reading’s threshold value by at least 5% to adjust for applying N fertilizer within the rice cropping system by mid-century.

1. Introduction

Due to its critical role in plants’ metabolic activities and heavy losses associated with soil–plant systems, nitrogen (N) is an essential element in plant metabolic functions [1]. Insufficient nitrogen application will result in rice production remaining below its potential [2,3]. Consequently, there is an urgent need to balance N input and rice production. Nitrogen (N) has a unique place in agricultural systems with significant requirements for cropping systems’ efficient N management and NUE. Great efforts have been made to enhance the NUE of crops using soil-based or plant-based strategies for identifying appropriate time-splitting applications and optimizing fertilizer deposition methods [4,5,6,7]. Based on monitoring the N status of rice by measuring chlorophyll content per leaf area, plant-based strategies can improve NUE significantly [8,9]. Due to the incongruence between N supply and crop demand, soil-based strategies have rarely been employed.
Currently, several methods can measure chlorophyll content in crops’ leaves, which can be divided into destructive and nondestructive methods. The destructive methods estimate chlorophyll using solvents and spectrophotometer. These methods can be laborious and time-consuming [10]. To determine chlorophyll content near-instantly, hand-held chlorophyll meters (SPAD-502, Konica Minolta Sensing, Inc., Sakai, Osaka, Japan) have been used to estimate relative chlorophyll content on the same leaf over time. Based on the difference in chlorophyll absorption of two wavelengths of light (650 nm, which is absorbed by chlorophyll; 940 nm, in which no chlorophyll absorption occurs), this method can provide a quick, and nondestructive method for estimating leaf chlorophyll content [11]. SPAD is widely used in scientific experiments and agricultural production to rapidly obtain chlorophyll content and the health status of different kinds of crops and to guide N fertilizer management [9,12,13,14,15]. For rice, numerous studies have shown that SPAD-based nitrogen management can improve agronomic N use efficiency (the increase in grain yield per unit of N applied) by 200–276% [8,16,17]. However, other studies have found that SPAD, chlorophyll content, and leaf N status were substantially affected by environmental factors such as crops’ growing temperature, CO2 concentration, etc. [18,19]. No obvious effect of elevated [CO2] or temperature elevation on leaf SPAD was detected in the early and middle growth stages [16,20,21,22]. However, a decrease in leaf N content was often found in elevated [CO2] studies [23,24], and the combination of E and T treatment further enhances the decreased magnitude [25]. In view of the fact that SPAD, chlorophyll, and leaf nitrogen have changed differently in elevated [CO2] or temperature, their relationship is bound to change and needs to be reassessed.
According to the latest IPCC AR6 report, [CO2] will continue to increase during this century, reaching 600–1000 ppm by 2100; the global surface temperature will also continue to increase, and global warming of 1.5 °C and 2 °C will be exceeded during the twenty-first century unless there are deep reductions in CO2 and other greenhouse gas emissions [26,27]. This rapid increase in [CO2] and temperature alters several basic biological functions in plants. Changes in leaf morphology, including thickness and density, can, in turn, impact the optical path of the SPAD device and then the SPAD value. Overall, these results suggest that the relationship between SPAD readings and chlorophyll leaf content will be altered as [CO2] and temperature continue to increase. Elevated [CO2] has also been shown in multiple studies to reduce leaf N concentration [19,28,29,30,31,32,33]. Since SPAD determines the relative value of leaf chlorophyll content, many studies have sought to establish critical SPAD threshold values below which rice corresponds to N fertilization deficiency. Generally, SPAD readings below 35 units were defined as a critical value of the need for N fertilization in rice [8,34,35,36]. However, the variations in relationship between SPAD readings and nitrogen content under elevated [CO2] and warming remain unexplored, and it is unclear whether the current critical value can still work for N fertilizer management in the future. Thus, in this work, at two Free-Air CO2 Enrichment (FACE) facilities, we explored the variations in rice leaf SPAD readings, chl a + b content and N content and the relationship between each of them under elevated [CO2] and warming treatments. Specifically, we aim to address the following questions: (1) how does the relationship between rice leaf SPAD readings and N content vary under elevated [CO2] and warming treatments? (2) What is the reason for the variations in their relationships? (3) Finally, how can we deal with this issue in the future?

2. Materials and Methods

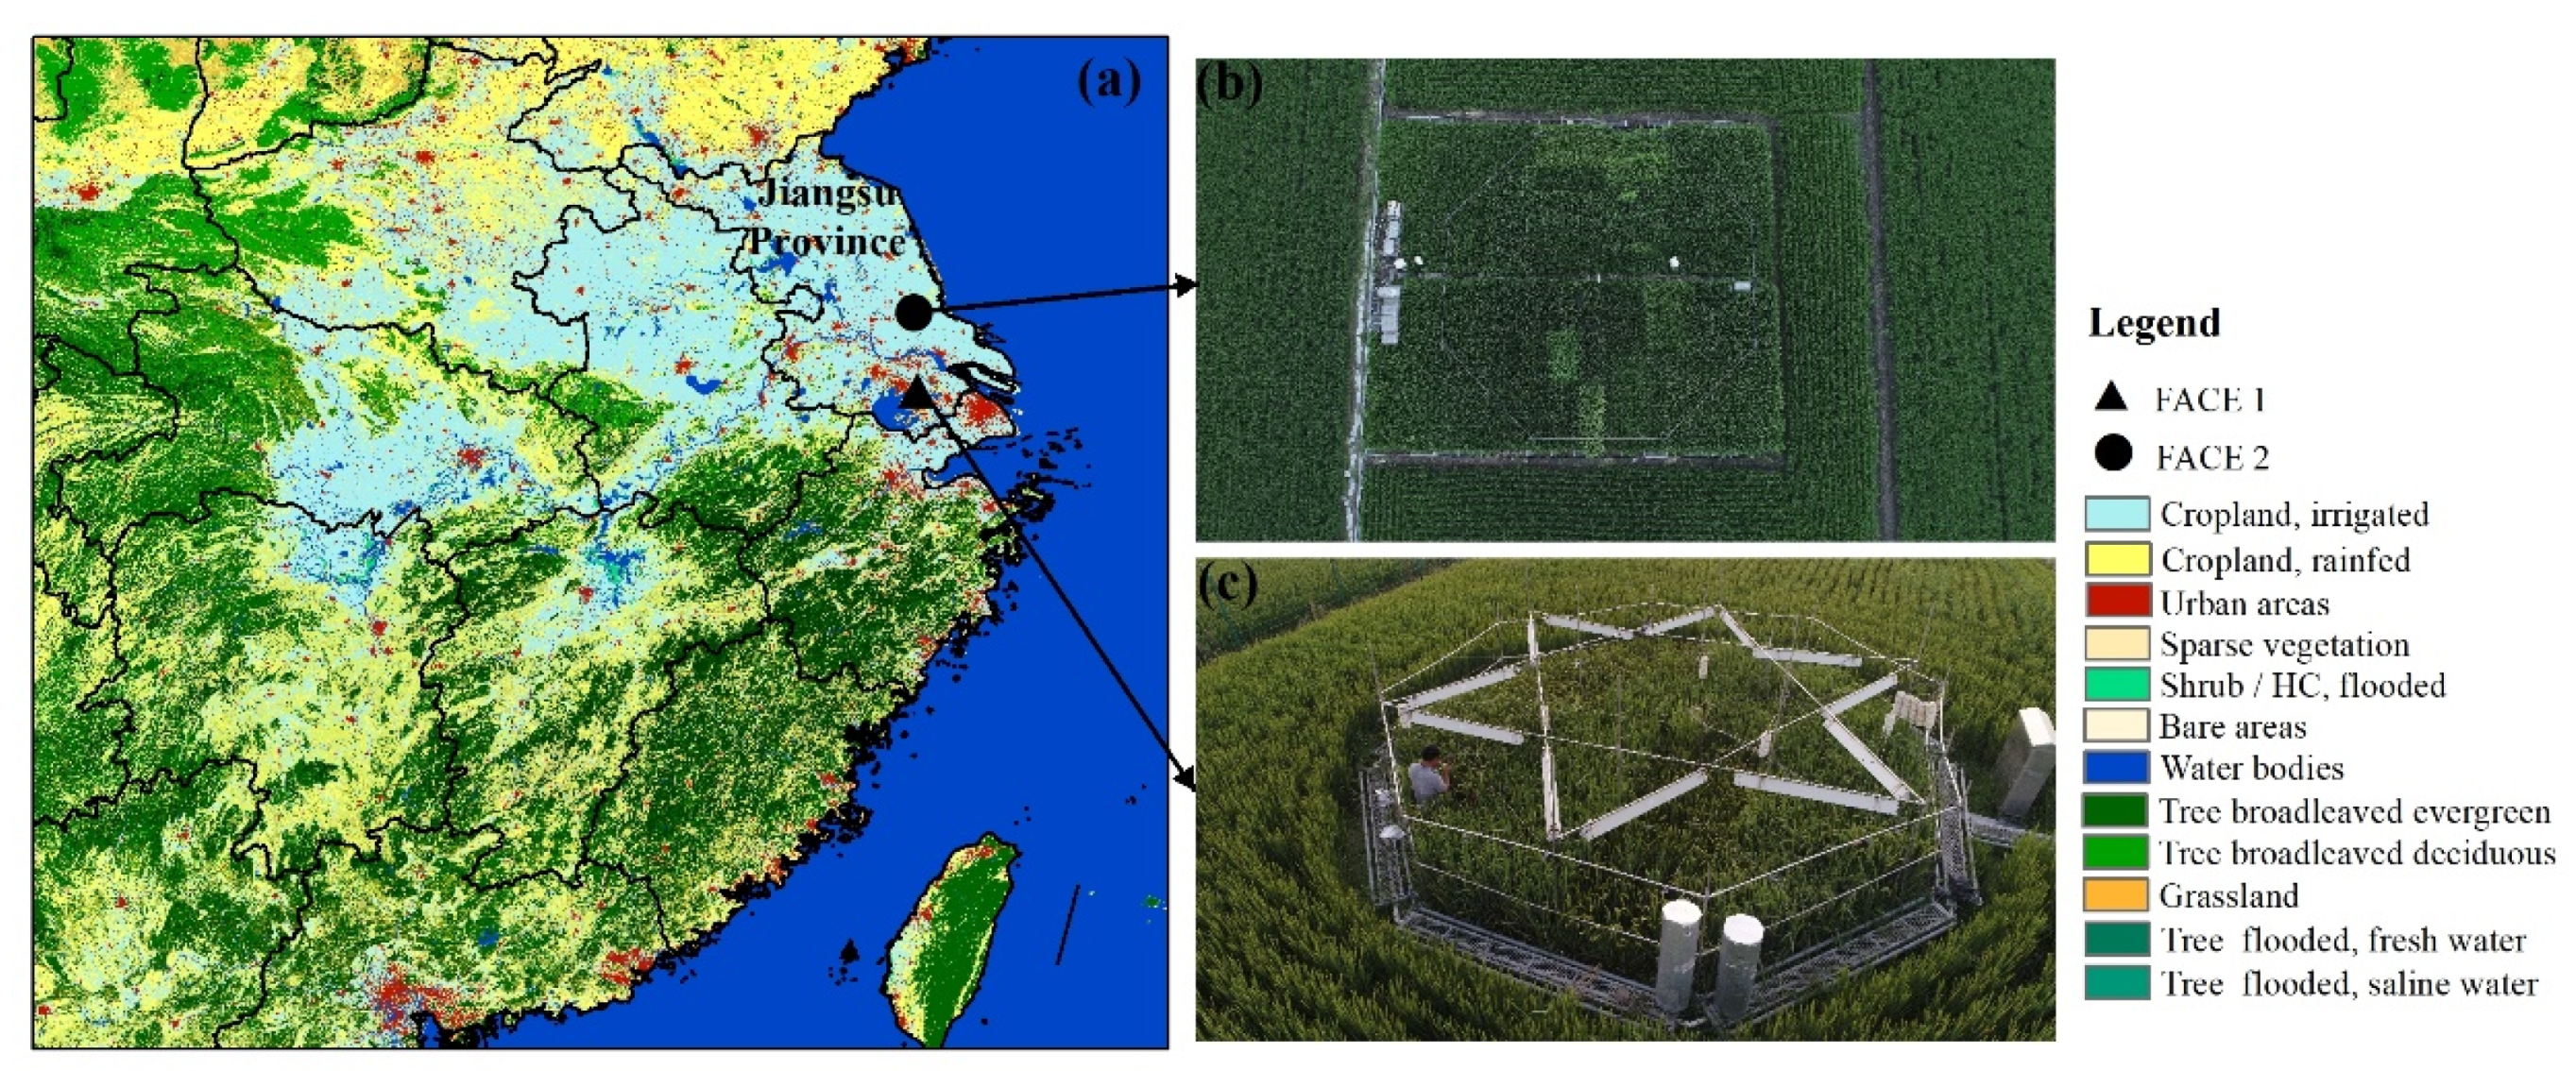
2.1. Experimental Site and Growth Condition

We conducted CO2 and temperature-controlled field experiments in 2020 in the FACE 1 system located in Kangbo village (31°30′ N, 120°33′ E), Changsu Municipality, Jiangsu Province, China. As a further verification and supplement, we also include CO2-controlled experimental data from 2015 to 2017 in the FACE 2 system in our study. FACE2 is located in Zongcun village (32°35″ N, 119°42″ E), Jiangdu District, Jiangsu Province in China, and both are typical rice growing regions (Figure 1).
The region of the FACE1 system has a subtropical monsoon climate with a rice growing season average temperature of 24 °C in 2020. The soil is classified as a gleyic stagnic anthrosol. Properties of the topsoil at a depth of 15 cm are as follows: soil pH 7.0, soil organic carbon 1.6%, and total nitrogen 1.9 g kg−1. The region of the FACE 2 system is typical of a northern subtropical monsoon climate. The soil is classified as a Shajiang-Aquic Cambiosol. Soil properties at a depth of 15 cm are as follows: bulk density 1.16 g cm−3, soil organic carbon 18.4 g kg−1, total nitrogen 1.45 g kg−1, total phosphorous 0.63 g kg−1, total potassium14.0 g kg−1, available phosphorous 10.1 mg kg−1, available potassium 70.5 mg kg−1, and pH 6.8.
The operation and control systems for both FACE facilities were the same as those used at the Japan FACE site [37,38]. Each FACE plot was encircled with a ring (8 m diameter for FACE1 and 14 m diameter for FACE2 system) with emission tubes that injected pure CO2 at around 30 cm above the plant canopy controlled by Li-820 CO2 sensors (LI-COR Inc., Lincoln, NE, USA). The rings were raised as the canopy grew to maintain the CO2 set point. Ambient control plots did not receive any supplemental CO2. The CO2 set value in FACE plots was ~200 µmol moL−1 above that of ambient control plots. CO2 release was controlled by a program with an algorithm based on the speed and direction of the wind to maintain the target CO2 concentration ([CO2]).
In the FACE1 system, 12 octagonal plots were located in uniform paddy fields with similar soils and agronomic histories [39], and the facility also included 12 infrared heaters (detailed information can be found in Cai et al., 2016). The canopy warming magnitude under the controlled plot in 2020 was +1.6~1.7 °C as compared with ambient plot. In the FACE2 system, three rectangular and uniform paddy fields were established. A FACE treatment was paired with an ambient plot within each area, and plot centers were 90 m apart to avoid additional CO2 diffusion.

2.2. Sampling and Measurements

In the FACE1 system, four rice (Oryza sativa L.) varieties including cvs. Xiangliangyou 143, Changyou 5, Wuyungeng 23 and Yangdao 6 were planted. Seeds of each line were sown on 27 May 2020 and transplanted on 22 June 2020. The basal nitrogen (N) and two top-dressed N were applied at 69, 60, and 52 kg·ha−1, respectively. For FACE2 experiments, five rice (Oryza sativa L.) varieties including cvs. Yangdao 6 (YD6), Y Liangyou 900 (Y900), Wuyungeng 23 (WYG23), Wuyungeng 27 (WYG27), Nangeng 9108 (NG9108) were chosen (YD6, WYG23, NG9108 for 2015; YD6, Y900, WYG23, NG9108 for 2016; YD6, Y900, WYG23, WYG27 for 2017). Seeds of each line were sown on 20 May 2015 and 2016, 22 May 2017, and transplanted on 20 June, 17 June and 21 June in 2015, 2016 and 2017, respectively. The spacing of the hills was 16.7 cm × 25 cm (equivalent to 24 hills·m−2). A fertilizer dose of 225:90:90 kg ha−1 nitrogen (N)–phosphorus (P)–potassium (K) was applied to all plots over the season; 40% of the N and whole of the P and K was applied as the basal starter dose, while residual N was equally split at middle tillering and the panicle initiation stage.
SPAD readings and leaf samples were collected on 15 August, 6 September, and 25 September in 2020, respectively, in FACE1. In FACE2 system, SPAD readings and leaf samples were collected on September 1, 8, and 23 in 2015. In 2016 and 2017, SPAD readings and leaf samples were collected every ten days from 10 August to 23 September and from 3 August to 5 September, respectively. SPAD measurements were conducted on the newest fully expanded leaf (flag leaf during grain fill following full expansion). Measurements occurred between 07:00 a.m. and 09:00 a.m. to minimize the potential effects of light intensity on SPAD readings [40]. Four to eight SPAD readings were taken from around the midpoint of each leaf blade, and both sides of the midrib for each leaf. In FACE1 system, four leaves were selected in each plot and the SPAD values of each leaf were recorded. Then, these four leaves were kept separately in liquid nitrogen tank. In the lab, a hole punch was used to remove a fixed area of the middle third of leaves to determine chlorophyll content, and the remaining middle third of leaves was measured for leaf area and N content (mg cm−2). In the FACE2 system, ten leaves were selected in each plot, and then the SPAD readings were averaged. After SPAD readings were recorded, these leaves were collected. Half of the leaves were randomly selected and put into a portable tank with liquid nitrogen for back up, while the remaining leaves were photographed on a graduated scale on a white background and processed with Image J software (The National Institutes of Health) to obtain the leaf area. Then, photographed leaves were used for determination of N. Chlorophyll concentration, measurements were conducted using a spectrophotometer (UV2102, Unico, NJ, America) and 95% (v/v) alcohol extracts of leaf tissue [41]. The samples for leaf N measurement were oven-dried at 80 °C to constant weight and digested using the micro-Kjeldahl method, after which the N concentration was measured with a discrete wet chemistry analyzer. The concentration of leaf N was calculated as area-based (N weight per unit leaf area).

2.3. Data Analysis

To better compare the variations of SPAD, chl a + b content, and nitrogen content, we calculated their normalized values using minimum–maximum value-based normalization method as follows [42]
Y = Y Y m i n Y m a x Y m i n
where Y denotes the normalized SPAD/chl a + b content/N content; Y is the original SPAD/chl a + b content/N content values; Y m a x and Y m i n are, respectively, the maximum or minimum values of the original SPAD/chl a + b/N content values. ANOVA was used to determine differences between treatment means. All results reported as significant had a p < 0.05 unless stated otherwise. To show the distributions of all measured leaf SPAD, chl a + b content, and N content under different controls, violin plot is employed here. The violin plot synergistically combines the box plot and density trace into a single display that can reveal structure found within the data [43].

3. Results

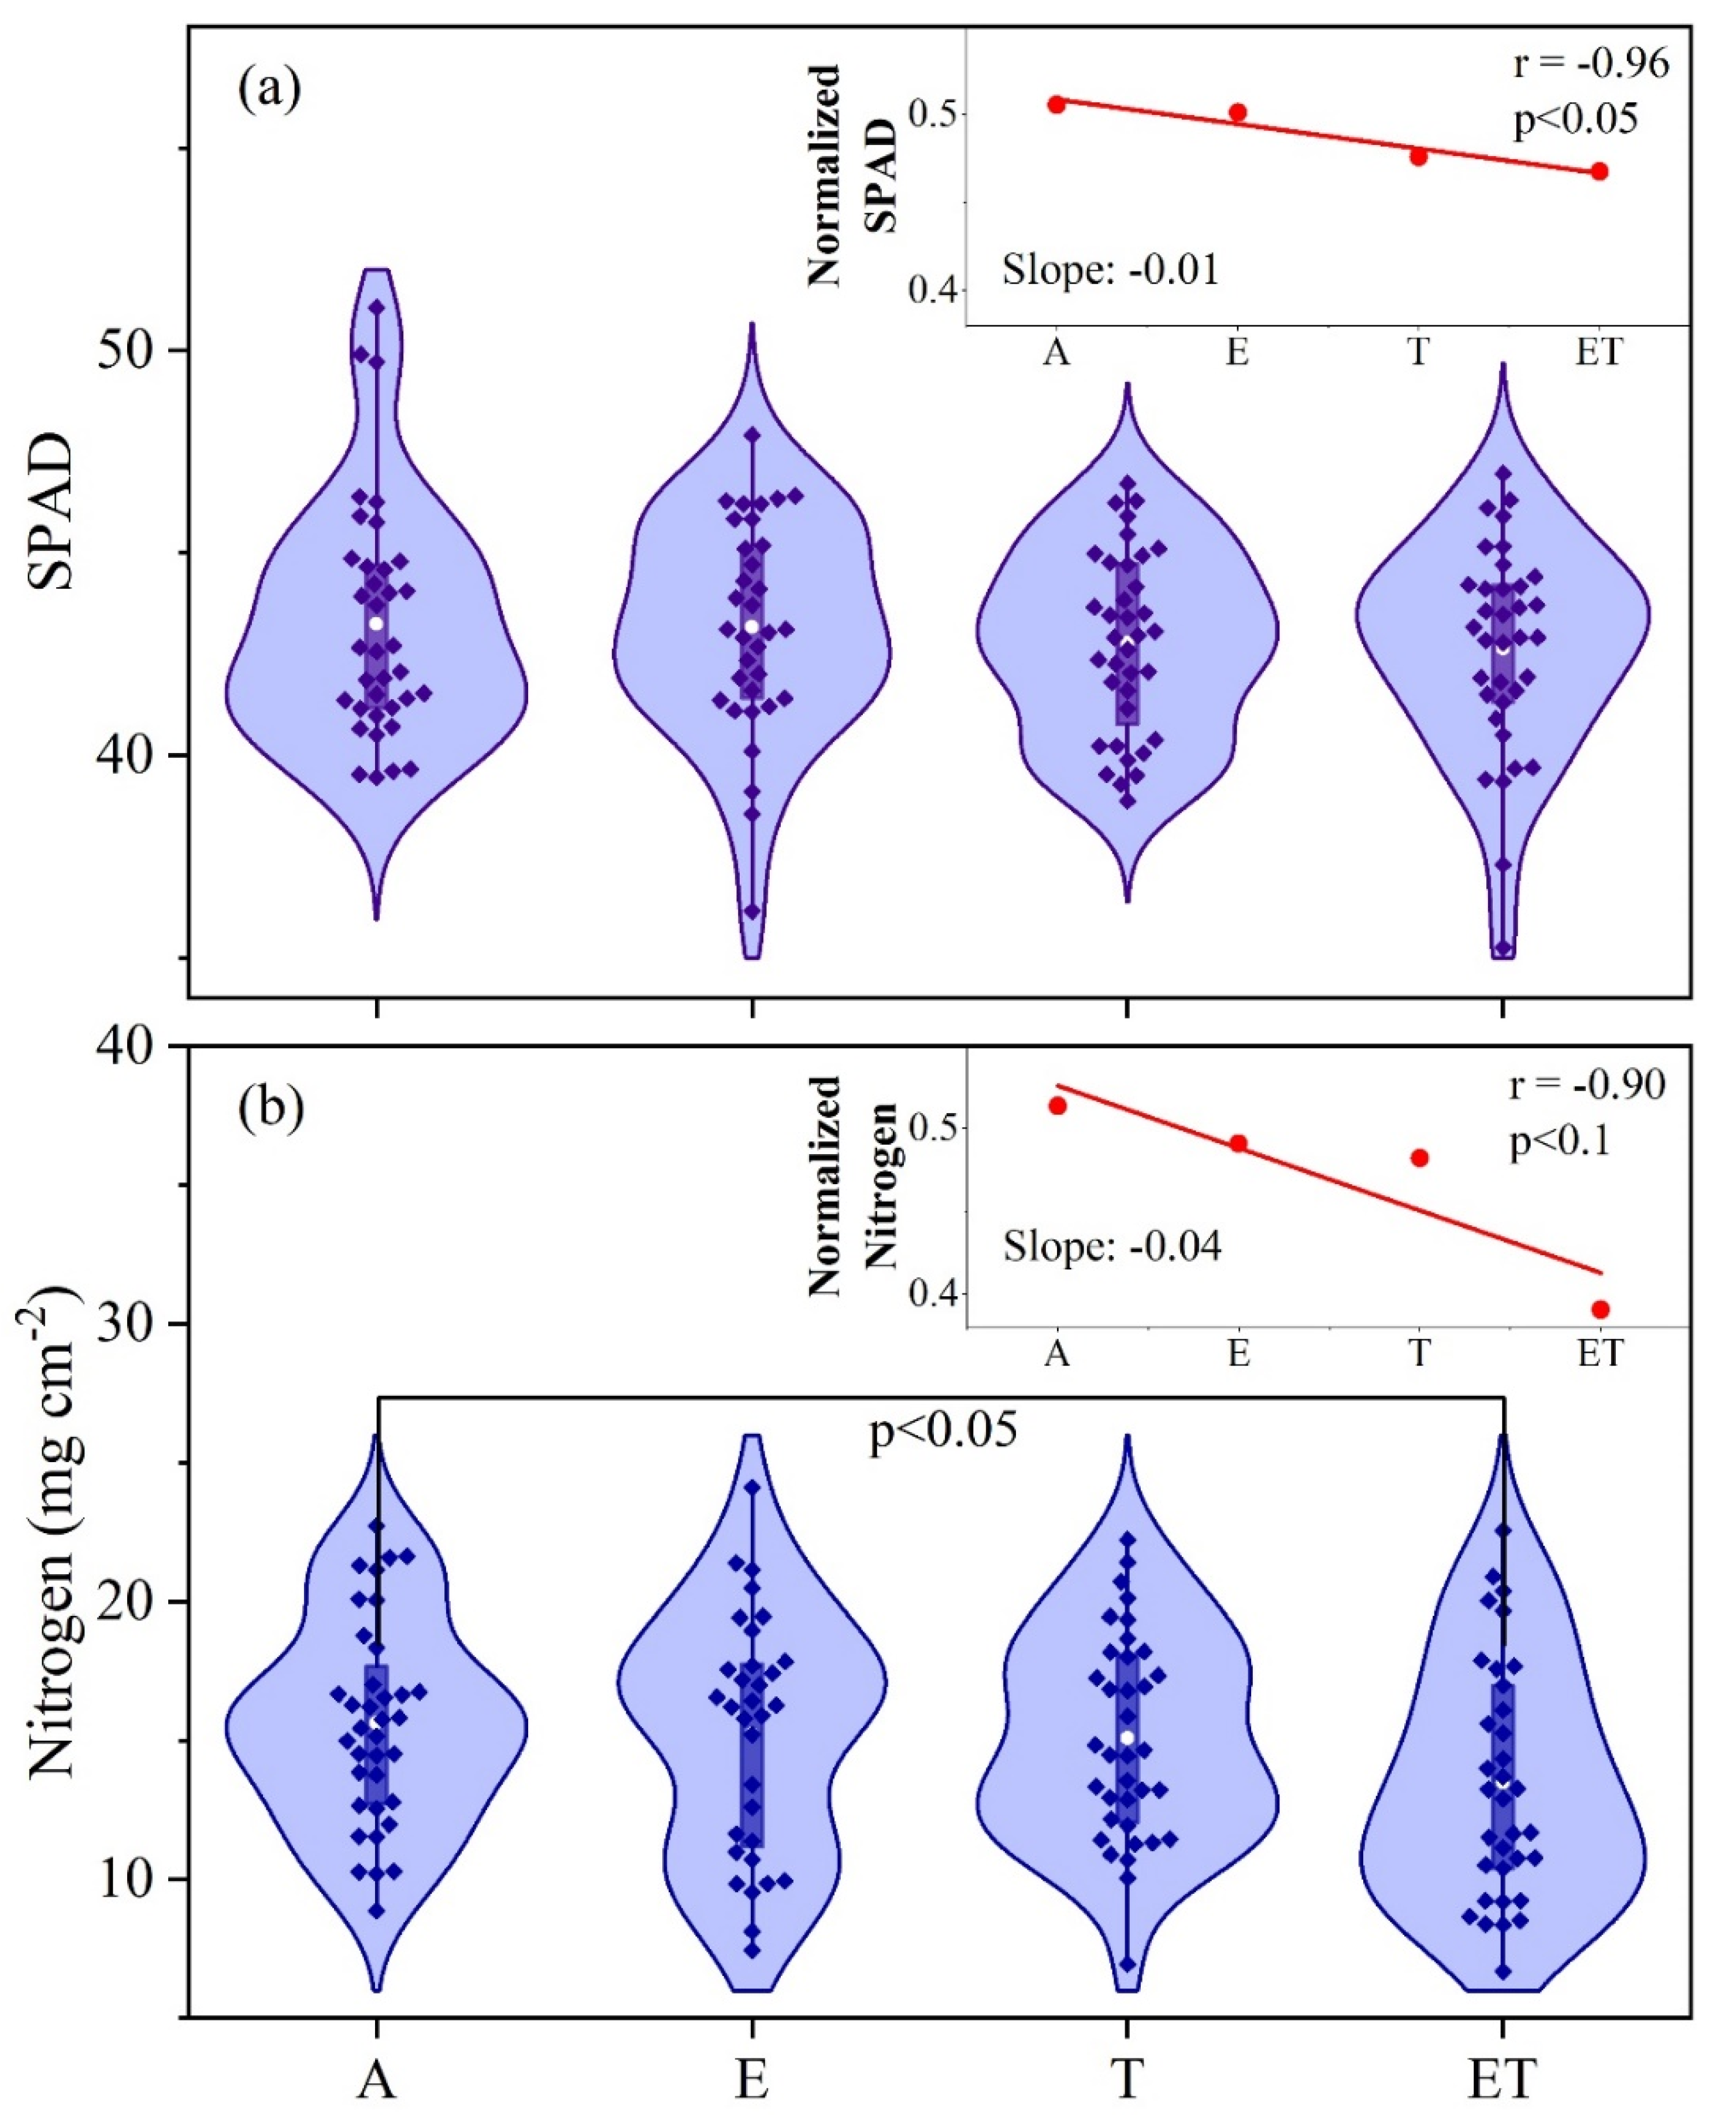
3.1. Variations of Rice Leaf SPAD Readings and N Content under Different Treatments

We analyzed the measured rice leaf SPAD readings and N content to assess its variations under different controls (A, E, T, and ET) in the FACE1 system. Figure 2 shows that leaf SPAD and N content decrease under elevated [CO2] (E), warming (T), and elevated [CO2] and warming (ET) controls compared to ambient (A) conditions with different magnitudes. For rice leaf N content (Figure 2b), the average N content under ambient conditions is 15.63 mg cm−2. Under E and T controls, the average N content shows a small decrease of 15.24 and 15.09 mg cm−2, respectively. When rice is grown under ET control, the average N content is 13.49 mg cm−2, which is −13.69% smaller than that under A. The decreasing magnitudes for leaf SPAD (Figure 2a) under controlled conditions (E, T, and ET) show desynchronized variations with N content. The average SPAD readings under E, T, and ET conditions are 43.17, 42.77, and 42.63 units, which is −0.16%, −1.09%, and −1.41%, respectively, smaller than under the A condition (43.24 unit). The linear fit results of the normalized parameters also indicate a similar conclusion (insert plot in Figure 2a,b). The slope of the linear fit of normalized SPAD readings for A, E, T, and ET is −0.01, and the slope of normalized N content is −0.04. The linear fit results of normalized parameters indicate that under E and T controls, leaf N content shows a larger decrease magnitude than that of leaf SPAD readings. Under ET control, leaf SPAD readings and N content all indicate the largest decrease as compared with A, E, and T treatments. To assess the influence of rice subspecies on the SPAD and nitrogen content response to different controls, we also analyzed the indica varieties (including cvs Xiangliangyou 143 and Yangdao 6, Figure S1) and japonica varieties (including cvs Changyou 5 and Wuyungeng 23, Figure S2) of rice leaf SPAD readings and N content under A, E, T, and ET in the FACE1 system. Indica and Japonica rice indicate similar results. Under controlled conditions, the decreasing magnitude of SPAD readings is smaller than that of N content. The slopes of normalized SPAD readings of indica and japonica rice are −0.01 (r = −0.37) and −0.02 (r = −0.67), respectively; the values for N content are −0.02 (r = −0.49) and −0.03 (r = −0.74), respectively.

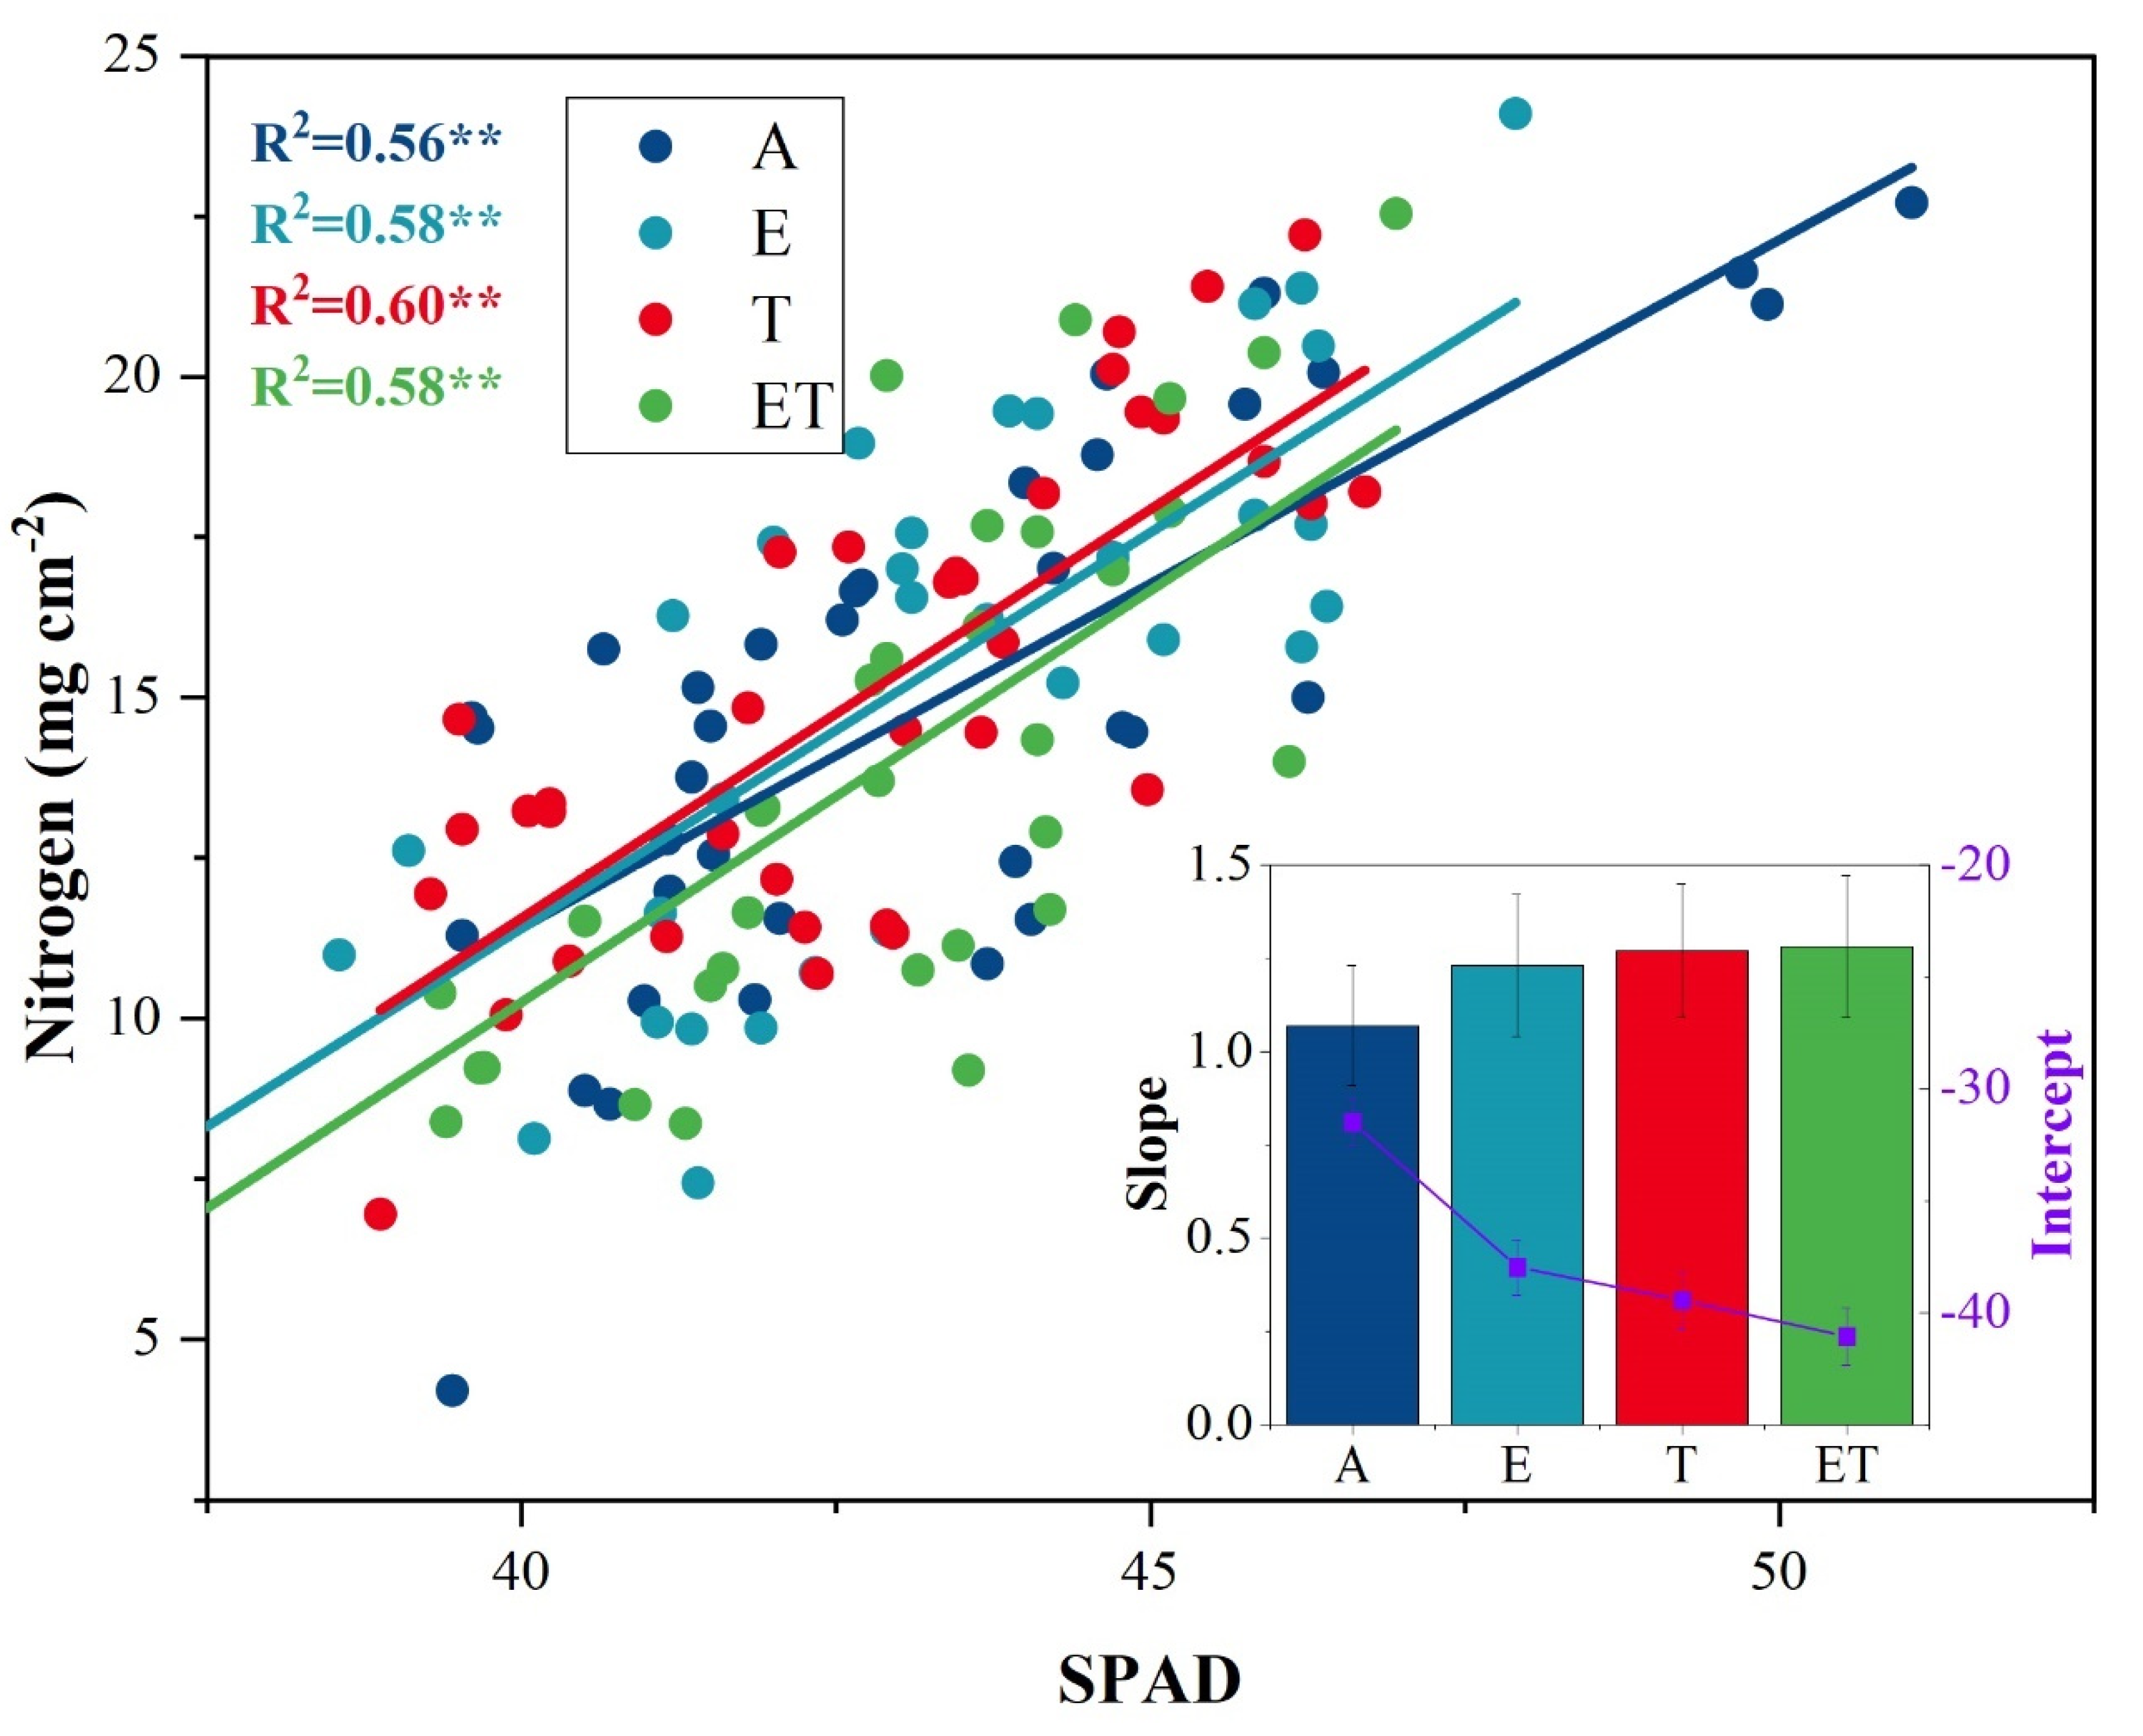
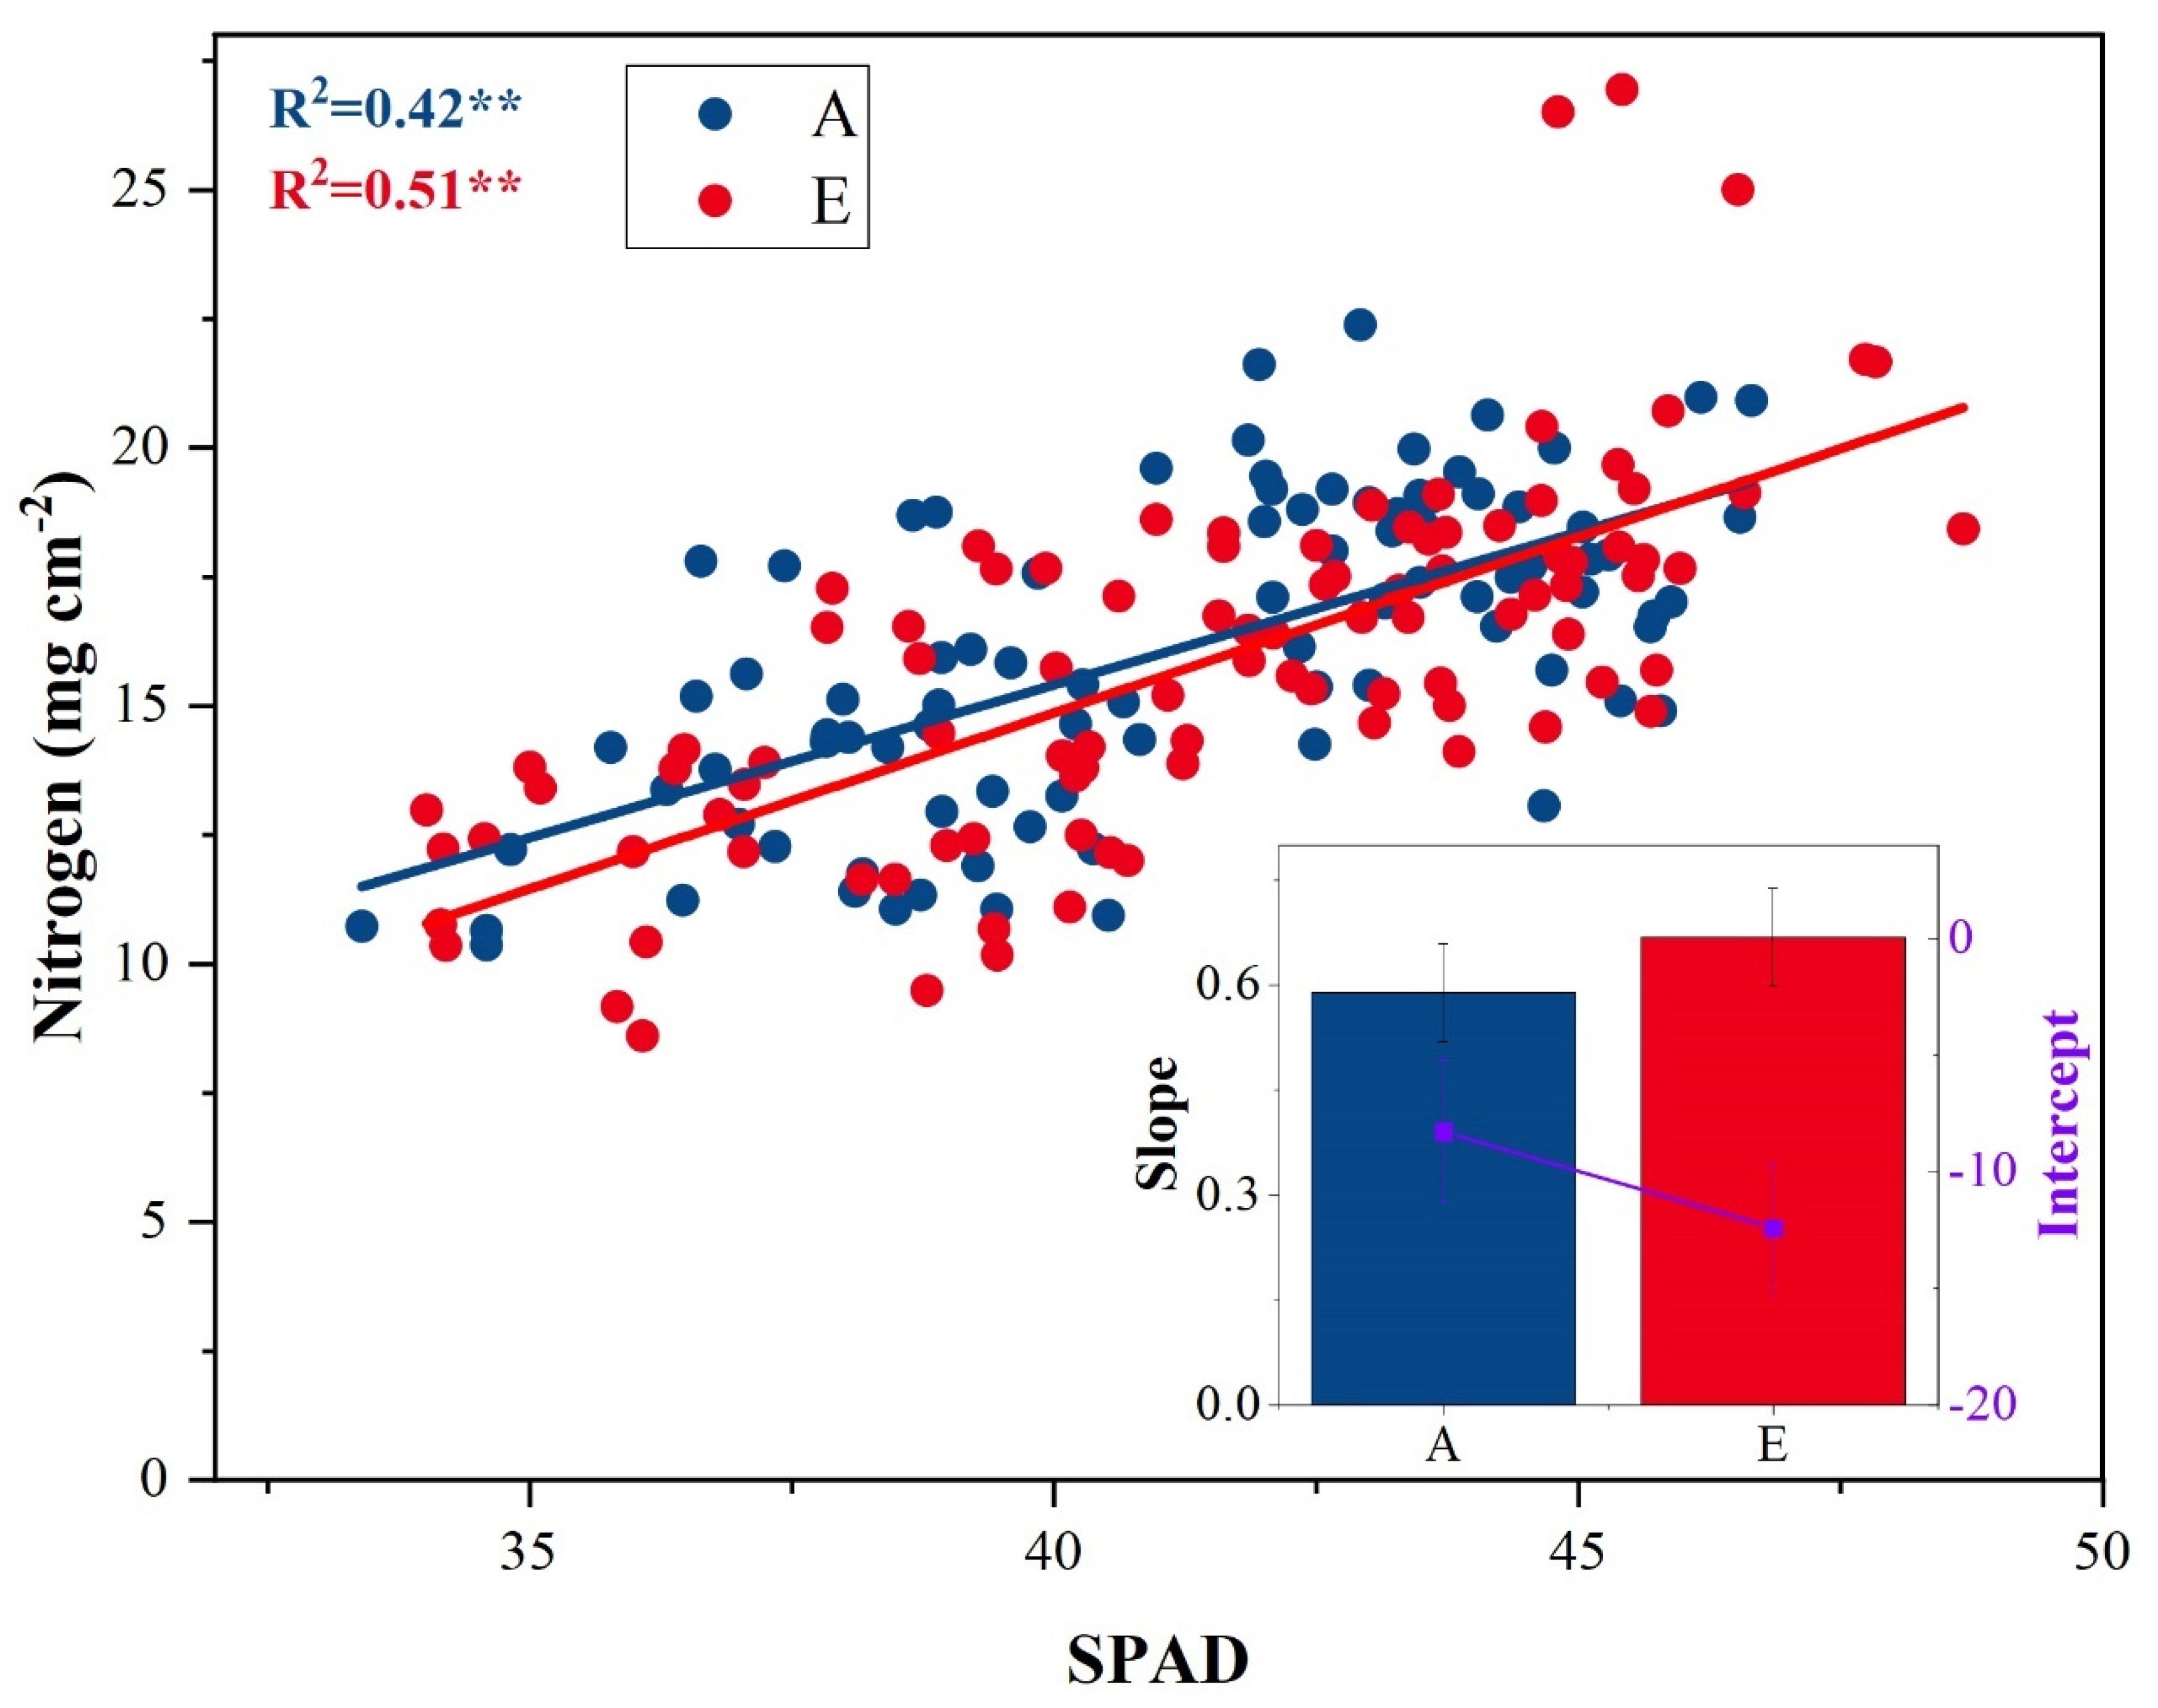
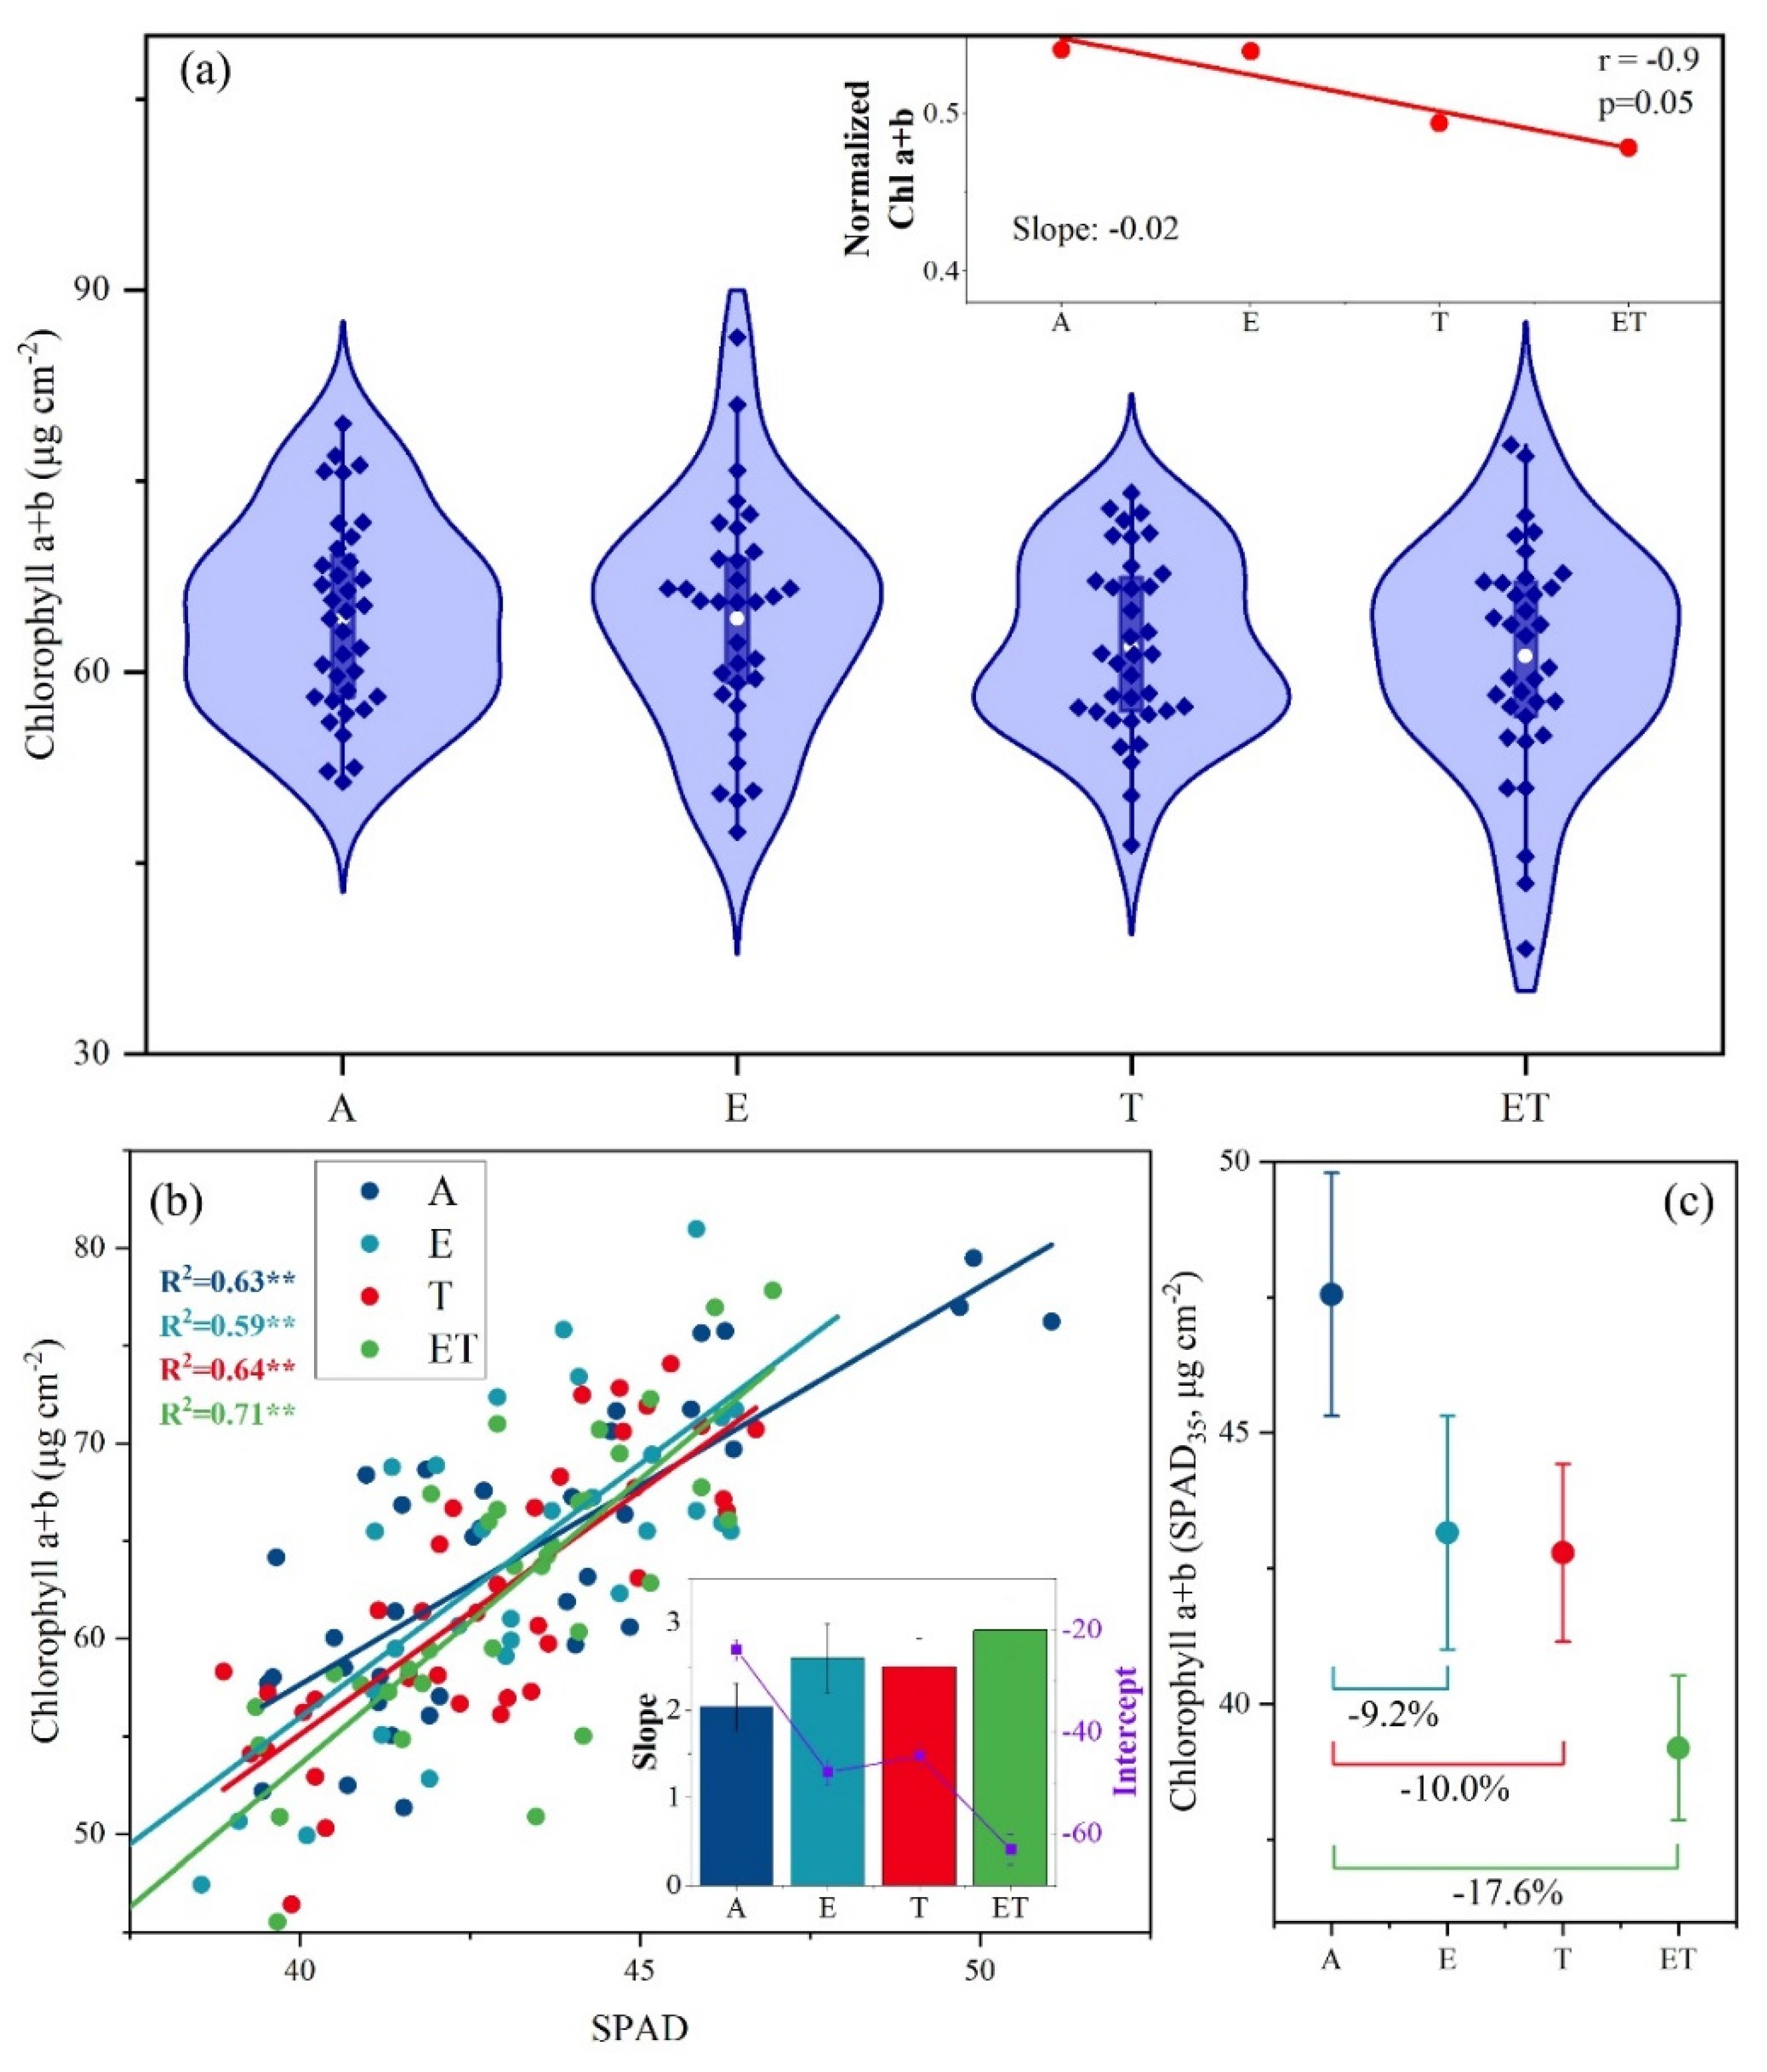
3.2. Relationship between Rice Leaf SPAD Readings and N Content Per Leaf Area under Different Treatments

To further analyze the influence of the discrepancy among the variations of SPAD readings and N content under different treatments, Figure 3 shows the scatter plots and linear fit results between SPAD readings and N content under A, E, T, and ET treatments in the FACE1 system. Under both A and controlled treatments, SPAD readings significantly correlate with N content (R2 under A: 0.56, R2 under E: 0.58, R2 under T: 0.60, R2 under ET: 0.58, all p < 0.01). Nonetheless, the slope and intercept of the regression lines between SAPD readings and N content vary significantly under different treatments (insert plot in Figure 3). Under the A condition, the slope is 1.07 (±0.16) mg cm−2, and slope values increase substantially under controlled treatments (E, T, and ET), with the largest values under ET. The initial intercept value under A is −31.49 (±1.07), and, under E, T, and ET controls, the intercept value is 21%, 25%, and 30% smaller than that under the A treatment, respectively.
The scatter plot results between SPAD and N content under A and E treatments in the FACE2 experiment also indicate similar trends as the FACE1 experiment (Figure 4). Under both A and E treatments, SPAD shows a middle strong correlation with N content (R2 under A: 0.42, R2 under E: 0.51, both p < 0.01). The slope value increases significantly from 0.59 (±0.07) to 0.668 (±0.07) from A to E treatments. For intercept values, the intercept under E treatment is 51% smaller than that under the A treatment.

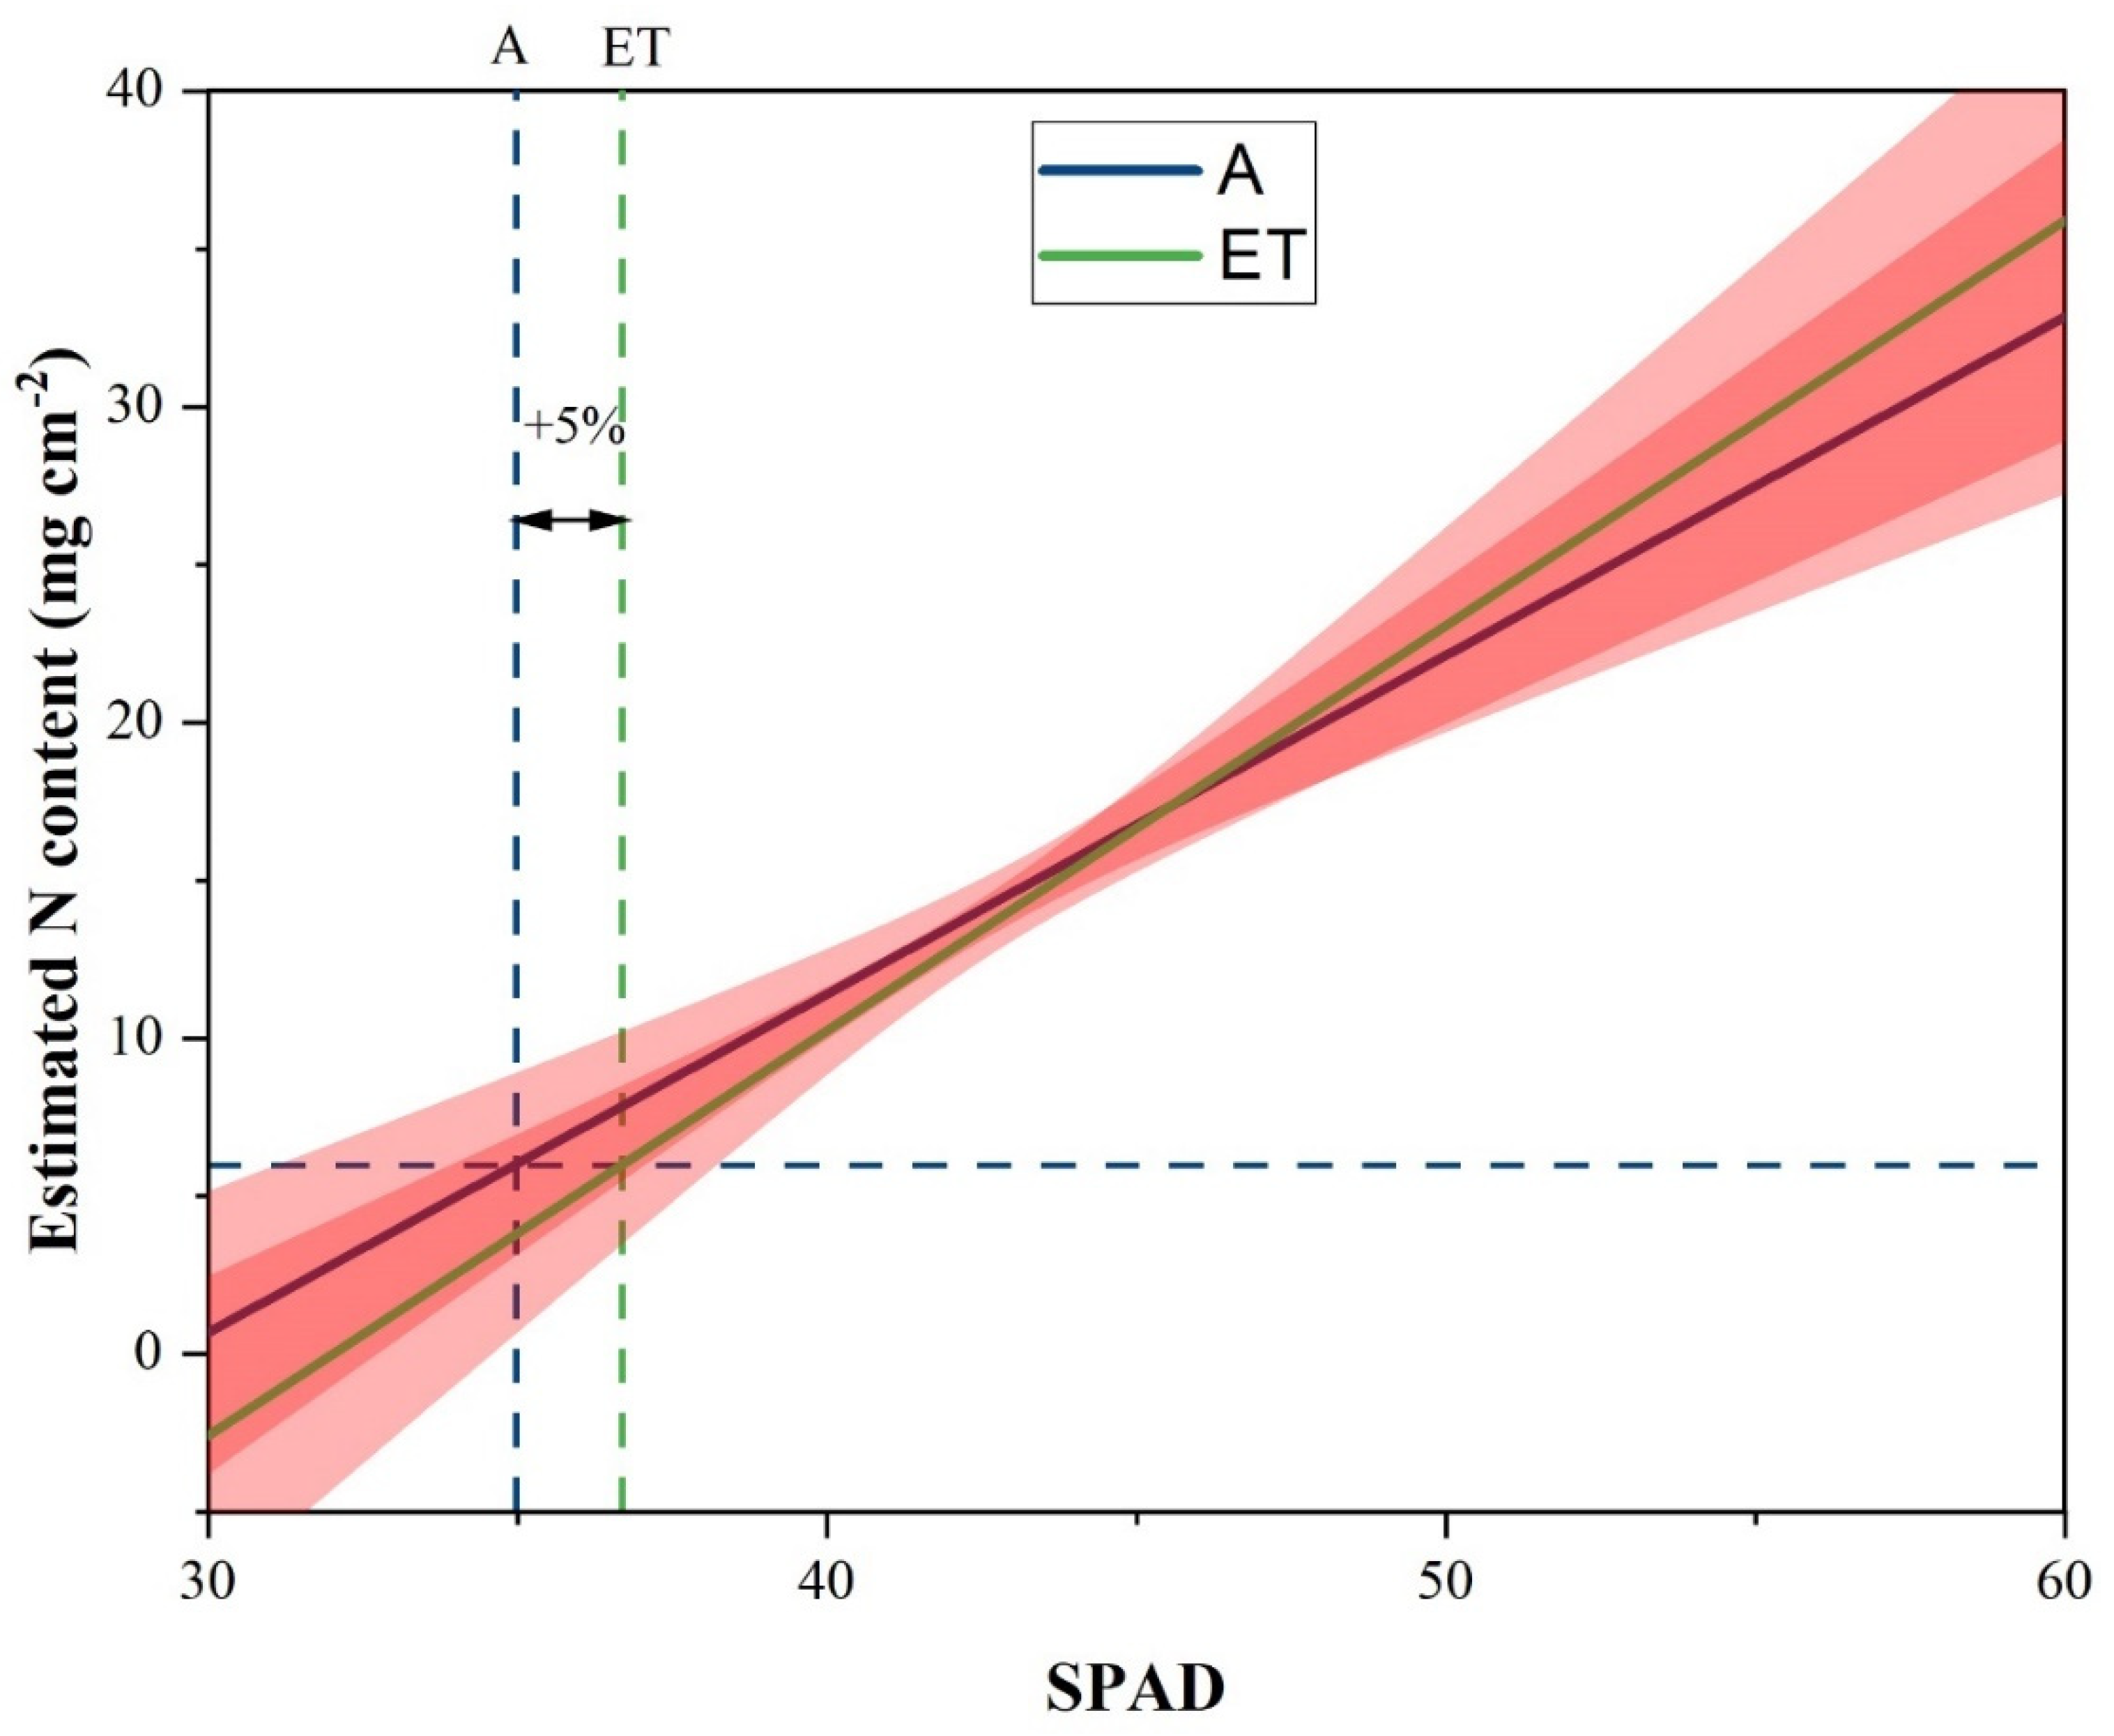
3.3. Variations of Rice Leaf N Content Corresponding to Rice N Demand SPAD Value

In the paddy field SPAD-based nitrogen treatment, nitrogen was top-dressed when rice leaf SPAD readings fell below 35 [8,34,35,36]. We then estimated and compared N content corresponding to SPAD = 35 under A, E, T, and ET treatments in the FACE1 experiment (Figure 5). According to linear fit regression results in Figure 3, when rice SPAD = 35, N content under A treatment is 5.96 (±0.46) mg cm−2. The estimated N content under E and T treatment, respectively, is 14.8% and 15.8% smaller than that under A, with a significant difference. Under ET treatments, the estimated N content is 3.73 (±0.63) mg cm−2, the decreased magnitude is near twice as many as E and T (37.4% smaller than that under A). Overall, the results indicate that the estimated N content corresponding to SPAD = 35 under controlled treatments is smaller than under A treatment.

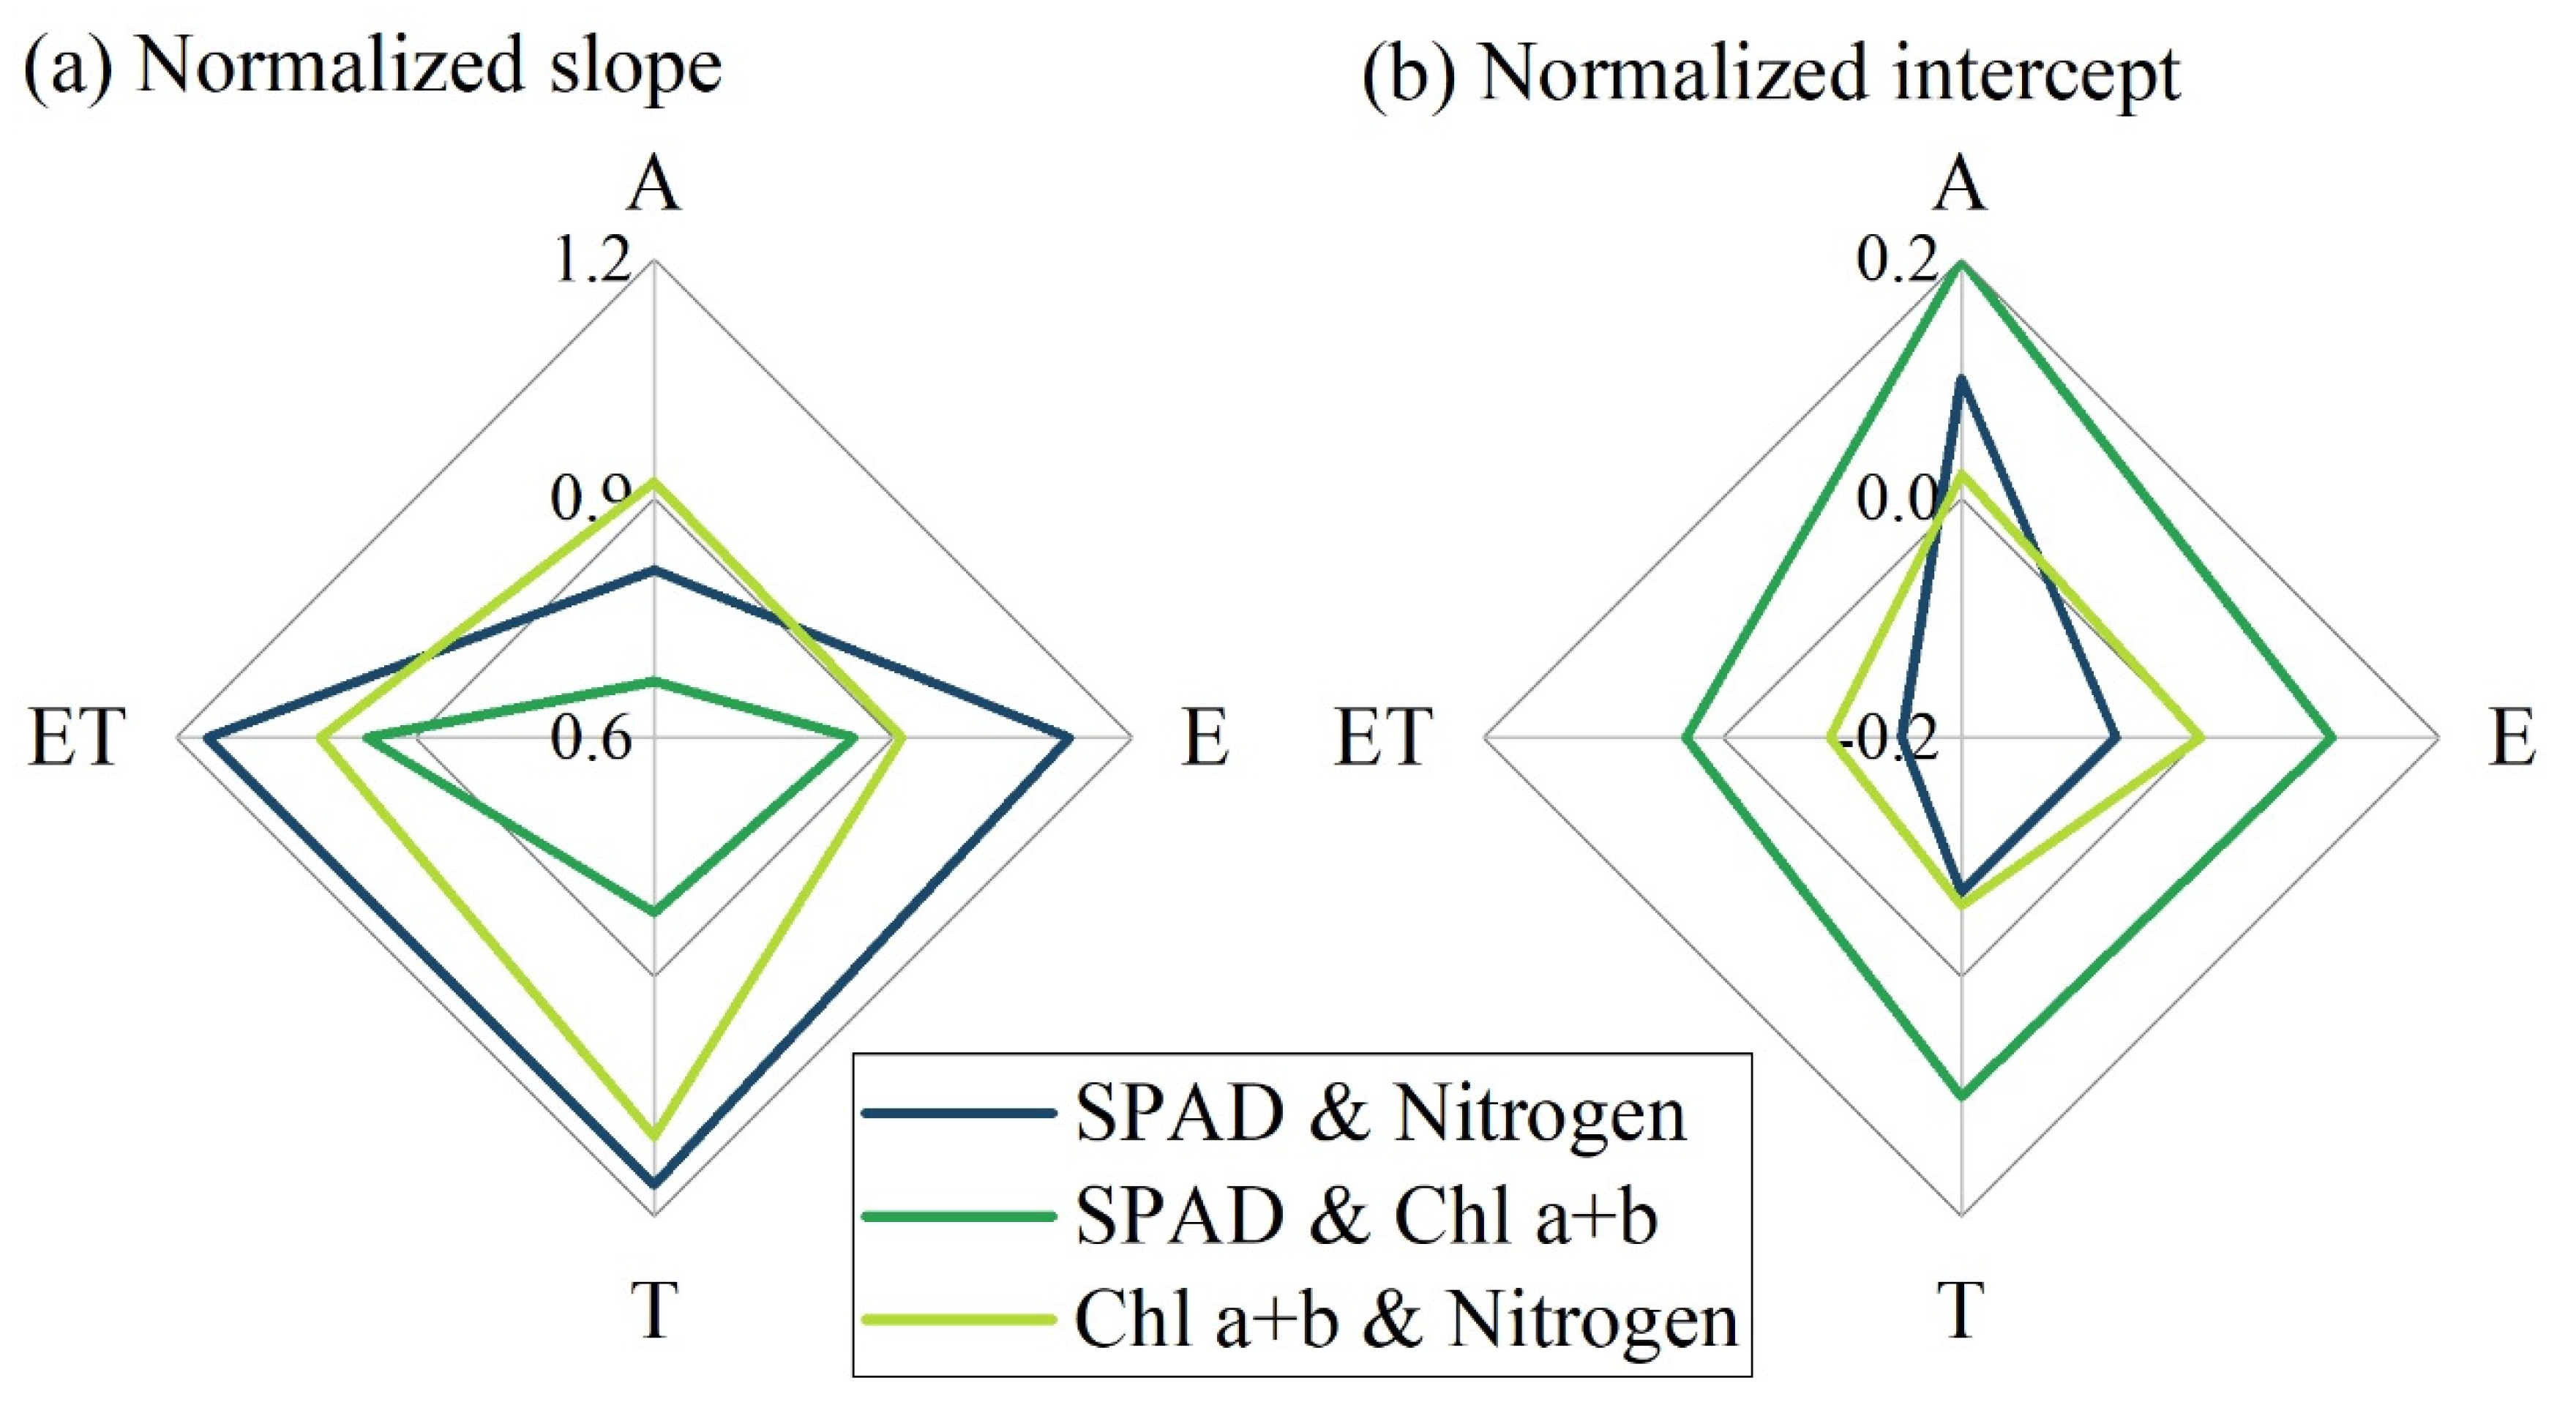
3.4. Attributions of the Discrepancy between Rice Leaf SPAD Readings and N Content under Different Treatments

To determine the reason for the discrepancy in SPAD reading responses to N content by changes in [CO2] and temperature, we analyzed variations in the chl a + b content and relationships with SPAD under different treatments in the FACE1 experiment site. The average chl a + b content under E, T, and ET controls are −0.06%, −3.5%, and −4.64% smaller than under A treatment (64.25 μg cm−2), respectively. However, the decreasing trends of chl a + b content from A to controlled treatments are smaller than that of N content as indicated by Figure 6a. The slope of normalized chl a + b content is −0.02, which is also smaller than the value of normalized N content (−0.04). Results from the indica and japonica indicate similar trends (Figures S3 and S4). The decreasing trends in both indica and japonica rice leaf chl a + b content are smaller than that of N content.
As indicated by Figure 6b, under all of the treatments (A, E, T, and ET), SPAD shows a strong correlation with chl a + b content. The slope of the linear fit results indicates increasing trends from A to controlled treatments, and the intercept indicates decreasing trends, which are similar to the trends of N content. For the indica and japonica subspecies, both of the leaf SPAD readings of these two subspecies show a strong correlation with chl a + b and N content, and the slope and intercept values indicate increasing and decreasing trends as a result for all samples (Figures S5 and S6). Based on the linear fit results, the chl a + b content corresponding to SPAD = 35 under A, E, T, and ET treatments was calculated (Figure 6c). Under A treatment, chl a + b content is 47.55 (±2.24) μg cm−2, and the values under E, T, and ET controls are 9.2%, 10%, and 17.6% smaller than that under A treatment, respectively. Thus, although chl a + b content shows similar trends with N content, the decreasing magnitude of chl a + b is smaller than that of N content from A to controlled treatments.
Figure 7 indicates that under E treatment, the normalized slope and intercept between SPAD readings and N content and SPAD readings and chl a + b content vary significantly, while the relationship between chl a + b and N content remains unchanged compared with A. Under T treatment, the slope between normalized SPAD and N content increases from 0.81 (A) to 1.16 (T), and the intercept decreases from 0.1 (A) to −0.07 (T). The response of normalized SPAD to chl a + b content and normalized chl a + b content to nitrogen content show similar trends; both of the normalized slope values show increasing trends and normalized intercept values show decreasing trends. Under ET control (Figure 8), the slope between normalized SPAD and nitrogen content increases by 43%, and the normalized intercept decreases by −250% compared with values under A treatment. For the variations in normalized SPAD and chl a + b content and chl a + b content and nitrogen content, the slope values under ET increase by 43% and 11%, respectively, and the intercept values decrease by −85% and −550%, respectively.

4. Discussion

Under E or T treatments, rice leaf N content after heading decreases compared with that under A treatment, and the combination of E and T treatment further enhances the decreased magnitude (Figure 2). The decrease in rice leaf N content under E and T treatments has been found in many previous studies. For example, Cai et.al. reported that rice leaf N content decreased 16.7% under E control and 33.3% under ET control, respectively, after the heading stage in a field experiment [25]. This decrease is generally considered to be the dilution effect of increased biomass due to elevated [CO2] [23,24]. Additionally, some studies suggested that a decrease in transpiration rate due to restricted stomatal opening under E control results in poorer N absorption capacity [20,44]. After anthesis, warming, elevated [CO2], or both might accelerate leaf senescence [25]. Faster leaf senescence is often accompanied by faster N remobilization from green leaves to grains in cereal crops [45,46].
The average SPAD readings only decrease 0.6 units under ET control (decrease of 1.41% compared with the value under A treatment), which is far smaller than the decreased magnitude of leaf N content (−14% compared with the value under A treatment, Figure 2). The variations in this decline result in the distortion of the relationship between SPAD readings and leaf N content under controlled treatments (E, T, and ET). This is confirmed by another result from the meta-analysis of FACE experiments; nitrogen reported on an area basis was reduced by 12% in plants under E treatment, while there was no significant change in chlorophyll content per leaf area [47].
Compared with the relationship between SPAD readings and leaf N content under A treatment, the relationships under all three controls indicate a higher slope and lower intercept (Figure 3 and Figure 4). This means that if the relationships between SPAD and leaf N content under A treatment continue to be employed to estimate leaf N status under E and T treatments in the future, rice leaf N status may be under/overestimated under relatively high/low leaf N statuses, respectively. Previous studies have already reported that SPAD-based estimations of rice leaf N status are influenced by multiple environmental factors; leaf’s N status may be under/overestimated by SPAD readings due to changes in environmental factors [18].
To analyze the attributions of distortion of the SPAD-based leaf N content estimation under different treatments, we investigated the relationship between SPAD and chl a + b content per leaf area and chl a + b content and N content under three controls (E, T, and ET, Figure 7). Under E control, there is no significant difference compared with A treatment for the relationship between chl a + b content and N content, while there is a significant difference between SPAD readings and chl a + b content. Under T and ET controls, both relationships between SPAD readings and chl a + b content and chl a + b and N content show significant differences to those under A treatment. This result indicates that the discrepancies between SPAD and leaf N status under E control mainly result from the difference between chl a + b and leaf N status, while for the T and ET controls, both significant differences in the relationship between SPAD and chl a + b content and chl a + b content and N content with that under A, lead to the significant discrepancy in SPAD and N status.
The SPAD value in SPAD-based N management could be absolute or relative SPAD [48], and the absolute value was used in the present study. The relative SPAD value calculated by multiple indicators is more advanced in evaluating leaf nitrogen content and the N fertilizer management [49], but it increases the workload in field determination, which is contrary to the rapid measurement and restricts its application. On the other side, by mid-century, global [CO2] and warming magnitude are predicted to increase by 200 μmol mol−1 and 2 °C under the high emissions RCP8.5 scenario [50]. Here, we monitored similarly elevated [CO2] and warming scenes in the FACE site, and our results indicate that not only do these indicators change differently but also the relationship between SPAD readings and leaf N content varies greatly under E and T controls, which means that this may cause great potential risk to SPAD-based N management, especially when leaves are of low leaf N status in future. The key factor in SPAD-based N management is the SPAD threshold readings for N application. For example, when SPAD = 35 is considered as the threshold value for applying N fertilization in rice, the leaf N content estimated by relationship under ET control is 37.4% lower than the value based on the relationship under the current A treatment. The lower leaf N status of the same SPAD readings means that if the threshold of the current condition continues to be employed in future elevated [CO2] and warming environments, it will delay the application of N fertilization, which may result in a great potential risk of yield reduction. The present study is the first reminder of the risk of insufficient nitrogen supply that may be hidden under unchanged performance (SPAD-based). Certainly, such results are not enough to complete the correction of SPAD-based N management in climate change. The SPAD threshold and the amount of fertilization need to be determined according to specific rice cultivars, environmental factors, etc. [51], and this requires more experimental studies.
Although the application of N fertilizer plays an important role in global food security, excessive nitrogen fertilizer use in agriculture production can also have negative environmental effects such as increased greenhouse gas (GHG) emissions [52,53], soil acidification [54], and eutrophication of groundwater [55]. Compared with the possible yield loss, the additional cost is tolerable with the relatively low nitrogen fertilizer price [56], which is the main reason for the excessive nitrogen input. It is undeniable that a rising nitrogen fertilizer price will encourage farmers to use nitrogen more cautiously [56]. Multiple studies have documented that expediting the development of optimal nitrogen management is an effective technique to confront the challenges of food security and environmental sustainability [15,16,35]. The aim of SPAD-based nitrogen management is to achieve higher nitrogen use efficiency by greatly reducing nitrogen fertilizer with no yield loss rather than achieving higher yield. Maintaining the balance between nitrogen input and crops’ needs will drastically reduce nitrogen loss during agricultural production.

5. Conclusions

Chlorophyll meters, for example, the SPAD-502, can provide a simple, nondestructive and quick method for monitoring leaf N status in agricultural systems.
In this study, we provide evidence that under E and T controls, current SPAD-based monitoring of rice leaf N status can be overestimated under relatively low leaf N status, which may cause great potential risk to fertilization management and rice yield decline. The distortion of the SPAD-based N monitoring under E control is caused by the discrepancy of the relationship between leaf chl a + b figure and N content; under T and ET controls, the distortions are caused by the discrepancy of the relationships between SPAD and leaf chl a + b content and leaf chl a + b and N content. To deal with this issue under the background of global climate change dominated by warming and elevated [CO2] by mid-century, we need to increase the threshold SPAD readings by at least 5% to adjust N management.

Supplementary Materials

The following are available online at https://www.mdpi.com/article/10.3390/atmos12121571/s1, Figure S1: Violin plots of the indica rice leaf SPAD values (a) and nitrogen content (b) in different controls (A: ambient, E: elevated [CO2], T: warming and ET: elevated [CO2] & warming). Figure S2: Violin plots of the japonica rice leaf SPAD values (a) and nitrogen content (b) in different controls (A: ambient, E: elevated [CO2], T: warming and ET: elevated [CO2] & warming). Figure S3: Violin plots of the indica rice leaf chlorophyll a+b content in different controls (A: ambient, E: elevated [CO2], T: warming and ET: elevated [CO2] & warming). Figure S4: Violin plots of the japonica rice leaf chlorophyll a+b content in different controls (A: ambient, E: elevated [CO2], T: warming and ET: elevated [CO2] & warming). Figure S5: Scatter plots and linear fit results between indica rice leaf (a) SPAD values & chlorophyll a+b content and (b) SPAD values & nitrogen content within different controls. Figure S6: Scatter plots and linear fit results between japonica rice leaf (a) SPAD values & chlorophyll a+b content and (b) SPAD values & nitrogen content within different controls. The estimated slope and intercept of the linear fit is presented in the inserted bar plot. ** in the plot indicates p < 0.01. Figure S7: The relationship between the changes of SPAD and leaf Ndw (blue dots, N concentration by unit dry weight), Na (orange dots, N concentration by unit leaf area) in E relative to A of 2016 and 2017. The orange and blue regression lines represent the regression of Na and Ndw with SPAD, respectively.

Author Contributions

Conceptualization, C.Z.; Data curation, Y.T. and J.Z.; Funding acquisition, L.S., C.C. and C.Z.; Investigation, Y.T., J.Z., L.S., D.W., W.W., X.G. and X.Y.; Methodology, L.S.; Software, L.S.; Supervision, C.Z.; Writing—original draft, L.S.; Writing—review and editing, Y.T., J.Z., L.S., C.C., D.W. and C.Z. All authors have read and agreed to the published version of the manuscript.

Funding

National Natural Science Foundation Grant of China 32001191; National Natural Science Foundation Grant of China 31800359; the Doctor of Mass Entrepreneurship and Innovation in Jiangsu Province; the “0 to 1” original innovation project of the Basic Frontier Science Research Program of CAS ZDBS-LY-DQC020; Natural Science Foundation of Jiangsu province in China BK2018402.

Institutional Review Board Statement

Not applicable.

Informed Consent Statement

Not applicable.

Data Availability Statement

Not applicable.

Acknowledgments

The work was supported by the National Natural Science Foundation Grant of China (Grant NO. 32001191, 31800359), the Doctor of Mass Entrepreneurship and Innovation in Jiangsu Province, the “0 to 1” original innovation project of the Basic Frontier Science Research Program of CAS (ZDBS-LY-DQC020), the Natural Science Foundation of Jiangsu province in China (BK2018402).

Conflicts of Interest

The authors declare no conflict of interest.

References

  1. Ladha, J.K.; Reddy, P.M. Nitrogen fixation in rice systems: State of knowledge and future prospects. Plant Soil 2003, 252, 151–167. [Google Scholar] [CrossRef]
  2. Carpenter, S.R.; Caraco, N.F.; Correll, D.L.; Howarth, R.W.; Sharpley, A.N.; Smith, V.H. Nonpoint pollution of surface waters with phosphorus and nitrogen. Ecol. Appl. 1998, 8, 559–568. [Google Scholar] [CrossRef]
  3. Bodirsky, B.L.; Popp, A.; Lotze-Campen, H.; Dietrich, J.P.; Rolinski, S.; Weindl, I.; Schmitz, C.; Mueller, C.; Bonsch, M.; Humpenoeder, F.; et al. Reactive nitrogen requirements to feed the world in 2050 and potential to mitigate nitrogen pollution. Nat. Commun. 2014, 5, 3858. [Google Scholar] [CrossRef] [Green Version]
  4. Bausch, W.C.; Diker, K. Innovative remote sensing techniques to increase nitrogen use efficiency of corn. Commun. Soil Sci. Plant Anal. 2001, 32, 1371–1390. [Google Scholar] [CrossRef] [Green Version]
  5. Fontes, P.C.R.; de Araujo, C. Use of a chlorophyll meter and plant visual aspect for nitrogen management in tomato fertigation. J. Appl. Hort 2006, 8, 8–11. [Google Scholar]
  6. De Datta, S.; Samson, M.; Kai-Rong, W.; Buresh, R. Nitrogen use efficiency and nitrogen-15 balances in broadcast-seeded flooded and transplanted rice. Soil Sci. Soc. Am. J. 1988, 52, 849–855. [Google Scholar] [CrossRef]
  7. Strong, W.M. Effects of nitrogen application before sowing, compared with effects of split applications before and after sowing, for irrigated wheat on the Darling Downs. Aust. J. Exp. Agric. 1986, 26, 201–207. [Google Scholar] [CrossRef]
  8. Peng, S.; Garcia, F.V.; Laza, R.C.; Sanico, A.L.; Visperas, R.M.; Cassman, K.G. Increased N-use efficiency using a chlorophyll meter on high-yielding irrigated rice. Field Crop. Res. 1996, 47, 243–252. [Google Scholar] [CrossRef]
  9. Piekielek, W.P.; Fox, R.H.; Toth, J.D.; Macneal, K.E. Use of a chlorophyll meter at the early dent stage of corn to evaluate nitrogen sufficiency. Agron. J. 1995, 87, 403–408. [Google Scholar] [CrossRef]
  10. Pinkard, E.A.; Patel, V.; Mohammed, C. Chlorophyll and nitrogen determination for plantation-grown Eucalyptus nitens and E-globulus using a non-destructive meter. For. Ecol. Manag. 2006, 223, 211–217. [Google Scholar] [CrossRef]
  11. Yadava, U.L. A rapid and nondestructive method to determine chlorophyll in intact leaves. Hortscience 1986, 21, 1449–1450. [Google Scholar]
  12. Wu, J.; Wang, D.; Rosen, C.J.; Bauer, M.E. Comparison of petiole nitrate concentrations, SPAD chlorophyll readings, and QuickBird satellite imagery in detecting nitrogen status of potato canopies. Field Crop. Res. 2007, 101, 96–103. [Google Scholar] [CrossRef]
  13. Pagola, M.; Ortiz, R.; Irigoyen, I.; Bustince, H.; Barrenechea, E.; Aparicio-Tejo, P.; Lamsfus, C.; Lasa, B. New method to assess barley nitrogen nutrition status based on image colour analysis Comparison with SPAD-502. Comput. Electron. Agric. 2009, 65, 213–218. [Google Scholar] [CrossRef]
  14. Chang, S.X.; Robison, D.J. Nondestructive and rapid estimation of hardwood foliar nitrogen status using the SPAD-502 chlorophyll meter. For. Ecol. Manag. 2003, 181, 331–338. [Google Scholar] [CrossRef]
  15. Arregui, L.M.; Lasa, B.; Lafarga, A.; Iraneta, I.; Baroja, E.; Quemada, M. Evaluation of chlorophyll meters as tools for N fertilization in winter wheat under humid Mediterranean conditions. Eur. J. Agron. 2006, 24, 140–148. [Google Scholar] [CrossRef]
  16. Liu, L.; Sang, D.; Liu, C.; Wang, Z.; Yang, J.; Zhu, Q. Effects of Real-time and Site-specific Nitrogen Managements on Rice Yield and Nitrogen Use Efficiency. Sci. Agric. Sin. 2003, 36, 1456–1461. [Google Scholar]
  17. Hassan, M.S.; Khair, A.; Haque, M.M.; Azad, A.K.; Hamid, A. Genotypic variation in traditional rice varieties for chlorophyll content, SPAD value and nitrogen use efficiency. Bangladesh J. Agric. Res. 2009, 34, 505–515. [Google Scholar] [CrossRef]
  18. Xiong, D.; Chen, J.; Yu, T.; Gao, W.; Ling, X.; Li, Y.; Peng, S.; Huang, J. SPAD-based leaf nitrogen estimation is impacted by environmental factors and crop leaf characteristics. Sci. Rep. 2015, 5, 13389. [Google Scholar] [CrossRef] [PubMed] [Green Version]
  19. Zhu, C.; Zhu, J.; Cao, J.; Jiang, Q.; Liu, G.; Ziska, L.H. Biochemical and molecular characteristics of leaf photosynthesis and relative seed yield of two contrasting rice cultivars in response to elevated CO2. J. Exp. Bot. 2014, 65, 6049–6056. [Google Scholar] [CrossRef] [PubMed] [Green Version]
  20. Pang, J.; Zhu, J.-G.; Xie, Z.-B.; Liu, G.; Zhang, Y.-L.; Chen, G.-P.; Zeng, Q.; Cheng, L. A new explanation of the N concentration decrease in tissues of rice (Oryza sativa L.) exposed to elevated atmospheric pCO2. Environ. Exp. Bot. 2006, 57, 98–105. [Google Scholar] [CrossRef]
  21. Huang, J.; Yang, H.; Yang, L.; Wang, Y.; Zhu, J.; Liu, H.; Dong, G.; Shan, Y. Effects of Free-air CO2 Enrichment(FACE) on Nitrogen Nutrition at Different Growth Stages in Rice(Oryza sativa L.) Cultivar Wuxiangjing 14. Acta Agron. Sin. 2004, 30, 1237–1243. [Google Scholar]
  22. Zhou, N.; Jing, L.; Wang, Y.; Zhu, J.; Yang, L.; Wang, Y. Effects of Elevated Atmospheric CO2 and Temperature on Dynamics of Leaf Chlorophyll Contents and SPAD Value of Rice in Open-Air Field Conditions. Chin. J. Rice Sci. 2017, 31, 524–532. [Google Scholar]
  23. Pang, J.; Zhu, J.; Xie, Z.; Chen, G.; Liu, G.; Zhang, Y. Effects of Elevated pCO2 on Nutrient Uptake by Rice and Nutrient Contents in Rice Grain. Chin. J. Rice Sci. 2005, 19, 350–354. [Google Scholar]
  24. Coleman, J.S.; McConnaughay, K.D.M.; Bazzaz, F.A. Elevated CO2 and plant nitrogen-use: Is reduced tissue nitrogen concentration size-dependent? Oecologia 1993, 93, 195–200. [Google Scholar] [CrossRef]
  25. Cai, C.; Yin, X.; He, S.; Jiang, W.; Si, C.; Struik, P.C.; Luo, W.; Li, G.; Xie, Y.; Xiong, Y.; et al. Responses of wheat and rice to factorial combinations of ambient and elevated CO2 and temperature in FACE experiments. Glob. Chang. Biol. 2016, 22, 856–874. [Google Scholar] [CrossRef] [PubMed]
  26. Meinshausen, M.; Smith, S.J.; Calvin, K.; Daniel, J.S.; Kainuma, M.L.T.; Lamarque, J.F.; Matsumoto, K.; Montzka, S.A.; Raper, S.C.B.; Riahi, K.; et al. The RCP greenhouse gas concentrations and their extensions from 1765 to 2300. Clim. Chang. 2011, 109, 213–241. [Google Scholar] [CrossRef] [Green Version]
  27. Masson-Delmotte, V.; Zhai, P.; Pirani, A.; Connors, S.L.; Péan, S.B.C.; Caud, N.; Chen, Y.; Goldfarb, L.; Gomis, M.I. Climate Change 2021: The Physical Science Basis. Contribution of Working Group I to the Sixth Assessment Report of the Intergovernmental Panel on Climate Change. Press 2021. Available online: https://www.ipcc.ch/site/assets/uploads/2021/11/IPCCWG1ar6slides_SBSTA_MASTER.pdf (accessed on 5 May 2021).
  28. Cotrufo, M.F.; Ineson, P.; Scott, A. Elevated CO2 reduces the nitrogen concentration of plant tissues. Glob. Chang. Biol. 1998, 4, 43–54. [Google Scholar] [CrossRef]
  29. Cao, B.; Dang, Q.-L.; Zhang, S. Relationship between photosynthesis and leaf nitrogen concentration in ambient and elevated CO2 in white birch seedlings. Tree Physiol. 2007, 27, 891–899. [Google Scholar] [CrossRef]
  30. Sakai, H.; Hasegawa, T.; Kobayashi, K. Enhancement of rice canopy carbon gain by elevated CO2 is sensitive to growth stage and leaf nitrogen concentration. New Phytol. 2006, 170, 321–332. [Google Scholar] [CrossRef] [PubMed]
  31. Ma, H.; Zhu, J.; Xie, Z.; Liu, G.; Zeng, Q.; Han, Y. Responses of rice and winter wheat to free-air CO2 enrichment (China FACE) at rice/wheat rotation system. Plant Soil 2007, 294, 137–146. [Google Scholar] [CrossRef]
  32. Liang, W.; Jianguo, Z.H.U.; Chunwu, Z.H.U.; Jiling, C.A.O.; Mingna, W.; Qing, Z.; Zubin, X.I.E.; Gang, L.I.U. Relationship between Decrease in Nitrogen Content and Activities of Key Enzymes Related to Nitrogen Metabolism in Rice Leaves under Elevated CO2 Concentration. Chin. J. Rice Sci. 2008, 22, 499–506. [Google Scholar]
  33. Wang, J.; Wang, C.; Chen, N.; Xiong, Z.; Wolfe, D.; Zou, J. Response of rice production to elevated CO2 and its interaction with rising temperature or nitrogen supply: A meta-analysis. Clim. Chang. 2015, 130, 529–543. [Google Scholar] [CrossRef]
  34. Islam, M.S.; Bhuiya, M.; Rahman, S.; Hussain, M. Evaluation of SPAD and LCC based nitrogen management in rice (Oryza sativa L.). Bangladesh J. Agric. Res. 2009, 34, 661–672. [Google Scholar] [CrossRef] [Green Version]
  35. Maiti, D.; Das, D.K.; Karak, T.; Banerjee, M. Management of nitrogen through the use of leaf color chart (LCC) and soil plant analysis development (SPAD) or chlorophyll meter in rice under irrigated ecosystem. Sci. World J. 2004, 4, 838–846. [Google Scholar] [CrossRef] [PubMed] [Green Version]
  36. Fan, H.E.; Jianliang, H.; Kehui, C.U.I.; Jianmin, Z.; Bo, X.U.; Shaobing, P.; Buresh, R.J. Effect of Real-Time and Site-Specific Nitrigen Management on Rice Yield and Quality. Sci. Agric. Sin. 2007, 40, 123–132. [Google Scholar]
  37. Zhu, C.; Zeng, Q.; Ziska, L.H.; Zhu, J.; Xie, Z.; Liu, G. Effect of nitrogen supply on carbon dioxide-induced changes in competition between rice and barnyardgrass (Echinochloa crus-galli). Weed Sci. 2008, 56, 66–71. [Google Scholar] [CrossRef]
  38. Okada, M.; Lieffering, M.; Nakamura, H.; Yoshimoto, M.; Kim, H.Y.; Kobayashi, K. Free-air CO2 enrichment (FACE) using pure CO2 injection: System description. New Phytol. 2001, 150, 251–260. [Google Scholar] [CrossRef]
  39. Liu, Y.; Li, M.; Zheng, J.; Li, L.; Zhang, X.; Zheng, J.; Pan, G.; Yu, X.; Wang, J. Short-term responses of microbial community and functioning to experimental CO2 enrichment and warming in a Chinese paddy field. Soil Biol. Biochem. 2014, 77, 58–68. [Google Scholar] [CrossRef]
  40. Hoel, B.O.; Solhaug, K.A. Effect of irradiance on chlorophyll estimation with the Minolta SPAD-502 leaf chlorophyll meter. Ann. Bot. 1998, 82, 389–392. [Google Scholar] [CrossRef] [Green Version]
  41. Porra, R.J.; Thompson, W.A.; Kriedemann, P.E. Determination of accurate extinction coefficients and simultaneous equations for assaying chlorophylls a and b extracted with four different solvents: Verification of the concentration of chlorophyll standards by atomic absorption spectroscopy. Biochim. Et Biophys. Acta 1989, 975, 384–394. [Google Scholar] [CrossRef]
  42. Singh, D.; Singh, B. Investigating the impact of data normalization on classification performance. Appl. Soft Comput. 2020, 97. [Google Scholar] [CrossRef]
  43. Hintze, J.L.; Nelson, R.D. Violin plots: A box plot-density trace synergism. Am. Stat. 1998, 52, 181–184. [Google Scholar] [CrossRef]
  44. Conroy, J.P. Influence of elevated atmospheric CO2 concentrations on plant nutrition. Aust. J. Bot. 1992, 40, 445–456. [Google Scholar] [CrossRef]
  45. Yoshida, S. Fundamentals of Rice Crop Science; The International Rice Research Institute: Los Baños, Philippines, 1981. [Google Scholar]
  46. Evans, L.T. Crop Evolution, Adaptation and Yield; Cambridge University Press: Cambridge, UK, 1996. [Google Scholar]
  47. Ainsworth, E.A.; Long, S.P. What have we learned from 15 years of free-air CO2 enrichment (FACE)? A meta-analytic review of the responses of photosynthesis, canopy. New Phytol. 2005, 165, 351–371. [Google Scholar] [CrossRef]
  48. Jiang, J.; Wang, C.; Wang, H.; Fu, Z.; Cao, Q.; Tian, Y.; Zhu, Y.; Cao, W.; Liu, X. Evaluation of Three Portable Optical Sensors for Non-Destructive Diagnosis of Nitrogen Status in Winter Wheat. Sensors 2021, 21, 5579. [Google Scholar] [CrossRef] [PubMed]
  49. Rhezali, A.; Aissaoui, A.E. Feasibility Study of Using Absolute SPAD Values for Standardized Evaluation of Corn Nitrogen Status. Nitrogen 2021, 2, 298–307. [Google Scholar] [CrossRef]
  50. Sutton, R.T.; Hawkins, E. ESD Ideas: Global climate response scenarios for IPCC AR6. Earth Syst. Dyn. Discuss. 2020, 2020, 1–4. [Google Scholar]
  51. Hasegawa, T.; Li, T.; Yin, X.; Zhu, Y.; Boote, K.; Baker, J.; Bregaglio, S.; Buis, S.; Confalonieri, R.; Fugice, J.; et al. Causes of variation among rice models in yield response to CO2 examined with Free-Air CO2 Enrichment and growth chamber experiments. Sci. Rep. 2017, 7, 14858. [Google Scholar] [CrossRef] [PubMed] [Green Version]
  52. Zhao, H.; Li, X.; Jiang, Y. Response of Nitrogen Losses to Excessive Nitrogen Fertilizer Application in Intensive Greenhouse Vegetable Production. Sustainability 2019, 11, 1513. [Google Scholar] [CrossRef] [Green Version]
  53. Yang, L.; Deng, Y.; Wang, X.; Zhang, W.; Shi, X.; Chen, X.; Lakshmanan, P.; Zhang, F. Global direct nitrous oxide emissions from the bioenergy crop sugarcane (Saccharum spp. inter-specific hybrids). Sci. Total Environ. 2021, 752, 141795. [Google Scholar] [CrossRef] [PubMed]
  54. Guo, J.H.; Liu, X.J.; Zhang, Y.; Shen, J.L.; Han, W.X.; Zhang, W.F.; Christie, P.; Goulding, K.W.T.; Vitousek, P.M.; Zhang, F.S. Significant Acidification in Major Chinese Croplands. Science 2010, 327, 1008–1010. [Google Scholar] [CrossRef] [PubMed] [Green Version]
  55. Le, C.; Zha, Y.; Li, Y.; Sun, D.; Lu, H.; Yin, B. Eutrophication of Lake Waters in China: Cost, Causes, and Control. Environ. Manag. 2010, 45, 662–668. [Google Scholar] [CrossRef] [PubMed]
  56. Williamson, J.M. The Role of Information and Prices in the Nitrogen Fertilizer Management Decision: New Evidence from the Agricultural Resource Management Survey. J. Agric. Resour. Econ. 2011, 36, 552–572. [Google Scholar]
Figure 1. (a) Location of the experimental site in Jiangsu Province in the east of China and the ESA Climate Change Initiative (CCI) land cover map of the study site in 2010 at 300 m spatial resolution. Additionally, included are the on-site photos of the study site of FACE2 (b) and FACE1 (c).
Atmosphere 12 01571 g001
Figure 2. Violin plots of the rice leaf SPAD values (a) and nitrogen content (b) in different controls (A: ambient, E: elevated [CO2], T: warming, and ET: elevated [CO2] and warming). The violin plot is a box plot with the width of the box proportional to the estimated density of the observed SPAD readings and N content. The maximum density of the group-specific data distribution is indicated by the largest width of the violins. The white dot in the violin plot is the median, the thick vertical bar indicates the interquartile range, and the thin vertical bar indicates 95% confidence intervals. A linear fit between normalized SPAD readings, N content and different controls is presented in insert.
Atmosphere 12 01571 g002
Figure 3. Scatter plots and linear fit results between rice leaf SPAD values and nitrogen content within different controls in FACE1 system. The estimated slope and intercept of the linear fit are presented in the inserted bar plot. ** in the plot indicates p < 0.01.
Atmosphere 12 01571 g003
Figure 4. Scatter plots and linear fit results between rice leaf SPAD values and nitrogen content under ambient and elevated [CO2] conditions in FACE2 system. The estimated slope and intercept of the linear fit are presented in the inserted bar plot. ** in the plot indicates p < 0.01.
Atmosphere 12 01571 g004
Figure 5. Estimated rice leaf N content per leaf area corresponding to SPAD = 35 using the linear fit results of Figure 3 in different controls. The horizontal lines indicate the change percent of N content of E, T, and ET controls as compared with the values under A.
Atmosphere 12 01571 g005
Figure 6. (a) Variations in rice leaf chl a + b content under different controls at FACE1 experiment site. (b) Scatter plots and linear fit results between rice leaf SPAD values and chl a + b content under different conditions at FACE1 experiment site. (c) Estimated rice leaf chl a + b content per leaf area corresponding to SPAD = 35 using the linear fit results of Figure 3 under different controls at FACE1 experiment site. ** in the plot indicates p < 0.01.
Atmosphere 12 01571 g006
Figure 7. Wind rose diagram of (a) normalized slope and (b) normalized intercept under different controls. The normalized slope and intercept is the linear fit result of normalized SPAD, chl a + b content, and nitrogen content.
Atmosphere 12 01571 g007
Figure 8. Regression lines based on linear fit results of Figure 3 at FACE1 site under A and ET conditions. The transparent red area indicates 95% confidence bands. The vertical dark blue dotted line (vb) is at the position of SPAD = 35; the horizontal dark blue dotted line (hb) is the estimated rice leaf N content using regression result under A condition. The vertical green dotted line (vg) is the SPAD value corresponding to the estimated N content of hb using regression result under ET condition.
Atmosphere 12 01571 g008
Publisher’s Note: MDPI stays neutral with regard to jurisdictional claims in published maps and institutional affiliations.

