
Performance of RegCM4.5 in Simulating the Regional Climate of Western Tianshan Mountains in Xinjiang, China


Abstract
:1. Introduction
2. The Convective Parameterization Schemes
2.1. Grell Scheme
2.2. Tiedtke
2.3. Emanuel
3. Model and Experimental Design
3.1. Description of the RegCM Model
3.2. Experimental Design and Data Check
3.3. Verification Method
3.3.1. Correlation Coefficient
3.3.2. Root Mean Square Error
4. Results and Discussion
4.1. Annual Simulation and Inspection
4.1.1. The Analysis of Annual Temperature
4.1.2. The Analysis of Average Annual Precipitation
4.1.3. The Analysis of Average Annual Wind Speed
4.1.4. The Results of Annual Simulation
4.2. RegCM Seasonal Numerical Simulation and Inspection
5. Conclusions
Author Contributions
Funding
Data Availability Statement
Acknowledgments
Conflicts of Interest
References
- Zhou, X.; Huang, G.; Piwowar, J.; Fan, Y.; Wang, X.; Li, Z.; Cheng, G. Hydrologic Impacts of Ensemble-RCM-Projected Climate Changes in the Athabasca River Basin, Canada. J. Hydrometeorol. 2018, 19, 1953–1971. [Google Scholar] [CrossRef] [Green Version]
- Shi, Y.; Wang, G.; Gao, X. Role of resolution in regional climate change projections over China. Clim. Dyn. 2018, 51, 2375–2396. [Google Scholar] [CrossRef] [Green Version]
- Grassi, B.; Redaelli, G.; Visconti, G. Arctic Sea Ice Reduction and Extreme Climate Events over the Mediterranean Region. J. Clim. 2013, 26, 10101–10110. [Google Scholar] [CrossRef]
- Díez, E.; Orfila, B.; Frías, M.D.; Fernández, J.; Cofiño, A.S.; Gutiérrez, J.M. Downscaling ECMWF seasonal precipitation forecasts in Europe using the RCA model. Tellus A Dyn. Meteorol. Oceanogr. 2011, 63, 757–762. [Google Scholar] [CrossRef]
- Sangelantoni, L.; Ricchi, A.; Ferretti, R.; Redaelli, G. Dynamical Downscaling in Seasonal Climate Forecasts: Comparison between RegCM- and WRF-Based Approaches. Atmosphere 2021, 12, 757. [Google Scholar] [CrossRef]
- Llopart, M.; da Rocha, R.P.; Reboita, M.; Cuadra, S. Sensitivity of simulated South America climate to the land surface schemes in RegCM4. Clim. Dyn. 2017, 49, 3975–3987. [Google Scholar] [CrossRef] [Green Version]
- Chung, J.X.; Juneng, L.; Tangang, F.; Jamaluddin, A.F. Performances of BATS and CLM land-surface schemes in RegCM4 in simulating precipitation over CORDEX Southeast Asia domain. Int. J. Clim. 2018, 38, 794–810. [Google Scholar] [CrossRef]
- Ali, S.; Dan, L.; Congbin, F.U.; Yang, Y. Performance of Convective Parameterization Schemes in Asia Using RegCM: Simu-la-tions in Three Typical Regions for the Period 1998–2002. Adv. Atmos. Sci. 2015, 5, 141–156. [Google Scholar] [CrossRef]
- Koné, B.; Diedhiou, A.; Touré, N.E.; Sylla, M.B.; Kobea, A.T. Sensitivity study of the regional climate model RegCM4 to dif-ferent convective schemes over West Africa. Earth Syst. Dyn. 2018, 9, 1261–1278. [Google Scholar] [CrossRef] [Green Version]
- Bhatla, R.; Mandal, B.P.; Verma, S.; Ghosh, S.; Mall, R.K. Performance of Regional Climate Model in Simulating Monsoon Onset Over Indian Subcontinent. Pure Appl. Geophys. 2018, 176, 409–420. [Google Scholar] [CrossRef]
- Bhatla, R.; Ghosh, S.; Mall, R.K.; Sinha, P.; Sarkar, A. Regional Climate Model Performance in Simulating Intra-seasonal and Interannual Variability of Indian Summer Monsoon. Pure Appl. Geophys. 2018, 175, 3697–3718. [Google Scholar] [CrossRef]
- Zanis, P.; Douvis, C.; Kapsomenakis, I.; Kioutsioukis, I.; Melas, D.; Pal, J.S. A sensitivity study of the Regional Climate Model (RegCM3) to the convective scheme with emphasis in central eastern and southeastern Europe. Theor. Appl. Clim. 2009, 97, 327–337. [Google Scholar] [CrossRef]
- Tchotchou, L.; Kamga, F.M. Sensitivity of the simulated African monsoon of summers 1993 and 1999 to convective parame-terization schemes in RegCM3. Theor. Appl. Climatol. 2010, 100, 207–220. [Google Scholar] [CrossRef]
- Raju, P.V.S.; Bhatla, R.; Almazroui, M.; Assiri, M. Performance of convection schemes on the simulation of summer monsoon features over the South Asia CORDEX domain using RegCM-4.3. Int. J. Clim. 2015, 35, 4695–4706. [Google Scholar] [CrossRef]
- Zhang, S.; Lu, S.; Bao, Y.; Ma, D. Sensitivity of precipitation over China to different cumulus parameterization schemes in RegCM4. J. Meteorol. Res. 2015, 29, 119–131. [Google Scholar] [CrossRef]
- Pal, J.S.; Giorgi, F.; Bi, X.; Elguindi, N.; Solmon, F.; Rauscher, S.A.; Steiner, A.L. Regional climate modeling for the develop-ing world: The ICTP RegCM3 and RegCNET. Bull. Am. Meteorol. Soc. 2007, 88, 1395–1409. [Google Scholar] [CrossRef] [Green Version]
- Pieczka, I.; Pongrácz, R.; André, K.S.; Kelemen, F.D.; Bartholy, J. Sensitivity analysis of different parameterization schemes using RegCM4.3 for the Carpathian region. Theor. Appl. Clim. 2016, 130, 1175–1188. [Google Scholar] [CrossRef]
- Gadzhev, G.; Ivanov, V.; Ganev, K.; Chervenkov, H. TVRegCM Numerical Simulations-Preliminary Results. In International Conference on Large-Scale Scientific Computing; Springer: Cham, Switzerland, 2018; pp. 266–274. [Google Scholar]
- Patari, M.; Brankovi, E. Skill of 2-m Temperature Seasonal Forecasts over Europe in ECMWF and RegCM Models. Mon. Weather Rev. 2012, 140, 1326–1346. [Google Scholar] [CrossRef]
- Sangelantoni, L.; Ferretti, R.; Redaelli, G. Toward a Regional-Scale Seasonal Climate Prediction System over Central Italy based on Dynamical Downscaling. Climate 2019, 7, 120. [Google Scholar] [CrossRef] [Green Version]
- Grell, G.A. Prognostic Evaluation of Assumptions Used by Cumulus Parameterizations. Mon. Weather Rev. 1993, 121, 764–787. [Google Scholar] [CrossRef] [Green Version]
- Fritsch, M.; Chappell, C.F. Numerical prediction of convectively driven mesoscale pressure systems. Part I: Convective pa-rameterization. Atmos. Sci. 1980, 37, 1722–1733. [Google Scholar] [CrossRef] [Green Version]
- Giorgi, F.; Bates, G.T. The climatological skill of a regional model over complex terrain. Mon. Weather Rev. 1989, 117, 2325–2347. [Google Scholar] [CrossRef] [Green Version]
- Dickinson, R.E.; Errico, R.M.; Giorgi, F.; Bates, G.T. A regional climate model for the western United States. Clim. Chang. 1989, 15, 383–422. [Google Scholar] [CrossRef]
- Giorgi, F.; Marinucci, M.R.; Bates, G.T. Development of a second generation regional climate model (RegCM2). Part I. Boundary layer and radiative transfer processes. Mon. Weather Rev. 1993, 121, 2794–2813. [Google Scholar] [CrossRef]
- Pal, J.S.; Small, E.; Eltahir, E.A.B. Simulation of regional-scale water and energy budgets: Representation of subgrid cloud and precipitation processes within RegCM. J. Geophys. Res. 2000, 105, 29579–29594. [Google Scholar] [CrossRef] [Green Version]
- Giorgi, F.; Coppola, E.; Solmon, F.; Mariotti, L.; Sylla, M.B.; Bi, X.; Brankovic, C. RegCM4: Model description and preliminary tests over multiple CORDEX domains. Clim. Res. 2012, 52, 7–29. [Google Scholar] [CrossRef] [Green Version]
- Grell, G.; Dudhia, J.; Stauffer, D. Description of the Fifth Generation Penn State/NCAR Mesoscale Model (MM5); Ncar Technical Note: Boulder, CO, USA, 1994; p. 121. [Google Scholar]
- Holtslag, A.; Bruijn, E.; Pan, H.L. A High Resolution Air Mass Transformation Model for Short-Range Weather Forecasting. Mon. Weather Rev. 1990, 188, 1561–1575. [Google Scholar] [CrossRef]
- Oleson, K.W.; Niu, G.-Y.; Yang, Z.-L.; Lawrence, D.; Thornton, P.; Lawrence, P.J.; Stöckli, R.; Dickinson, R.E.; Bonan, G.B.; Levis, S.; et al. Improvements to the Community Land Model and their impact on the hydrological cycle. J. Geophys. Res. 2008, 113, 1021–1026. [Google Scholar] [CrossRef]
- Kiehl, J.T.; Hack, J.J.; Bonan, G.B.; Boville, B.A.; Briegleb, B.P. Description of the NCAR Community Climate Model (CCM3). Ncar Tech. Note 1996, 108, 55–60. [Google Scholar]
- Giorgi, F.; Coppola, E.; Solmon, F.; Mariotti, L.; Sylla, M.B.; Bi, X.; Elguindi, N.; Diro, G.T.; Nair, V.; Giuliani, G.; et al. RegCM4: Model description and preliminary tests over multiple CORDEX domains. Clim. Res. 2011, 936, 577X. [Google Scholar]
- Giorgi, F.; Marinucci, M.R.; Bates, G.T. Development of a 2nd-Generation Regional Climate Model (Regcm2). Part2. Con-vec-tive Processes and Assimilation of Lateral Boundary Conditions. Mon. Weather Rev. 1993, 121, 2814–2832. [Google Scholar] [CrossRef] [Green Version]
- Tiedtke, M. A comprehensive mass-flux scheme for cumulus parameterization in large-scale models. Mon. Weather Rev. 1989, 117, 1779–1800. [Google Scholar] [CrossRef] [Green Version]
- Emanuel, K.A. A Scheme for Representing Cumulus Convection in Large-Scale Models. J. Atmos. Sci. 1991, 48, 2313–2329. [Google Scholar] [CrossRef]
- Emanuel, K.; Marina, R. Development and Evaluation of a Convection Scheme for Use in Climate Models. J. Atmos. Sci. 1999, 56, 1766–1782. [Google Scholar] [CrossRef] [Green Version]
- Kalnay, E.; Kanamitsu, M.; Kistler, R.; Collins, W.; Deaven, D.; Gandin, L.; Iredell, M.; Saha, S.; White, G.; Woollen, J.; et al. The NCEP/NCAR 40-Year Reanalysis Project. Renew. Energy 2018, 74, 146–194. [Google Scholar] [CrossRef]
- Kistler, R.; Kalnay, E.; Collins, W.; Saha, S.; White, G.; Woollen, J.; Chelliah, M.; Ebisuzaki, W.; Kanamitsu, M.; Kousky, V.; et al. The NCEP/NCAR 50-year reanalysis: Monthly means CD-ROM and documentation. Bull. Am. Meteorol. Soc. 2001, 82, 247–268. [Google Scholar] [CrossRef]
- Torma, C.Z. Detailed validation of EURO-CORDEX and Med-CORDEX regional climate model ensembles over the Carpa-thian Region. Idojaras 2019, 123, 217–240. [Google Scholar]
- Kotlarski, S.; Keuler, K.; Christensen, O.B.; Colette, A.; Déqué, M.; Gobiet, A.; Goergen, K.; Jacob, D.; Lüthi, D.; van Meijgaard, E.; et al. Regional climate modeling on European scales: A joint standard evaluation of the EURO-CORDEX RCM ensemble. Geosci. Model Dev. 2014, 7, 1297–1333. [Google Scholar] [CrossRef] [Green Version]


| Schemes | icup_lnd | icup_ocn |
|---|---|---|
| RUN1 | Grell | Tiedtke |
| RUN2 | Tiedtke | Emanuel |
| RUN3 | Grell | Emanuel |
| ENS | Ensemble_mean | Ensemble_mean |
| Meteorological Factors | Parameterization Schemes | Correlation Coefficient | Root Mean Square Error |
|---|---|---|---|
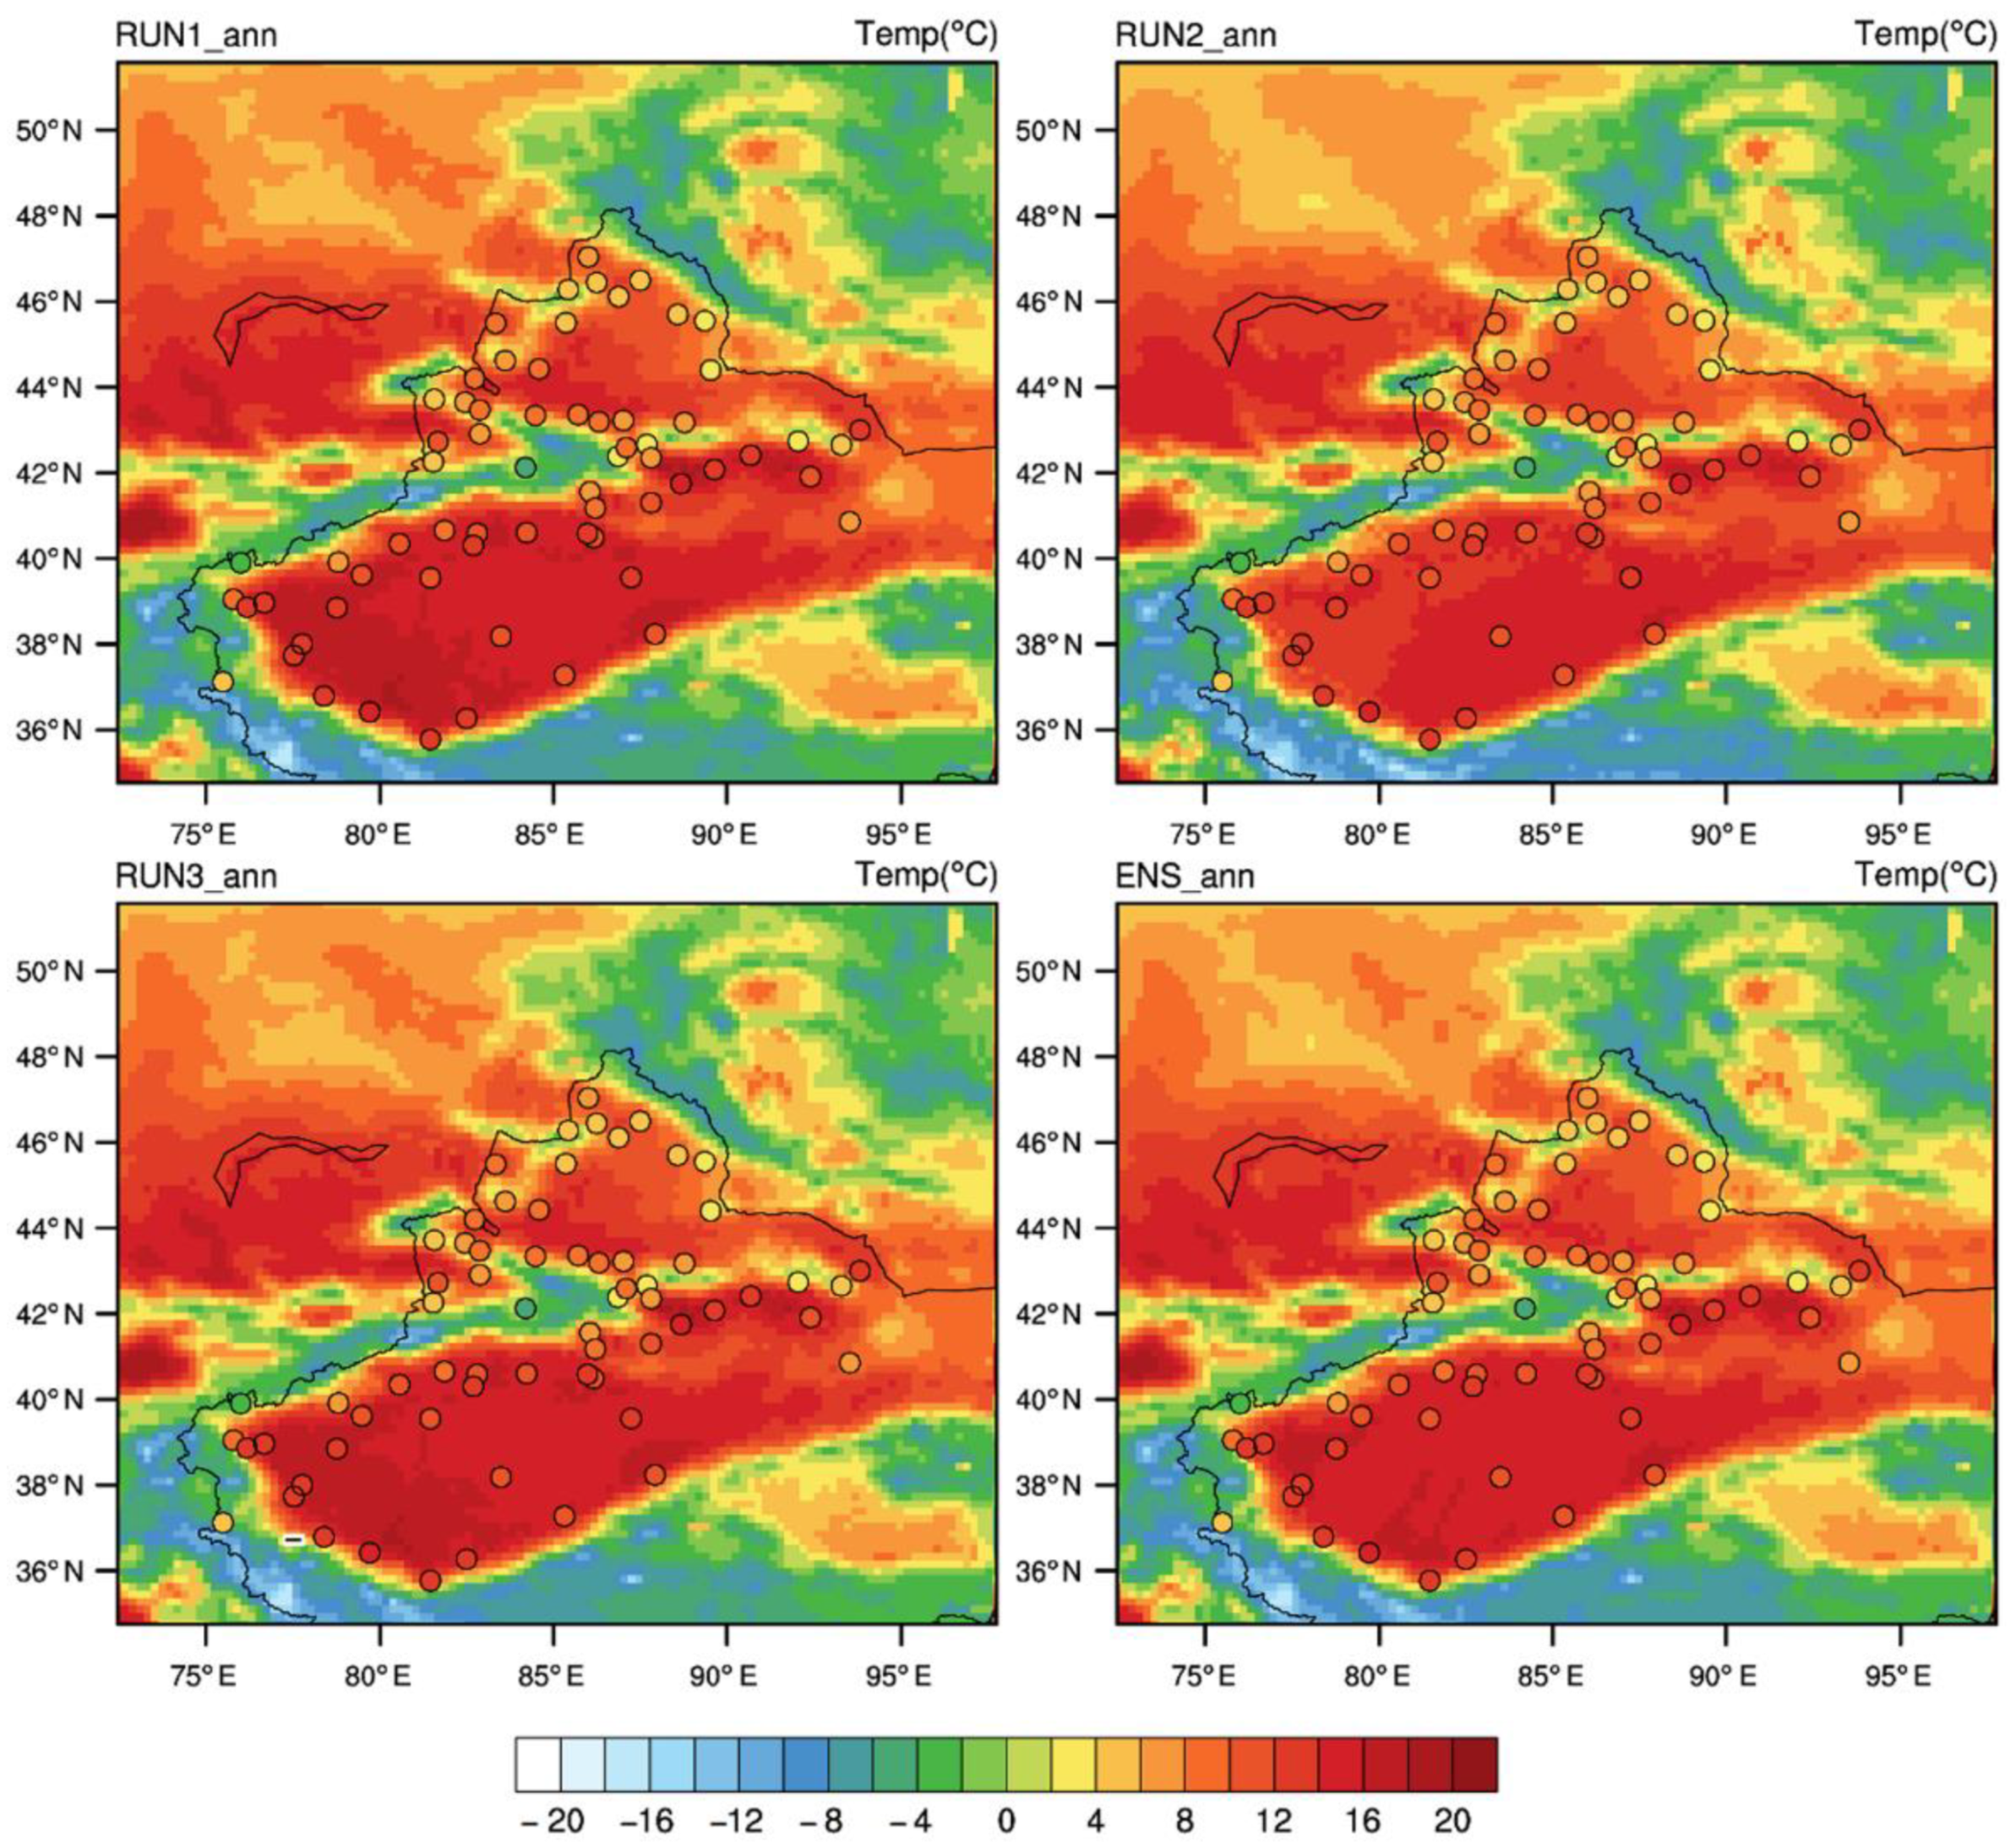
| Average annual temperature | RUN1_ann | 0.8 | 4.8 |
| RUN2_ann | 0.8 | 4.5 | |
| RUN3_ann | 0.8 | 4.8 | |
| ENS_ann | 0.8 | 4.7 | |
| Maximum temperature | RUN1_maxTemp | 0.9 | 5.2 |
| RUN2_maxTemp | 0.8 | 4.9 | |
| RUN3_maxTemp | 0.9 | 5.2 | |
| ENS_maxTemp | 0.8 | 5.1 | |
| Minimum temperature | RUN1_minTemp | 0.7 | 4.4 |
| RUN2_minTemp | 0.7 | 4.1 | |
| RUN3_minTemp | 0.7 | 4.4 | |
| ENS_minTemp | 0.7 | 4.3 | |
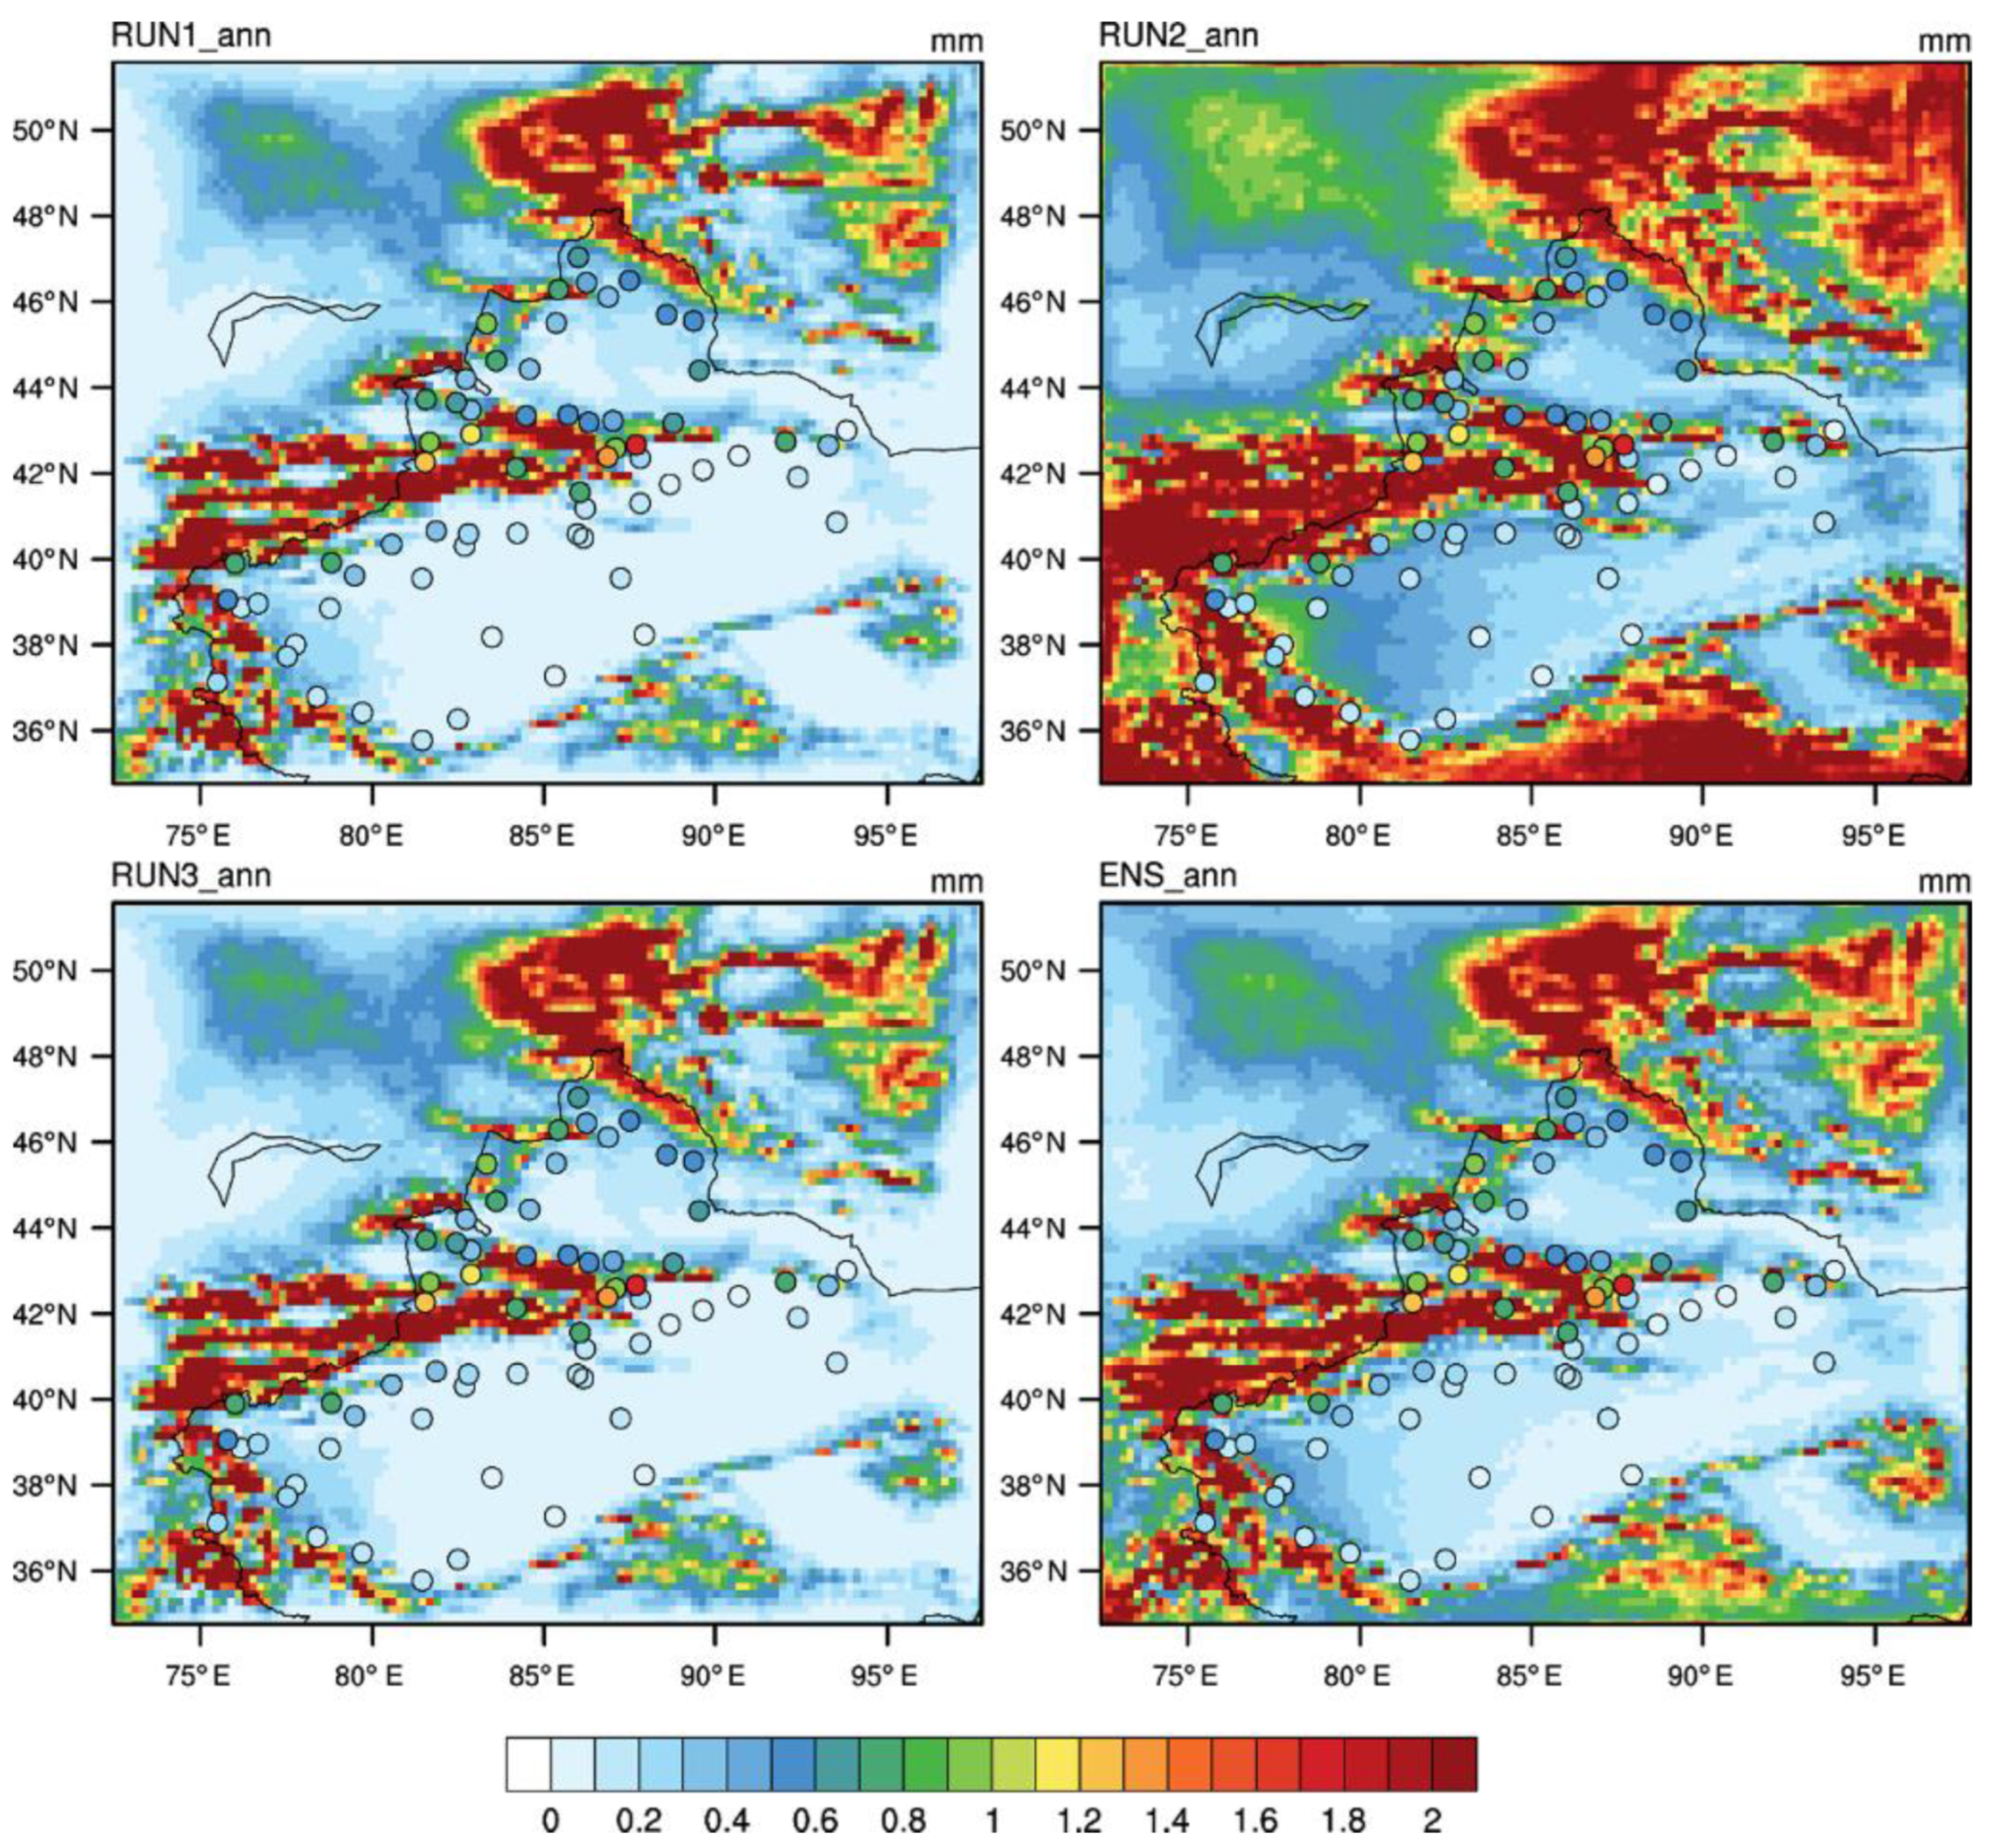
| Precipitation | RUN1_ann | 0.4 | 0.7 |
| RUN2_ann | 0.2 | 0.9 | |
| RUN3_ann | 0.4 | 0.7 | |
| ENS_ann | 0.4 | 0.7 | |
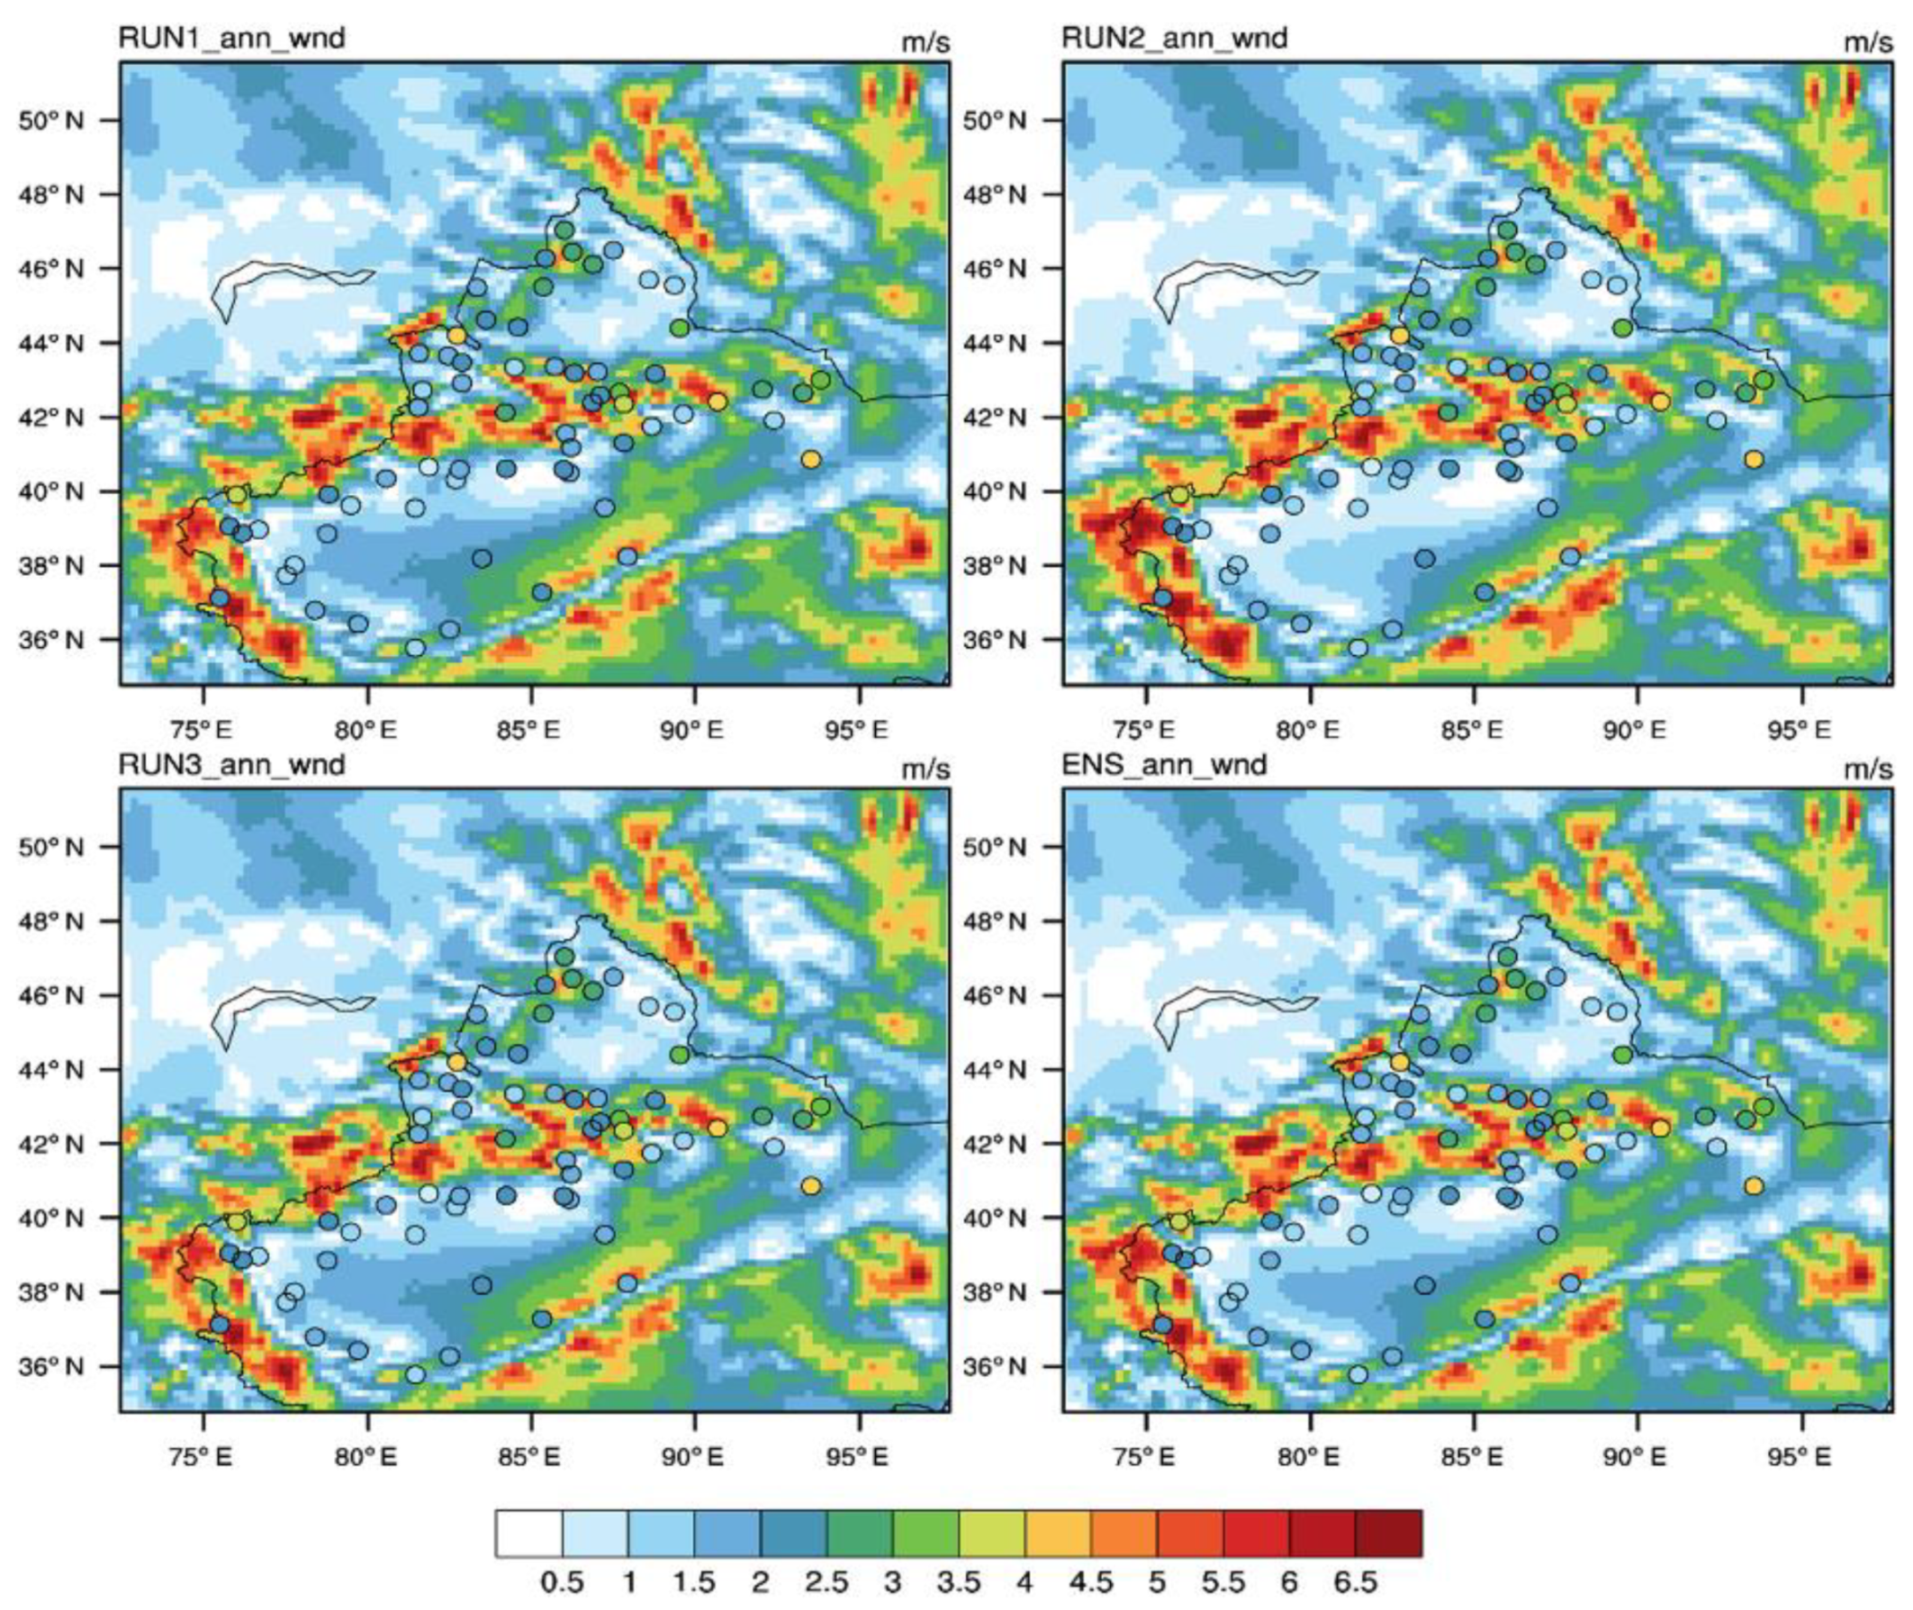
| Wind speed | RUN1_ann_wnd | 0.4 | 1.2 |
| RUN2_ann_wnd | 0.4 | 1.2 | |
| RUN3_ann_wnd | 0.4 | 1.2 | |
| ENS_ann_wnd | 0.4 | 1.2 |
| Simulation Parameter | Optimal Scheme |
|---|---|
| Average temperature | RUN2 |
| Maximum temperature | RUN2 |
| Minimum temperature | RUN2 |
| Annual precipitation | RUN1/RUN3/ENS |
| Wind speed | RUN1/RUN2/RUN3/ENS |
| Meteorological Factors | Parametrization Schemes | Spring | Summer | Autumn | Winter |
|---|---|---|---|---|---|
| Mean Temperature | RUN1 | 0.8 | 0.8 | 0.8 | 0.7 |
| RUN2 | 0.8 | 0.8 | 0.8 | 0.6 | |
| RUN3 | 0.8 | 0.8 | 0.8 | 0.7 | |
| ENS | 0.8 | 0.8 | 0.8 | 0.7 | |
| Maximum Temperature | RUN1 | 0.9 | 0.8 | 0.9 | 0.7 |
| RUN2 | 0.8 | 0.8 | 0.9 | 0.6 | |
| RUN3 | 0.9 | 0.8 | 0.9 | 0.7 | |
| ENS | 0.9 | 0.8 | 0.9 | 0.7 | |
| Minimum Temperature | RUN1 | 0.8 | 0.7 | 0.7 | 0.6 |
| RUN2 | 0.7 | 0.7 | 0.7 | 0.5 | |
| RUN3 | 0.8 | 0.7 | 0.7 | 0.6 | |
| ENS | 0.8 | 0.7 | 0.7 | 0.6 | |
| Annual Precipitation | RUN1 | 0.4 | 0.4 | 0.3 | 0.5 |
| RUN2 | 0.2 | 0.3 | 0.1 | 0.2 | |
| RUN3 | 0.4 | 0.4 | 0.3 | 0.5 | |
| ENS | 0.4 | 0.4 | 0.2 | 0.5 | |
| Wind Speed | RUN1 | 0.4 | 0.4 | 0.4 | 0.2 |
| RUN2 | 0.4 | 0.4 | 0.4 | 0.2 | |
| RUN3 | 0.4 | 0.4 | 0.4 | 0.2 | |
| ENS | 0.4 | 0.4 | 0.4 | 0.2 |
| Meteorological Factors | Parametrization Schemes | Spring | Summer | Autumn | Winter |
|---|---|---|---|---|---|
| Mean Temperature | RUN1 | 5.4 | 5.4 | 4.6 | 4.7 |
| RUN2 | 5.1 | 5.3 | 4.4 | 4.1 | |
| RUN3 | 5.4 | 5.4 | 4.6 | 4.7 | |
| ENS | 5.3 | 4.4 | 4.5 | 4.4 | |
| Maximum Temperature | RUN1 | 5.9 | 5.5 | 5.1 | 5.6 |
| RUN2 | 5.6 | 5.4 | 5.0 | 4.8 | |
| RUN3 | 5.9 | 5.5 | 5.1 | 5.6 | |
| ENS | 5.8 | 5.4 | 5.1 | 5.2 | |
| Minimum Temperature | RUN1 | 4.7 | 5.2 | 4.2 | 4.4 |
| RUN2 | 4.5 | 5.0 | 4.0 | 3.9 | |
| RUN3 | 4.7 | 5.2 | 4.2 | 4.4 | |
| ENS | 4.6 | 5.1 | 4.1 | 4.1 | |
| Annual Precipitation | RUN1 | 0.7 | 1.3 | 0.6 | 0.3 |
| RUN2 | 1.0 | 1.5 | 0.8 | 0.3 | |
| RUN3 | 0.7 | 1.3 | 0.6 | 0.3 | |
| ENS | 0.7 | 1.2 | 0.6 | 0.3 | |
| Wind Speed | RUN1 | 1.4 | 1.4 | 1.3 | 1.5 |
| RUN2 | 1.4 | 1.4 | 1.3 | 1.6 | |
| RUN3 | 1.4 | 1.4 | 1.3 | 1.5 | |
| ENS | 1.4 | 1.4 | 1.3 | 1.5 |
| Parameterzation Schemes | Spring | Summer | Autumn | Winter |
|---|---|---|---|---|
| Temperature | RUN2 | ENS | RUN2 | RUN2 |
| Maximum Temperature | RUN2 | RUN2/ENS | RUN2 | RUN2 |
| Minimum Temperature | RUN2 | RUN2 | RUN2 | RUN2 |
| Precipitation | RUN1/RUN3/ENS | ENS | RUN1/RUN3/ENS | ALL |
| Wind Speed | ALL | ALL | ALL | RUN1/RUN3/ENS |
Publisher’s Note: MDPI stays neutral with regard to jurisdictional claims in published maps and institutional affiliations. |
© 2021 by the authors. Licensee MDPI, Basel, Switzerland. This article is an open access article distributed under the terms and conditions of the Creative Commons Attribution (CC BY) license (https://creativecommons.org/licenses/by/4.0/).
Share and Cite
Cheng, Q.; Li, F. Performance of RegCM4.5 in Simulating the Regional Climate of Western Tianshan Mountains in Xinjiang, China. Atmosphere 2021, 12, 1544. https://doi.org/10.3390/atmos12121544
Cheng Q, Li F. Performance of RegCM4.5 in Simulating the Regional Climate of Western Tianshan Mountains in Xinjiang, China. Atmosphere. 2021; 12(12):1544. https://doi.org/10.3390/atmos12121544
Chicago/Turabian StyleCheng, Quanying, and Fan Li. 2021. "Performance of RegCM4.5 in Simulating the Regional Climate of Western Tianshan Mountains in Xinjiang, China" Atmosphere 12, no. 12: 1544. https://doi.org/10.3390/atmos12121544