Article

The Economic Loss Prediction of Flooding Based on Machine Learning and the Input-Output Model

1
Economics and Management School, Wuhan University, Wuhan 430072, China
2
Faculty of Engineering, The University of Sydney, Camperdown, NSW 2006, Australia
*
Author to whom correspondence should be addressed.
Atmosphere 2021, 12(11), 1448; https://doi.org/10.3390/atmos12111448
Submission received: 8 October 2021 / Revised: 28 October 2021 / Accepted: 30 October 2021 / Published: 2 November 2021
(This article belongs to the Special Issue Advanced Climate Simulation and Observation)

Abstract

:
As climate change becomes increasingly widespread, rapid, and intense, the frequency of heavy rainfall and floods continues to increase. This article establishes a prediction system using feature sets with multiple data dimensions, including meteorological data and socio-economic data. Based on data of historical floods in 31 provinces and municipalities in China from 2006 to 2018, five machine learning methods are compared to predict the direct economic losses. Among them, GBR performs the best with a goodness-of-fit of 90%. Combined with the input-output (IO) model, the indirect economic losses of agriculture to other sectors are calculated, and the total economic losses caused by floods can be predicted effectively by using the GBR-IO model. The model has a strong generalization ability with a minimum requirement of 80 pieces of data. The results of the data show that in China, provinces heavily reliant on agriculture suffered the most with the proportion of direct economic losses to provincial GDP exceeding 1‰. Therefore, some policy implications are provided to assist the government to take timely pre-disaster preventive measures and conduct post-disaster risk management, thereby reducing the economic losses caused by floods.

1. Introduction

The acceleration of climate change has intensified the water cycle, affected rainfall patterns, and caused rising sea levels, triggering more frequent heavy rainfall and worsening flood situations [1]. Due to global warming, research shows that the death toll and economic damage of floods have risen by around 75% and 200%, respectively [2]. According to a comprehensive analysis published in Geneva, 23 July 2021 by the World Meteorological Organization (WMO), of the top 10 meteorological disasters, floods have inflicted the top three largest economic tolls and human losses around the world over the past half-century. Fatal floods, incurred by heavy rains, occur with a low frequency, a wide range of influence, and can cause serious economic losses [3]. The economic loss from such natural disasters should be evaluated as soon as possible and effective countermeasures should be taken to manage natural hazards [4]. Hence, if potential economic losses of floods can be accurately predicted prior to or just after the beginning of heavy rainfall, more time can be provided for people to take precautions and put in place measures to avoid and alleviate unnecessary losses and secondary hazards.
In response, relevant studies of economic loss assessment have been conducted. Generally, economic losses, which can be measured with monetary value, are classified into two sorts: direct economic losses and indirect economic losses [2]. Direct economic losses refer to property losses of residences, asset losses of enterprises, loss of infrastructure, loss of natural resources, etc., while indirect economic losses arise from the suspension and reduction of production, investment premiums, material shortages, overstock, and losses from related industries [5].
For direct economic losses, assessments are normally conducted by using a flood stage-damage calculation [6], loss rate approach, comprehensive loss value method, Category-Unit Loss Functions [7], approach based on RS and GIS [8], and Regression Analysis Rapid Evaluation Model [9], etc. By far, most of the direct economic assessments are conducted post-disaster, while pre-disaster assessment is currently at an initial stage. Yet with the boom in artificial intelligence, advanced approaches, such as backpropagation neural networks (BPNN) [10], random forest, support vector regression (SVR) [11], and gradient boosted regression tree (GBR) [12], etc., are implemented to predict the direct economic losses of natural disasters. The most popular approach among these is BPNN. Although BPNN better fits the complex nonlinear function relationship and has higher assessment accuracy, it requires a huge amount of data, which is lacking in extreme weather data as the number of flood occurrences across history are limited [10]. Another commonly used method, SVR—the extension of support vector machine (SVM)—is suitable for solving high-dimensional regression problems using a small number of samples, which is in accordance with the features of natural disasters [13]. Additionally, ensemble learning—a commonly used algorithm—integrates several machine learning methods to reduce deviation and improve prediction accuracy [14]. Extreme Gradient Boosting Regressor (XGB) has been demonstrated to be a good fit for evaluating economic losses of natural disasters, but the generalization ability is unsatisfactory [12]. Sun et al. used GBR in the field of direct economic loss evaluation caused by storm surge disasters, improving the prediction accuracy and reducing model overfitting caused by small datasets [11]. However, there has not yet been any report of research applying GBR to the disaster assessment of floods.
For indirect economic loss assessment, empirical analysis methods, Computable General Equilibrium (CGE) models, and Input-Output (IO) models are commonly used. The empirical analysis method assumes a certain proportional relationship between the indirect economic losses caused by a flood to different sectors and industries and its direct economic losses in the inundated area, but the result is relatively ineffective [15]. The dynamic CGE model can realize a comprehensive assessment of the indirect economic impact of flood disasters through parameter simulation, flow restriction simulation, and variable shock simulation [16]. However, CGE models are based on more restrictive assumptions, which typically assume optimizing behavior and equilibrium economy. Such assumptions are easily violated under real-world economic conditions [17]. In contrast, the input-output approach, an improvement in methodologies, is more suitable for assessing economic losses caused by exogenous shocks [18]. Zhang et al. implemented the IO model to analyze the indirect economic losses of floods in Hunan Province, China, in 1998 [2]. It is proven that the model is an effective and flexible approach to assess indirect economic losses as it can select the number of sectors according to the retrieved data.
Therefore, in this paper, we establish a comprehensive prediction system to assess the direct and indirect economic losses caused by floods in 31 regions of China. There are two main contributions in this paper. Firstly, we designed a timely and effective pre-disaster prediction system with the GBR-IO model by using indicators which can be collected pre-disaster or at the beginning of a flooding episode and found the minimum amount of data required for the prediction system to be able to provide results with high effectiveness. Secondly, based on the meteorological features of natural disasters, we combined machine learning methods, using advanced regression prediction approaches, with the input-output model, a traditional economic method, resulting in what can have a profound impact on inter-disciplinary research. Thirdly, the method we used has a high generalization ability, meaning that it can be applied to other countries and regions which experience flooding, especially those with small datasets.

2. Materials and Methods

2.1. Study Area

Statistics show that Asia is the continent where floods are, by far, the most frequent and devastating natural disasters around the world [19]. Among Asian countries, China—with a monsoon climate and major rivers of the world—is the most frequently affected country. Around the world, the frequency of floods and economic losses caused by floods in China ranked first, and the casualties and death toll ranked second during the last decade [20]. Recently, in mid to late July 2021, rainstorms and devastating floods battered large portions of North China and the Huanghuai Region, especially Zhengzhou, the state capital of Henan province, causing the deaths of 302 people, 50 people to be missing, and 114.3 billion RMB yuan (US $17.7 billion) in direct economic losses [21]. For studying floods or the economic losses caused by floods, China is ideal in terms of sample size and practical significance. Thus, in this research we focused on 31 provinces in China (excluding the Hong Kong, Macao, and Taiwan regions) with the aim having the ability to extend the prediction system to other countries affected by flood threats.

2.2. Data

The process of establishing the pre-disaster prediction system is data-driven. We primarily used two sorts of data: first, meteorological data; and second, socio-economic data. To predict the direct economic losses in terms of geographical information and timescale, while considering the integrity, continuity, and variety of data, we selected a time-series dataset of 31 provinces and municipalities in China composed of a period of 13 years, from 2006 to 2018. With the aim of ensuring the timeliness of the prediction system, we chose variables based on significance and whether they can be retrieved pre-disaster or at the beginning of a flooding episode. Therefore, 23 independent variables and a dependent variable, the latter being direct economic loss, were used in the study, as shown in Table 1. There were 403 pieces of data in total showing the meteorological and socio-economic conditions. To predict the indirect economic losses, which are based on the direct economic losses of the agricultural sector, we further utilized the direct economic loss data as the input of the IO model. With the combination of other socio-economic data, we generated the indirect economic losses caused by the demand reduction in the agricultural sector.

2.2.1. Meteorological Data

Meteorological data were obtained from “Daily meteorological dataset of basic meteorological elements of the China National Surface Weather Station (V3.0)” including China’s national basic weather stations, reference climatological station, and general weather stations, with a total of 2474 stations of the China Meteorological Administration. All of the research data were retrieved at an annual provincial level. The data included daily maximum precipitation, precipitation anomaly percentage, precipitation anomaly percentage in spring, precipitation anomaly percentage in summer, precipitation anomaly percentage in autumn, precipitation days, moderate rainy days, heavy rainy days, torrential rainy days, and maximum continuous precipitation days.

2.2.2. Socio-Economic Data

To predict the direct losses, the socio-economic data included: casualties, death toll, direct economic losses, sown area with 10% reduced production, sown area with 30% reduced production, sown area with 80% reduced production, railway disruption, road disruption, number of reservoirs, capacity of reservoirs, area with flood prevention measures, area of soil erosion under control, and length of city sewage pipes. The above data were retrieved from the Bulletin of flood and drought disasters in China (2006–2018), published by the Ministry of Water Resources of the People’s Republic of China, China statistical Yearbook (2006–2018). To predict the indirect economic losses, the Input and Output table with 42 sectors of 31 provinces from the National Bureau of Statistics (2017) was used to calculate the industry linkage [22].

2.2.3. Data Processing

Step 1 processing the missing data: As mentioned in the previous section, all data used in the study were collected online and offline from official datasets, official reports, and reference books. For some missing data, if the data were proved to be below the statistical standard, we substituted it with 0. For the data where the true value was missing, the data were substituted with the average figure in order to mitigate the impact on the prediction model.
Step 2 normalization: Each sample of the original dataset had 23 features (independent variables) to reflect the flood disasters from a specific aspect or information related to the local province. If components are with different magnitudes, they will not make equal contributions to fit the model and are likely to cause a bias. Due to this, we used the normalization process of Min-Max normalization to make the indicators comparable. By doing so, all features were transformed into the range [0, 1], meaning that the minimum value of a feature becomes 0, while the maximum value of that becomes 1. The formula is as follows:
x n o r m a l i s e d = x min x max x min x
where x denotes the input of independent variables.

2.3. Methods

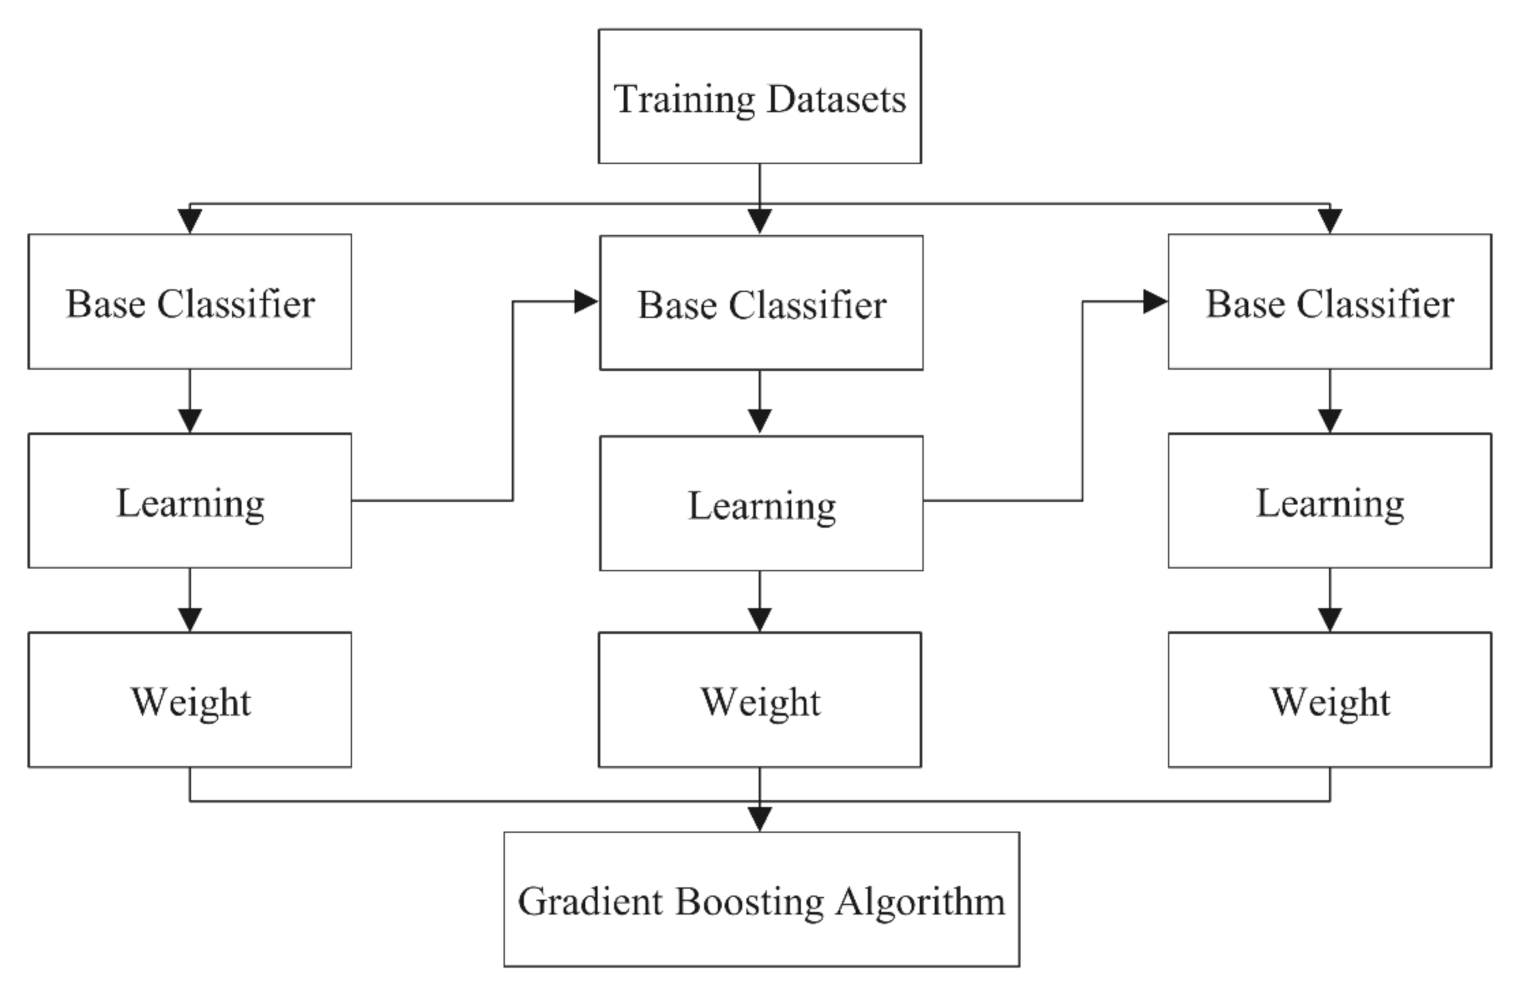
2.3.1. Gradient Boosting Regression Trees (GBR)

A new machine learning method, Gradient Boosting Regression Trees (GBRT or GBR) was adopted in our research to efficiently predict the direct economic losses of floods. It is a modification of the gradient boosting (GB) algorithm and Classification and Regression Trees (CARTs) by using a regression tree of fixed size as weak learners [23].
The gradient boosting algorithm, proposed by Friedman in 1999 [24], integrates various machine learning and statistical methods, such as gradient algorithm, boosting algorithm and tree algorithm. The rationale of the gradient boosting algorithm is to create new base learners which are maximally correlated with a negative gradient of the loss function. Compared with traditional boosting algorithms, along the direction of the gradient, every new model is built with the aim of reducing the loss function of the previous model. By using the gradient boosting algorithm during the training process, regression was achieved by continuously reducing the residuals [25]. The process of gradient boosting with multiple iterations is shown in Figure 1. To elaborate on the training process, in each iteration, a weak classifier is generated by the model, which goes through further training according to the residuals of the previous classifier. Based on the performance of a classifier, the weight is generated. The poorer the performance, the more weight will be given. Finally, the ensemble model is achieved by the weighted summarization of all weak classifiers. With a variance reduction, the prediction accuracy of a classifier is improved. Both continuous and discrete values can be dealt with gradient boosting, and this algorithm can mitigate the drawbacks of overfitting. In the process, a base classifier, also known as a weak classifier, is generally CARTs, a series of decision tree regression models. The weight is generated based on the performance of weak classifiers, and the process of learning consists of inputting the residuals from the previous iteration as the object function of the next base classifier.
Classification and regression trees (CARTs), proposed by Breiman et al. in 1984 [26], can be used for both classification and regression models [27,28,29]. The two types of trees used in these two models are decision trees and regression trees. Compared with other artificial intelligence models, CARTs have better performance in terms of prediction as they can obtain nonlinear relationships without requiring prior information about the probability distribution of variables.
The GBR algorithm combines weak learners by iteratively concentrating on the errors resulting at each step until a sum of the successive weak learners can a create suitable strong learner.
Given the Dataset X i , Y i = 1 n (i.e., historical flooding dataset), the loss function is used to evaluate a set of weights to seek a minimized error with the aim of optimizing the model. Let Xi denote a set of explanatory variables (i.e., disaster-inducing factors, disaster-affected bodies and the disaster-prevention capabilities) and Y be dependent variables (i.e., direct economic losses). There are six main steps of the GBR, which can be expressed as follows:
  • Initialize the parameters in the learning machine with the following equation:
F 0 ( x ) = arg min ρ i = 1 N L y i , ρ
where F 0 x is the parameter set. ρ is the parametric variable that minimizes the loss function, and L y i , ρ is the square error loss function in our model. The negative gradient of the loss function is used in the current model as an approximation of the residual. The calculation process of the residual is shown as follows:
y i ¯ = L y , F x i F x i F x = F m 1 x , i = 1 , 2 , , N
For iterations m = 1 to M:
where F x i refers to the objective function.
2.
A regression tree is generated with J leaf nodes, described as follows:
R j m 1 J = J T N T y i ¯ , x i i N
where R j m refers to a regression tree with J leaf nodes, TNT refers to terminal node tree.
3.
Estimating the value of the leaf nodes in the regression tree. The value can be estimated by the following equation:
γ j m = arg min γ x i R j m L y i , F m 1 x i + γ
where γ refers to the value of the leaf nodes in the regression tree.
4.
The learning machine of this iteration can be obtained, as shown in the following:
F m x = F m 1 x + j = 1 J γ j m I x R j m
5.
After iterations, the final regression model can be shown as follows:
F x = F m x = γ + m = 1 M j = 1 J γ j m I x R j m ,   where   I x R j m = 1 , x R j m 0 , x R j m
Numerous researchers have developed an index system-based assessment method to gain a better understanding of the relationship between factors and natural disaster loss. Sun et al. classified the indicators into several different categories, including disaster-inducing factors, disaster-affected factors and disaster-prevention capabilities [30]. In our research, we also designed an index system for independent variables as the input of GBR, as shown in Table 1.
To predict the direct economic losses of floods pre-disaster or at the beginning of a flooding episode is to establish a regression model. Since the dataset of flooding, a disaster occurring with a low frequency, is discrete with a small scale and large time span, five machine learning methods are generally used, including Bayesian Ridge, Line Linear, Elastic Net, XGB, and GBR [31]. Despite the advantages of the other four methods, we compared the five different models to verify the effectiveness of GBR. The comparative experiment is designed as follows in Figure 2:
To further reduce the autocorrelation between the variables, principal component analysis (PCA) is implemented. In this study, we used a randomized truncated singular value decomposition (SVD) by the method Halko et al. 2009 [32].
To compare the validation of the performance of the five models, four indicators are used, including Root-Mean-Square Error (RMSE), Mean Absolute Error (MAE), Explained Variance (EV), and R-squared score(R2). The formulas are as follows:
R M S E = i = 1 n ( y i y ^ i ) 2 n
M A E = i = 1 n y i y ^ i n
E V y i , y ^ i = 1 V a r y i y ^ i V a r y i
R 2 y i , y ^ i = 1 i = 1 n ( y i y ^ i ) 2 i = 1 n ( y i y ¯ ) 2 = 1 R M S E V a r y i
where y i is the actual measurement, y ^ i is the predicted value y ¯ = 1 n i = 1 n y i , n is the number of measurements.
In this article, Anaconda Navigator 2.0.3, python 3.8.8, Jupyter notebook 6.3.0 were implemented.

2.3.2. Input-Output (IO) Model

Natural disasters, especially floods, have detrimental impacts on the agricultural industry and disrupt public transportation. The agricultural industry and the transportation industry are closely related to other industries, such as real estate, construction, warehousing and retail, accommodation, and catering, etc. Floods also cause indirect losses in upstream and downstream industries that are not directly related, such as the financial, mining, and other industries. Therefore, losses of directly affected industries were predicted by using the machine-learning prediction system, and then as the input, the predicted direct losses were used to evaluate the indirect losses of other industries using the Input-Output (IO) model.
The IO model has been implemented to assess the economic effect of natural disasters since the 1970s. Results have shown that the model can assess related economic losses effectively. In this article, indirect economic losses among the industries are evaluated by using a static IO model [18].
The correlations among the industries in the IO table can be expressed as:
A X + Y = X
That is,
i , j = 1 n a i j X j + Y i = X i   i , j = 1 , 2 , , n ,  
where a i j is the direct consumption coefficient, X i is the total output of sector i, and Y i is the final demand for sector i. The above formula can then be transformed as:
X = I A 1 Y  
where I is the identity matrix and I A 1 is the inverse matrix of Leontief.
Taking the sectional direct economic losses as losses in final products,   Δ Y = Δ Y 1 , Δ Y 2 , , Δ Y n T . The total product loss is then:
Δ X = I A 1 Δ Y .
where Δ X denotes the total economic losses, and Δ Y denotes the direct economic losses Thus, the loss of indirect input is expressed by the reduction of intermediate input, as Δ X Δ Y .
To improve the accuracy of the indirect loss assessment of various departments, this paper uses the complete consumption coefficient for analysis. Let B be a complete consumption coefficient matrix obtained by transforming the direct consumption coefficient matrix A, then B = I A 1 I . Therefore, the total loss of the product can be further expressed as:
Δ X = B + I Δ Y .
Assume that Δ Y i is the economic loss in the sector i caused by floods and the final use of other sectors has no change. The total output of the entire economic system then becomes:
Δ X 1 Δ X 2 . . . Δ X ˙ n = b 1 i Δ Y i b 2 i Δ Y i . . . b n i Δ Y i + 0 0 . Δ Y i . 0 ,
where b i j i , j = 1 , 2 , , n are the complete consumption coefficients. The total output loss of sector i is then:
Δ X i = b i i Δ Y i + Δ Y i ,
where Δ Y i is the direct economic loss of sector i and b i i Δ Y i is the indirect economic loss of sector i. The total product losses of other sectors are:
Δ X n = b n i Δ Y i ,   n i .

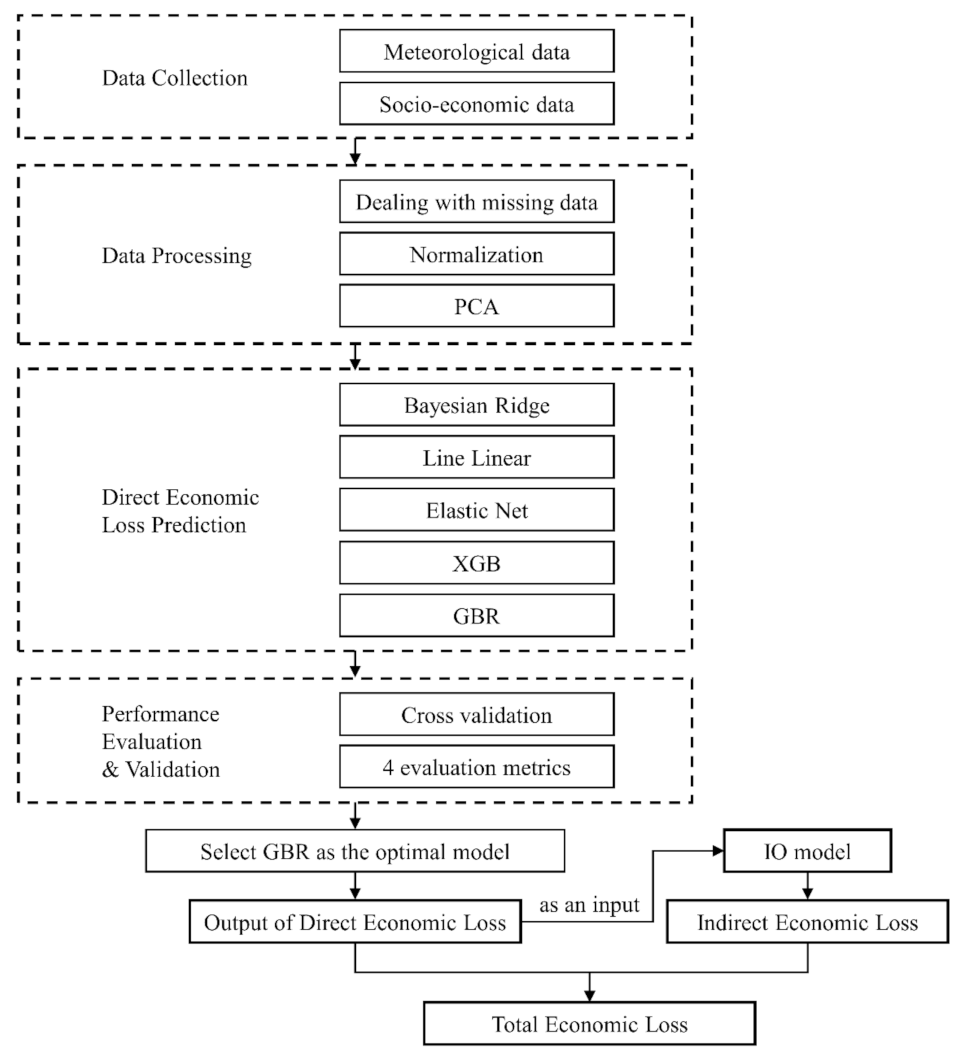
2.3.3. The Pre-Disaster Prediction System

The overall prediction system process of the GBR-IO model is shown, as follows, in Figure 3.

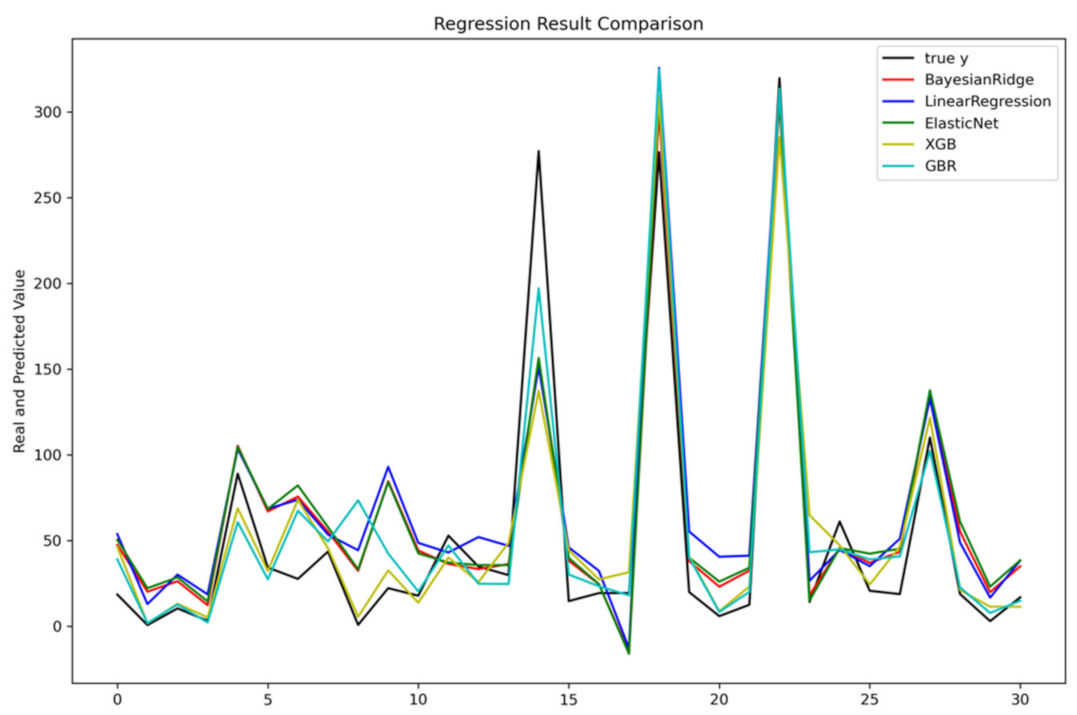
3. Results & Discussion

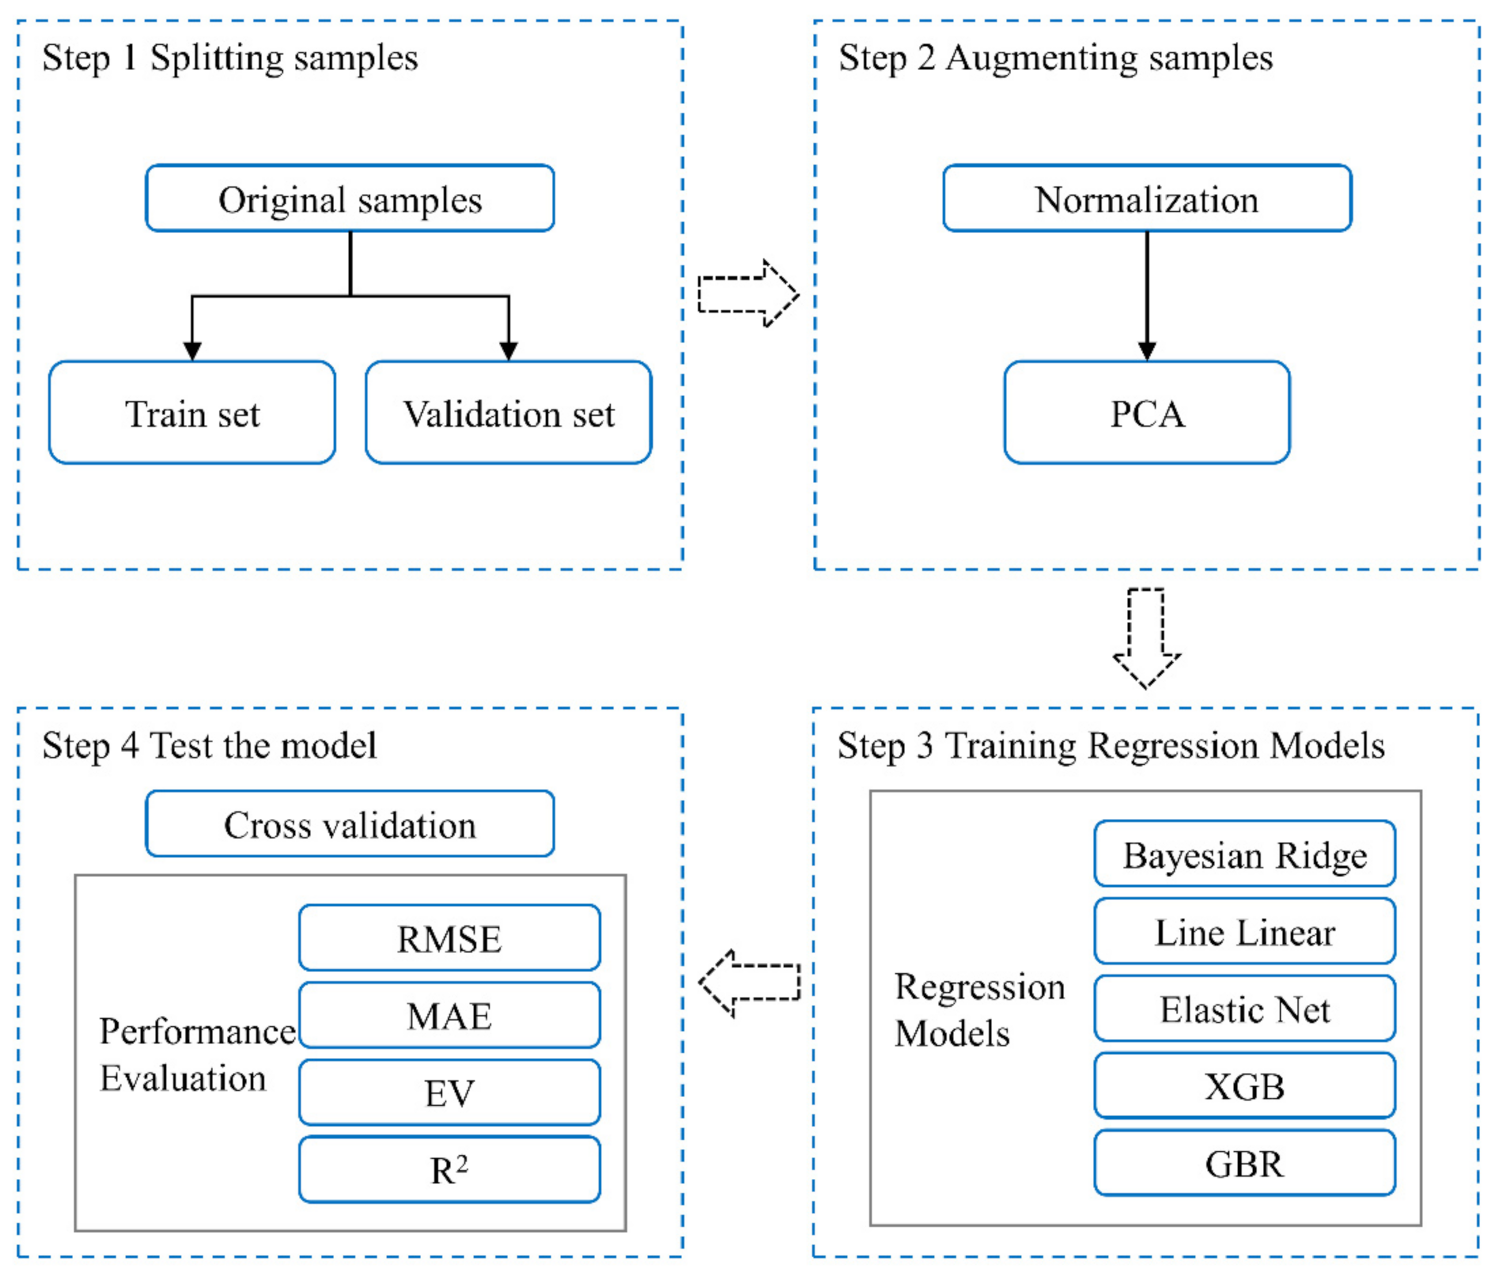
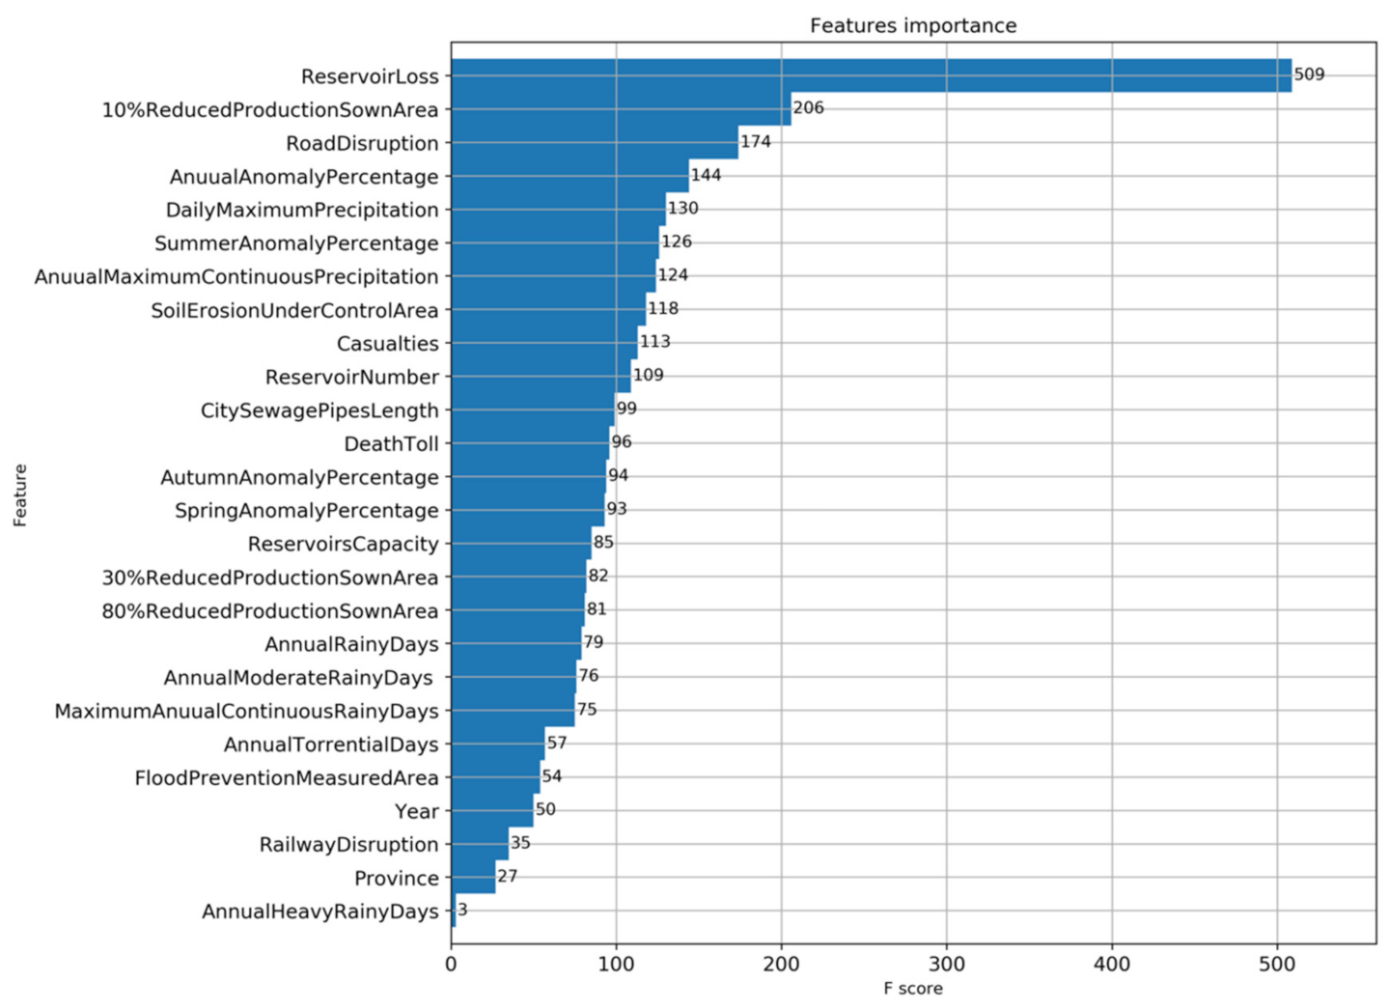
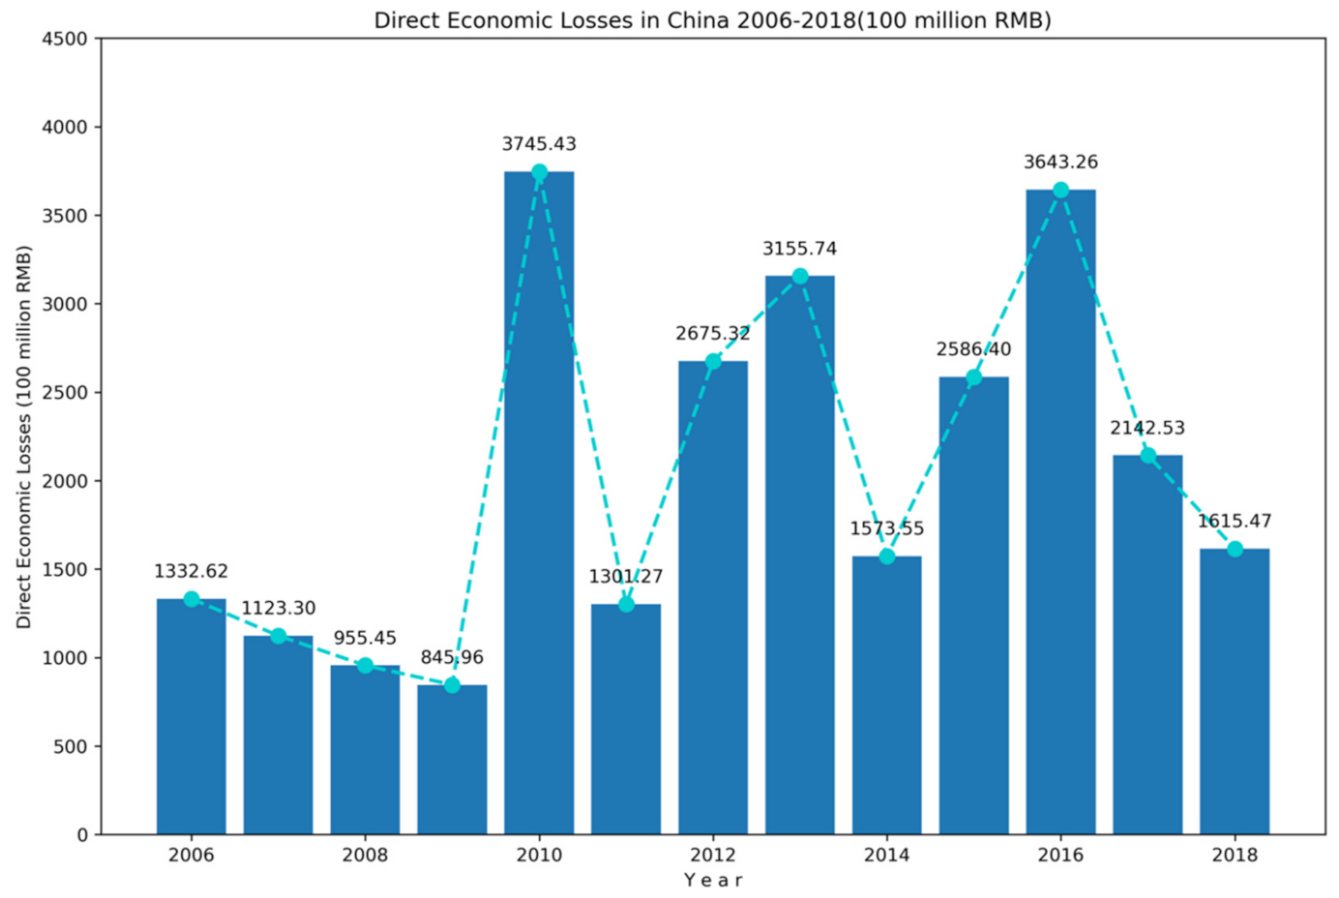
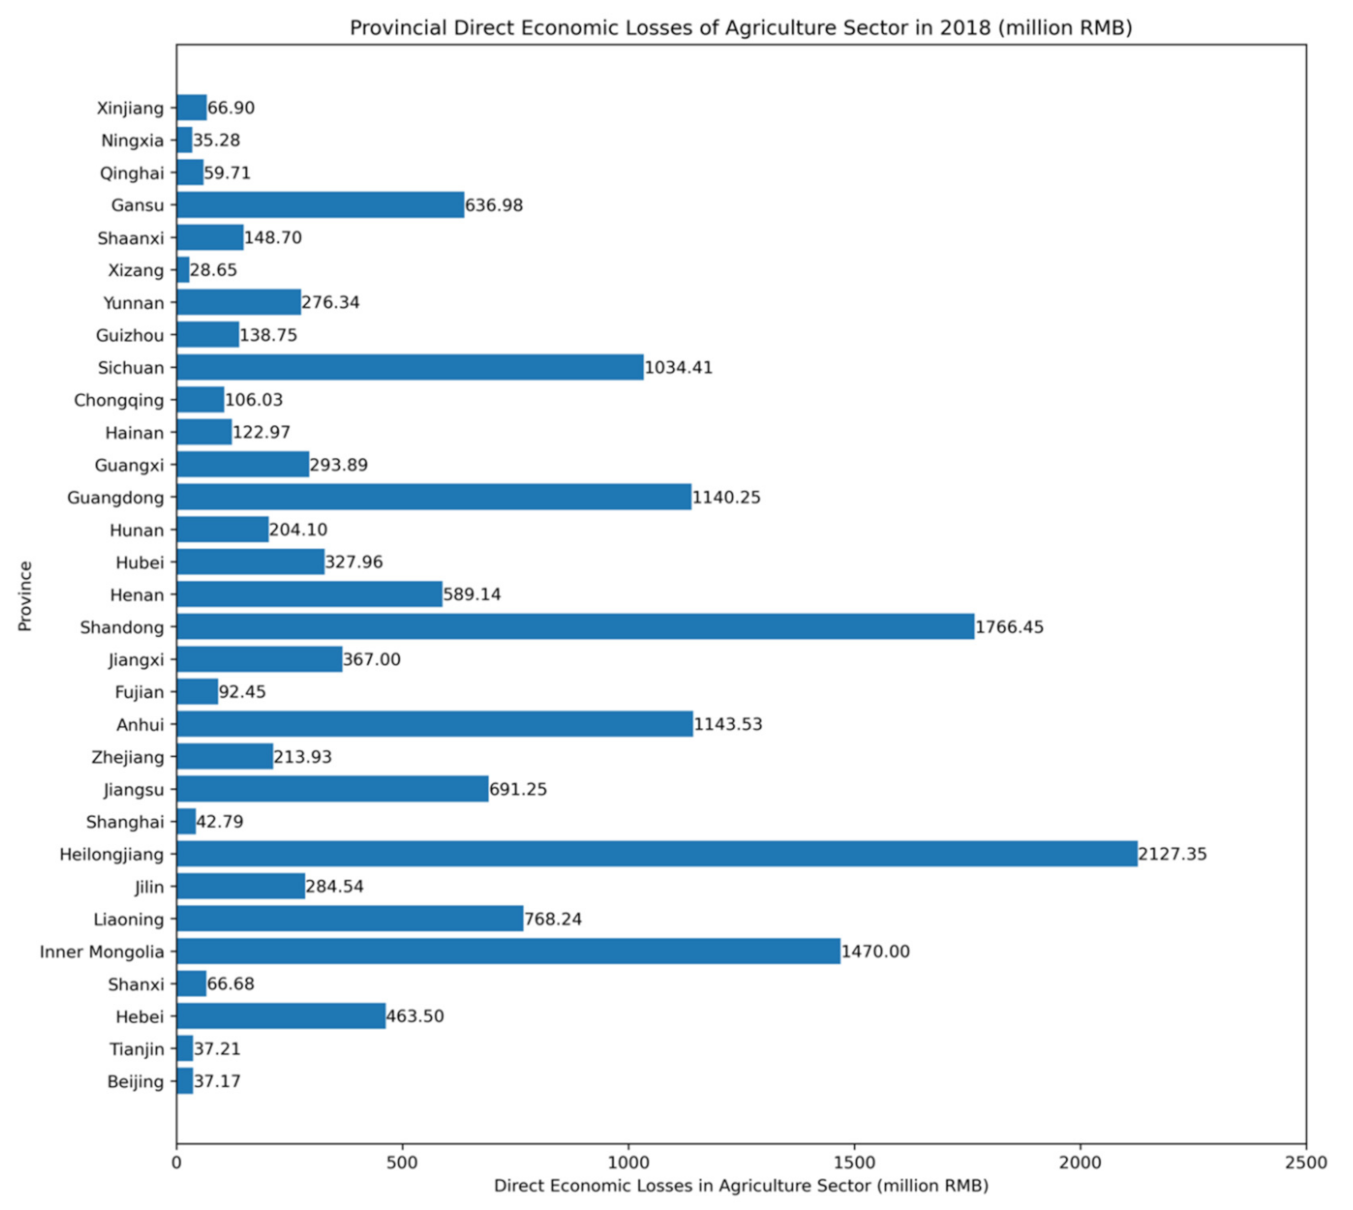
3.1. Direct Economic Loss Prediction

To analyze which features make the most contribution in causing direct economic losses, we firstly retrieved feature importance indicating the usefulness and value of each feature in the construction of the boosted regression trees within the model. The more an attribute is used to make key decisions with decision trees, the higher the F score is. From Figure 4, below, it can be seen that reservoir loss, sown area with 10% reduced production, road disruption, annual anomaly percentage and daily maximum precipitation are the top five features of importance.
Further, we developed a heat map of the correlation coefficient between the top 10 features and the model. The heat map is used to directly illustrate the correlation between the indicators and economic losses of flooding. The color shade of the heat map shows the degree of the correlation; that is, the greater the correlation, the lighter the color. The correlation between the indicators and direct economic losses, ranging between −1 to 1, shows whether they are positively correlated or negatively correlated. From the heat map, shown in Figure 5, it is notable that reservoir loss (with the correlation of above 0.8), sown area with 10% reduced production (correlation of 0.6–0.8), casualties (correlation of 0.6), road disruption, number of reservoirs, annual anomaly percentage, summer anomaly percentage and daily maximum precipitation are positively correlated with direct economic losses. In contrast, length of city sewage pipes (correlation of −0.2–0), reservoir capacity (correlation of −0.3) and annual rainy days are negatively correlated (correlation of below −0.2). From the results, it can be inferred that: (1) the agricultural industry is the most directly affected sector; (2) there is a time lag in constructing reservoirs for the mitigation of economic impacts caused by floods; (3) since a region with high annual rainy days is less likely to suffer from economic losses of floods, a possible explanation could be that such regions have a balanced precipitation trend and are unlikely to suffer from floods caused by short-term torrential or heavy rains; (4) the improvement of disaster prevention capabilities is effective in reducing economic impacts; and (5) reservoir loss contributes the most to direct economic losses, among other factors.
To further reduce the autocorrelation between variables, principal component analysis (PCA) was implemented. PCA is used to decompose a multivariate dataset in a set of successive orthogonal components that explain a maximum amount of variance. The PCA screen plot in Figure 6 shows the explained variance of all of the variables used in the model. Based on the ranking of variance that is explained, we selected the top 16 principal components as new features, i.e., F1 to F16 in Figure 6. Such new features retained 90.75% of the original information. Due to the characteristics of decision tree algorithms, they do not address the value of variables. Therefore, there is no need for feature normalization and PCA. The tree models (GBR and XGB) in the study were not processed with PCA.
The above new features are input into the prediction system to be trained with five different machine learning algorithms. During the training process, K-fold cross-validation (k = 5 in this prediction system) is performed. Firstly, the original data set is split into five sets. We then use the four of the five sets as the training set to train the model without repetition. Such an approach can obtain a substantial amount of information from limited data. The cross-validation results are shown in Figure 7. Among the five machine learning methods, Bayesian Ridges and GBR performed better than the other three methods, with a cross score of around 0.7. To further determine which method is better, four regression model evaluation metrics, including RMSE, MAE, EV, and R2, were used to compare the prediction effect of the model.
RMSE, MAE, EV, and R2 were calculated for the gradient boosting regression technique, as well as the other four machine learning methods. The lower value of RMSE and MAE and the higher value of EV indicate the more accurate prediction result, and the higher value of R2 indicates a heightened match between the analytical and predicted values. The advancement of gradient boosting regression, compared to other approaches, is shown in Table 2. Observing the regression metrics, it is notable that, although Bayesian Ridge, Linear Regression, and Elastic Net perform better than GBR in some error metrics, the prediction of a specific dataset can substantially deviate from the true value, indicating overfitting. GBR has the highest R2 and low RMSE, MAE and high EV in comparison to the predicted and the actual value, indicating that GBR has the best fit of values and a better fit than the other four methods. Therefore, combining the cross-validation results and regression metrics, we obtained GBR as the best machine learning regression model in predicting the direct economic losses of floods.
The learning curve is generally used in machine learning to evaluate both the performance of the training and the validation of datasets to diagnose whether the model is underfit, overfit, or well-fit [33]. Training samples on the horizontal axis show the size of datasets used in the learning process, while the score on the vertical axis represents R2, which is used to evaluate the overall performance. The learning curve of the GBR model is shown in Figure 8. With the expansion of the training set, the cross-validation score approaches a desirable level, and it converges with the training score. It can be seen from the figure that when the training data size reaches about 80 pieces, the over-fitting and under-fitting of the model have been significantly reduced, proving that the GBR model is well-fit. Adding more training data can decrease the variance and bias of the GBR model. When the data size reaches about 150 pieces, the variance and deviation of the prediction results can be further mitigated. Therefore, when the model is generalized to analyze similar problems in other countries or regions, the required data size must reach at least 80 pieces, and the prediction accuracy will be improved with the expansion of data size.
Integrated learning is considered to have high predictive precision, especially in terms of those algorithms which use a decision tree as the base learner. To validate GBR as the optimal combined model, we compared the regression result with Bayesian Ridge, Linear Regression, Elastic Net, XGB, and GBR, as is shown in Figure 9. It can be seen that GBR is the best fit for the true value.
To verify the effectiveness of the prediction model, we did descriptive analysis and empirical analysis based on the dataset in China from 2006 to 2018.
According to the descriptive statistical analysis for the years 2006 to 2018, the direct economic losses caused by floods in China were overwhelmingly higher in the years 2010 and 2016 than of that in other years and showed an overall increasing trend, as shown in Figure 10. Among the floods in China over this period, floods in 2010 caused by torrential rainfall in southern China were the most devastating to occur since 1998, leading to the worst economic conditions in the past half century [34]. Global warming had caused a surge of moisture in the atmosphere. With the combination of a strong El Niño effect and climate change, severe flooding occurred along the Yangtze River in the summer of 2016 [35]. The floods that broke out in these two years were the worst in the recent decades resulting in the direct economic losses being much more severe than in the other years analyzed.
As for the empirical analysis, by splitting the samples into training sets (data from 2006 to 2017) and the validation set (data in 2018), we gained the regression result of direct economic loss with GBR, as shown in Table 3. The comparison between the true value and predicted value is shown in Figure 11. It is notable that the deviation between the predicted direct economic losses and the true economic losses is relatively negligible. From Table 3, we can see that among 31 provinces in China, Heilongjiang, Shandong, Inner Mongolia, and Gansu provinces, which are heavily reliant on agriculture, suffered the most, with the proportions of the direct economic losses to provincial GDP at 1.73‰, 0.94‰, 0.86‰, and 0.75‰ respectively.
From the charts above, it can be seen that, for provinces suffering mild losses from natural disasters, the GBR model can provide relatively accurate prediction results in terms of the direct economic losses, while for the losses caused by extreme weather, despite the suddenness and uncertainty, the prediction results can still partially reflect the characteristics; reflecting the robustness and effectiveness of the model. It is also notable that the provincial direct economic losses caused by floods are geographically unevenly distributed. Gansu, Guangdong, Shandong, Inner Mongolia, and Yunnan suffered more direct economic losses, while Ningxia, Shanxi, and Tianjin suffered less. Such distribution can be attributed to the following reasons: (1) coastal regions are more susceptible to floods caused by typhoons and monsoon climates; (2) provinces with a high reliance on agriculture, such as Henan, Shandong, and Gansu, are more likely to be economically affected by floods as the agriculture sector is directly related to natural disasters; (3) provinces with more flood prevention facilities and infrastructure, such as Beijing, Tianjin, and Shanghai have strong resistance to floods.

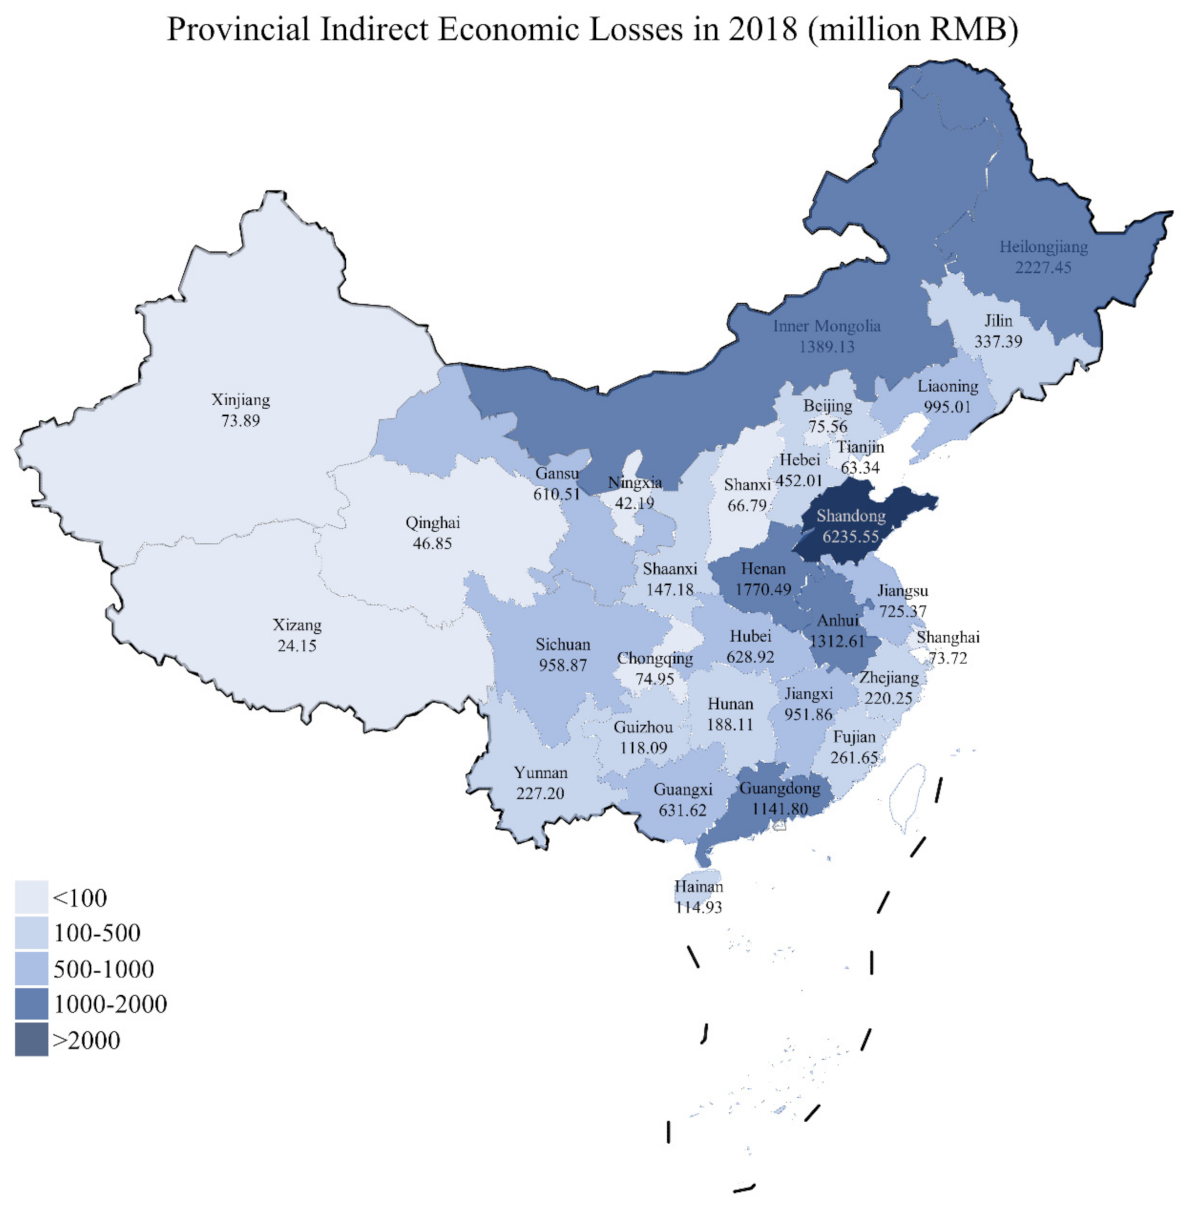
3.2. Indirect Economic Loss Prediction

In this paper, the IO model was introduced to predict the indirect economic losses caused by floods in 42 sectors of 31 provinces in China. The precondition of the IO model is to apply the economic loss data of directly affected sectors. Since agriculture is the most directly affected sector among all of the 42 sectors, according to the Chinese National Bureau of Statistics, we took it as the directly affected sector to calculate the indirect losses of all of the sectors by using the industry linkage generated from the IO table [36].
For the direct economic loss of the agricultural sector, according to the descriptive statistical analysis (as shown in Figure 11), most of the floods in Northern China happened in autumn, while those in Southern China happened in summer. The sown areas in both northern China in autumn and southern China in summer were used for planting rice. According to China’s Ministry of Agriculture and Rural Affairs of the People’s Republic of China, the price of rice and the average yield per hectare are published in each season and can be denoted with Pi. To verify the model validation, we obtained the official average price in 2018, i.e., 2.56 RMB/kg, and the average yield per hectare, which was 2347.6667 kg/hectare. Thus, the average production per hectare is 2.56 * 2347.6667 = 6010.0267 RMB/hectare. Since the national standard for affected sown areas includes the sown areas with 10%, 30% and 80% reduced production, according to the bulletin of flood and drought disasters in China (2006–2019), we did a scenario analysis to reflect an average scenario of affected production with the assumption that 40% of the production was reduced due to flood disasters [37]. In other extreme situations, related calculations can be also conducted according to the specific situation. The estimated direct economic losses of the agriculture sector in 31 provinces in 2018 is shown, as follows, in Figure 12.
Further, to estimate the indirect economic losses of floods of other industries related to the agricultural industry, we analyzed the IO model. Although the 42 sectors are integrated and related, in the Input-Output table, they are split into different sectors without overlapping. Considering the analysis method of the input-output relationship from direct and indirect economic losses, we chose the direct economic loss of the directly affected sectors as the final product loss, where ΔY and ΔX − ΔY are defined the same as above. The complete consumption coefficient was introduced to obtain an accurate assessment of the indirect input loss of various sectors. The complete consumption coefficient is the quantity of the products in sector i that need to be consumed directly and indirectly to produce final products per unit of sector j. As defined above, B was used to represent the complete consumption coefficient matrix. Accordingly, B = I A 1 I is the relationship between the complete consumption coefficient and the direct consumption coefficient. Thus, B is obtained by the direct consumption coefficient matrix of each one given by the 42 sectors in the IO table of nationwide provinces in 2017. In this paper, we investigated the most directly hit industry—the agricultural sector—which has an indirect effect on all industries. Here we only demonstrated the top six most affected industries’ complete consumption coefficients of agriculture out of 42 industries, as shown in Table 4. The figure indicates the correlation between other sectors and the agricultural sector, which can be treated as the input for the following calculations.
Based on the above matrix, taking the computation of indirect economic loss of agriculture, forestry, animal husbandry and fishery to other sectors, the total indirect economic loss of the 31 provinces was calculated, as shown in Figure 13. It can be seen that Shandong, Henan, Heilongjiang, and Inner Mongolia, all of which are provinces that are reliant on agriculture, suffered the most indirect economic losses among all provinces, with the predicted indirect economic losses reaching 6235.55 million RMB, 1770.49 million RMB, 2227.45 million RMB, and 1389.13 million RMB, respectively. Thus, to prevent unnecessary economic losses and secondary disasters, these provinces should be given more attention.

4. Conclusions

This paper proposes an effective prediction model consisting of a cutting-edge machine learning regression model and a traditional economic model, i.e., the GBR-IO model. The performance of the GBR-IO model used in the paper is superior to other models because it improves the prediction effectiveness, reduces the issue of overfitting and combines inter-disciplinary methods. The prediction model obtains outstanding results of direct economic losses on datasets in 31 provinces (excluding Hong Kong, Macau, and Taiwan) in China from 2006 to 2018, with a goodness-of-fit of 90%. Based on the predicted direct economic losses, we obtained the indirect economic losses by using the Input-Output model. Compared with previous studies, the GBR-IO model can predict regional direct economic losses and indirect economic losses pre-disaster or at the beginning of a flooding episode with effectiveness and efficiency. Further, the GBR-IO model has a high generalization ability, which can be applied to other countries, especially to those with small datasets at the minimum requirement of 80 pieces.
However, there is still room for improvement of the pre-disaster prediction model. First, as flood forecasting systems and the numerical simulation technology advance in meteorology, the variables used in the model could be estimated more accurately before a disaster happens. Second, the limitation of the datasets results in a failure to categorize floods. If floods are categorized into river floods, flash floods, and drainage problem floods, the accuracy of the model can be further improved. Third, since geographical conditions are not included in the system, global climate models (GCMs) and regional climate models (RCMs) can be further integrated into the system to boost performance. With the above improvements, the model performance can be further enhanced.
According to the prediction model, it can be concluded that positively correlated indicators include reservoir loss, sown area with 10% reduced production, casualties, road disruption, annual anomaly percentage, and daily maximum precipitation while the length of city sewage pipes, reservoir capacity and annual rainy days are negatively correlated with economic losses. From the empirical case based on datasets in China, we can also conclude that from the proportion of direct economic losses to provincial GDP, it is notable that the impact of flooding on the economy is relatively significant. Among the 31 provinces in China, especially Gansu, Inner Mongolia, Shandong, and Heilongjiang, the direct economic losses even approached or exceeded one-thousandth of the province’s GDP.
Thus, some policy implications can be drawn from the results. Since the GBR-IO model has a strong generalization ability, regional flooding databases are encouraged to be established in order to improve the prediction accuracy with more data. Although there is a time lag of reservoir capacity, giving priority to reservoir construction and city drainage capacity can mitigate the economic impact of flooding. Policymakers could also pay more attention to those regions that are heavily reliant on agriculture as they are more vulnerable to flood disasters. Further, if the accuracy of meteorological forecasts can be improved, more effective measures can be taken in advance.

Author Contributions

Conceptualization, A.C. and J.L.; methodology, A.C. and J.L; software, J.L.; validation, A.C. and J.L.; formal analysis, H.L.; investigation, H.L.; resources, A.C. and J.L; data curation, J.L.; writing—original draft preparation, A.C.; writing—review and editing, A.C.; visualization, A.C. and J.L.; supervision, S.Y.; project administration, S.Y. All authors have read and agreed to the published version of the manuscript.

Funding

This research received no external funding.

Institutional Review Board Statement

Not applicable.

Informed Consent Statement

Not applicable.

Data Availability Statement

The Meteorological datasets generated for this study are available from China Meteorological Administration. The socio-economic datasets presented in the study are available at Ministry of Water Resources of the People’s Republic of China, China statistical Yearbook (2006–2018). The Input and Output table of provinces in 2017 is available at the National Bureau of Statistics.

Conflicts of Interest

The authors declare no conflict of interest.

References

  1. Climate Change Widespread, Rapid, and Intensifying—IPCC. Available online: https://public.wmo.int/en/media/press-release/climate-change-widespread-rapid-and-intensifying-%E2%80%93-ipcc (accessed on 26 August 2021).
  2. Huang, X.; Tan, H.; Zhou, J.; Yang, T.; Benjamin, A.; Wen, S.W.; Li, S.; Liu, A.; Li, X.; Fen, S. Flood hazard in Hunan province of China: An economic loss analysis. Nat. Hazards 2008, 47, 65–73. [Google Scholar] [CrossRef]
  3. Wu, X.; Guo, J. A new economic loss assessment system for urban severe rainfall and flooding disasters based on big data fusion. In Economic Impacts and Emergency Management of Disasters in China; Springer: Berlin/Heidelberg, Germany, 2021; pp. 259–287. [Google Scholar]
  4. Wang, D.; Huang, C.; Mai, B. To Facilitate the Advance of Risk Analysis and Crisis Response in China. Environ. Res. 2016, 148, 547–549. [Google Scholar] [CrossRef]
  5. Kreimer, A. Social and economic impacts of natural disasters. Int. Geol. Rev. 2001, 43, 401–405. [Google Scholar] [CrossRef]
  6. Das, S.; Lee, R. A nontraditional methodology for flood stage-damage calculations 1. JAWRA J. Am. Water Resour. Assoc. 1988, 24, 1263–1272. [Google Scholar] [CrossRef]
  7. Krzysztofowicz, R.; Davis, D.R. Category-unit loss functions for flood forecast-response system evaluation. Water Resour. Res. 1983, 19, 1476–1480. [Google Scholar] [CrossRef]
  8. Huabin, W.; Gangjun, L.; Weiya, X.; Gonghui, W. GIS-based landslide hazard assessment: An overview. Prog. Phys. Geogr. 2005, 29, 548–567. [Google Scholar] [CrossRef]
  9. Sanders, B.F.; Schubert, J.E.; Detwiler, R.L. ParBreZo: A parallel, unstructured grid, Godunov-type, shallow-water code for high-resolution flood inundation modeling at the regional scale. Adv. Water Resour. 2010, 33, 1456–1467. [Google Scholar] [CrossRef]
  10. Koç, G.; Natho, S.; Thieken, A.H. Estimating direct economic impacts of severe flood events in Turkey (2015–2020). Int. J. Disaster Risk Reduct. 2021, 58, 102222. [Google Scholar] [CrossRef]
  11. Sun, H.; Wang, J.; Ye, W. A data augmentation-based evaluation system for regional direct economic losses of storm surge disasters. Int. J. Environ. Res. Public Health 2021, 18, 2918. [Google Scholar] [CrossRef]
  12. Chen, T.; Guestrin, C. Xgboost: A scalable tree boosting system. In Proceedings of the 22nd Acm Sigkdd International Conference on Knowledge Discovery and Data Mining, San Francisco, CA, USA, 13–17 August 2016; pp. 785–794. [Google Scholar]
  13. Tian, W.; Wu, J.; Cui, H.; Hu, T. Drought Prediction Based on Feature-Based Transfer Learning and Time Series Imaging. IEEE Access 2021, 9, 101454–101468. [Google Scholar] [CrossRef]
  14. Sagi, O.; Rokach, L. Ensemble learning: A survey. Wiley Interdiscip. Rev. Data Min. Knowl. Discov. 2018, 8, e1249. [Google Scholar] [CrossRef]
  15. Li, J.; Crawford-Brown, D.; Syddall, M.; Guan, D. Modeling imbalanced economic recovery following a natural disaster using input-output analysis. Risk Anal. 2013, 33, 1908–1923. [Google Scholar] [CrossRef] [PubMed]
  16. Narayan, P.K. Macroeconomic impact of natural disasters on a small island economy: Evidence from a CGE model. Appl. Econ. Lett. 2003, 10, 721–723. [Google Scholar] [CrossRef]
  17. Rose, A. Input-output economics and computable general equilibrium models. Struct. Chang. Econ. Dyn. 1995, 6, 295–304. [Google Scholar] [CrossRef]
  18. You, S.; Wang, H.; Zhang, M.; Song, H.; Xu, X.; Lai, Y. Assessment of monthly economic losses in Wuhan under the lockdown against COVID-19. Humanit. Soc. Sci. Commun. 2020, 7, 1–12. [Google Scholar] [CrossRef]
  19. Organisation, W.M. Heavy Rains and Flooding Hit Large Parts of Asia. Available online: https://public.wmo.int/en/media/news/heavy-rains-and-flooding-hit-large-parts-of-asia (accessed on 18 September 2021).
  20. Dutta, D.; Herath, S. Trend of floods in Asia and flood risk management with integrated river basin approach. In Proceedings of the 2nd international conference of Asia-Pacific hydrology and water resources Association, Singapore, 5–9 June 2004; pp. 55–63. [Google Scholar]
  21. Death Toll from Floods in China's Henan Province Rises to 302. Available online: https://www.reuters.com/world/china/death-toll-flooding-chinas-henan-province-rises-302-2021-08-02/ (accessed on 30 August 2021).
  22. The Input and Output Table with 42 Sectors. 2017. Available online: https://data.stats.gov.cn/ifnormal.htm?u=/files/html/quickSearch/trcc/trcc01.html&h=740 (accessed on 18 September 2021).
  23. Elith, J.; Leathwick, J.R.; Hastie, T. A working guide to boosted regression trees. J. Anim. Ecol. 2008, 77, 802–813. [Google Scholar] [CrossRef]
  24. Friedman, J.H. Greedy function approximation: A gradient boosting machine. Ann. Stat. 2001, 29, 1189–1232. [Google Scholar] [CrossRef]
  25. Mason, L.; Baxter, J.; Bartlett, P.; Frean, M. Boosting algorithms as gradient descent in function space. Proc. NIPS 1999, 12, 512–518. [Google Scholar]
  26. Breiman, L.; Friedman, J.H.; Olshen, R.A.; Stone, C.J. Classification and Regression Trees; Routledge: Oxfordshire, UK, 2017. [Google Scholar]
  27. Prasad, A.M.; Iverson, L.R.; Liaw, A. Newer classification and regression tree techniques: Bagging and random forests for ecological prediction. Ecosystems 2006, 9, 181–199. [Google Scholar] [CrossRef]
  28. Ding, C.; Wu, X.; Yu, G.; Wang, Y. A gradient boosting logit model to investigate driver’s stop-or-run behavior at signalized intersections using high-resolution traffic data. Transp. Res. Part C Emerg. Technol. 2016, 72, 225–238. [Google Scholar] [CrossRef]
  29. Li, H.; Sun, J.; Wu, J. Predicting business failure using classification and regression tree: An empirical comparison with popular classical statistical methods and top classification mining methods. Expert Syst. Appl. 2010, 37, 5895–5904. [Google Scholar] [CrossRef]
  30. Sun, R.; Gong, Z.; Gao, G.; Shah, A.A. Comparative analysis of Multi-Criteria Decision-Making methods for flood disaster risk in the Yangtze River Delta. Int. J. Disaster Risk Reduct. 2020, 51, 101768. [Google Scholar] [CrossRef]
  31. Doan, T.; Kalita, J. Selecting machine learning algorithms using regression models. In Proceedings of the 2015 IEEE International Conference on Data Mining Workshop (ICDMW), Atlantic City, NJ, USA, 14–17 November 2015; pp. 1498–1505. [Google Scholar]
  32. Halko, N.; Martinsson, P.-G.; Tropp, J.A. Finding structure with randomness: Probabilistic algorithms for constructing approximate matrix decompositions. SIAM Rev. 2011, 53, 217–288. [Google Scholar] [CrossRef]
  33. Perlich, C.; Provost, F.; Simonoff, J. Tree Induction vs. Logistic Regression: A learning-Curve Analysis. J. Mach. Learn. Res. 2003, 4, 211–255. [Google Scholar]
  34. China Flooding Causes Worst Death Toll in Decade. Available online: https://www.theguardian.com/world/2010/jul/21/china-flooding-worst-decade (accessed on 18 September 2021).
  35. China's Historic Floods Are among the Earth's Most Costly Weather-Related Disasters. Available online: https://www.climatesignals.org/events/china-floods-june-july-2016 (accessed on 19 September 2021).
  36. Wang, H.; Wang, Z.; Dong, Y.; Chang, R.; Xu, C.; Yu, X.; Zhang, S.; Tsamlag, L.; Shang, M.; Huang, J. Phase-adjusted estimation of the number of coronavirus disease 2019 cases in Wuhan, China. Cell Discov. 2020, 6, 1–8. [Google Scholar] [CrossRef] [Green Version]
  37. Bulletin of Flood and Drought Disasters in China (2006–2019). Available online: http://www.mwr.gov.cn/sj/tjgb/zgshzhgb/ (accessed on 19 September 2021).
Figure 1. Training Process of Gradient Boosting.
Atmosphere 12 01448 g001
Figure 2. The flowchart of model comparison.
Atmosphere 12 01448 g002
Figure 3. Prediction system process.
Atmosphere 12 01448 g003
Figure 4. Features of importance, measured with the F score.
Atmosphere 12 01448 g004
Figure 5. Heat map of the correlation coefficient between features and the model.
Atmosphere 12 01448 g005
Figure 6. PCA screen plot.
Atmosphere 12 01448 g006
Figure 7. Cross validation of machine learning models.
Atmosphere 12 01448 g007
Figure 8. Learning curve of GBR model.
Atmosphere 12 01448 g008
Figure 9. The fitting and prediction result of compared models.
Atmosphere 12 01448 g009
Figure 10. Direct economic losses (billion RMB).
Atmosphere 12 01448 g010
Figure 11. Predicted direct economic loss versus true value in 2018.
Atmosphere 12 01448 g011
Figure 12. Direct economic losses of agriculture sector in 2018.
Atmosphere 12 01448 g012
Figure 13. Indirect economic losses (million RMB).
Atmosphere 12 01448 g013
Table 1. Floods disasters direct economic loss prediction index system.
CriteriaIndicatorsVariables
Disaster-inducing factorsYearX1
Daily Maximum PrecipitationX2
Precipitation Anomaly PercentageX3
Precipitation Anomaly Percentage in SpringX4
Precipitation Anomaly Percentage in SummerX5
Precipitation Anomaly Percentage in AutumnX6
Precipitation DaysX7
Moderate Rainy DaysX8
Heavy Rainy DaysX9
Torrential Rainy DaysX10
Maximum Continuous PrecipitationX11
Maximum Annual RainfallX12
Maximum Annual Continuous Rainy DaysX13
Disaster-affected bodiesCasualtiesX14
Death TollX15
Sown Area with 10% Reduced ProductionX16
Sown Area with 30% reduced productionX17
Sown Area with 80% reduced productionX18
Railway DisruptionX19
Road DisruptionX20
Reservoir LossX21
ProvinceX22
Disaster Prevention CapabilitiesNumber of ReservoirsX19
Capacity of ReservoirsX20
Area with Flood Prevention MeasuresX21
Areas with Soil Erosion under ControlX22
City Sewage Pipes LengthX23
Table 2. Regression metrics.
RMSEMAEEVR2
Bayesian Ridge32.8024.610.860.84
Linear Regression36.6628.970.840.80
Elastic Net34.0326.060.850.82
XGB31.7618.640.850.85
GBR25.5716.490.900.90
Table 3. Predicted direct economic losses.
ProvincePredicted Direct
Economic Losses
(PDEL, billion RMB)
PDEL/
Provincial GDP
(‰)
ProvincePredicted Direct
Economic Losses
(PDEL, billion RMB)
PDEL/
Provincial GDP
(‰)
Beijing3.840.02Hubei2.230.15
Tianjin0.20.05Hunan0.640.05
Hebei1.280.14Guangdong32.550.11
Shanxi0.160.04Guangxi3.920.32
Inner Mongolia5.770.86Hainan0.640.23
Liaoning2.710.42Chongqing3.790.03
Jilin6.770.3Sichuan32.070.22
Heilongjiang5.081.73Guizhou4.140.08
Shanghai7.080.02Yunnan4.420.11
Jiangsu3.980.08Xizang3.680.16
Zhejiang2.080.04Shaanxi3.70.06
Anhui4.630.39Gansu10.150.75
Fujian2.320.07Qinghai2.250.17
Jiangxi3.810.42Ningxia0.880.12
Shandong20.040.94Xinjiang1.150.06
Henan3.10.35
Table 4. Matrix of cumulative input coefficients of agriculture, forestry, animal husbandry and fishery sectors to other sectors.
SectorAgriculture Forestry
Animal Husbandry and Fishery
Food and Tobacco ProcessingManufacture of Chemical ProductsSmelting and Processing of MetalsRepair of Metal Products, Machinery and EquipmentWholesale and Retail TradesReal Estate
Province
Beijing0.280.280.230.130.180.110.22
Tianjin0.240.260.200.060.060.140.07
Hebei0.190.190.110.020.050.060.02
Shanxi0.160.060.200.030.040.040.01
Inner Mongolia0.220.120.130.020.040.090.03
Liaoning0.330.180.210.040.050.050.02
Jilin0.300.180.150.050.030.060.04
Heilongjiang0.320.100.130.010.030.050.02
Shanghai0.240.210.250.040.060.140.10
Jiangsu0.200.130.190.040.040.060.03
Zhejiang0.090.110.220.030.080.070.02
Anhui0.230.160.180.040.040.050.04
Fujian0.030.020.220.000.030.000.01
Jiangxi0.040.020.350.000.020.020.02
Shandong0.030.060.210.050.110.180.05
Henan0.030.010.290.030.050.060.02
Hubei0.020.010.080.070.040.050.02
Hunan0.220.180.170.020.040.040.02
Guangdong0.210.260.130.040.050.040.02
Guangxi0.020.000.090.000.010.000.01
Hainan0.100.120.200.010.020.100.05
Chongqing0.090.090.100.020.050.040.03
Sichuan0.220.140.200.020.020.040.02
Guizhou0.200.040.160.020.050.080.01
Yunnan0.210.070.150.020.040.040.03
Xizang0.250.170.150.010.030.050.02
Shaanxi0.170.110.210.040.030.050.03
Gansu0.190.060.170.020.060.060.02
Qinghai0.160.140.140.020.070.050.01
Ningxia0.200.140.190.020.090.090.03
Xinjiang0.270.090.290.010.030.070.01
Publisher’s Note: MDPI stays neutral with regard to jurisdictional claims in published maps and institutional affiliations.

