Article

Observational Practices for Urban Microclimates Using Meteorologically Instrumented Unmanned Aircraft Systems

1
College of Aviation, Embry-Riddle Aeronautical University, Daytona Beach, FL 32114, USA
2
Gaetz Aerospace Institute, Embry-Riddle Aeronautical University, Daytona Beach, FL 32114, USA
3
Aerospace Engineering Department, Mississippi State University, Starkville, MS 39762, USA
4
Physical Sciences Department, Embry-Riddle Aeronautical University, Daytona Beach, FL 32114, USA
*
Author to whom correspondence should be addressed.
Atmosphere 2020, 11(9), 1008; https://doi.org/10.3390/atmos11091008
Submission received: 23 August 2020 / Revised: 16 September 2020 / Accepted: 18 September 2020 / Published: 21 September 2020
(This article belongs to the Special Issue Interaction between Urban Microclimates and the Buildings)

Abstract

:
The urban boundary layer (UBL) is one of the most important and least understood atmospheric domains and, consequently, warrants deep understanding and rigorous analysis via sophisticated experimental and numerical tools. When field experiments have been undertaken, they have primarily been accomplished with either a coarse network of in-situ sensors or slow response sensors based on timing or Doppler shifts, resulting in low resolution and decreasing performance with height. Small unmanned aircraft systems (UASs) offer an opportunity to improve on traditional UBL observational strategies that may require substantive infrastructure or prove impractical in a vibrant city, prohibitively expensive, or coarse in resolution. Multirotor UASs are compact, have the ability to take-off and land vertically, hover for long periods of time, and maneuver easily in all three spatial dimensions, making them advantageous for probing an obstacle-laden environment. Fixed-wing UASs offer an opportunity to cover vast horizontal and vertical distances, at low altitudes, in a continuous manner with high spatial resolution. Hence, fixed-wing UASs are advantageous for observing the roughness sublayer above the highest building height where traditional manned aircraft cannot safely fly. This work presents a methodology for UBL investigations using meteorologically instrumented UASs and discusses lessons learned and best practices garnered from a proof of concept field campaign that focused on the urban canopy layer and roughness sublayer of a large modern city with a high-rise urban canopy.

1. Introduction

The urban boundary layer (UBL), the portion of the atmospheric boundary layer (ABL) whose climatic characteristics are modified by the presence of a city [1], is one of the most complex and least understood microclimates for several reasons: (1) the urban environment consists of heterogeneous buildings that interact with atmospheric flow; (2) the generation of turbulent eddies and a general reduction in wind speed within the canopy and above the rooftop level [2]; (3) the varying physical (e.g., albedo, thickness, evaporation efficiency) and thermodynamic properties (e.g., heat capacity, thermal conductivity, emissivity) of the artificial materials that compose the urban surface relative to the substantially different properties of natural surfaces that exist in rural areas [3]; (4) the complex processes of shadowing and the multiple reflections that affect short-wave radiation fluxes; (5) the wide-range of materials that affect the emissivity and thus long-wave fluxes; (6) the anthropogenic heat sources that act in addition to the solar-driven energy balance.
Progress toward comprehensively understanding and quantifying the structure of the UBL has been stymied by difficulties associated with measuring relevant three-dimensional meteorological parameters, such as wind speed, temperature, humidity, and turbulence statistics. Extensive reviews of boundary layer flow inside or above urban canopies are provided by [2,4,5,6,7,8,9]. Many previous studies have investigated coherent structures and their effect on turbulent flows and transport over urban canopies [10,11,12,13,14,15,16,17,18,19]. Measurements performed in proximity to the roof level showed the highest levels of turbulence intensity, while at the street level turbulence intensity tended to depend on the location within the canyon and the immediate surroundings. Long-term atmospheric studies in urban environments are increasingly available, thus allowing for seasonal variations in the diurnal evolution of the urban boundary layer to be evaluated [20,21,22,23,24,25,26,27]. Other observations have been conducted in wind tunnel experiments, targeting various more or less complex geometries, such as arrays of cubes [28,29,30], or more realistic representations of city neighborhoods [31,32,33].
Urban morphology, accounting for structures of varying sizes and shapes, significantly affects the transport of scalars and the urban surface energy balance. For example, morphology substantially influences thermal stratification and the humidity budget, both of which can increase pollutant concentration and decrease air quality within the urban canopy. Results from field observations, experimental measurements and numerical simulations have shown the importance of atmospheric stability on the urban climate. Numerical simulation investigations, for example, have revealed the impact of thermal stability on the urban heat island (UHI) [34], characteristics of the roughness sublayer (RSL) [9] and pollutant dispersion within the urban canopy layer (UCL) [35,36,37]. Further, several wind tunnel experiments have shown the effect of local stability on the turbulent structures within the UCL [38,39].
The ability to obtain high-quality atmospheric measurements in complex environments and over extensive spatial and temporal domains with high spatial and temporal resolution is needed in the UBL to better understand its dynamics and thermodynamics. It is impractical and unsafe, for a myriad of reasons, for conventional manned aircraft to operate within the UBL. While meteorological towers can be erected here, and are able to provide high temporal resolution and accuracy, they require substantial effort to erect, cannot provide high spatial resolution and have practical height limitations that are well below the vertical extent of the UBL. Tethered balloons can only offer skewed single column measurements and similar nontethered options cannot be precisely controlled. Surface-based remote sensing solutions also possess altitude limitations and decreasing resolution with height. Increasingly, the proliferation of crowdsourced weather data from Internet of Things (IoT) objects and social sources (see Zhu et al. [40] for a recent comprehensive review and Muller et al. [41] for an excellent summary of early crowdsourcing efforts prior to 2014) have moved us toward the possibility of higher spatial resolution and semipersistent urban meteorological observation networks. However, these embedded sensors and social sources still face challenges and do not extend into the RSL. Consequently, they do not fill this observational void. As a result of these limitations, none of the aforementioned observational strategies offer comprehensive insight into the horizontal inhomogeneity of the UBL or a complete description of its vertical extent. However, a small unmanned aircraft system (UAS), colloquially referred to as a drone, has the ability to fill this important observational gap by hosting a suite of instruments for UBL investigation. Further, a UAS can be precisely controlled to provide continuous measurements both horizontally and vertically with high spatial and temporal resolution, along with accessing vast heights (including the vertical extent of the UBL) and horizontal distances conveniently and cost effectively.
It is estimated that more than 55% of the world’s population live in urban areas today; this proportion is expected to jump to almost 70% by 2050 [42]. Presently, in North America, the population in urban areas is estimated at 82% [43]. Therefore, the UBL is an important environment that sustains the activities of the majority of the world population and, consequently, warrants deep understanding and rigorous analysis via sophisticated experimental and numerical tools. This paper presents a methodology for UBL investigations using a mixed fleet of fixed-wing and multirotor meteorologically instrumented UASs undertaking concurrent observations. Further, it puts forth lessons learned and best practices garnered from a proof of concept field campaign that focused on the UCL and RSL of a large modern city with a high-rise urban canopy.

2. Unmanned Aircraft Systems as Observational Tools

In recent years, the use of UASs in a variety of scientific disciplines, including the atmospheric sciences, has grown and they now hold promise for novel UBL investigations. UASs afford the ability to fill an important atmospheric observational gap, namely observations in the domain between the reach of ground-based sensors and the altitudes that manned aircraft can safely operate at. In contrast to other observation options for this intermediate domain, such as radiosondes and tethered balloons, UASs can spend more time in the area of interest and be more precisely controlled. Even continuously recording tethered balloon options offer, at best, skewed single column analysis and some level of spatial inflexibility. Further, the elements that compose an urban environment create additional challenges for observation not present in general ABL investigations. However, the combined use of fixed-wing and multirotor UASs can be employed to forge a new measurement strategy in the UBL that is reusable, durable, repeatable, has a much lower cost barrier, requires minimal infrastructure, and renders superior spatial flexibility, range, and resolution. These attributes enable new insight within and over the complicated geometries of an urban environment.
Atmospheric observations using remote-controlled aircraft took place as early as 1970 [44]. More recently, UASs have demonstrated the ability to acquire a wide range of atmospheric data using a variety of instruments. Solid-state temperature, pressure, and humidity sensors have been hosted on UASs. Successful investigations have entailed a variety of ABL observation objectives, such as the characterization of the vertical structure of the ABL [45,46], the near surface meteorology of the Arctic and Antarctic regions [47,48,49,50], the marine boundary layer [51,52,53], surface fluxes [54,55,56], convective initiation [57], hurricanes [58], changes to a wind turbine array boundary layer [59,60], evaluation and enhancement of ABL parameterizations for numerical weather prediction (NWP) [61,62], and the monitoring of trace gases and aerosols [63,64], among others. Analogously, UASs have also been used to successfully undertake kinematic atmospheric measurements, commonly measurements of the mean wind [63,65,66,67] and its fluctuating component, i.e., turbulence [68,69,70]. Due to existing regulations that stymie many urban UAS operations, studies involving the deployment of UASs for UBL investigation are scarce and those that do exist are typically constrained to vertical ascents and descents over a single fixed location [71] or one position for urban air pollution monitoring [72,73,74,75].
Multirotor UASs are utilized for their ability to launch and recover in small spaces, maneuverability, ability to operate at low speeds, including hover, and flexibility in obtaining measurements in either a continuous manner or along a discontinuous trajectory at deliberately chosen points of interest. The ability to hover and fly a discontinuous trajectory allows the investigation of obstacle-laden environments, such as the urban environment, while making spatially dense observations. This capability also ensures that the response time of any given sensor can be respected. Further, flight testing has demonstrated that multirotor UASs are less susceptible to turbulence than fixed-wing UASs and that, when turbulence levels do increase, piloting difficulty scales less with multirotor than fixed-wing UASs [76,77]. Besides being conducive to exploring an obstacle-laden environment, multirotor UASs are well suited to accomplishing vertical profiles in a controlled manner at a specified vertical spatial resolution.
Fixed-wing UASs offer an opportunity to cover vast horizontal and vertical distances, at low altitudes, in a continuous manner with high spatial resolution. Thus, fixed-wing UASs can cover large swaths of the UBL. However, the fixed-wing aircraft’s flight path must be largely free of obstacles. This capability makes fixed-wing UASs better suited to accomplishing spatial averaging, opposed to point measurements, while still offering the resolution, with fast response sensors, to identify gradients. Collectively, fixed-wing UASs may be used for a broader characterization of an area thus enabling, if desired, multirotor UASs to hone in on identified areas of interest for more persistent monitoring. The increased efficiency of fixed-wing aircraft, afforded through the generation of lift and realized through increased endurance, provides the time required for a broad characterization of an area and identification of particular areas of interest. Following this, the decreased endurance of a multirotor can be fully exploited for a more targeted mission. However, while fixed-wing UASs generally have an increased endurance and can certainly change altitude, even accomplishing a quasi-vertical profile while undertaking a helical vertical ascent or descent, multirotor UASs have the ability to provide a truer vertical profile in a narrower column with increased temporal resolution.
Multiple studies have demonstrated that in-situ measurements of atmospheric thermodynamic parameters via a UAS are indistinguishable in accuracy relative to ground-based remote sensing techniques and traditional in-situ aerial measurements [49,50,51,78]. Several researchers have also demonstrated the ability to acquire kinematic observations via unmanned aircraft. While a direct measurement strategy can be undertaken using purposely mounted anemometers or multihole pressure probes, other researchers have exploited an indirect strategy. These indirect strategies have derived wind velocity by measuring pitch, roll, and yaw angles, differential motor speeds, or by making a comparison of GNSS (Global Navigation Satellite System) and Inertial Navigation System (INS) information [63,79,80,81,82]. While this indirect wind sensing strategy provides the advantage of not requiring the integration of additional sensors, the mass, and therefore inertia, of the aircraft prevents the fast response measurement of the wind using this technique. Oftentimes, observations of the fluctuating component of the wind are required to completely characterize the dynamic urban environment. However, if only a mean measurement is desired, this technique does offer the aforementioned advantage.
Assuming the proper functioning and calibration of a given sensor, the most prominent concern for a UAS-hosted sensor is installed sensor performance and ensuring that the measured environment is representative of the ambient atmosphere. Most often for small UASs, where only a limited amount of real estate is available for sensor mounting, the location and dimensions of the rotor-induced flow field are central to this consideration. For the measurement of scalar parameters, the rotor-induced flow field may provide for robust aspiration. While potentially advantageous, if the rotor flow is bringing air past the sensor from a portion of the atmosphere significantly above or below the aircraft, this must be taken into account when associating the observation with a measurement height. Especially for sensor placement within close proximity to a motor or rotor, the effect of heat radiated from a motor or changes to air temperature or pressure brought about by the rotor must also be considered. Even with sufficient distance from these items, proper shielding, per best meteorological practices, should be undertaken, especially for temperature sensors. The challenges presented by the rotor-induced flow field become much more complex for the measurement of wind. Here, the dimensions of the induced flow field must be ascertained directly by visualization (such as through the use of smoke) or modeling, or inferred from trial and error. Anemometers, or other analogous sensors, must be placed well outside of this zone. Nonetheless, the measurement will ultimately need to be verified against a reference standard. While this final validation must be accomplished in flight, preliminary verification can be accomplished, with the aircraft secured and in a controlled environment, through a rotors on and off test. Such a test verifies that no measurement difference exists between the two different states. Any such test that involves securing the aircraft, however, must ensure that the aircraft is positioned in a manner where it does not experience the influence of ground effect (recirculating flow). An additional means to verify that the measured fluctuating component of the wind, i.e., turbulence, is the result of the environment and not the rotor-induced flow field is through spectral analysis methods.

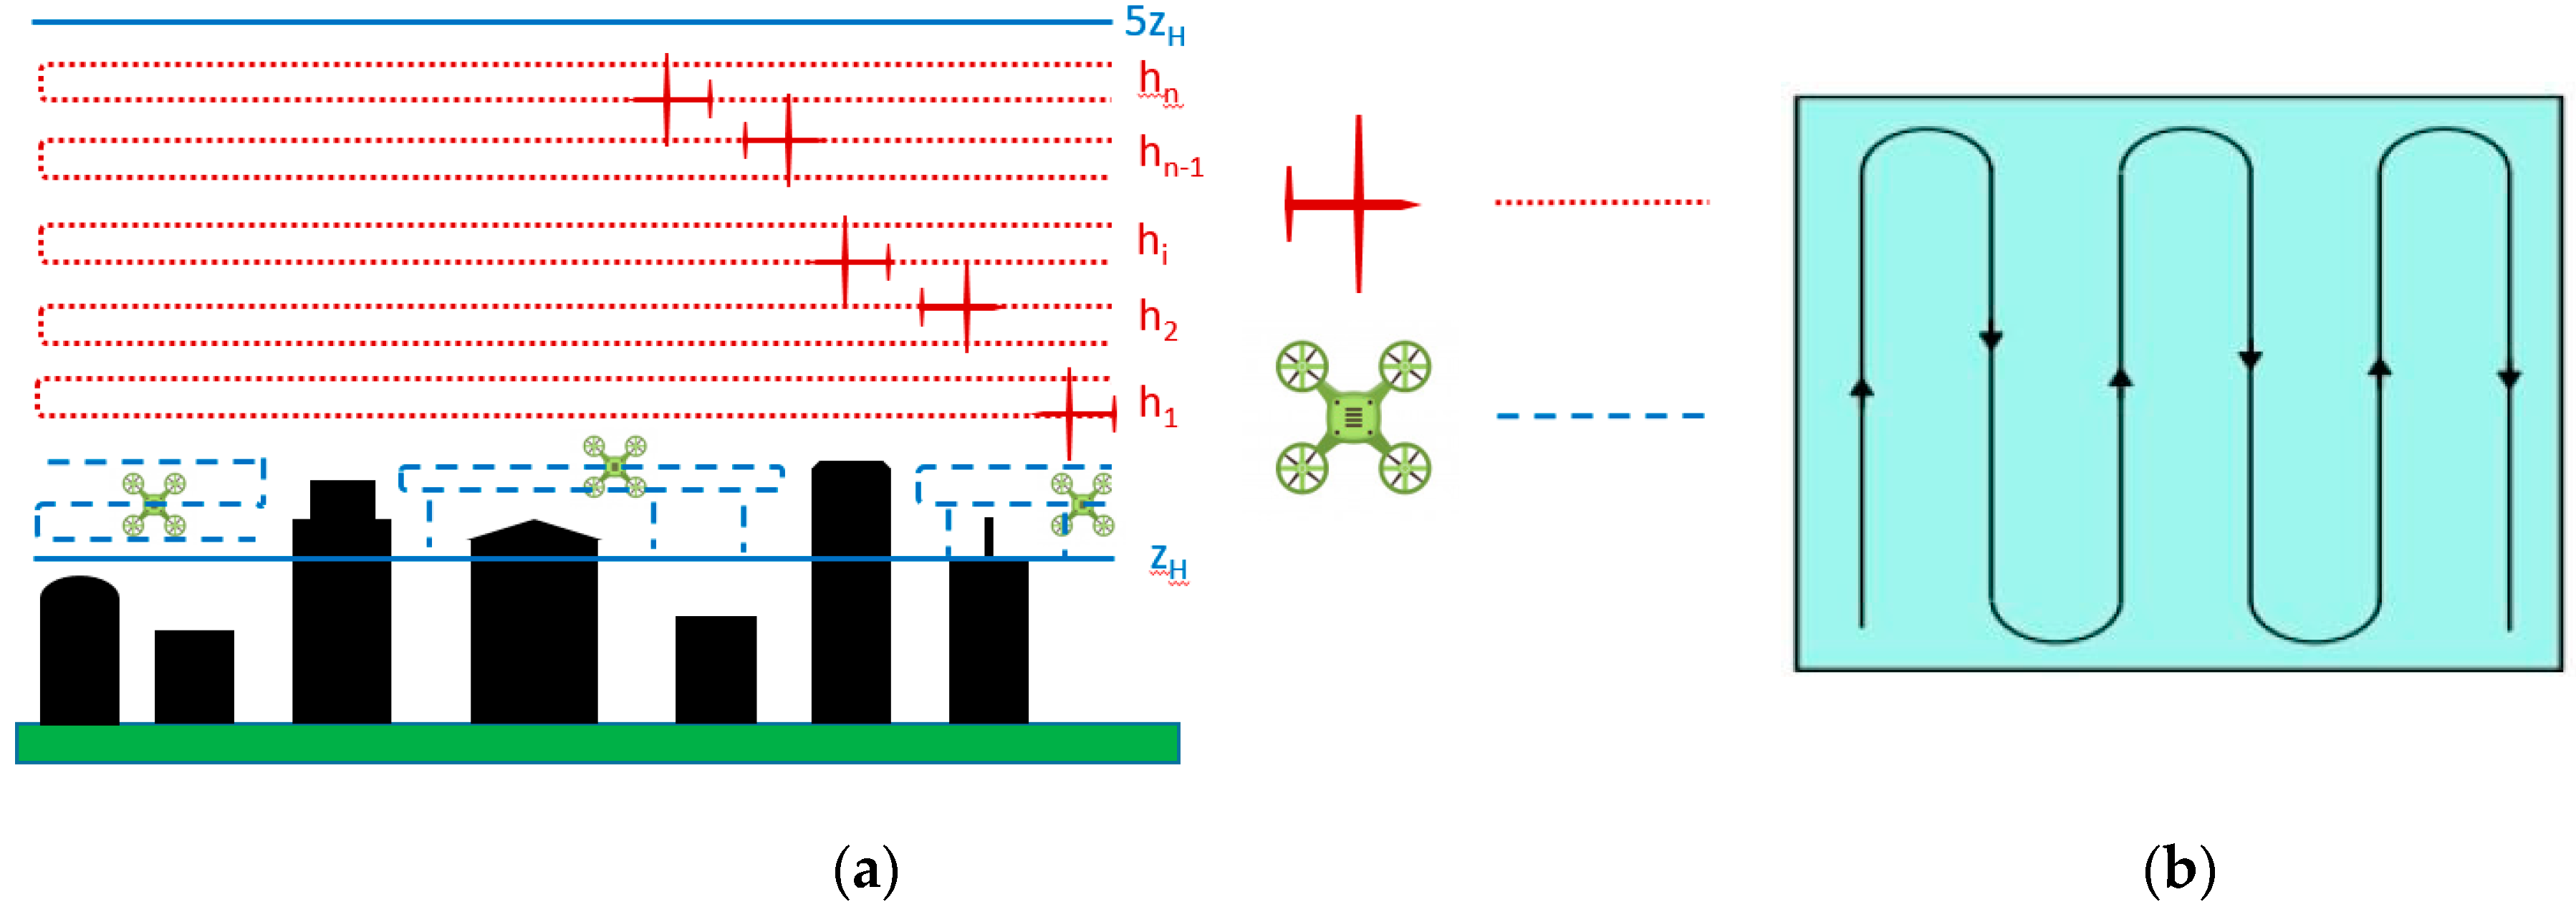
3. Concept of Operations

To ensure that meaningful observations are obtained that maximize the value of a campaign and enable broad comparability and transferability of the results, a thoughtful experimental design must be undertaken. With the spatial variability brought about by roughness elements, such as buildings, homogenized in the inertial sublayer (ISL), investigation of the interaction between urban microclimates and buildings is reserved for the UCL and RSL. Since flow in these domains respond to individual roughness elements, consequently, so do atmospheric properties such as temperature and humidity that are carried by turbulent transport. This creates a multitude of microclimates that vary in both the horizontal and vertical directions. This challenge has stymied analysis of this domain despite the crucial role it plays as an interface between the surface and atmosphere, along with being a domain both highly influenced by and affecting human activity. Hence, a complete four-dimensional representation of this portion of the surface layer is required.
An urban canopy is characterized by an assortment of buildings and surfaces that may bring about an increase or decrease in mean winds, localized pockets of accelerated flow, the enhancement or diminishment of turbulence, or any combination thereof. The nature of the UCL at any given location is primarily determined by the impermeable structures in the vicinity and the thermal attributes of neighboring surfaces. While a fleet of UASs can provide a multitude of platforms for the hosting of sensors, a complete three-dimensional representation of the flow, or other atmospheric properties carried by turbulent transport, around a large building is still, more than likely, implausible due to the vast amount of real estate that requires coverage and the dedicated time that must be allocated to any one measurement position due to the temporal variability of turbulence. However, UASs afford significant advantages in probing smaller microclimates around buildings where the physical scale of the challenge is reduced and therefore more persistent monitoring is feasible. The aforementioned advantages come in the form of cost savings, reduced infrastructure requirements, accessibility and convenience, amongst others. Microclimates that may be of specific interest are areas adjacent to building facades, active surfaces at discrete levels, roof level shear zones and urban canyons. In such scenarios, canvassing the area of interest in a grid-like manner, with instrumented UASs undertaking persistent observation at grid nodes, may be considered. Depending on the availability of resources, this can concurrently be undertaken at multiple streamwise positions. The nature of this strategy that requires persistent static observation, along with the obstacle-laden character of the UCL, make multirotor UASs the optimal choice for observations in the UCL. In an analogous manner to the use of instrumented ground vehicles, such as cars and bicycles [83,84], in the past, multirotor UASs also enable the ability to characterize patterns within zones of sharp spatial gradients or provide a broad overview of the variety of microclimates aloft. Each of these strategies are now free of the constraints previously associated with road infrastructure. To aid in the transferability and comparability of the data, the simultaneous observation of the freestream velocity should be recorded during the implementation of all of the aforementioned strategies.
Similar to the UCL, flow in the RSL responds to individual roughness elements within the urban canopy. With the resulting variety of microclimates that this creates, this inhomogeneous layer presents analogous challenges to those found in the UCL. However, unlike the UCL, the complementary use of multirotor and fixed-wing UASs can facilitate the implementation of a widespread horizontal averaging strategy that enables a simplification of the complex RSL without a corresponding loss of rigor.
An overarching UAS observation strategy to build a more complete 3D picture of the RSL is one that undertakes concurrent measurements at different averaging levels with a multitude of varied but specialized UASs (Figure 1a). A multitude of fixed-wing unmanned aircrafts (UAs) can each be assigned to a distinct altitude band (dotted lines in Figure 1a). To ensure, prior to analysis, that the entirety of the RSL is captured concurrently, the entire surface layer (SL) from the mean building height, zH, to 5 zH is divided and concurrently flown. With the blending height typically varying from 1.5 zH over densely built homogeneous sites to 4 zH over sparsely built-up areas with isolated roughness elements [85] this coverage will ensure the entirety of the RSL is considered and simultaneously observed. Where level flight segments are not practical near the top of the UCL due to a nonhomogeneous roof level, multirotor UAs can be employed to fill in these horizontal noncontinuous segments in the upper portion of the UCL. (dashed lines in Figure 1a). Concurrent measurement anywhere in the SL will require bringing numerous datasets together into one actionable dataset. Data timestamps can be used for this purpose. Similarly structuring how data are locally written or telemetered across all platforms aids greatly in the readability and utility of the time-merged data.
While urban surfaces are often noted as being heterogeneous, frequently, computational fluid dynamics (CFD) simulations and wind tunnel investigations do not afford the ability to reflect this; field campaigns have often not considered or reported this nor had the instrumentation to adequately cover and make distinct homogeneous regions within the broader heterogeneity. This conflation neglects the important role that the underlying surface plays in the vertical structure of the UBL, introduces extraneous signals, and contributes to the challenge of comparing and transferring results. Therefore, the abovementioned concurrently flown level flight segments should be laterally constrained to distinct local climate zones (LCZs) [86]. At each discrete altitude flown within a LCZ, a given UA undertakes a lawn mower pattern, as depicted in Figure 1b. In order for the aforementioned parsing to be valid, the horizontal dimensions of the lawn mower pattern must be carefully chosen. In addition to the purposeful selection of the flight leg dimensions, the placement of these flight legs must be chosen with an appropriate fetch from the windward boundary of the LCZ in order to exclude the influence of transition zones between adjacent LCZs, minimize the effect of advection from neighboring LCZs, and to ensure that flight activities will take place within the internal boundary layer (IBL) associated with the underlying surface of interest. This horizontal averaging approach overcomes the challenges presented by the inhomogeneity of the RSL while still respecting the role of inhomogeneity at the surface.
The observations over the entirety of the flight legs at a given level can be spatially averaged, creating a series of vertically stacked horizontally averaged layers within a distinct LCZ. This results in the simplification of the RSL to one effective dimension, the vertical, and, in effect, realizes horizontal homogeneity within the LCZ at a given level. The division of the RSL above the given LCZ into a multitude of layers enables a vertical profile for any parameter of interest to emerge. Consequently, this strategy provides access to in-situ observations of the RSL in a broader manner, more appropriate for the RSL, that are superior to point measurements or single column analysis.
Accompanying surface-based atmospheric measurements should be considered in conjunction with all UA observations. Each weather station should be placed well away from anomalous structures and within a reasonably homogeneous and representative portion of the LCZ of interest. Besides characterizing the surface, such measurements can serve as a reference for the multitude of UA observations, a link between observations being simultaneously undertaken in both the UCL and RSL, and for safely launching and recovering the UA.
Since urban regions possess a high degree of complexity in all dimensions, each of the LCZs investigated must be carefully and completely characterized by accompanying urban metadata. Given the vertical nature of the UAS observations, this third dimension must be given greater attention with its attributes noted and recorded. These attributes include building dimensions, roof geometries, vegetation types, surface fabric and cover, and traffic levels, along with noting similar features within adjacent LCZs. Of course, accompanying synoptic, mesoscale and local conditions, including observations such as cloud cover, should be accurately documented not only as accompanying metadata but during preflight activities for the safety of flight considerations. Again, such diligence will contribute not only to the safety of the operation but to the broad comparability and transferability of the work.

4. Field Campaign

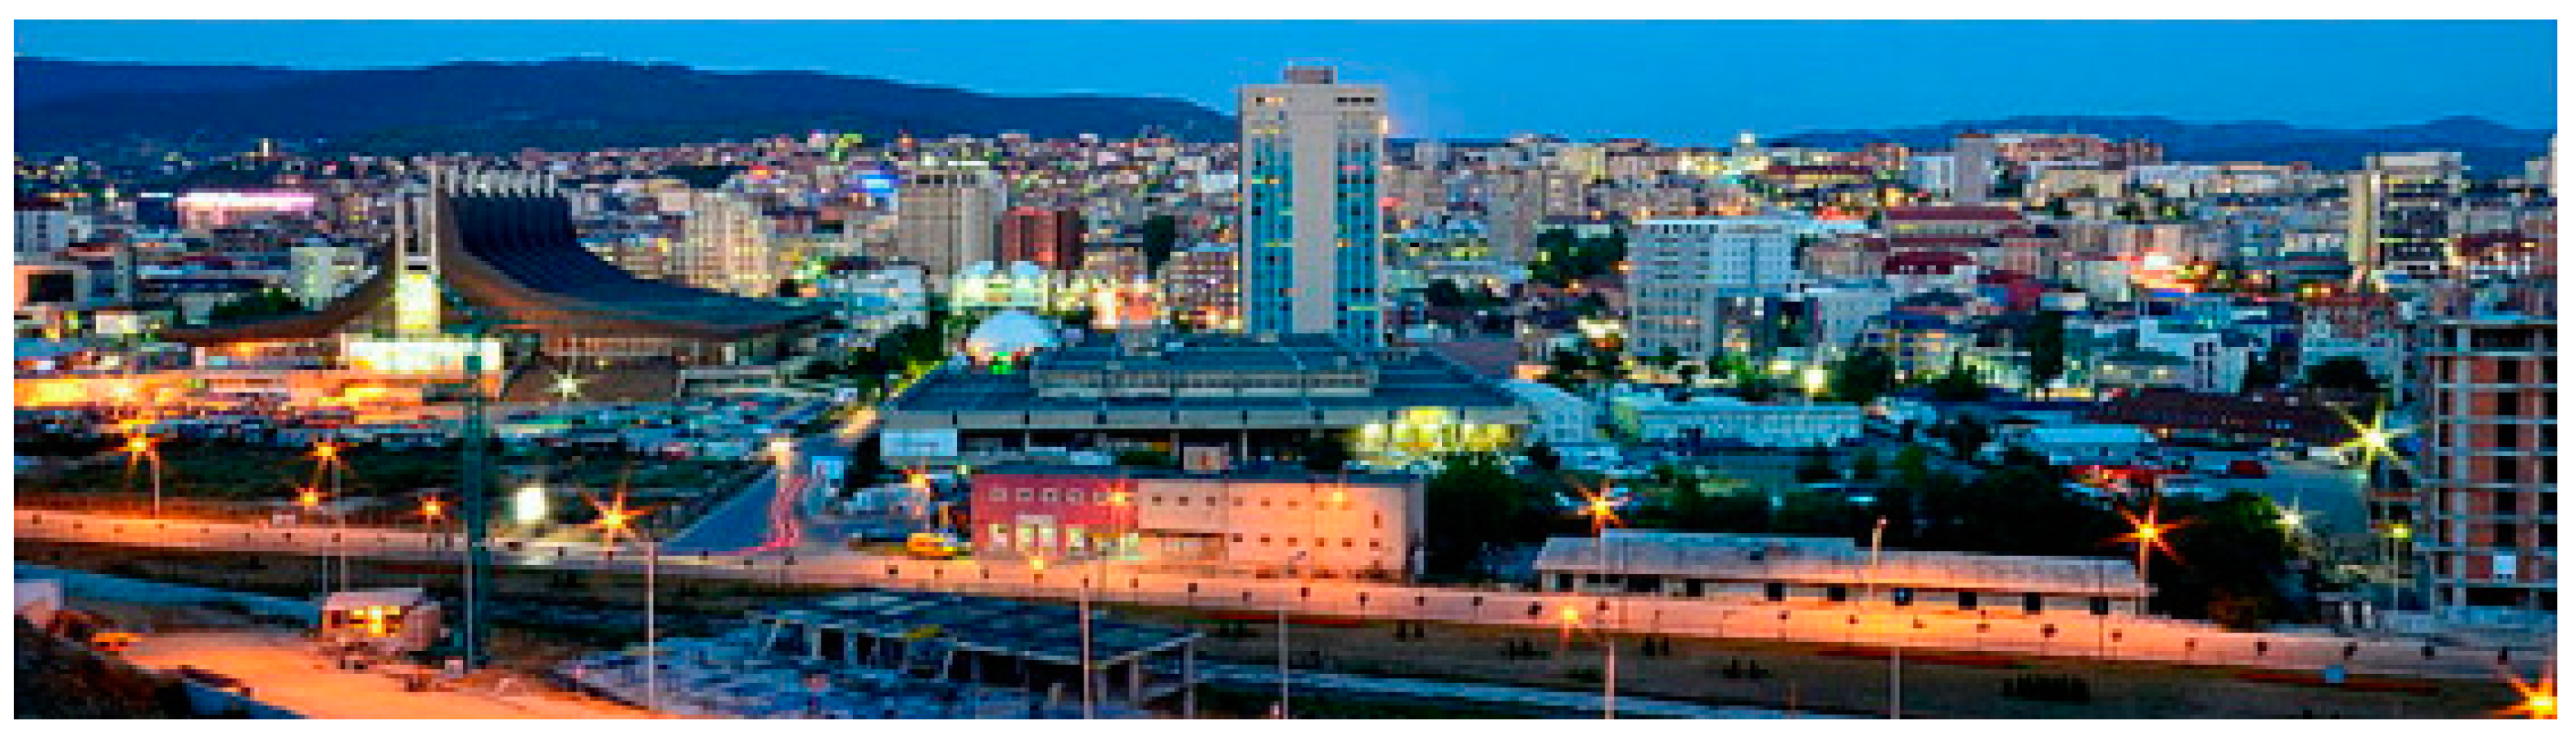
4.1. Experiment Setting

An exploratory field campaign was conducted over the course of two weeks in Pristina, Kosovo during the summer of 2019 to flight test meteorologically instrumented UAs and validate observational strategies. Pristina, Kosovo, is the capital of, and largest city in, Kosovo (Figure 2 shows a panoramic view). The city covers 572 square kilometers [87] and the land surface cover is a mixture of residential and commercial buildings, with the highest residential building 24 floors in height and the largest commercial building stretching 42 floors upward [88]. One-half of all buildings in Pristina are above 100 m [88]. Hence, Pristina offered an excellent opportunity to conduct a proof of concept field investigation in a contemporary urban canopy.
Pristina was selected as the site for undertaking urban observations for numerous reasons. Besides the abovementioned urban area that it offers, a broad legacy of support from the Kosovo Civil Aviation Administration (KCAA) for Embry-Riddle Aeronautical University (ERAU) UAS operations exists due to an assortment of past field campaigns conducted successfully across the country and within Pristina specifically. Hence, these periods of performance resulted in unique authorization to conduct urban flight operations that is not presently easily obtainable in the United States due to existing Federal Aviation Administration (FAA) regulations. Additionally, the operation coincided with an annual study-abroad trip to the Balkans, anchored in Pristina, that was composed of many aeronautical science students [89]. The dovetailing of these two expeditions provided an advantage in making available an abundant amount of time to wait for the desired synoptic conditions to be present and an ample number of students who were well-versed in UAS flight and ground observations.

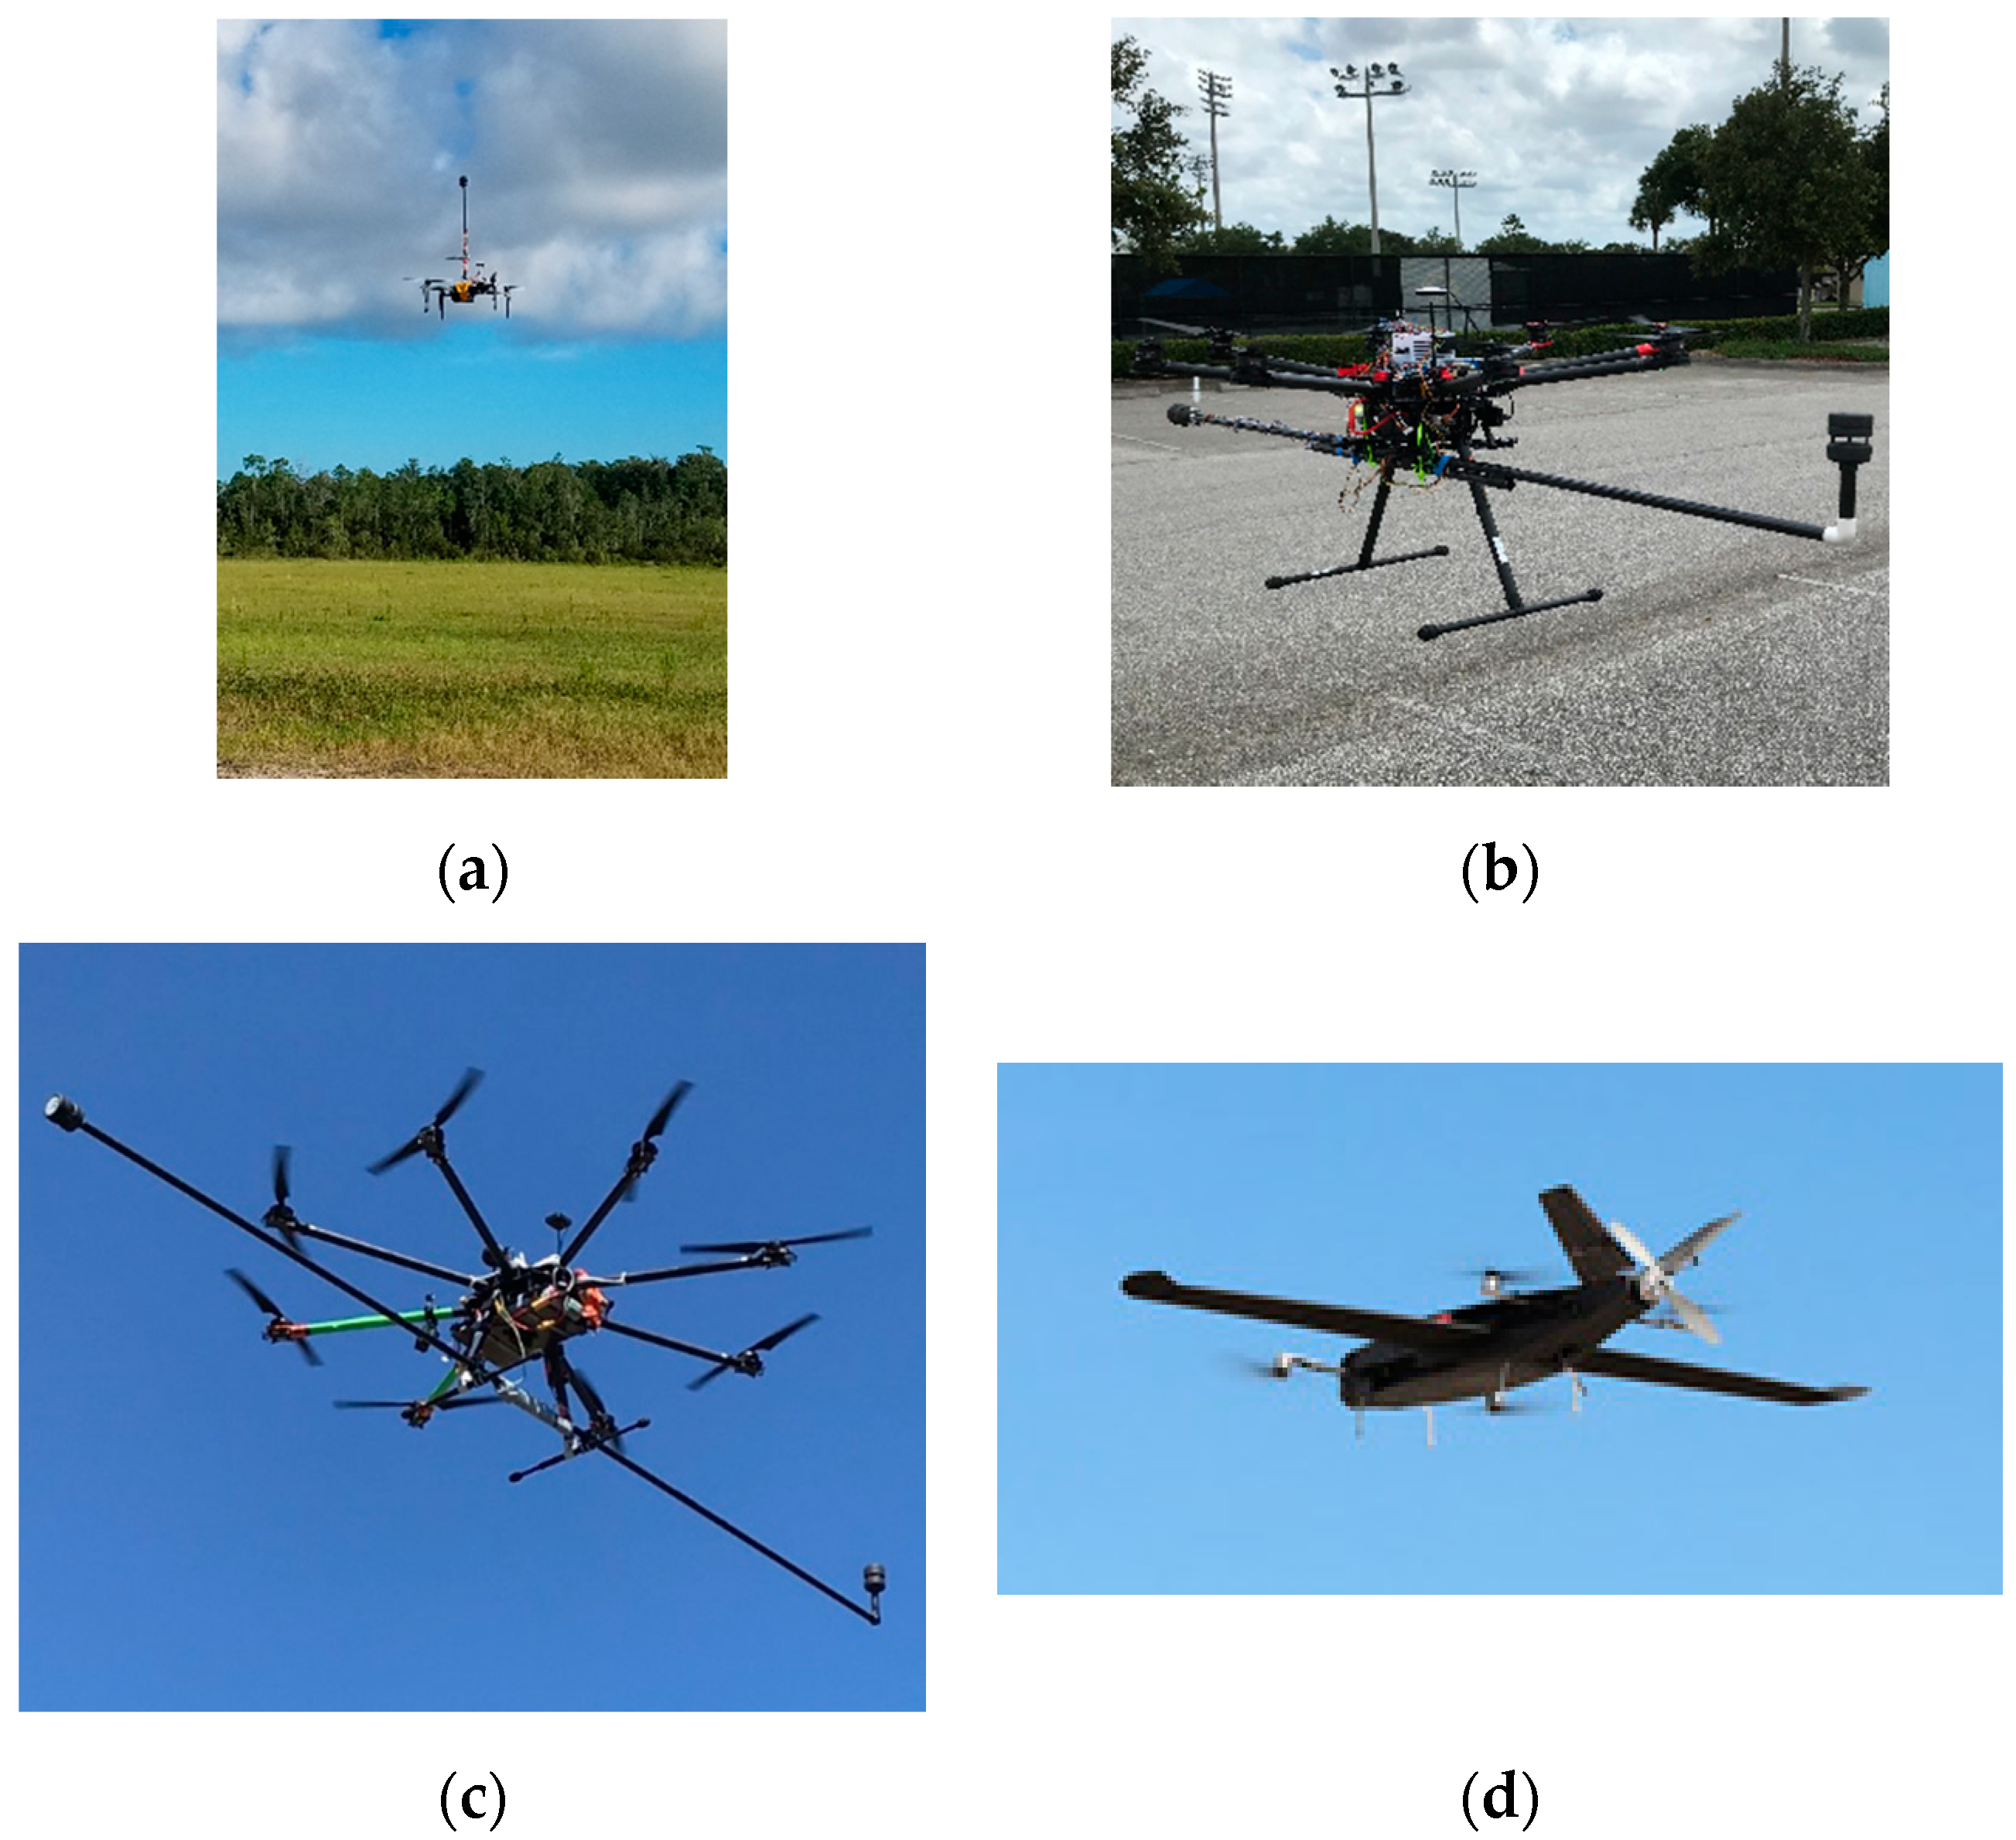
4.2. Observation Platforms

Several iterations of both multirotor and fixed-wing meteorologically instrumented UASs have evolved between field campaign preplanning and postcampaign evaluation. Actual experimental observations took place with as many as five simultaneously flown UAs. Each of these UAs has been instrumented to make both thermodynamic and kinematic measurements. All thermodynamic measurements for each category of aircraft (multirotor and fixed-wing) are obtained by a resistor temperature detector (RTD) for temperature and a capacitive hygrometer for humidity. Pressure is measured with a high-resolution solid-state barometer.
Multirotor kinematic measurements are accomplished with a 2-dimensional acoustic resonance wind sensor. In order to place the anemometer(s) out of the rotor-induced flow field, UAs that host a single anemometer have made use of a vertical pole mount (Figure 3a) while UAs that produce 3-dimensional wind data have made use of placing orthogonally mounted sonic anemometers on booms that extend laterally (Figure 3b,c). This latter mounting strategy enables a greater number of flux calculations, including those that make use of the fluctuating vertical velocity component. As previously stated, meteorologically instrumented fixed-wing UAs that have been developed (Figure 3d) utilize the same scalar sensors; however, kinematic measurements are made with a 7-hole pressure probe. Transition (hybrid) style fixed-wing UAs were specifically chosen to host the meteorological instrumentation due to their vertical take-off and landing (VTOL) capability. This capability affords more launch and recovery options in an urban environment where an unobstructed expanse for traditional launch and recovery might not be readily available. Further, this launch and recovery method affords much greater protection to sensitive instrumentation, such as the multihole pressure probe, compared to a parachute, belly landing or net rescue recovery. As a result, a fixed-wing UA that undertakes a VTOL launch and recovery offers many advantages specific to an urban environment while still exploiting the efficiency of fixed-wing lift that further enhances endurance. Additional detail on the assortment of meteorologically instrumented UAs developed by ERAU, including sensor capability and validation, can be found in [55,90,91,92,93,94,95].

4.3. Campaign Challenges, Lessons Learned and Best Practices
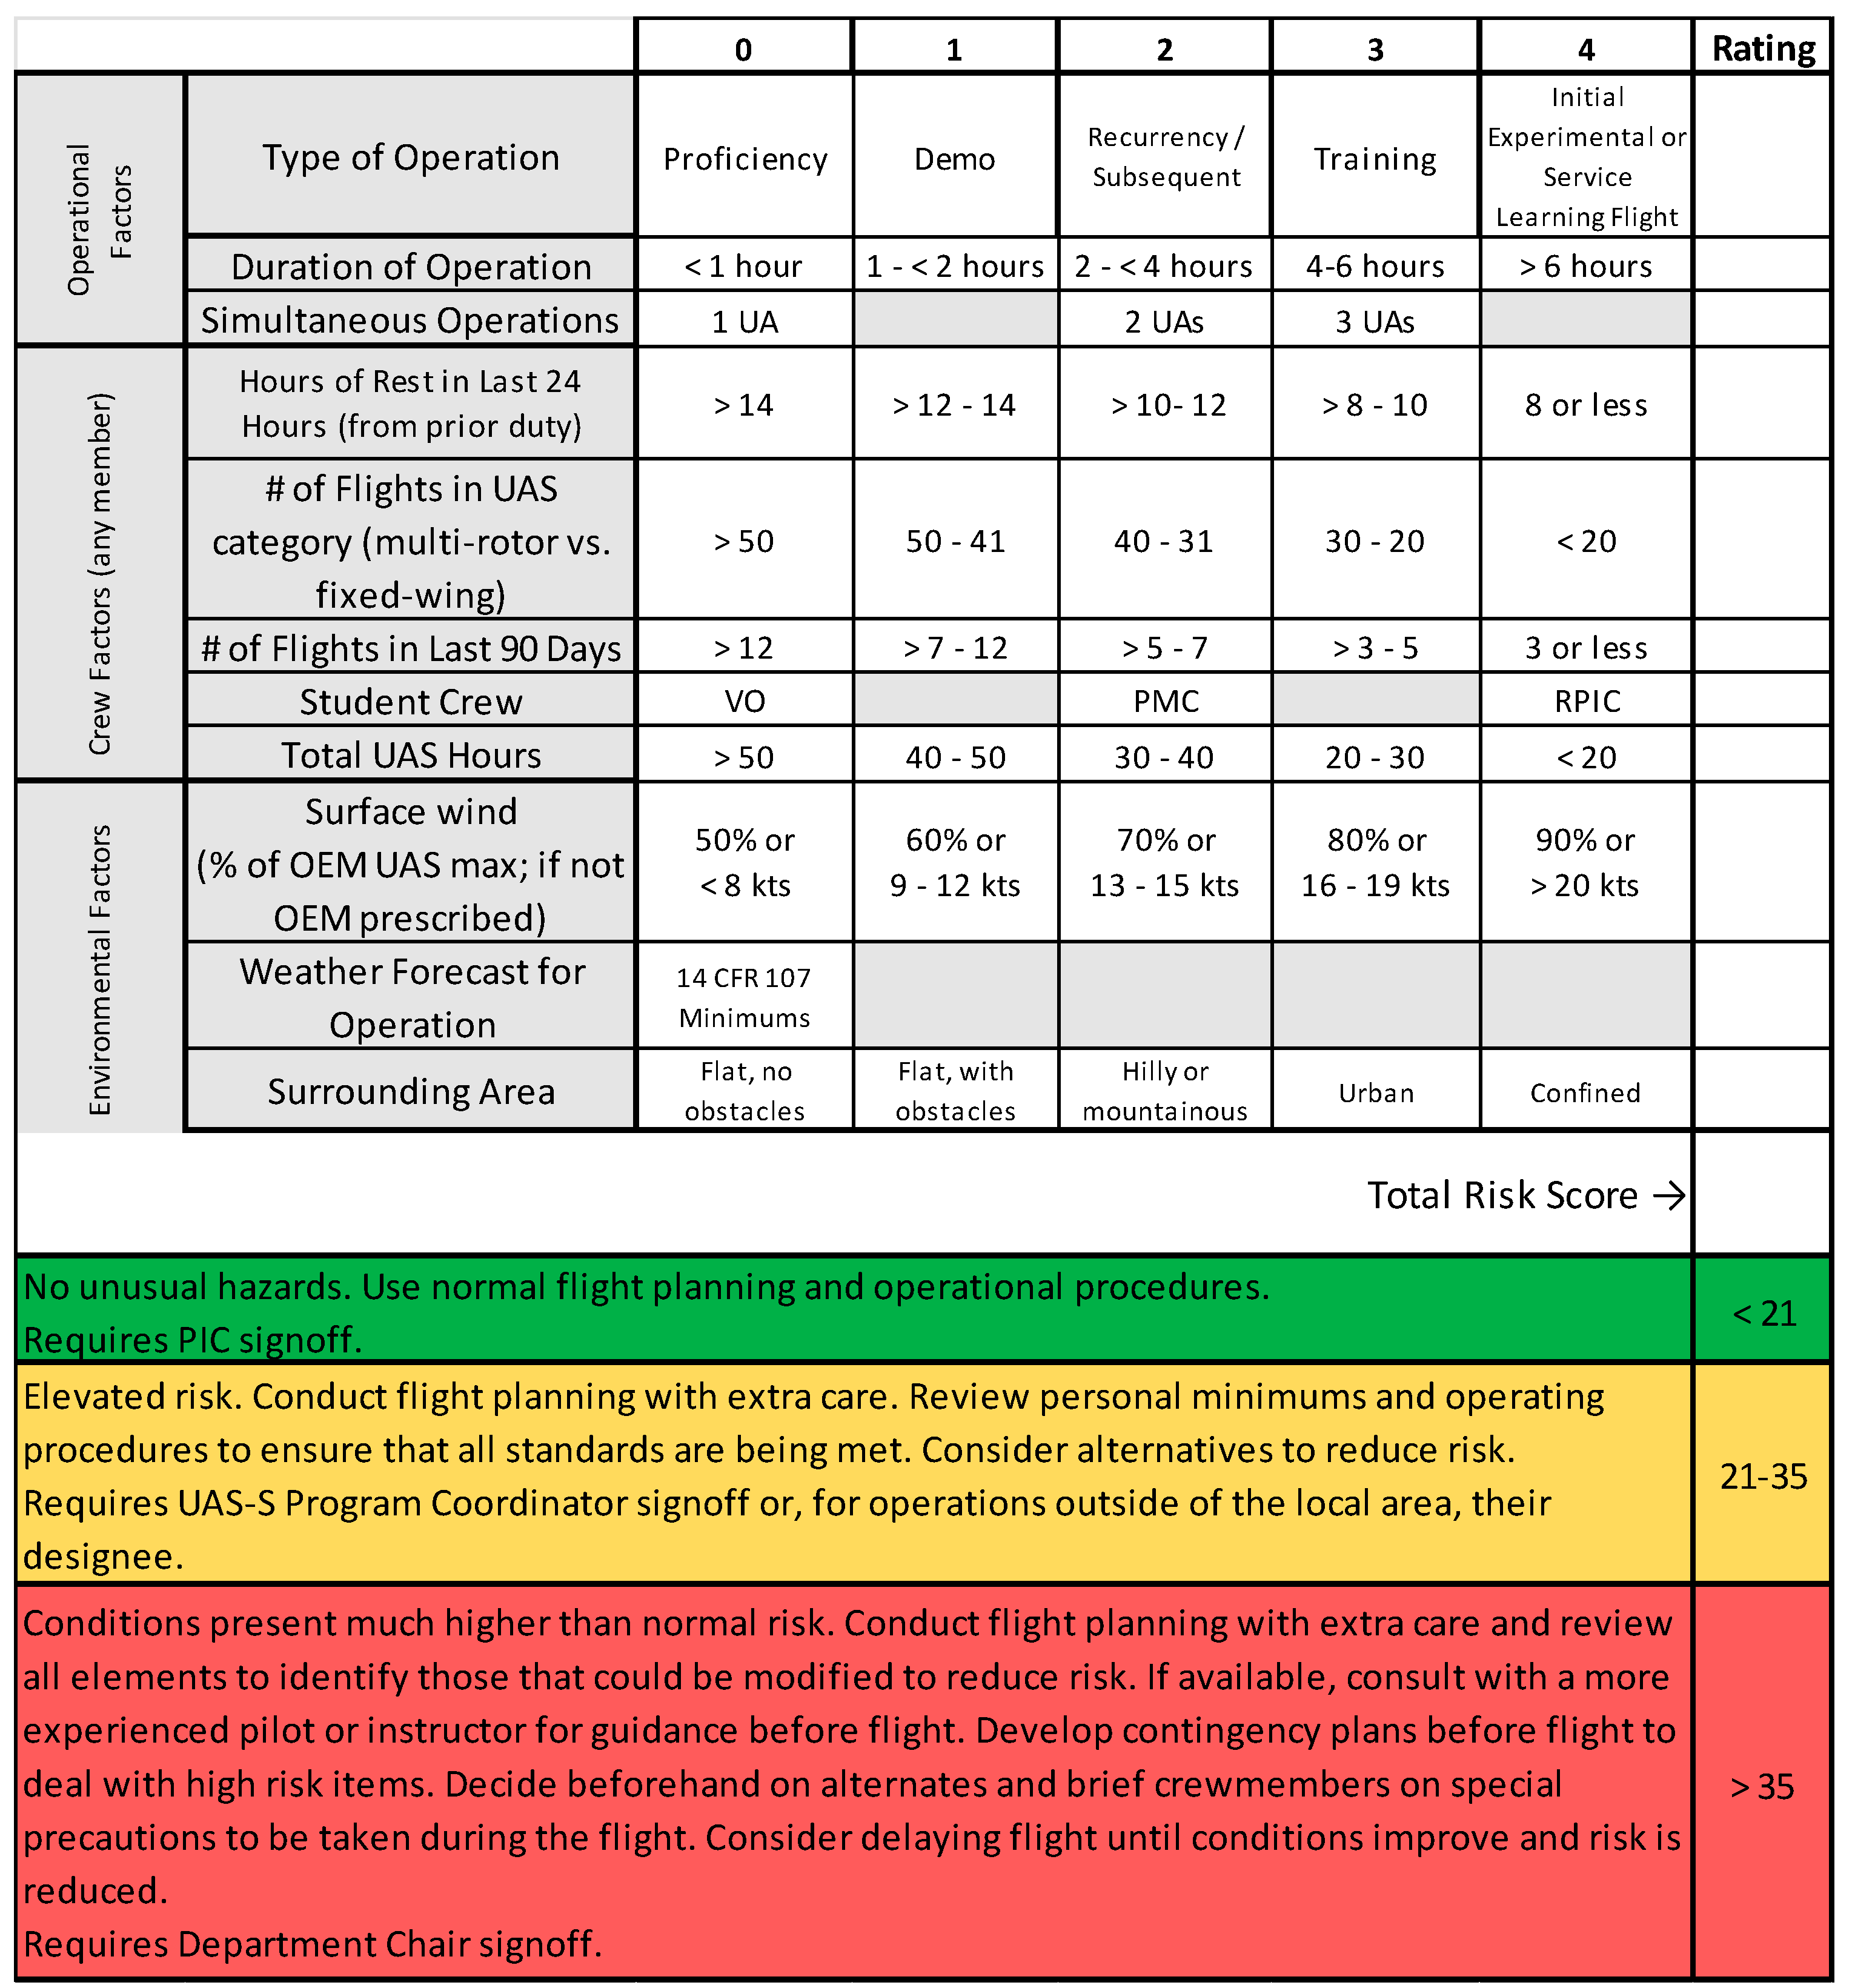
4.3.1. Operational

The mainstay observational strategies implemented in Pristina consisted of vertically stacked multirotor UAs at various downstream and laterally offset positions within a variety of urban canyons and the concurrent UCL and RSL investigation strategy put forth in Section 3. While care was exercised during the creation of each UA’s flight plan and the overarching observational strategy, a number of on-site challenges were realized. Some of these challenges were anticipated while others were not. To proactively identify and quantify hazards, a flight risk assessment tool (FRAT) was developed and implemented. This is shown in Figure 4. The FRAT was exercised prior to every flight operation and provides an easy to understand visual depiction of risk that, ultimately, controlled the go/no-go decision. This tool purposely made the team consider the accumulation of risk in an objective manner.
Operational risks that were identified in preflight briefings were openly discussed along with consensus measures to mitigate these risks. Acknowledging that not all risks would be properly identified, safety and aircraft performance margins were built into the concept of operations (ConOps). In keeping with general flight testing philosophy, the flight envelope of the instrumented UAs and the operation in general were expanded in a slow build-up manner. This approach respects the decreased dimensions and mass, and consequently inertia, of the vehicles and their resulting increased sensitivity to weather, along with changes to the stability and control of the instrumented aircraft.
The increased mechanical and thermal turbulence in an urban environment can make an urban environment an especially challenging environment to fly in. The same wind and turbulence that is attempting to be observed can prove to be one of the greatest challenges to the operation. The greatest risk in this dynamic is loss of UA control, a failure to deconflict with fixed objects or vertically separated UA, or both. To mitigate these challenges, aircraft performance margins were maintained, pilot proficiency was matched with the anticipated flow and turbulence intensity, and appropriate physical distancing from physical objects was maintained. The wind and turbulence can also impact aircraft endurance and this must be taken into account during urban mission planning and be continually monitored during the flight. Winds and turbulence can decrease the endurance of a UA as it works to stabilize itself or increase the platform’s endurance as it exploits updrafts.
Methodical site surveys that accurately depict the flight operations area and identify threats should be part of the standard operating procedure prior to the commencement of any flight operation. A meticulous site survey can also aid in the accomplishment of an excellent record of urban metadata that should accompany any observed dataset. Hence, each objective should be kept in mind when conducting the site survey. For each purpose, the record should include the height of the highest obstruction in the operational area. This height should set the minimum obstacle clearance altitude (MOCA). In the eventuality of a lost link between a UA and the ground control station (GCS), this MOCA should inform the return to home (RTH) altitude. The RTH altitude should be set higher than the MOCA for autonomous emergency landing contingencies. Since a loss of link has a higher probability of occurring in urban locales, a loss of link strategy should be decided upon beforehand. An appropriate strategy might consist of the UA hovering in place, giving the pilot time to reestablish the link. Failure to reconnect should result in the UA returning to a predefined recovery area with a RTH altitude set higher than the MOCA. Just as fundamental to the site survey as the identification of obstacles is the identification of a number of alternative recovery zones in the event of an emergency at any phase of flight. The lack of adequate options may necessitate altering the observational strategy.
In the same manner that careful and methodical operational field planning pays large dividends in the future, diligent logistical planning offers the same reward. While most field campaigns involve the transport of large volumes of equipment and a number of people, always involving great effort, UAS operations often introduce additional complexity. A significant challenge is associated with the lithium-ion polymer batteries required for their operation. Especially for large UASs, typically required for hosting instrumentation, the batteries are often over the 160 Wh limit imposed by airlines. This restriction requires preplanning to overcome via the securing of batteries on-site if ground transportation is not an option. In addition to securing an adequate number of batteries for a given day’s agenda, spare parts, especially hard to source components or those with a low mean time between failure (MTBF), should be secured in advance. When foreign travel, such as in this case, is involved, an additional issue that might arise is required communication equipment. In an effort to keep all disparate parties connected during an operation, walkie-talkies might be utilized. It should be noted that, while walkie-talkies will work anywhere in the world, individual counties have their own rules and regulations pertaining to what radios can legally be used in their jurisdiction.
Finally, while the use of checklists are a hallmark of aviation, it should be recognized that original equipment manufacturer (OEM) checklists, if provided, may need updating or to be rewritten once the platform is instrumented. Besides mitigating risk and enhancing safety, a checklist that incorporates the instrumentation system ensures that a complete dataset is obtained and negates the need to re-fly missions and, hence, increase exposure to unnecessary risk.

4.3.2. Technical

Flight in proximity to structures also poses challenges through their material construction. Ferromagnetic and electromagnetic sources are found throughout urban infrastructure in the form of pipes, underground power lines and rebar, amongst other items, and can affect operation of the UA’s magnetometer. This may be especially problematic during compass calibration, which will be required when deployment takes place far from the UA’s last operational area. When this calibration takes place, it needs to be accomplished close to the area of intended operation but, preferably, in an undeveloped area free of magnetic interference. This requires preplanning ahead of entering the urban environment. While the open expanse on the top of buildings and parking structures are attractive launch and recovery areas, the presence of embedded rebar must be remembered. The pilot should be especially cognizant of and prepared for erratic UA behavior upon launch. A simple controllability check of aircraft responsiveness around all three aircraft axes was completed immediately after each launch when the UA was still in the sterile launch region. The flight team in Pristina witnessed firsthand the effect of electromagnetic interference when an industrial grade portable generator, located in a construction zone used for launch and recovery, unexpectedly switched on. It should also be noted that in addition to being cognizant of potential sources of magnetic interference in the immediate area during a compass calibration, that instrumentation should also be switched off as to not create a local electromagnetic field.
The impermeable nature of buildings can also provide operational challenges through the blockage of GPS signals. Therefore, pilots manually flying in flight modes with stability augmentation must remain vigilant and prepared to maintain control and operate the UA in a degraded state should GPS signals be lost. This is an especially significant concern deep within urban canyons. During the field campaign, the unavailability of GPS oftentimes resulted in pilots having to fly the UA in a degraded flight mode until several hundred feet in the air where GPS signals were obtainable. This lack of GPS availability also brings about the inability to easily geotag and time stamp the data.
An additional consideration in the further mitigation of risk, when using multirotor UAs, was the selection and use of multirotor UAs with greater than four rotors that would, in the event of a motor, electronic speed controller (ESC), or propeller failure, enable a controlled descent. To further address the concern of an uncontrolled descent, parachute recovery systems, that remove power upon deployment and sound an audible alarm, were incorporated into all UAs. These steps were taken in addition to restricting pedestrian access to flight operation areas, especially below multirotor operations. Prop guards, while not installed during the initial field campaign, may also be considered in order to provide an additional safeguard against lacerations. Such guards also prevent propeller damage during an inadvertent minor encounter with an object that would otherwise result in critical damage to the UA.

4.3.3. Personnel

While a number of best practices were extracted from this exploratory field campaign, one clear takeaway is that urban investigations require more personnel than a comparable ABL investigation in an undeveloped area. The previously described concurrent measurement strategy requires multiple pilots for a one-to-one ratio to be maintained between the pilot and UA. The dynamic urban environment and potential changes to the UA’s handling characteristics requires regard for each of these pilots as an individual and consideration of their unique experience and skill level. As much as possible, pilots should retain their UA assignment as they become accustomed to any unique handling qualities brought about by the instrumentation of the UA and as they develop experience navigating a particular platform through a complex urban environment. In general, UAs within the UCL were manually flown while UAs operating in the RSL, above the height of the tallest building, were operated autonomously. Each of these factors figured into the ConOps and a given pilot’s assignment to a specific UA and task.
Urban operations can introduce several additional factors that increase the difficulty of obtaining and maintaining situational awareness (SA). With SA serving as a fundamental component in the management of risk, pilots who cannot understand their current situation cannot appropriately assess or mitigate risk. A vibrant city provides a multitude of ever changing distractions which may contribute to the loss of SA. The deployment of small UA teams, versus the assignment of a single pilot to a given UA, may allow for members of a UA team to manage distractions on behalf of a pilot, thus allowing the pilot to solely focus on safely manipulating the controls and retain SA. With the present widespread requirement for the UA pilot to maintain visual line of sight (VLOS), the UA may be placed within an environment constrained by physical barriers, such as buildings that wrap around the operational domain. While this set-up ensures that the pilot can maintain VLOS with the UA, it may lead to the pilot being unaware of threats that are still within very close proximity, such as just around the corner or over a building. Here, visual observers (VOs) can provide complementary perspectives at the border of the operational area. VOs can also greatly assist the pilot in deconflicting the UA flight path with fixed objects, such as buildings, by using alternative perspectives, especially when it may be difficult for a pilot to appropriately perceive the relative distance of a fixed object in their visual field (depth perception). Further, VOs can ensure that the airspace for the operation remains clear of nonparticipant aircrafts, both manned and unmanned. Preflight meetings and briefings and site inspections that entail the pilot becoming familiar with their operational environment and rehearsing the data acquisition strategy can go a long way in mitigating many of the aforementioned challenges.
In addition to a small UA team being assigned a pilot and VOs, additional members can be utilized to further increase the likelihood of success. These team members can assist the pilot with load (task) shedding, the management of distractions, such as interested public observers, and identifying suitable emergency landing locations in that eventuality. The conduct of UA operations in urban areas will bring about a great deal of attention from the public with inquiries that range from simple curiosity to individuals demanding to see authorization for the operation. In the circumstance of this field campaign, these inquiries necessitated also having a translator embedded in the operation.
With all of these individuals solely focusing on the safe execution of their immediate flight operation, an overarching test director can then maintain the entirety of the “big picture” and ensure that the scientific objectives of the mission are also being accomplished. It is strongly suggested that there is a strict division of responsibility between flight and scientific objectives. The test director can bring these two disparate groups, flight operators and data scientists, who may be monitoring telemetered data, together. Besides bridging the focus of these two distinct groups, the test director, with their “big picture” perspective, can: (1) ensure that all UAs remain deconflicted, better understanding the future positions of other UAs and relaying this as needed; (2) assist pilots in making decisions, thus helping them avoid task saturation; (3) identify threats; (4) evaluate changing circumstances; (5) discourage complacency; (6) ensure scientific objectives are being met; (7) serve as a conduit for communication between flight operation teams, data managers and scientists. A range safety officer (RSO) can also be designated during an operation and satisfy many of the safety related roles previously put forth for the test director. This is especially advisable for large or complex operations. It is imperative that all individuals have direct two-way communication with each other. Further, while conventional aviation language can be utilized in general, it is imperative that a concise, effective and common language be developed and implemented for the unique aspects of a UBL investigation.
Again, this exploratory field campaign was dovetailed with a study abroad trip consisting of many students. This circumstance provided the large number of people required to implement the abovementioned organizational structure. It was discovered that UA operations scaffold well with student participation since the aforementioned responsibilities range in complexity. For example, new or inexperienced team members can easily and effectively serve as VOs, individuals with intermediate levels of experience can safely manipulate the controls of straightforward manual missions or oversee autonomous flight plans (assuming they are properly certificated), and experienced students, including graduate students, can effectively assist in the planning and oversight of significant portions of the campaign. Data management and analysis in the field similarly scaffolds.

5. Conclusions

The UBL is an increasingly important domain that warrants deep understanding and rigorous analysis via sophisticated experimental and numerical tools. Swarms of meteorologically instrumented UASs afford a novel way to investigate the UBL, especially the numerous microclimates within the UCL and RSL. This paper presented a methodology for SL investigations using a mixed fleet of fixed-wing and multirotor UASs undertaking concurrent observations. Following a proof of concept field campaign that focused on the UCL and RSL of a large modern city with a high-rise urban canopy, the lessons learned were discussed and best practices suggested. Using the aforementioned practices, future work includes numerous scientific field campaigns. In addition to the discussed meteorological sensors, during future flights, the authors hope to also fly an infrared thermal imaging camera to elucidate the heterogeneity of urban surfaces.

Author Contributions

Conceptualization, K.A. and P.W.; methodology, K.A.; P.W. and A.S.; software, C.S.; validation, C.S. and K.A.; formal analysis, K.A.; investigation, K.A.; P.W.; C.S. and N.D.M.; resources, K.A.; data curation, K.A.; writing—original draft preparation, K.A. and A.S.; writing—review and editing, K.A.; A.S.; P.W.; C.S. and N.D.M.; supervision, K.A. and N.D.M.; project administration, K.A. and N.D.M.; field coordination and planning, K.A. and N.D.M.; funding acquisition, K.A. and N.D.M. All authors have read and agreed to the published version of the manuscript.

Funding

This research received no external funding.

Acknowledgments

The authors would like to acknowledge the ground and flight operations support provided during the campaign by the 2019 Embry-Riddle Aeronautical University Southeast Europe study abroad students. Further, the authors would also like to thank the anonymous reviewers whose comments resulted in a better manuscript.

Conflicts of Interest

The authors declare no conflict of interest.

References

  1. Oke, T. The distinction between canopy and boundary-layer urban heat islands. Atmosphere 1976, 14, 268–277. [Google Scholar] [CrossRef] [Green Version]
  2. Roth, M. Review of atmospheric turbulence over cities. Q. J. R. Meteorol. Soc. 2000, 126, 941–990. [Google Scholar] [CrossRef]
  3. Oke, T. Boundary Layer Climates, 2nd ed.; Routledge: London, UK, 1987. [Google Scholar]
  4. Britter, R.; Hanna, S. Flow and dispersion in urban areas. Annu. Rev. Fluid Mech. 2003, 35, 469–496. [Google Scholar] [CrossRef]
  5. Grimmond, C.S.B. Progress in measuring and observing the urban atmosphere. Theor. Appl. Climatol. 2005, 84, 3–22. [Google Scholar] [CrossRef]
  6. Martilli, A. Current research and future challenges in urban mesoscale modelling. Int. J. Climatol. 2007, 27, 1909–1918. [Google Scholar] [CrossRef]
  7. Barlow, J.F.; Coceal, O. A Review of Urban Roughness Sublayer Turbulence. In UK Met Office Technical Report; Reading University: Reading, UK, 2009; p. 68. [Google Scholar]
  8. Fernando, H. Fluid dynamics of urban atmospheres in complex terrain. Annu. Rev. Fluid Mech. 2010, 42, 365–389. [Google Scholar] [CrossRef]
  9. Barlow, J.F. Progress in observing and modelling the urban boundary layer. Urban Clim. 2014, 10, 216–240. [Google Scholar] [CrossRef] [Green Version]
  10. Rotach, M.W. Turbulence close to a rough urban surface.1. Reynolds stress. Bound. Layer Meteorol. 1993, 65, 1–28. [Google Scholar] [CrossRef]
  11. Roth, M. Turbulent transfer relationships over an urban surface.2. Integral statistics. Q. J. R. Meteorol. Soc. 1993, 119, 1105–1120. [Google Scholar] [CrossRef]
  12. Roth, M.; Oke, T.R. Turbulent transfer relationships over an urban surface.1. spectral characteristics. Q. J. R. Meteorol. Soc. 1993, 119, 1071–1104. [Google Scholar]
  13. Grimmond, C.S.B.; Oke, T.R. Turbulent heat fluxes in urban areas: Observations and a local-scale urban meteorological parameterization scheme (LUMPS). J. Appl. Meteorol. 2002, 41, 792–810. [Google Scholar] [CrossRef] [Green Version]
  14. Kanda, M.; Moriwaki, R.; Kasamatsu, F. Large-eddy simulation of turbulent organized structures within and above explicitly resolved cube arrays. Bound. Layer Meteorol. 2004, 112, 343–368. [Google Scholar] [CrossRef]
  15. Feigenwinter, C.; Vogt, R. Detection and analysis of coherent structures in urban turbulence. Theor. Appl. Climatol. 2005, 81, 219–230. [Google Scholar] [CrossRef] [Green Version]
  16. Moriwaki, R.; Kanda, M. Flux-gradient profiles for momentum and heat over an urban surface. Theor. Appl. Climatol. 2006, 84, 127–135. [Google Scholar] [CrossRef]
  17. Christen, A.; van Gorsel, E.; Vogt, R. Coherent structures in urban roughness sublayer turbulence. Int. J. Climatol. 2007, 27, 1955–1968. [Google Scholar] [CrossRef]
  18. Horiguchi, M.; Hayashi, T.; Hashiguchi, H.; Ito, Y.; Ueda, H. Observations of coherent turbulence structures in the near-neutral atmospheric boundary layer. Bound. Layer Meteorol. 2010, 136, 25–44. [Google Scholar] [CrossRef] [Green Version]
  19. Wood, C.R.; Lacser, A.; Barlow, J.F.; Padhra, A.; Belcher, S.E.; Nemitz, E.; Helfter, C.; Famulari, D.; Grimmond, C.S.B. Turbulent flow at 190 m height above London during 2006–2008: A climatology and the applicability of similarity theory. Bound. Layer Meteorol. 2010, 137, 77–96. [Google Scholar] [CrossRef] [Green Version]
  20. Baars, H.; Ansmann, A.; Engelmann, R.; Althausen, D. Continuous monitoring of the boundary-layer top with lidar. Atmos. Chem. Phys. 2008, 8, 7281–7296. [Google Scholar] [CrossRef] [Green Version]
  21. van der Kamp, D.; McKendry, I. Diurnal and seasonal trends in convective mixed-layer heights estimated from two years of continuous ceilometer observations in Vancouver, BC. Bound. Layer Meteorol. 2010, 137, 459–475. [Google Scholar] [CrossRef]
  22. Haman, C.L.; Lefer, B.; Morris, G.A.; Haman, C.L.; Lefer, B.; Morris, G.A. Seasonal variability in the diurnal evolution of the boundary layer in a near-coastal urban environment. J. Atmos. Ocean. Technol. 2012, 29, 697–710. [Google Scholar] [CrossRef]
  23. Tang, G.; Zhang, J.; Zhu, X.; Song, T.; Münkel, C.; Hu, B.; Schäfer, K.; Liu, Z.; Zhang, J.; Wang, L.; et al. Mixing layer height and its implications for air pollution over Beijing, China. Atmos. Chem. Phys. 2016, 16, 2459–2475. [Google Scholar] [CrossRef] [Green Version]
  24. Peng, J.; Grimmond, C.S.B.; Fu, X.; Chang, Y.; Zhang, G.; Guo, J.; Tang, C.; Gao, J.; Xu, X.; Tan, J. Ceilometer based analysis of Shanghai’s boundary layer height (under rain and fog free conditions). J. Atmos. Ocean. Technol. 2017, 34, 749–764. [Google Scholar] [CrossRef]
  25. Chrysoulakis, N.; Grimmond, S.; Feigenwinter, C.; Lindberg, F.; Gastellu-Etchegorry, J.-P.; Marconcini, M.; Mitraka, Z.; Stagakis, S.; Crawford, B.; Olofson, F.; et al. Urban energy exchanges monitoring from space. Sci. Rep. 2018, 8, 11498. [Google Scholar] [CrossRef] [PubMed] [Green Version]
  26. Kotthaus, S.; Grimmond, C.S.B. Atmospheric boundary layer characteristics from Ceilometer measurements part 2: Application to London’s urban boundary layer. Q. J. R. Meteorol. Soc. 2018, 144, 1511–1524. [Google Scholar] [CrossRef] [Green Version]
  27. Dou, J.; Grimmond, S.; Cheng, Z.; Miao, S.; Feng, D.; Liao, M. Summertime surface energy balance fluxes at two Beijing sites. Int. J. Climatol. 2019, 39, 2793–2810. [Google Scholar] [CrossRef] [Green Version]
  28. Castro, I.; Cheng, H.; Reynolds, R. Turbulence over urban-type roughness: Deductions from wind-tunnel measurements. Bound. Layer Meteorol. 2006, 118, 109–131. [Google Scholar] [CrossRef]
  29. Cheng, H.; Castro, I.P. Near wall flow over urban-like roughness. Bound. Layer Meteorol. 2002, 104, 229–259. [Google Scholar] [CrossRef]
  30. Castro, I.P.; Xie, Z.-T.; Fuka, V.; Robins, A.G.; Carpentieri, M.; Hayden, P.; Hertwig, D.; Coceal, O. Measurements and Computations of Flow in an Urban Street System. Bound. Layer Meteorol. 2017, 162, 207–230. [Google Scholar] [CrossRef]
  31. Carpentieri, M.; Robins, A.G. Influence of urban morphology on air flow over building arrays. J. Wind Eng. Ind. Aerodyn. 2015, 145, 61–74. [Google Scholar] [CrossRef] [Green Version]
  32. Ricci, A.; Kalkman, I.; Blocken, B.; Burlando, M.; Freda, A.; Repetto, M.P. Local-scale forcing effects on wind flows in an urban environment: Impact of geometrical simplifications. J. Wind Eng. Ind. Aerodyn. 2017, 170, 238–255. [Google Scholar] [CrossRef]
  33. Hertwig, D.; Gough, H.L.; Grimmond, S.; Barlow, J.F.; Kent, C.W.; Lin, W.E.; Robins, A.G.; Hayden, P. Wake Characteristics of Tall Buildings in a Realistic Urban Canopy. Bound. Layer Meteorol. 2019, 172, 239–270. [Google Scholar] [CrossRef] [Green Version]
  34. Schrijvers, P.J.C.; Jonker, H.J.J.; Kenjeres, S.; de Roode, S.R. Breakdown of the night time urban heat island energy budget. Build. Environ. 2015, 83, 50–64. [Google Scholar] [CrossRef]
  35. Caton, F.; Britter, R.E.; Dalziel, S. Dispersion mechanisms in a street canyon. Atmos. Environ. 2003, 37, 693–702. [Google Scholar] [CrossRef]
  36. Salizzoni, P.; Soulhac, L.; Mejean, P. Street canyon ventilation and atmospheric turbulence. Atmos. Environ. 2009, 43, 5056–5067. [Google Scholar] [CrossRef]
  37. Li, X.X.; Britter, R.; Norford, L.K. Effect of stable stratification on dispersion within urban street canyons: A large-eddy simulation. Atmos. Environ. 2016, 144, 47–59. [Google Scholar] [CrossRef] [Green Version]
  38. Uehara, K.; Murakami, S.; Oikawa, S.; Wakamatsu, S. Wind tunnel experiments on howthermal stratification affects flow in and above urban street canyons. Atmos. Environ. 2000, 34, 1553–1562. [Google Scholar] [CrossRef]
  39. Kanda, I.; Yamao, Y. Passive scalar diffusion in and above urban-like roughness under weakly stable and unstable thermal stratification conditions. J. Wind Eng. Ind. Aerodyn. 2016, 148, 18–33. [Google Scholar] [CrossRef] [Green Version]
  40. Zhu, Y.; Zhang, S.; Li, Y.; Lu, H.; Shi, K.; Niu, Z. Social weather: A review of crowdsourcing-assisted meteorological knowledge services through social cyberspace. Geosci. Data J. 2019. [Google Scholar] [CrossRef] [Green Version]
  41. Muller, C.L.; Chapman, L.; Johnston, S.; Kidd, C.; Illingworth, S.; Foody, G.; Leigh, R.R. Crowdsourcing for climate and atmospheric sciences: Current status and future potential. Int. J. Climatol. 2015, 35, 3185–3203. [Google Scholar] [CrossRef] [Green Version]
  42. United Nations World Urbanization Prospects. 2018. Available online: https://population.un.org/wup/Publications/Files/WUP2018-Highlights.pdf (accessed on 7 October 2019).
  43. United States Census Bureau Geography Program. 2019. Available online: https://www.census.gov/programs-surveys/geography.html (accessed on 7 October 2019).
  44. Hill, M.L.; Konrad, T.G.; Meyer, J.H.; Rowland, J.R. A small, radio-controlled aircraft as a platform for meteorological sensors. Johns Hopkins APL Tech. Dig. 1970, 10, 11–19. [Google Scholar]
  45. Bonin, T.; Chilson, P.; Zielke, B.; Fedorovich, E. Observations of the early evening boundary-layer transition using a small unmanned aerial system. Bound. Layer Meteorol. 2013, 146, 119–132. [Google Scholar] [CrossRef]
  46. Wainwright, C.; Bonin, T.; Chilson, P.; Gibbs, J.; Fedorovich, E.; Palmer, R. Methods for evaluating the temperature structure-function parameter using unmanned aerial systems and large-eddy simulation. Bound. Layer Meteorol. 2015, 155, 189–208. [Google Scholar] [CrossRef]
  47. Cassano, J.J. Observations of atmospheric boundary layer temperature profiles with a small unmanned aerial vehicle. Antarct. Sci. 2014, 26, 205–213. [Google Scholar] [CrossRef] [Green Version]
  48. Knuth, S.L.; Cassano, J.J.; Maslanik, J.A.; Herrmann, P.D.; Kernebone, P.A.; Crocker, R.I.; Logan, N.J. Unmanned aircraft system measurements of the atmospheric boundary layer over terra nova bay, antarctica. Earth Syst. Sci. Data 2013, 5, 57–69. [Google Scholar] [CrossRef] [Green Version]
  49. Mayer, S.; Jonassen, M.; Sandvik, A.; Reuder, J. Profiling the arctic stable boundary layer in advent valley, svalbard: Measurements and simulations. Bound. Layer Meteorol. 2012, 143, 507–526. [Google Scholar] [CrossRef] [Green Version]
  50. Reuder, J.; Brisset, P.; Jonassen, M.; Müller, M.; Mayer, S. SUMO: A small unmanned meteorological observer for atmospheric boundary layer research. In Proceedings of the IOP Conference Series: Earth & Environmental Science, Roskilde, Denmark, 23–25 June 2008; Volume 1. [Google Scholar]
  51. Cook, D.E.; Strong, P.A.; Garrett, S.A.; Marshall, R.E. A small unmanned aerial system (UAS) for coastal atmospheric research: Preliminary results from New Zealand. J. R. Soc. N. Z. 2013, 43, 108–115. [Google Scholar] [CrossRef] [Green Version]
  52. Jonassen, M.O.; Ólafsson, H.; Águstsson, O.; Rognvaldsson, O.; Reuder, J. Improving high resolution numerical weather simulations by assimilating data from an unmanned aerial system. Mon. Weather Rev. 2012, 140, 3734–3756. [Google Scholar] [CrossRef] [Green Version]
  53. Jonassen, M.; Tisler, P.; Altstädter, B.; Scholtz, A.; Vihma, T.; Lampert, A.; König-Langlo, G.; Lüpkes, C. Application of remotely piloted aircraft systems in observing the atmospheric boundary layer over antarctic sea ice in winter. Polar Res. 2015, 34, 25651. [Google Scholar] [CrossRef] [Green Version]
  54. Reineman, B.; Lenain, L.; Melville, W. The use of ship-launched fixed-wing UAVs for measuring the marine atmospheric boundary layer and ocean surface processes. J. Atmos. Ocean. Technol. 2016, 33. [Google Scholar] [CrossRef]
  55. Adkins, K.; Sescu, A.; Swinford, C.; Rentzke, N. Nocturnal Observations of Thermodynamic and Kinematic Properties in a Wind Turbine Array Boundary Layer Using an Instrumented Unmanned Aerial System. In Proceedings of the Fall Meeting AGU, San Francisco, CA, USA, 9–13 December 2019. [Google Scholar]
  56. Wang, S.; Garcia, M.; Bauer-Gottwein, P.; Jakobsen, J.; Zarco-Tejada, P.J.; Bandini, F.; Ibrom, A. High spatial resolution monitoring land surface energy, water and CO2 fluxes from an unmanned aerial system. Remote Sens. Environ. 2019, 229, 14–31. [Google Scholar] [CrossRef]
  57. Koch, S.E.; Fengler, M.; Chilson, P.B.; Elmore, K.L.; Argrow, B.; Andra, D.L.; Lindley, T. On the use of unmanned aircraft for sampling mesoscale phenomena in the preconvective boundary layer. J. Atmos. Ocean. Technol. 2018, 35, 2265–2288. [Google Scholar] [CrossRef]
  58. Cione, J.J.; Bryan, G.H.; Dobosy, R.; Zhang, J.A.; de Boer, G.; Aksoy, A.; Wadler, J.B.; Kalina, E.A.; Dahl, B.A.; Ryan, K.; et al. Eye of the Storm: Observing Hurricanes with a Small Unmanned Aircraft System. Bull. Am. Meteorol. Soc. 2020, 101, E186–E205. [Google Scholar] [CrossRef]
  59. Adkins, K.A.; Sescu, A. Observations of relative humidity in the near-wake of a wind turbine using an instrumented unmanned aerial system. Int. J. Green Energy 2017, 14, 845–860. [Google Scholar] [CrossRef]
  60. Adkins, K.A.; Sescu, A. Analysis of near-surface relative humidity in a wind turbine array boundary layer using an instrumented unmanned aerial system and large-eddy simulation. Wind Energy 2018, 21, 1155–1168. [Google Scholar] [CrossRef]
  61. Flagg, D.D.; Doyle, J.D.; Holt, T.R.; Tyndall, D.P.; Amerault, C.M.; Geiszler, D.; Eleuterio, D.P. On the impact of unmanned aerial system observations on numerical weather prediction in the coastal zone. Mon. Weather Rev. 2018, 146, 599–622. [Google Scholar] [CrossRef]
  62. Mayer, S.; Sandvik, A.; Jonassen, M.; Reuder, J. Atmospheric profiling with the UAS sumo: A new perspective for the evaluation of fine-scale atmospheric models. Meteorol. Atmos. Phys. 2012, 116, 15–26. [Google Scholar] [CrossRef]
  63. Brosy, C.; Krampf, K.; Zeeman, M.; Wolf, B.; Junkermann, W.; Schäfer, K.; Emeis, S.; Kunstmann, H. Simultaneous multicopter-based air sampling and sensing of meteorological variables. Atmos. Meas. Tech. 2017, 10, 2773–2784. [Google Scholar] [CrossRef] [Green Version]
  64. Schuyler, T.; Guzman, M. Unmanned aerial systems for monitoring trace tropospheric gases. Atmosphere 2017, 8, 206. [Google Scholar] [CrossRef] [Green Version]
  65. Balsley, B.; Lawrence, D.; Woodman, R.; Fritts, D. Fine-scale characteristics of temperature, wind, and turbulence in the lower atmosphere (0–1300 m) over the South Peruvian Coast. Bound. Layer Meteorol. 2013, 147, 165–178. [Google Scholar] [CrossRef] [Green Version]
  66. Neumann, P.P.; Bartholmai, M. Real-time wind estimation on a micro unmanned aerial vehicle using its inertial measurement unit. Sens. Actuators A Phys. 2015, 235, 300–310. [Google Scholar] [CrossRef]
  67. Prudden, S.; Fisher, A.; Marino, M.; Mohamed, A.; Watkins, S.; Wild, G. Measuring wind with small unmanned aircraft systems. J. Wind Eng. Ind. Aerodyn. 2018, 176, 197–210. [Google Scholar] [CrossRef]
  68. Witte, B. Development of an Unmanned Aerial Vehicle for Atmospheric Turbulence Measurement. Theses Diss. Mech. Eng. 2016, 82. [Google Scholar] [CrossRef]
  69. Witte, B.; Singler, R.; Bailey, S. Development of an unmanned aerial vehicle for the measurement of turbulence in the atmospheric boundary layer. Atmosphere 2017, 8, 195. [Google Scholar] [CrossRef] [Green Version]
  70. Yeung, A.; Bramesfeld, G.; Chung, J. Measuring low-altitude wind gusts using the unmanned aerial vehicle GustAV. J. Unmanned Veh. Syst. 2018, 6, 235–248. [Google Scholar] [CrossRef] [Green Version]
  71. Jacob, R. Using UAV’s to Measure the Urban Boundary Layer. In Proceedings of the AGU Fall Meeting, San Francisco, CA, USA, 14–18 December 2015. [Google Scholar]
  72. Guimarães, P.; Ye, J.; Batista, C.; Barbosa, R.; Ribeiro, I.; Medeiros, A.; Souza, R.; Martin, S.T. Vertical profiles of ozone concentration collected by an unmanned aerial vehicle and the mixing of the nighttime boundary layer over an amazonian urban area. Atmosphere 2019, 10, 599. [Google Scholar] [CrossRef] [Green Version]
  73. Pikridas, M.; Bezantakos, S.; Močnik, G.; Keleshis, C.; Brechtel, F.; Stavroulas, I.; Sciare, J. On-flight intercomparison of three miniature aerosol absorption sensors using unmanned aerial systems (UASs). Atmos. Meas. Tech. 2019, 12, 6425–6447. [Google Scholar] [CrossRef] [Green Version]
  74. Wang, Q. Real-time atmospheric monitoring of urban air pollution using unmanned aerial vehicles. WIT Trans. Ecol. Environ. 2019, 236, 79. [Google Scholar] [CrossRef] [Green Version]
  75. Chen, Y.; Chang, C.; Chen, W.; Tsai, Y.; Chang, S. Determination of the vertical profile of aerosol chemical species in the microscale urban environment. Environ. Pollut. 2018, 243 Pt B, 1360–1367. [Google Scholar] [CrossRef]
  76. Loxton, B.; Abdulrahim, M.; Watkins, S. An investigation of fixed & rotary wing MAV flight in replicated atmospheric turbulence. In Proceedings of the 46th AIAA Aerospace Sciences Meeting and Exhibit, Reno, Nevada, 7–10 January 2008. [Google Scholar] [CrossRef]
  77. Watkins, A.; Thompson, M.; Shortis, M.; Segal, R.; Abdulrahim, M.; Sheridan, J. An overview of experiments on the dynamic sensitivity of MAVs to turbulence. Aeronaut. J. 2010, 114, 485–492. [Google Scholar] [CrossRef]
  78. Dias, N.; Gonçalves, J.; Freire, L.; Hasegawa, T.; Malheiros, A. Obtaining Potential Virtual Temperature Profiles, Entrainment Fluxes, and Spectra from Mini Unmanned Aerial Vehicle Data. Bound. Layer Meteorol. 2012, 145, 93–111. [Google Scholar] [CrossRef]
  79. Palomaki, R.T.; Rose, N.T.; van den Bossche, M.; Sherman, T.J.; De Wekker Stephan, F.J. Wind estimation in the lower atmosphere using multirotor aircraft. J. Atmos. Ocean. Technol. 2017, 34, 1183–1191. [Google Scholar] [CrossRef]
  80. Wolf, C.A.; Hardis, R.P.; Woodrum, S.D.; Galan, R.S.; Wichelt, H.S.; Metzger, M.C.; de Wekker Stephan, F.J. Wind data collection techniques on a multi-rotor platform. In Proceedings of the 2017 Systems and Information Engineering Design Symposium (SIEDS), Charlottesville, VA, USA, 28 April 2017; IEEE: New York, NY, USA, 2017. [Google Scholar] [CrossRef]
  81. Rodriguez, L.; Cobano, J.A.; Ollero, A. Wind characterization and mapping using fixed-wing small unmanned aerial systems. In Proceedings of the 2016 International Conference on Unmanned Aircraft Systems (ICUAS), Arlington, VA, USA, 7–10 June 2016. [Google Scholar]
  82. Xiang, X.; Wang, Z.; Mo, Z.; Chen, G.; Pham, K.; Blasch, E. Wind field estimation through autonomous quadcopter avionics. In Proceedings of the 2016 IEEE/AIAA 35th Digital Avionics Systems Conference (DASC), Sacramento, CA, USA, 25–29 September 2016; pp. 1–6. [Google Scholar] [CrossRef]
  83. van Hove, L.W.A.; Steeneveld, G.J.; Jacobs, C.M.J.; Heusinkveld, B.G.; Elbers, J.A.; Holtslag, A.A.M. Exploring the Urban Heat Island Intensity of Dutch Cities. Plant J. 2011, 2170, 34. [Google Scholar]
  84. Mayer, H.; Matzarakis, A.; Iziomon, M.G. Spatio-temporal variability of moisture conditions within the urban canopy layer. Theor. Appl. Climatol. 2003, 76, 165–179. [Google Scholar] [CrossRef]
  85. Oke, T.; Mills, G.; Christen, A.; Voogt, J. Urban Climates; Cambridge University Press: Cambridge, UK, 2017. [Google Scholar] [CrossRef] [Green Version]
  86. Stewart, I.D.; Oke, T. Local Climate Zones for Urban Temperature Studies. Bull. Am. Meteorol. Soc. 2012, 93, 1879–1900. [Google Scholar] [CrossRef]
  87. The Republic of Kosovo, Pristina. 2019. Available online: https://kk.rks-gov.net/prishtine (accessed on 7 October 2019).
  88. SkyscraperCity. 2019. Available online: https://www.skyscrapercity.com (accessed on 7 October 2019).
  89. Macchiarella, N.D.; Adkins, K.A.; Wallace, R. Using Small Unmanned Aircraft Systems for Remote Sensing and Data Collection: Aerospace Education and Service Learning. In Proceedings of the 2020 AIAA SciTech Forum, Orlando, FL, USA, 6–10 January 2020. [Google Scholar] [CrossRef]
  90. Adkins, K.; Swinford, C.; Wambolt, P.; Bease, G. Development of a sensor suite for atmospheric boundary layer measurement with a small multirotor unmanned aerial system. Int. J. Aviat. Aeronaut. Aerosp. 2020, 7, 4. [Google Scholar] [CrossRef]
  91. Adkins, K.; Swinford, C.; Wambolt, P. Development of a Meteorological Sensor Suite for Atmospheric Boundary Layer Measurement Using a Small Multirotor Unmanned Aerial System. In Proceedings of the International Society for Atmospheric Research Using Remotely-Piloted Aircraft World Congress, Lugo, Spain, 15–19 July 2019. [Google Scholar]
  92. Adkins, K.; Olds, J.; Ellis, C. Development, testing and use of an instrumented unmanned aerial system to investigate changes to the near-surface meteorology within a wind farm. In Proceedings of the Association for Unmanned Vehicle Systems International Xponential 2017 AUVSI, Dallas, TX, USA, 8–11 May 2017. [Google Scholar]
  93. Caputo, A.; Oreo, A.; Alterizio, V.; Adkins, K. Development of a Meteorologically Instrumented Small Transition Unmanned Aerial System for Urban Boundary Layer Investigations. In Embry-Riddle Aeronautical University Discovery Day; Embry-Riddle Aeronautical University: Daytona Beach, FL, USA, 2020. [Google Scholar]
  94. Oreo, A.; Swinford, C.; Adkins, K. Development of a Telemetry System for a Meteorologically Instrumented Small Unmanned Aerial System. In Embry-Riddle Aeronautical University Discovery Day; Embry-Riddle Aeronautical University: Daytona Beach, FL, USA, 2019. [Google Scholar]
  95. Swinford, C.; Oreo, A.; Adkins, K. Development of a Three-Dimensional Wind Measurement Sensor Hosted on a Small Unmanned Aerial System. In Embry-Riddle Aeronautical University Discovery Day; Embry-Riddle Aeronautical University: Daytona Beach, FL, USA, 2020. [Google Scholar]
Figure 1. (a) Measurement profiles flown simultaneously by a combination of instrumented multirotor (dashed) unmanned aircraft around the inhomogeneous urban canopy and fixed-wing (dotted) unmanned aircraft assigned to hn discrete layers for horizontal averaging; (b) plan view of the lawn mower flight pattern flown at one altitude across a given local climate zone (LCZ) for horizontal averaging. Neither Figure 1a or Figure 1b is drawn to scale.
Atmosphere 11 01008 g001
Figure 2. Panoramic view of Pristina, Kosovo. Image courtesy of Kosovo Info.
Atmosphere 11 01008 g002
Figure 3. In clockwise order. (a) Instrumented multirotor with thermodynamic sensors and a single vertically mounted anemometer; (b) instrumented DJI S1000 multirotor with orthogonally mounted anemometers on lateral booms; (c) instrumented Tarot T-18 multirotor with orthogonally mounted anemometers on lateral booms; (d) instrumented transition fixed-wing unmanned aircraft.
Atmosphere 11 01008 g003
Figure 4. Flight Risk Assessment Tool (FRAT).
Atmosphere 11 01008 g004

