Article

CO2 and Air Pollutants Emissions under Different Scenarios Predicted by a Regional Energy Consumption Modeling System for Shanghai, China

1
Shanghai Key Laboratory of Atmospheric Particle Pollution and Prevention (LAP3), Department of Environmental Science and Engineering, Fudan University, Shanghai 200438, China
2
Big Data Institute for Carbon Emission and Environmental Pollution, Fudan University, Shanghai 200438, China
3
School of Economics, Center for Energy Economics and Strategies Studies, Fudan University, Shanghai 200438, China
*
Author to whom correspondence should be addressed.
Atmosphere 2020, 11(9), 1006; https://doi.org/10.3390/atmos11091006
Submission received: 31 August 2020 / Revised: 10 September 2020 / Accepted: 16 September 2020 / Published: 21 September 2020
(This article belongs to the Section Air Quality)

Abstract

:
About 75% energy demand and emissions all concentrate in urban areas, especially in the metropolises, placing a heavy burden on both the energy supply system and the environment system. To explore low emission pathways and provide policy recommendations for the Shanghai energy system and the environmental system to reach the carbon dioxide (CO2) peak by 2030 and attain emission reduction targets for local air pollutants (LAPs), a regional energy–environment optimization model was developed in this study, considering system costs, socio-economic development and technology. To verify the reliability of the model simulation and evaluate the model risk, a historical scenario was defined to calculate the emissions for 2004–2014, and the data were compared with the bottom-up emission inventory results. By considering four scenarios, we simulated the energy consumption and emissions in the period of 2020–2030 from the perspective of energy policies, economic measures and technology updates. We found that CO2 emissions might exceed the amount of 250 million tons by the end of 2020 under the current policy, and carbon tax with a price of 40 CNY per ton of carbon dioxide is an imperative measure to lower carbon emissions. Under the constraints, the emissions amount of SO2, NOx, PM10, and PM2.5 will be reduced by 95.3–180.8, 207.8–357.1, 149.4–274.5, and 59.5–119.8 Kt in 2030, respectively.

1. Introduction

China has already surpassed the United States to top the list of countries in terms of energy consumption worldwide [1], with a total energy consumption amount of 4.83 billion tons of coal equivalent (tce), accounting for 23.4% of global energy consumption in 2019 [1]. However, the extensive decades-long development in China has led to various consequences such as inefficient energy use, high energy intensity, and an unreasonable energy structure [2,3,4]. The huge energy demand and inefficient use produced a large amount of CO2 and local air pollutants (LAPs) emissions that far exceed the maximum environmental capacity, leading to regional air pollution issues and exacerbating global warming and climate change. According to statistics from the Bureau of Meteorology, the national average smog and haze days is 29.9 days, with regional haze pollution lasting up to 5–10 days under adverse weather in 2013 [5]. Exposure to outdoor PM2.5 and ozone results in over 821,000 premature deaths during the period from 1990 to 2017, making China the most vulnerable country in terms of economic impact [6]. In response to these challenges faced during the process of urbanization, the Chinese government has included a series of energy conservation and emission reduction targets in the Outline of the Five-Year Plan for National Economic and Social Development, starting from the 11th Five-Year Plan, and has also stated that CO2 emissions in China would reach its peak by 2030.
Cities are the main contributors of energy consumption, consuming about 75% of total energy consumption worldwide [7]. Studies in respect to CO2 emission inventories and LAPs emission inventories indicated that energy consumption contributes 80~90% of CO2 emission [7,8] and 38~80% of local air pollutants in a city [9,10,11,12]. Many studies evaluated the performance of policies promulgated by governments for the purpose of realizing dual control of energy demand and emissions from bottom-up and top-down perspectives by developing different model tools at regional and national levels [13,14,15,16]. The adoption of end-of-pipe treatment could help to significantly control the emissions of certain air pollutants, but a negative co-effect on carbon dioxide reduction and energy conservation was reported [17]. Energy policies, such as adjusting energy structure, improving energy efficiency and promoting industrial restructure, have made a decisive contribution for emission sources control and energy demand. However, when the energy structure and energy intensity reached a certain degree, the potential of energy policy for conservation reduced [18]. Meanwhile, Brown et al. found that the application of an emission fee could reduce the emissions, but emissions of certain pollutants, particularly volatile organic compounds (VOCs) and methane, sometimes increased when fees were applied [19]. Therefore, it is quite meaningful to explore the most cost-effective methods for the energy–environment system, with a specific focus on the development stage at the regional level, to ensure the energy demand and emission reduction targets can be simultaneously met in a specific city.
In previous studies, energy models have been extensively utilized to analyze the energy savings and energy-related greenhouse gas (GHG) emissions-reduction potentials of policies [20,21,22], but these studies have rarely been focused on the emissions of LAPs and the effects of policies on the co-benefits of GHG and LAPs emissions. In this paper, an integrated model framework, built on TIMES (the integrated MARKAL and EFOM Model), is developed to assess the policies on the energy and environmental systems. The TIMES model, the core of the framework, is proposed by the International Energy Agency’s Energy Technology Analysis Systems Program (ETSAP) and is based on the market allocation (MARKAL) model and energy flow optimization model (EFOM) for the optimization of energy systems [23]. By linearly optimizing the process of energy flows, the TIMES model minimizes the cost of discounted values across the energy system. The concept of cost includes the costs incurred in the application of energy technologies (such as investment costs, operation and maintenance costs). The model for policy planning can provide a guideline for improvements to the existing energy system optimizing efficiency. In the optimization process, the TIMES model has a forward-looking outlook that considers not only the existing energy technologies as well as advanced energy technologies, and can be effectively applied to the formulation of energy policies and planning of emerging energy technologies in the medium-to-long term.
In order to evaluate the impact of policies on the energy and the environment systems at a regional level and find the most effective way to meet both the energy demands and emission control targets, we developed the Regional Energy–Environment System Optimization model (REESO model) to simulate the energy consumption and CO2 and LAPs emissions under various policy scenarios. We selected Shanghai as the study region, as shown in Figure 1, the city in China with the highest energy consumption, which is now facing the dual pressure of insufficient energy supply and environmental pollution. The large amount of CO2 and LAPs emitted from fuel combustion challenge the atmospheric environment’s carrying capacity, and secondary pollutants generated by reactions such as ozone and PM2.5 have become the major pollutants affecting air quality in Shanghai [24]. Based on the Shanghai National Economic-Social Development Plan and other policies, different scenarios were modeled to simulate the possible trends in energy consumption and emissions in Shanghai. These results may provide a new approach for the prediction of carbon and LAPs emissions, and may also provide important data and support for action plans and programs to reduce emissions in Shanghai.

2. Background, Methodology and Data

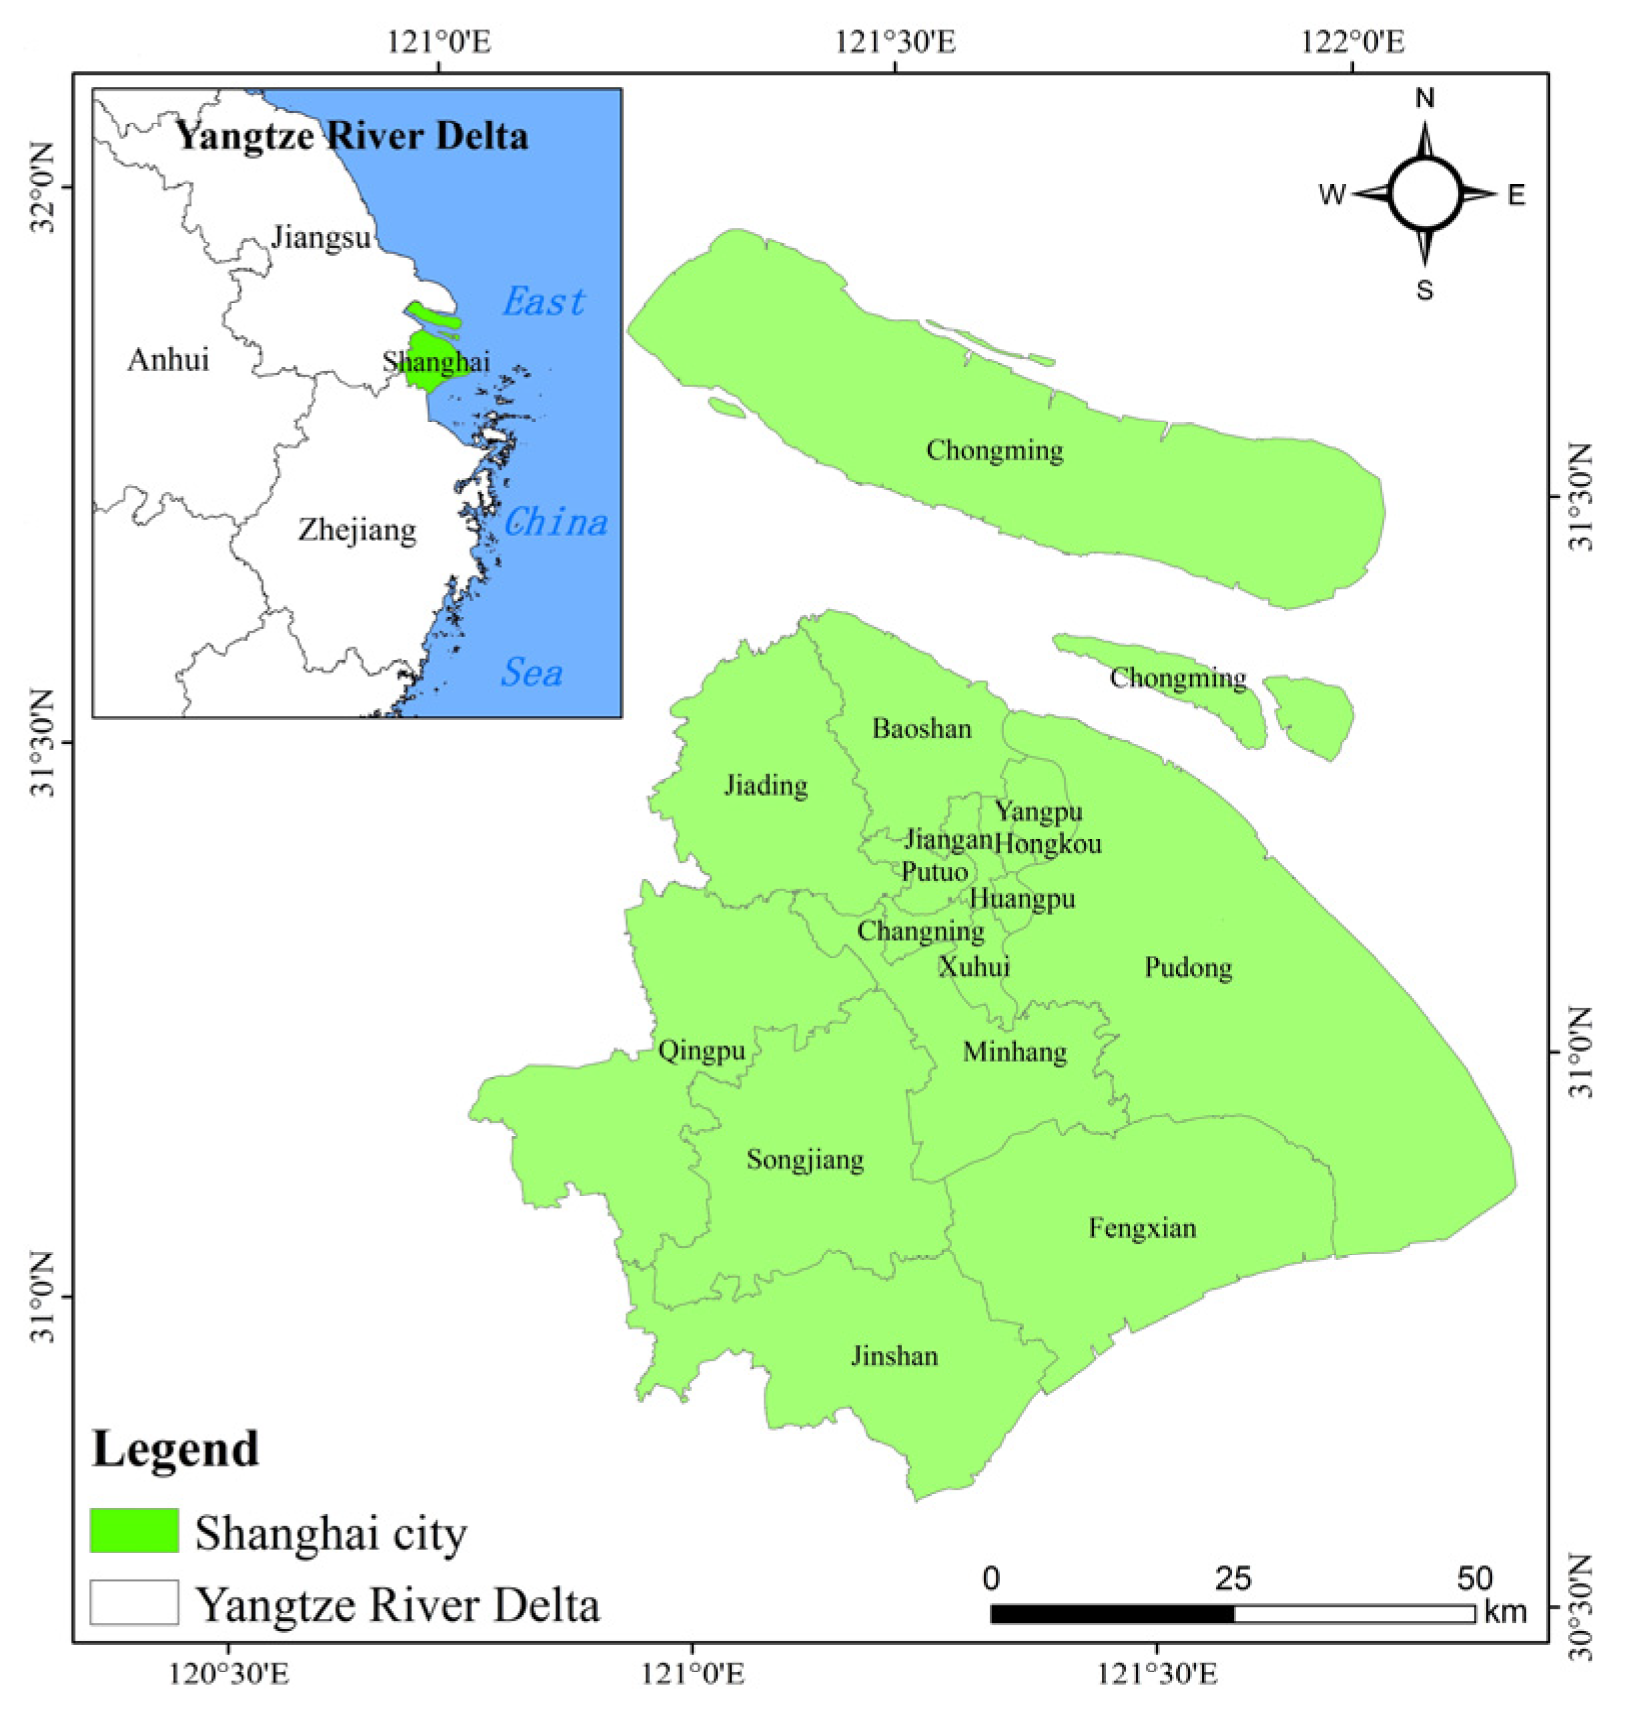
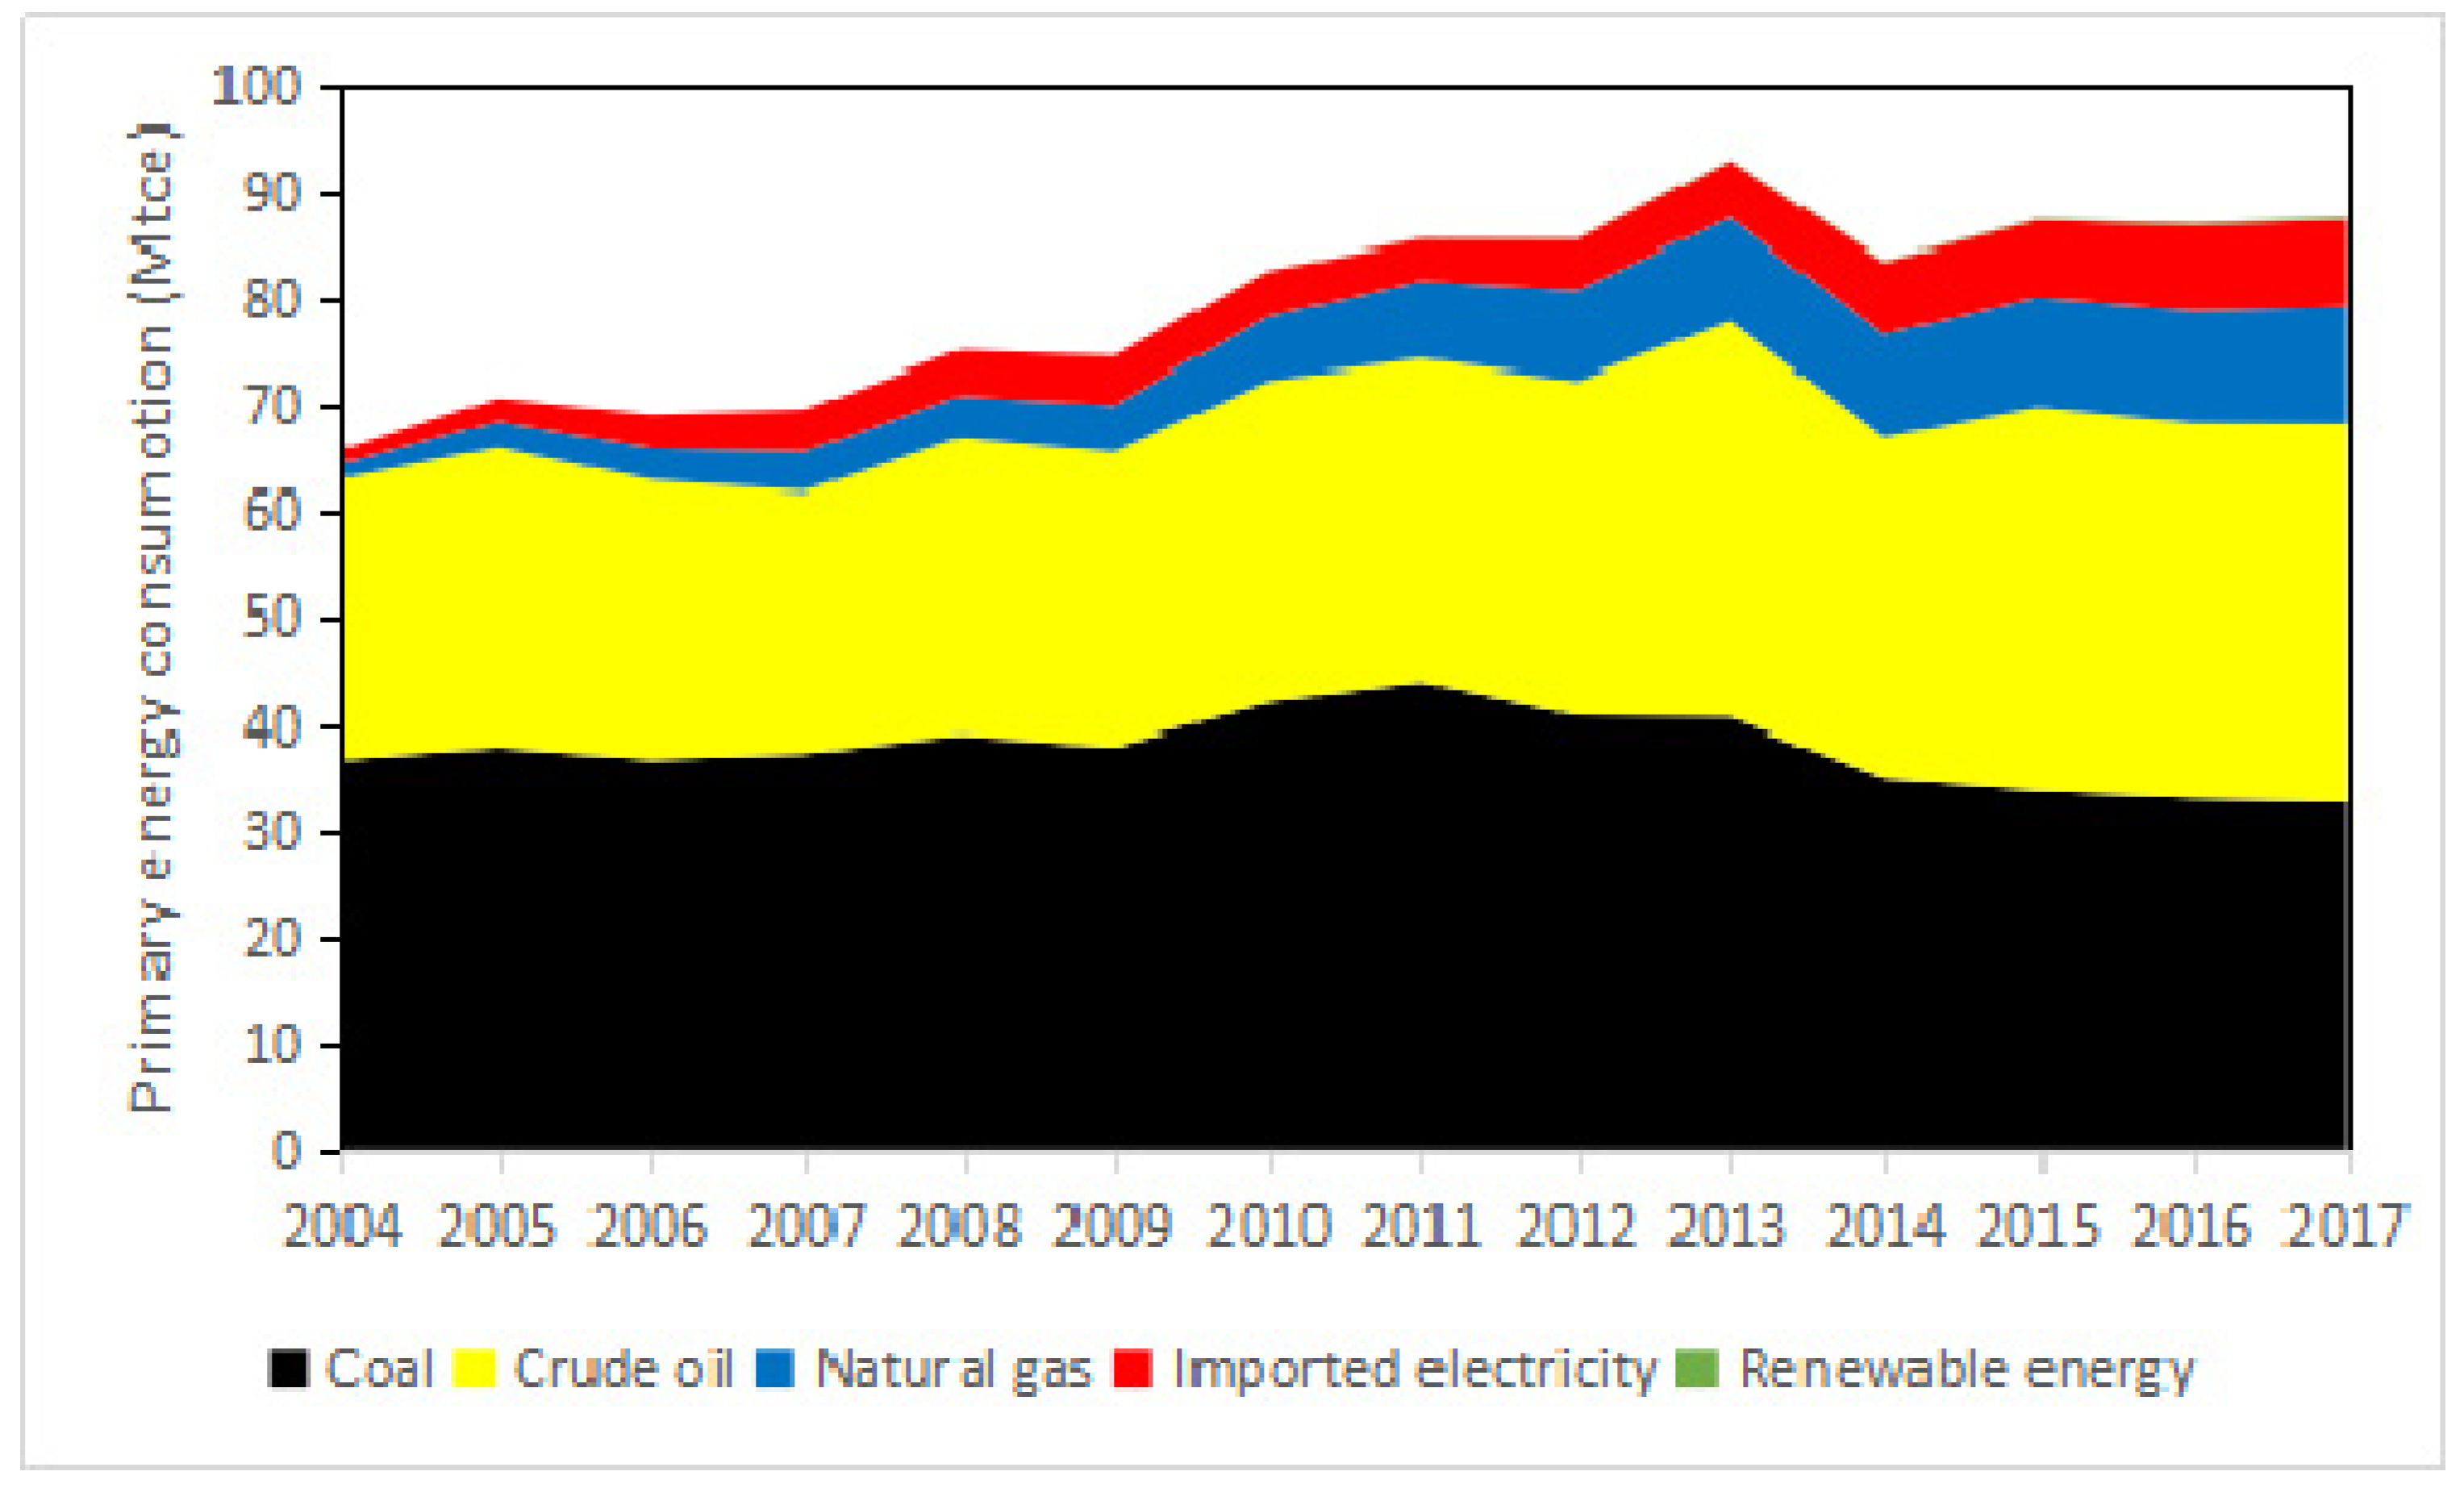
2.1. Background of Energy Consumption Situation in Shanghai

Shanghai, the economic center of China, has a large population of over 24 million, and consumes the most energy in China. The city is also one of the regions that has the highest per capita carbon emissions level and energy consumption per capita GDP. In 2015, the total energy consumption in Shanghai reached 113 million tons of coal equivalent (Mtce) [25], which is more than double compared to 2000, far exceeding the energy consumption of Beijing (68.5 Mtce), Guangzhou (54.9 Mtce) [26], and Shenzhen. During the 10th Five-Year Plan period, the total energy consumption increased rapidly with an average annual growth rate of 8.4% due to the increasing demands of economic development. Five years later, during its 11th Five-Year Plan period, with the implementation of the energy saving and emission reduction policies, and with the advent of World Expo in Shanghai, the energy intensity in Shanghai was reduced significantly, which slowed down the total amount of energy consumption, while the average annual growth rate was still around 6.4%. In the 12th Five-Year Plan (FYP) period, given the background of the national economic transformation and the optimization of the industrial structure, the energy consumption in Shanghai showed negative growth for the first time in 2014, with an average annual growth rate of only 0.4%; the energy intensity has also reduced to about 0.45 tce per 10 thousand CNY [27].
In the total energy consumption of Shanghai, secondary industry accounted for the highest proportion, followed by tertiary industry and the residential sector, and primary industry occupied the smallest proportion during the period 2001–2017. After industrial structure optimization, the proportion of consumption of tertiary industry increased significantly. The energy consumption of secondary industry was still the largest, but both the growth rate and proportion have decreased markedly. The total volume and consumption share of the primary industry have shown a decreasing trend, occupying 0.62% in 2014 [27]. Conversely, the proportion of energy consumption in the residential sector continued to increase.
As shown in Figure 2, fossil-fuel-based energy occupied a large proportion of the primary energy consumption of Shanghai, with 95% in 2004; by 2014, it decreased by 13%, accounting for 82%. The proportion of coal decreased most obviously from 56% in 2004 to 38% in 2014, which benefited from the “Decreasing Coal” energy structure adjustment policy. Crude oil consumption in Shanghai showed an overall fluctuating upward tendency; its proportion was around 36–40%. The proportion of clean energy, such as natural gas and electricity, has increased considerably. The ratio of natural gas rose from 1.93% in 2004 to 9.82% in 2014, and the average annual growth rate of its consumption was 21%. Due to the lack of local primary energy sources, imported electricity from nearby regions increased significantly with the increase in local energy demand, the proportion of which increased by 6.2% in the past decade, reaching 8.2%.

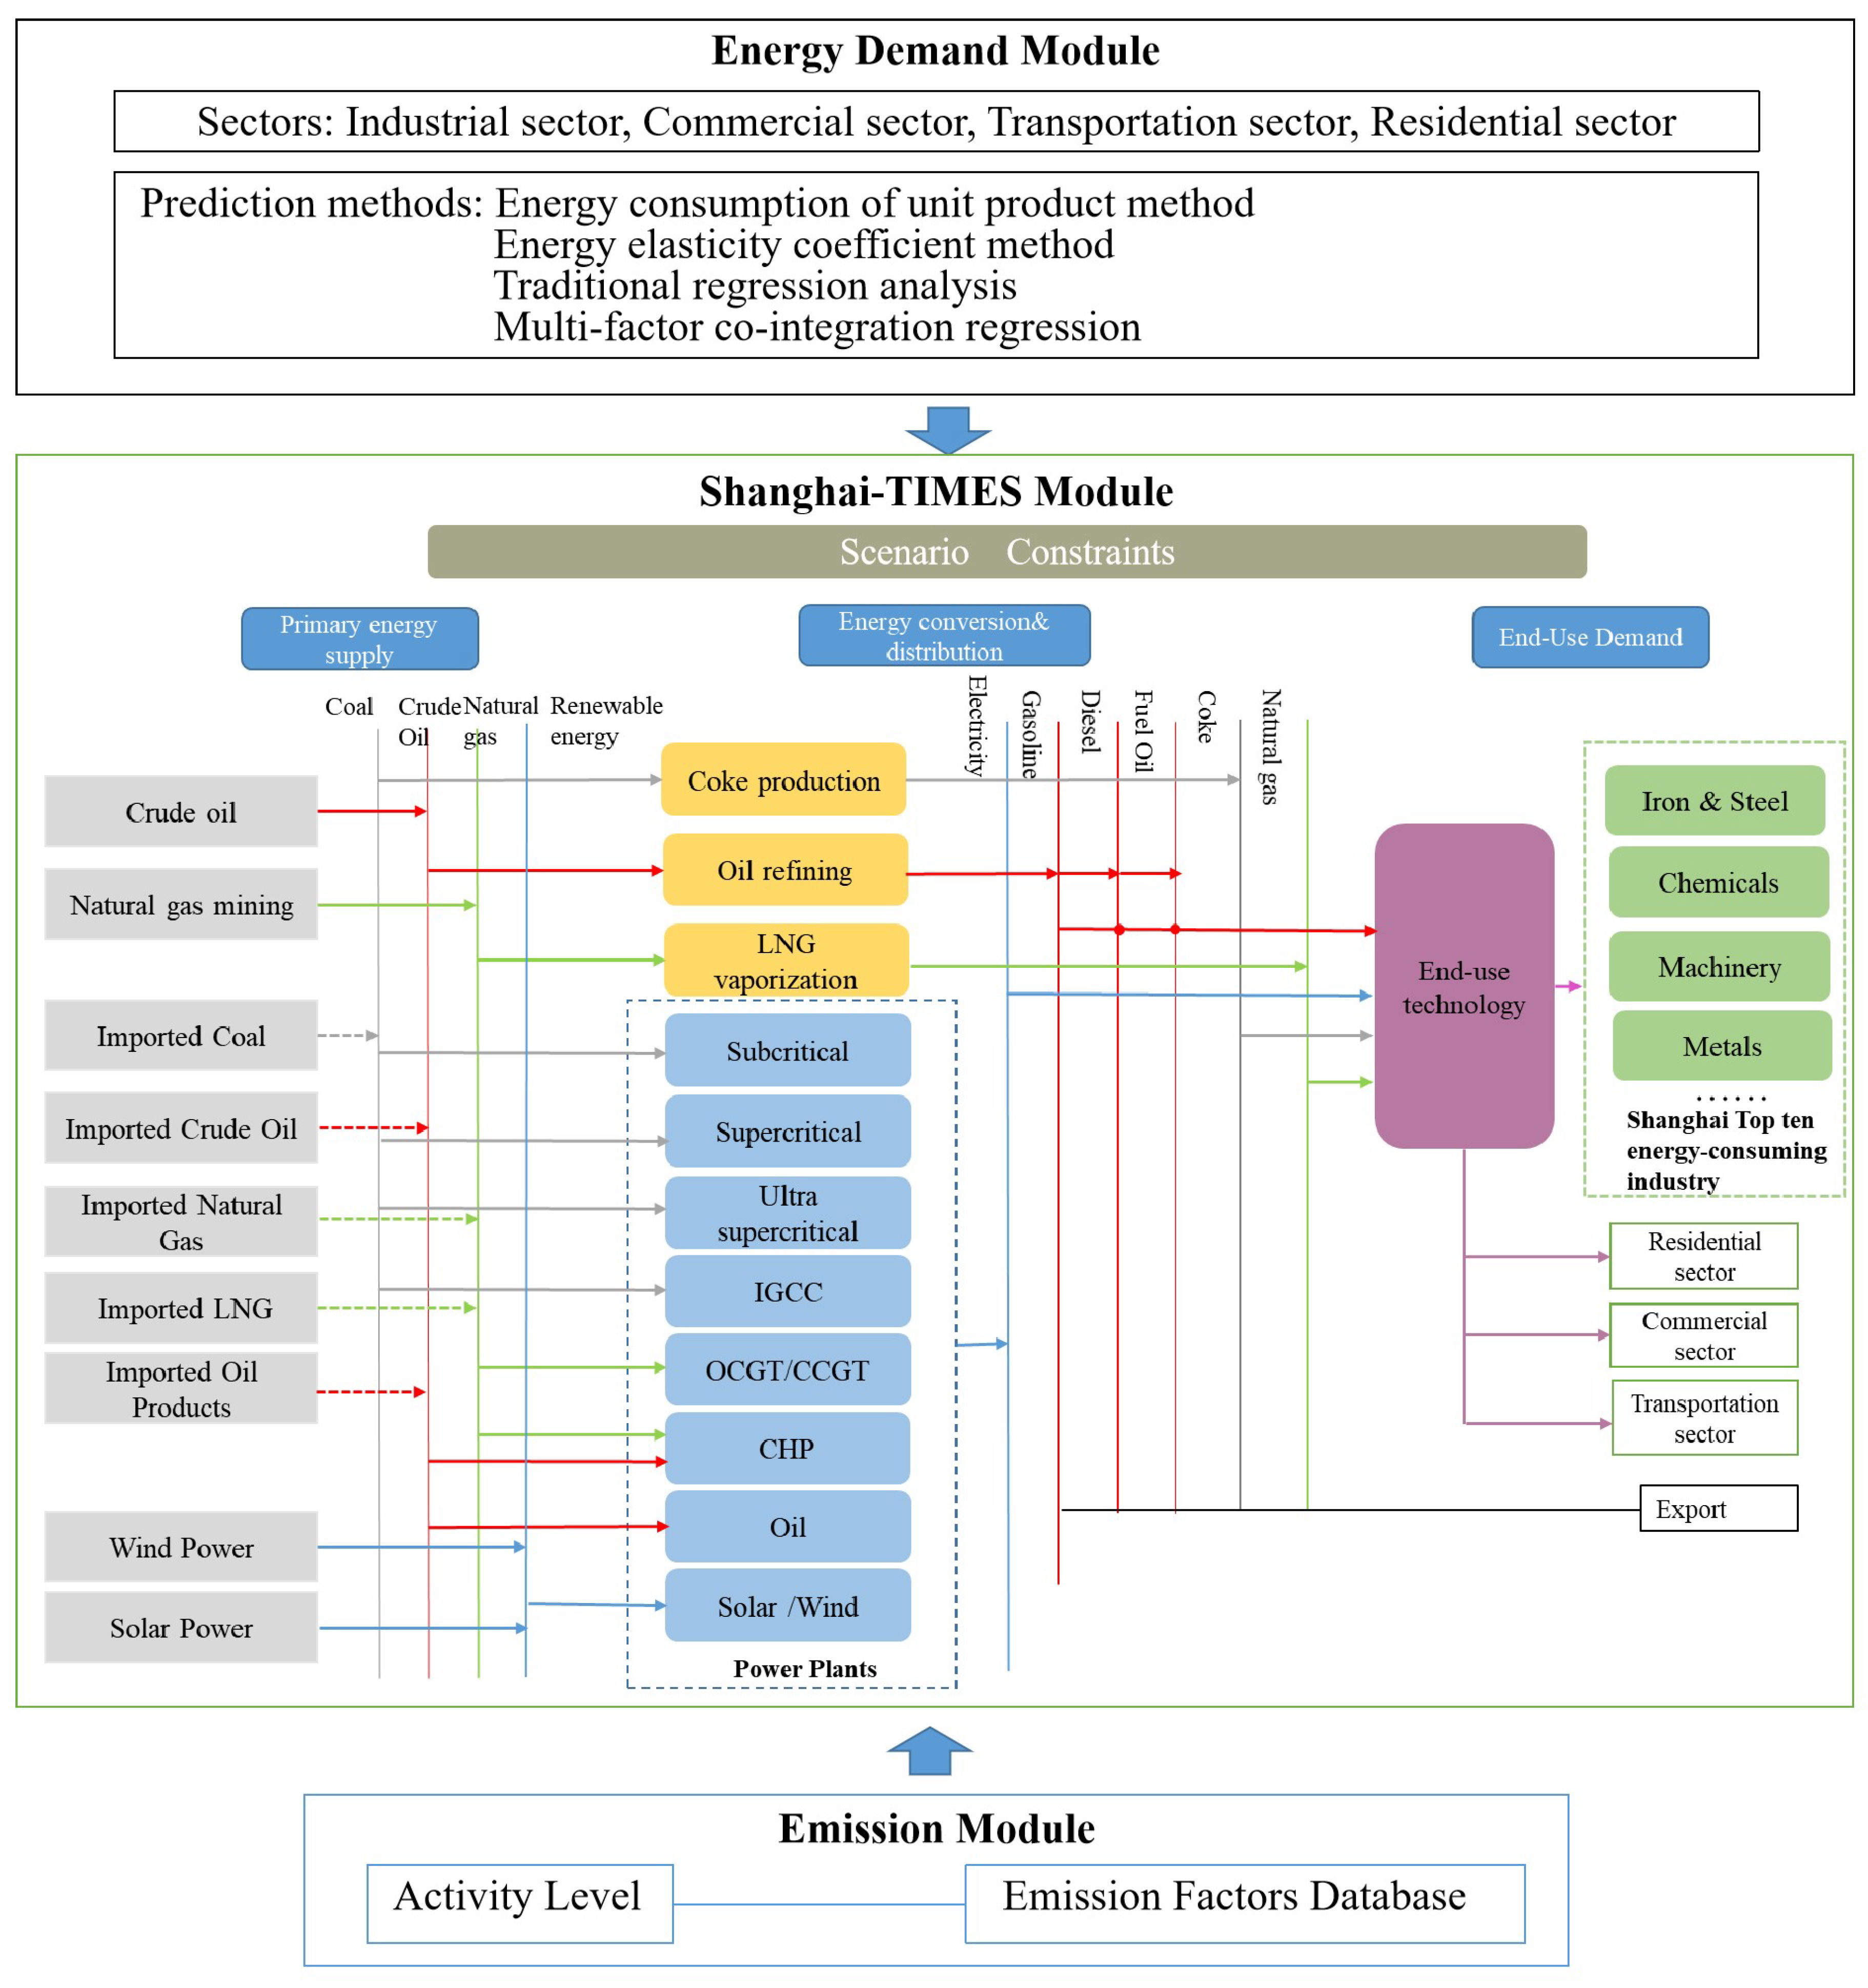
2.2. Model Structure

The REESO model was developed in this study, as shown in Figure 3. Built on the TIMES model, REESO is a target-oriented optimization model for the energy–environment system that analyzes and forecasts energy demand and its related CO2 and LAPs emissions under alternative strategies. The model has energy demand, energy-using and emission modules. The energy demand module forecasts the end-use energy service demands considering economic factors, population, energy prices, etc. It acts as the input of the TIMES model, which is the core of the energy-using system module. The emissions module includes the energy related emissions of CO2 and LAPs (refer to SO2, NOx, PM10, PM2.5 in this study).

2.2.1. Energy Demand Module

The energy demand module, as the driver of the Shanghai-TIMES module, covers four major end-use energy consumption sectors: the industrial, commercial, transportation, and residential sectors. Since the agricultural sector only accounted for 0.62% of the energy consumption in 2014, and a continuous tendency to decline has been observed, the agricultural sector was excluded in this model. Based on the department analysis method and the characteristics of energy consumption in the end-use energy sector, we adopted different energy forecasting methods to predict the future energy demand for each terminal energy sector. For the residential and commercial sectors, we utilized the multi-factor co-integration regression. Referring to the studies of the World Bank and other agencies, a regression relationship exists between the regional traffic volume and its per capita GDP. Therefore, a traditional regression analysis method was adopted to predict the freight and passenger volumes in the transportation sector. As for the industrial sector, the chemical and iron and steel industries adopted the energy consumption per unit product and other industries adopted the energy elasticity coefficient method.

2.2.2. Shanghai-TIMES Module

Based on the Reference Energy System, the TIMES model builds an energy flow diagram that includes various energy extraction, processing, conversion and distribution, and end-use applications to provide an exhaustive description of real-world energy systems. The Shanghai-TIMES models the energy system in terms of its supply sector, power generation sector and the demand sectors, covering 88 types of energy-using technologies.

Supply Sector

The supply sector contains the indigenous energy production and exogenous import and export. In the Shanghai-TIMES model, the supply side encompasses 17 kinds of energy carriers, including primary energy such as coal, natural gas, oil, wind, and solar; and secondary energy such as coke, coke oven gas, other coking products, gasoline oil, kerosene oil, fuel oil, diesel oil, liquefied petroleum gas (LPG), compressed natural gas (CNG), liquefied natural gas (LNG), electricity and heat. Shanghai owns a certain proportion of the secondary energy processing industry, mainly referring to 12 kinds of energy processing technologies, including 7 technologies for crude oil refining and 3 technologies for hard coal processing, which convert natural gas to CNG and LNG to natural gas, respectively. The fuel prices and primary energy supply potentials are viewed as key inputs to the supply sector.

Power Generation Sector

The Shanghai-TIMES model defines 14 power plant technologies to represent current and future power generation capacities. According to the energy types, these technologies are categorized as follows:
  • Coal-fired power plant: small coal-fired power plant, subcritical coal-fired plant, supercritical coal-fired plant (SCPC), ultra-supercritical power plant (USCPC) and Integrated Gasification Combined Cycle power plant (IGCC).
  • Oil-fired power plant: fuel includes fuel oil and diesel oil.
  • Natural gas power plant: Open Cycle Gas Turbine power plant (OCGT) and Combined Cycle Gas Turbine (CCGT) power plants.
  • Dual fuel power plant: fuel includes oil and natural gas.
  • Renewable power plant: wind power plant and solar power plant.

Demand Sectors

According to the consumption situation in Shanghai, the end-use energy demand sectors comprise the industrial, commercial, transportation, and residential sectors. The industry sector covers the top 10 most energy-consuming industries, namely the iron and steel, chemicals, oil processing, plastics, minerals, metals, general and special machinery, transport equipment, textile, and power and heat generation industries.

2.2.3. Emission Module

The emission module was set to calculate the energy related emissions of CO2 and LAPs in Shanghai, in which the technology-based emission factors database was built.

CO2 Emission

In this study, we used the sectoral approach to calculate CO2 emissions. The equations for calculating CO2 production is as follows:
F L O C O 2 = F L O t , f , j ε j , C O 2
ε j , C O 2 = C C j O j 44 12
where F L O C O 2 is the total emission of CO2; F L O t , f , j is the activity data of technology t using fuel j in sector f; ε j , C O 2 is the localized carbon emission factors of fuel j; C C j is the qnet of fuel j, O j is the carbon oxidation rate of fuel j.
Carbon emission factors (Table S1) in this study mainly referred to the study on greenhouse gas inventory in China [28].

LAPs Emissions

To localize the emission factors of stationary combustion sources, we mainly referred to previous studies [5,11,12,29,30,31,32,33]; for the emission factors of mobile sources, we cited the research results of Cai et al. [34], as shown in Table S2.

3. Model Verification and Future Scenarios Definition

3.1. Historical Simulation and Model Verification

To verify the rationality of the model simulation and evaluate the risk of the model, we constructed a historical scenario to simulate the emission of CO2 and LAPs and compared its results with emission inventories. Since the detailed industry classification data in the years 2004, 2007, 2012, and 2014 were available in the Shanghai pollutant emission inventory, the corresponding time scale of the simulation of the historical scenario was set to the period of 2004–2014. The energy demand data in Shanghai-TIMES model were obtained from the Shanghai Energy Statistical Yearbook [27]. According to the planning policy objectives and the actual situation, the constraints of the historical scenario were defined as shown in Table 1.

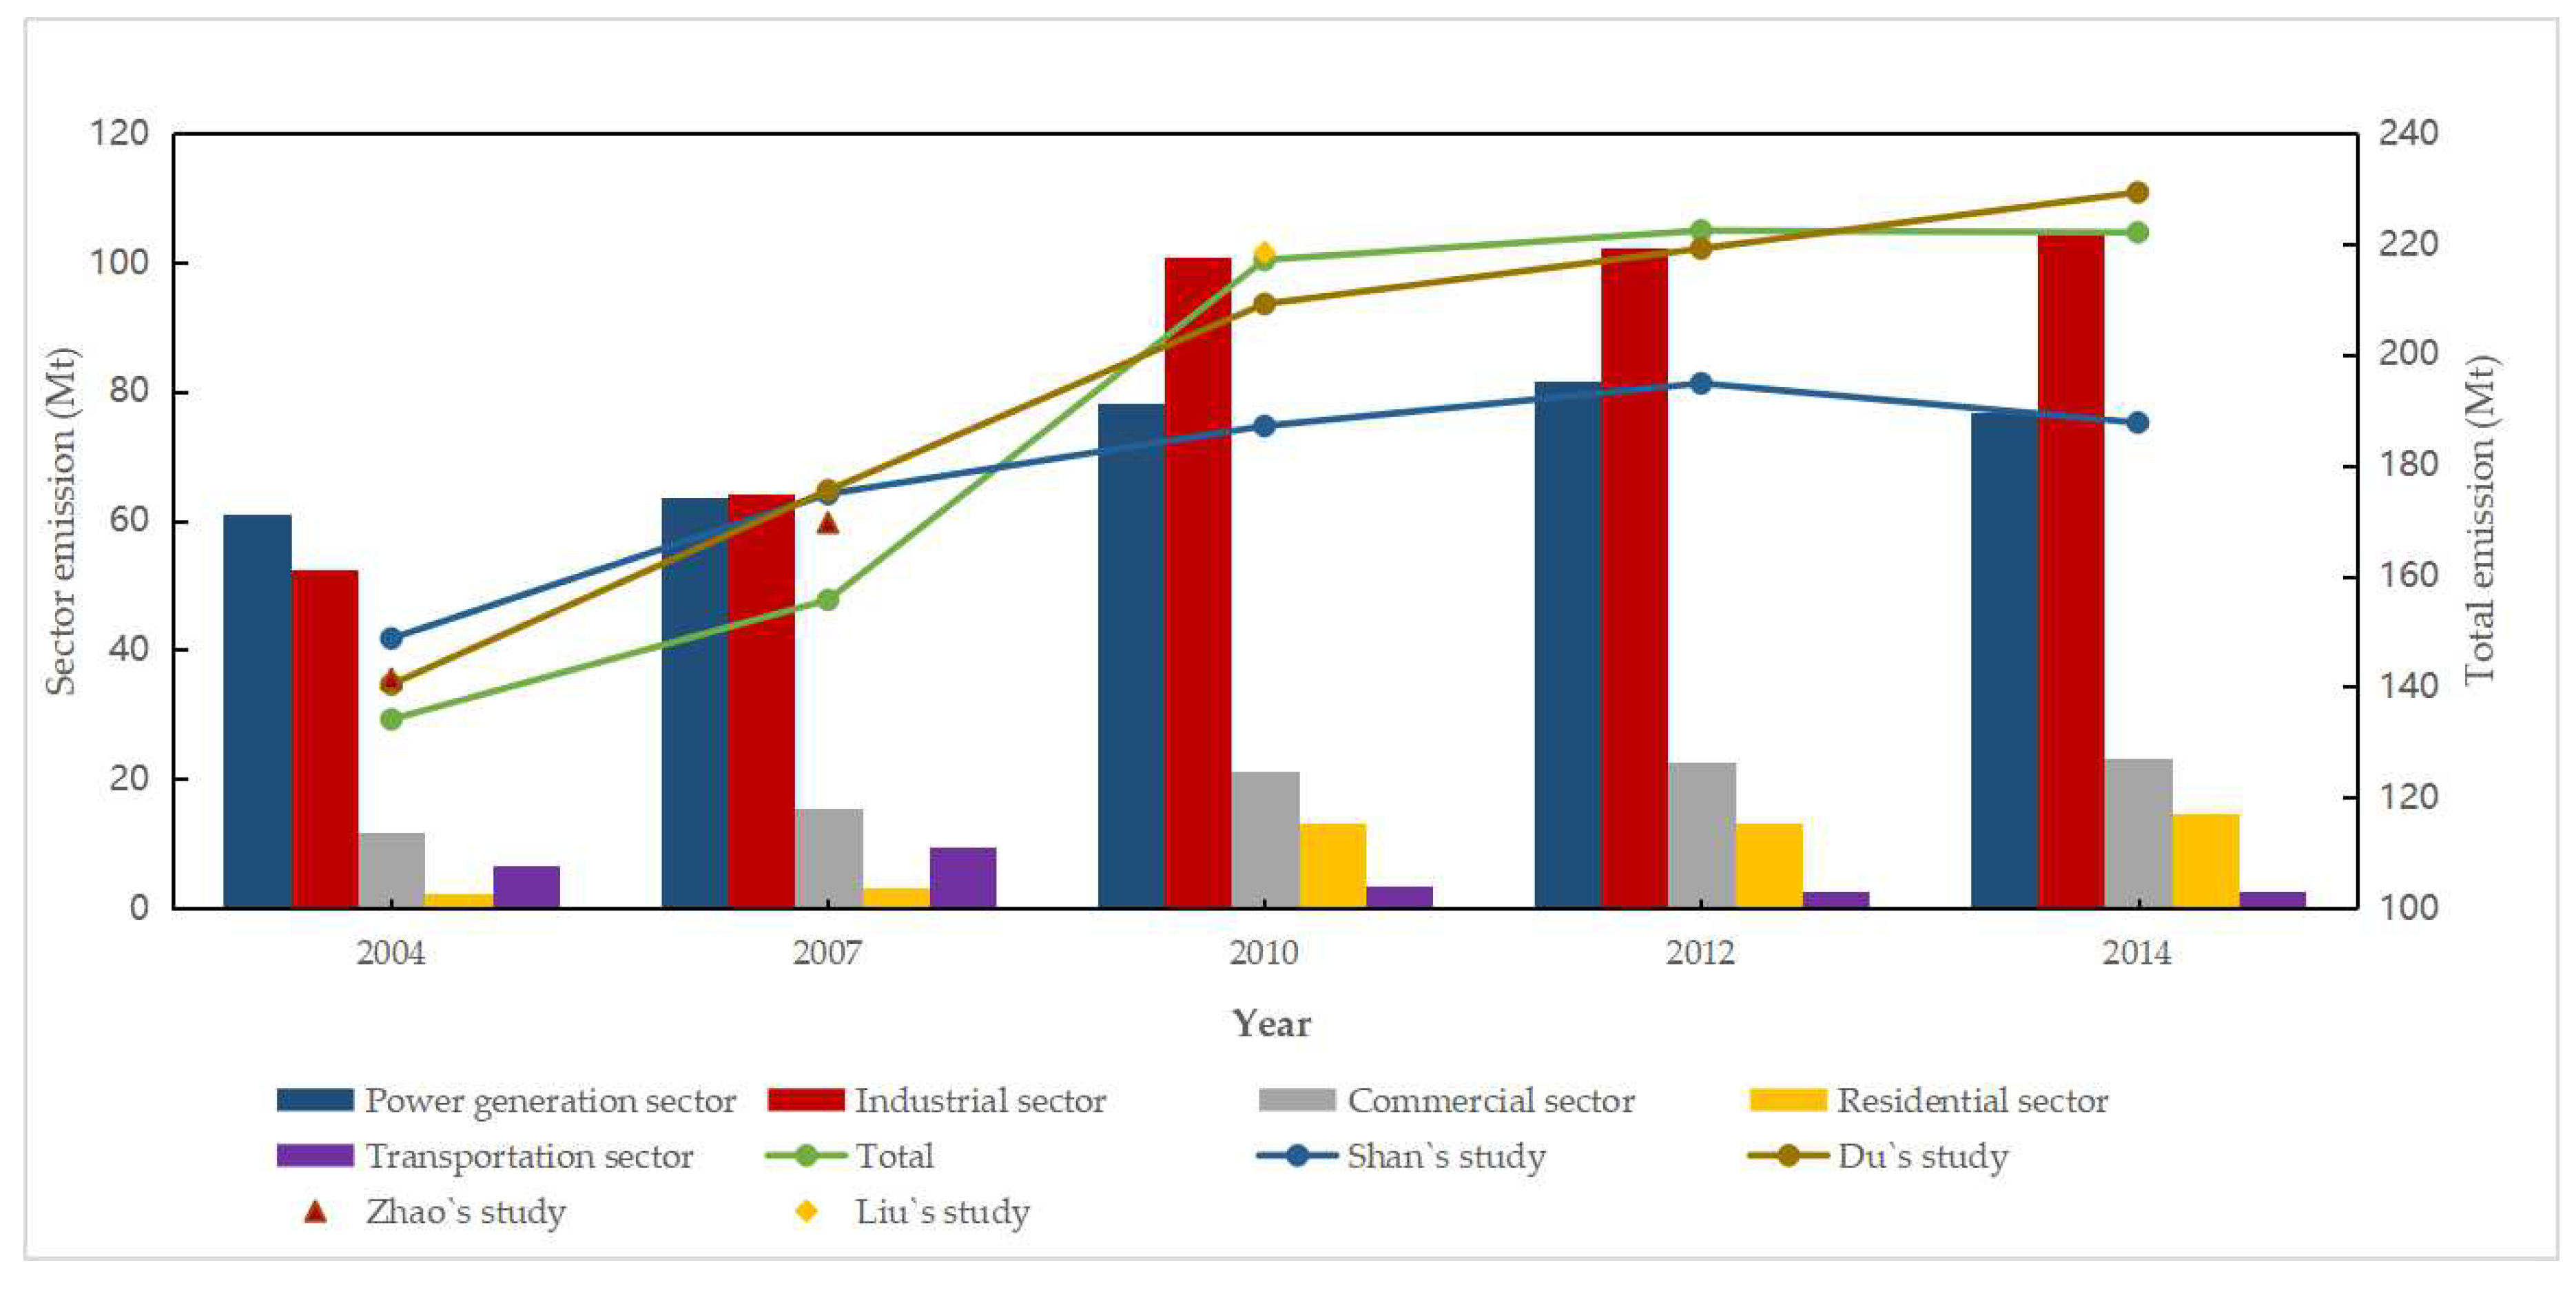
3.1.1. CO2 Emissions

Table 2 reveals the simulated results of CO2 emission in the historical scenario. From 2004 to 2010, the emission of carbon dioxide in Shanghai increased sharply as energy consumption rose rapidly. During the 12th Five-Year period, a slow rise in CO2 emissions occurred. In 2014, the total energy consumption of Shanghai decreased, due to the effective implementation of the energy consumption control policy and the zero-growth in coal policy. CO2 emissions also declined in the same year. However, these findings were only short-term fluctuations in the energy system that resulted in a drop in CO2 emission, while it did not reach its peak. The power generation and the industrial sectors are the main sources of CO2 emissions, followed by the commercial and the transportation sectors. The proportion of CO2 emission in the power generation sector decreased by year, while CO2 emissions from the commercial and transportation sectors increased gradually, accounting for 11% and 7% of the total emissions, respectively, in 2014.
As shown in Figure 4, we compared the simulation results with data from other research. Our estimation of total CO2 emissions is 15.7% higher than the one estimated by Shan’s research [35], which referred to the China Emission Accounts and Datesets (CEADs) in 2014. The gap mainly came from the activity data sources. Compared with the studies conducted by Du [36], Zhao [37], and Liu [38], the simulated results were much closer for about 1.3–11%. In addition, Xie et al. [39] calculated CO2 emissions of Shanghai in 2007: 71.3 million tons from the power generation sector, 69.3 million tons from the industrial and construction sector, 4.05 million tons from the residential sector and 47.9 million tons from the transportation sector. The emission values from the above departments were similar to those of this study except for the transportation sector. In the calculation of carbon emission in the transportation sector, Xie et al. adopted the carbon footprint method, and included the CO2 emissions caused by energy consumption of aircraft and ocean ships, which were not considered in this study.

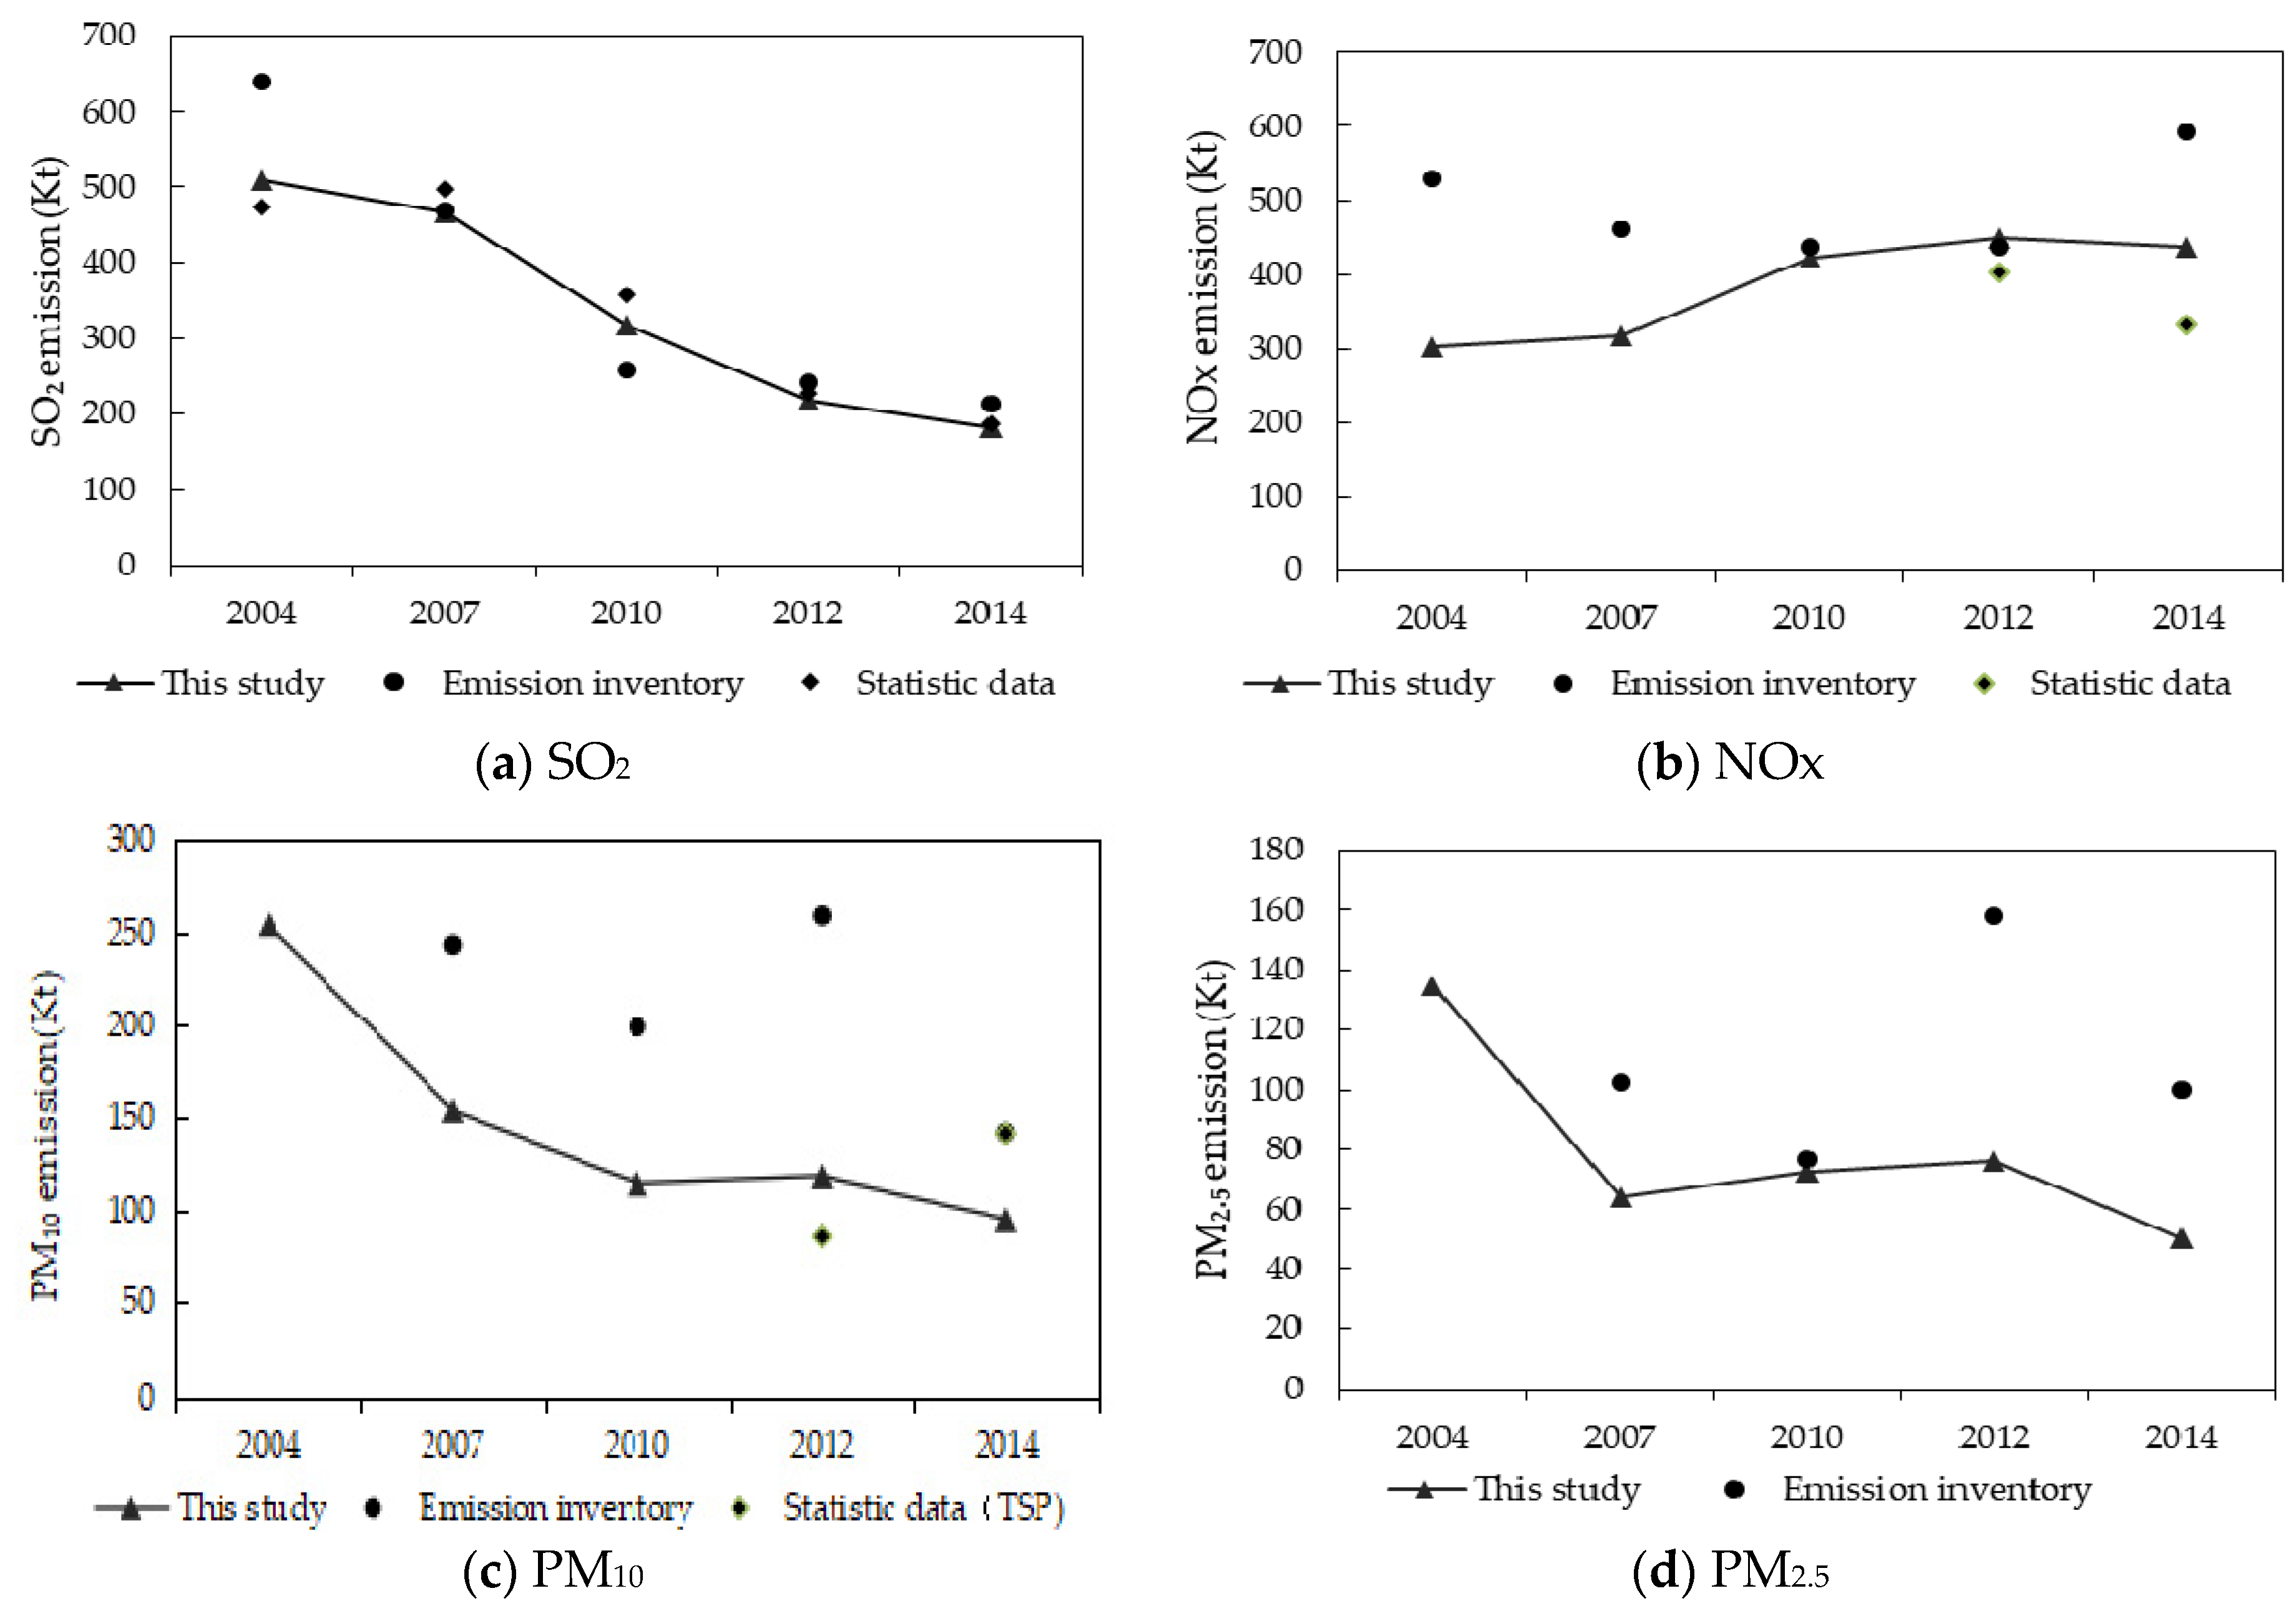
3.1.2. Local Air Pollutants Emissions

We calculated local air pollutants (SO2, NOx, PM10 and PM2.5), which are closely correlated to energy use. A comparison between historical simulation results and historical emission inventories is shown in Figure 5. Shanghai emission inventory data were mainly obtained from Wu (2004) [40], the Shanghai Institute of Environmental Sciences (2007, 2014), and the Shanghai Environmental Monitoring Center (2010, 2012). In addition, the statistical data were from the Yearbook in National Data [26]. According to the list of sources, this study excluded emissions that were not related to energy use, such as road dust, storage tanks, and agricultural production sources.

SO2 Emissions

In the simulation results, due to the installation of the desulphurization end-of-pipe treatment equipment, the energy-related SO2 emissions in Shanghai declined each year, from 509,000 tons in 2004 to 151,000 tons in 2014, which is consistent with emission inventory data, despite its lower total amount. SO2 emissions per the Shanghai Statistical Yearbook in 2014 were 188,000 tons, which is closer to the simulation results in this study.

NOx Emissions

With increasing of energy consumption, especially in oil consumption, NOx emissions increased each year. This trend was not mitigated until 2010 when the end-of-pipe denitrification equipment was installed, resulting in a fairly close result between the simulated and the inventory values for NOx emissions in 2010 and 2012. The simulated emission of NOx of 2014 was 436,000 tons, which was lower than the inventory-calculated value of 592,000 tons, but still higher than the value reported by National Statistics Data (332,000 tons). The simulated emission value gradually declined in emission after 2010, which agreed with the trend revealed by national statistical data. Comparing the 2004 and 2007 data, the simulated value and the inventory value differed, especially for 2004. The cause of the difference might be the use of different emission factors.

PM10 Emissions

Under the control of the terminal dust removal facilities, PM10 emissions decreased significantly in 2004–2010, then slightly increased in 2012, and decreased again in 2014. The overall change trend was consistent with that of the inventory values. The simulation results were between the inventory data and the national statistical values. Fu et al. [9] calculated that the PM10 emission in 2010 was 86,100 tons, which was close to the simulated value of 115,000 tons in this study.

PM2.5 Emissions

PM2.5 emissions decreased significantly between 2004 and 2007, and then slowly increased after 2007, and declined significantly from 2012 to 2014. The simulation values in 2010 were close to those of the inventory data. As for the emission of PM10 and PM2.5 in 2012, the inventory values were higher than that of the simulated values (72,600 tons), but the overall decline trends during the period 2012–2014 were identical.

3.1.3. Model Feasibility and Risk Evaluation

According to the analysis of the simulation results based on the historical scenario, we found that the model is feasible for the prediction of carbon dioxide, and local atmospheric pollutants emissions. As the core of framework, the TIMES model is based on the principle of attaining the lowest cost of the entire energy system, which might have a certain degree of limitation on the result. In the building of the REESO model, joint modeling is performed by other related economic and technical models, and exogenous parameters based on Shanghai energy system are assumed, such as the future development route of some alternative energy use technology, some traditional energy reserve market share, and so on, to obtain reliable basis. Using constrained scenarios, the model can produce an accurate simulation of the real energy system and environmental emissions, and is accurate for future prediction simulation.
By performing historical simulation using the REESO model, we verified that the model produces accurate simulation effects for CO2, SO2, NOx, PM10 and PM2.5. The risk of future simulation likely depends on the rationality of future scenario constraints. However, the accuracy of the exogenous model parameters affects the risk. To control the risk of the model, the future prediction of the model took 2010 as the base year, with the two calibrations for 2010 and 2015.

3.2. Scenerio Definitions

To simulate the energy system and emissions, as well as to explore the response of the energy and environmental systems in 2030 from policy, technology and costs perspectives, a Business-as-Usual (BAU) scenario and three policy scenarios were defined. The policy scenario considers all profound significances of policies and regulations that have taken effect, including Shanghai’s 13th Five-Year Plan, the Environmental Tax Law and the future development possibilities that include a carbon tax and bans on traditional fuel vehicles. These constraints categorize these issues into three components, namely the energy control policy (includes energy consumption control and structural adjusting), economic measures (mainly refers to environment tax and carbon tax), and technological measures (mainly includes renewable power generation and new energy vehicles). We quantified the relevant mentioned parameters based on the policies and regulations and defined three scenarios based on different implementation strengths: loose policy (LP) scenario, moderate policy (MP) scenario, and strict policy (SP) scenario.

3.2.1. BAU Scenario

In this scenario, it is assumed that the policies, as well as development trends in the energy system, related energy conservation and emission reduction technologies will maintain the situation as that at the end of 2015. On the energy supply side, the primary energy structure is not constrained, while the annual increase in the import electricity has an upper limit of 199 petajoules (PJ). In the energy conversion sector, the activity data and efficiency of power generation are based on the situation in 2010. The energy demand is consistent with the policy scenario.

3.2.2. Three Policy Scenarios

The three policy scenarios are defined in Table 3.
The parameters and contents of the MP scenario are consistent with the policies that have taken effect. The energy control policy parameters mainly refer to Shanghai’s 13th FYP, in which the total energy consumption is targeted to be no more than 125 million tce, whereas the proportion of coal usage in primary energy is expected to be 38% in 2020. Therefore, in MP policy scenario, the constraints in 2020 are the same as that of the Shanghai’s 13th FYP. Considering the historical growth, we assumed that the energy consumption will maintain an annual growth rate of less than 3.7% during the period 2020–2030, reaching 180 million tons in 2030, depicting a primary energy consumption pattern with less than 33% coal usage and more than 14% natural gas usage. The total energy consumption constraints in the LP scenario are defined as 135 million tons in 2020 and 200 million tons in 2030; in the SP scenario, the figures for the above constraints are controlled at 115 and 150 million tons, respectively.
In terms of economic measures focusing on environmental taxes, the Environmental Protection Tax Law of the People’s Republic of China, which was officially enacted at the beginning of 2018, stipulates that a “tax on behalf of fee” shall be levied. The applicable tax rate for air pollutants in Shanghai has been clearly defined, the price is shown in Table S3. Based on the tax threshold, the price will be adjusted once every five years. Each adjustment will impose an increase of 20% in the LP scenario, 40% in the MP scenario and 60% in the SP scenario. There is no agreement on whether to include carbon tax in the environmental tax and when it will take effect, but in the context of climate change, Shanghai, as a first-tier city, must achieve the goal of reaching its carbon emission peak by 2030.
For energy-saving technology, the development of new energy power generation technology and new-energy vehicles was mainly considered. The new round of energy conservation and environmental protection planning in Shanghai estimates that the proportion of new energy and clean energy buses will be more than 50% by 2020, whereas the installed capacity of wind power and photovoltaic power will reach the expected target of 1.4 and 0.8 million kilowatts, respectively. The Ministry of Industry and Information Technology has proposed that traditional fuel vehicles will be gradually withdrawn from the market. The change in energy technologies being used to power vehicles will significantly impact the emission of air pollutants in the transportation sector, especially on the reduction of nitrogen oxides, as well as on the consumption of oil products. In the LP scenario, the development of energy-saving technology was not set as a constraint.

4. Results and Analysis

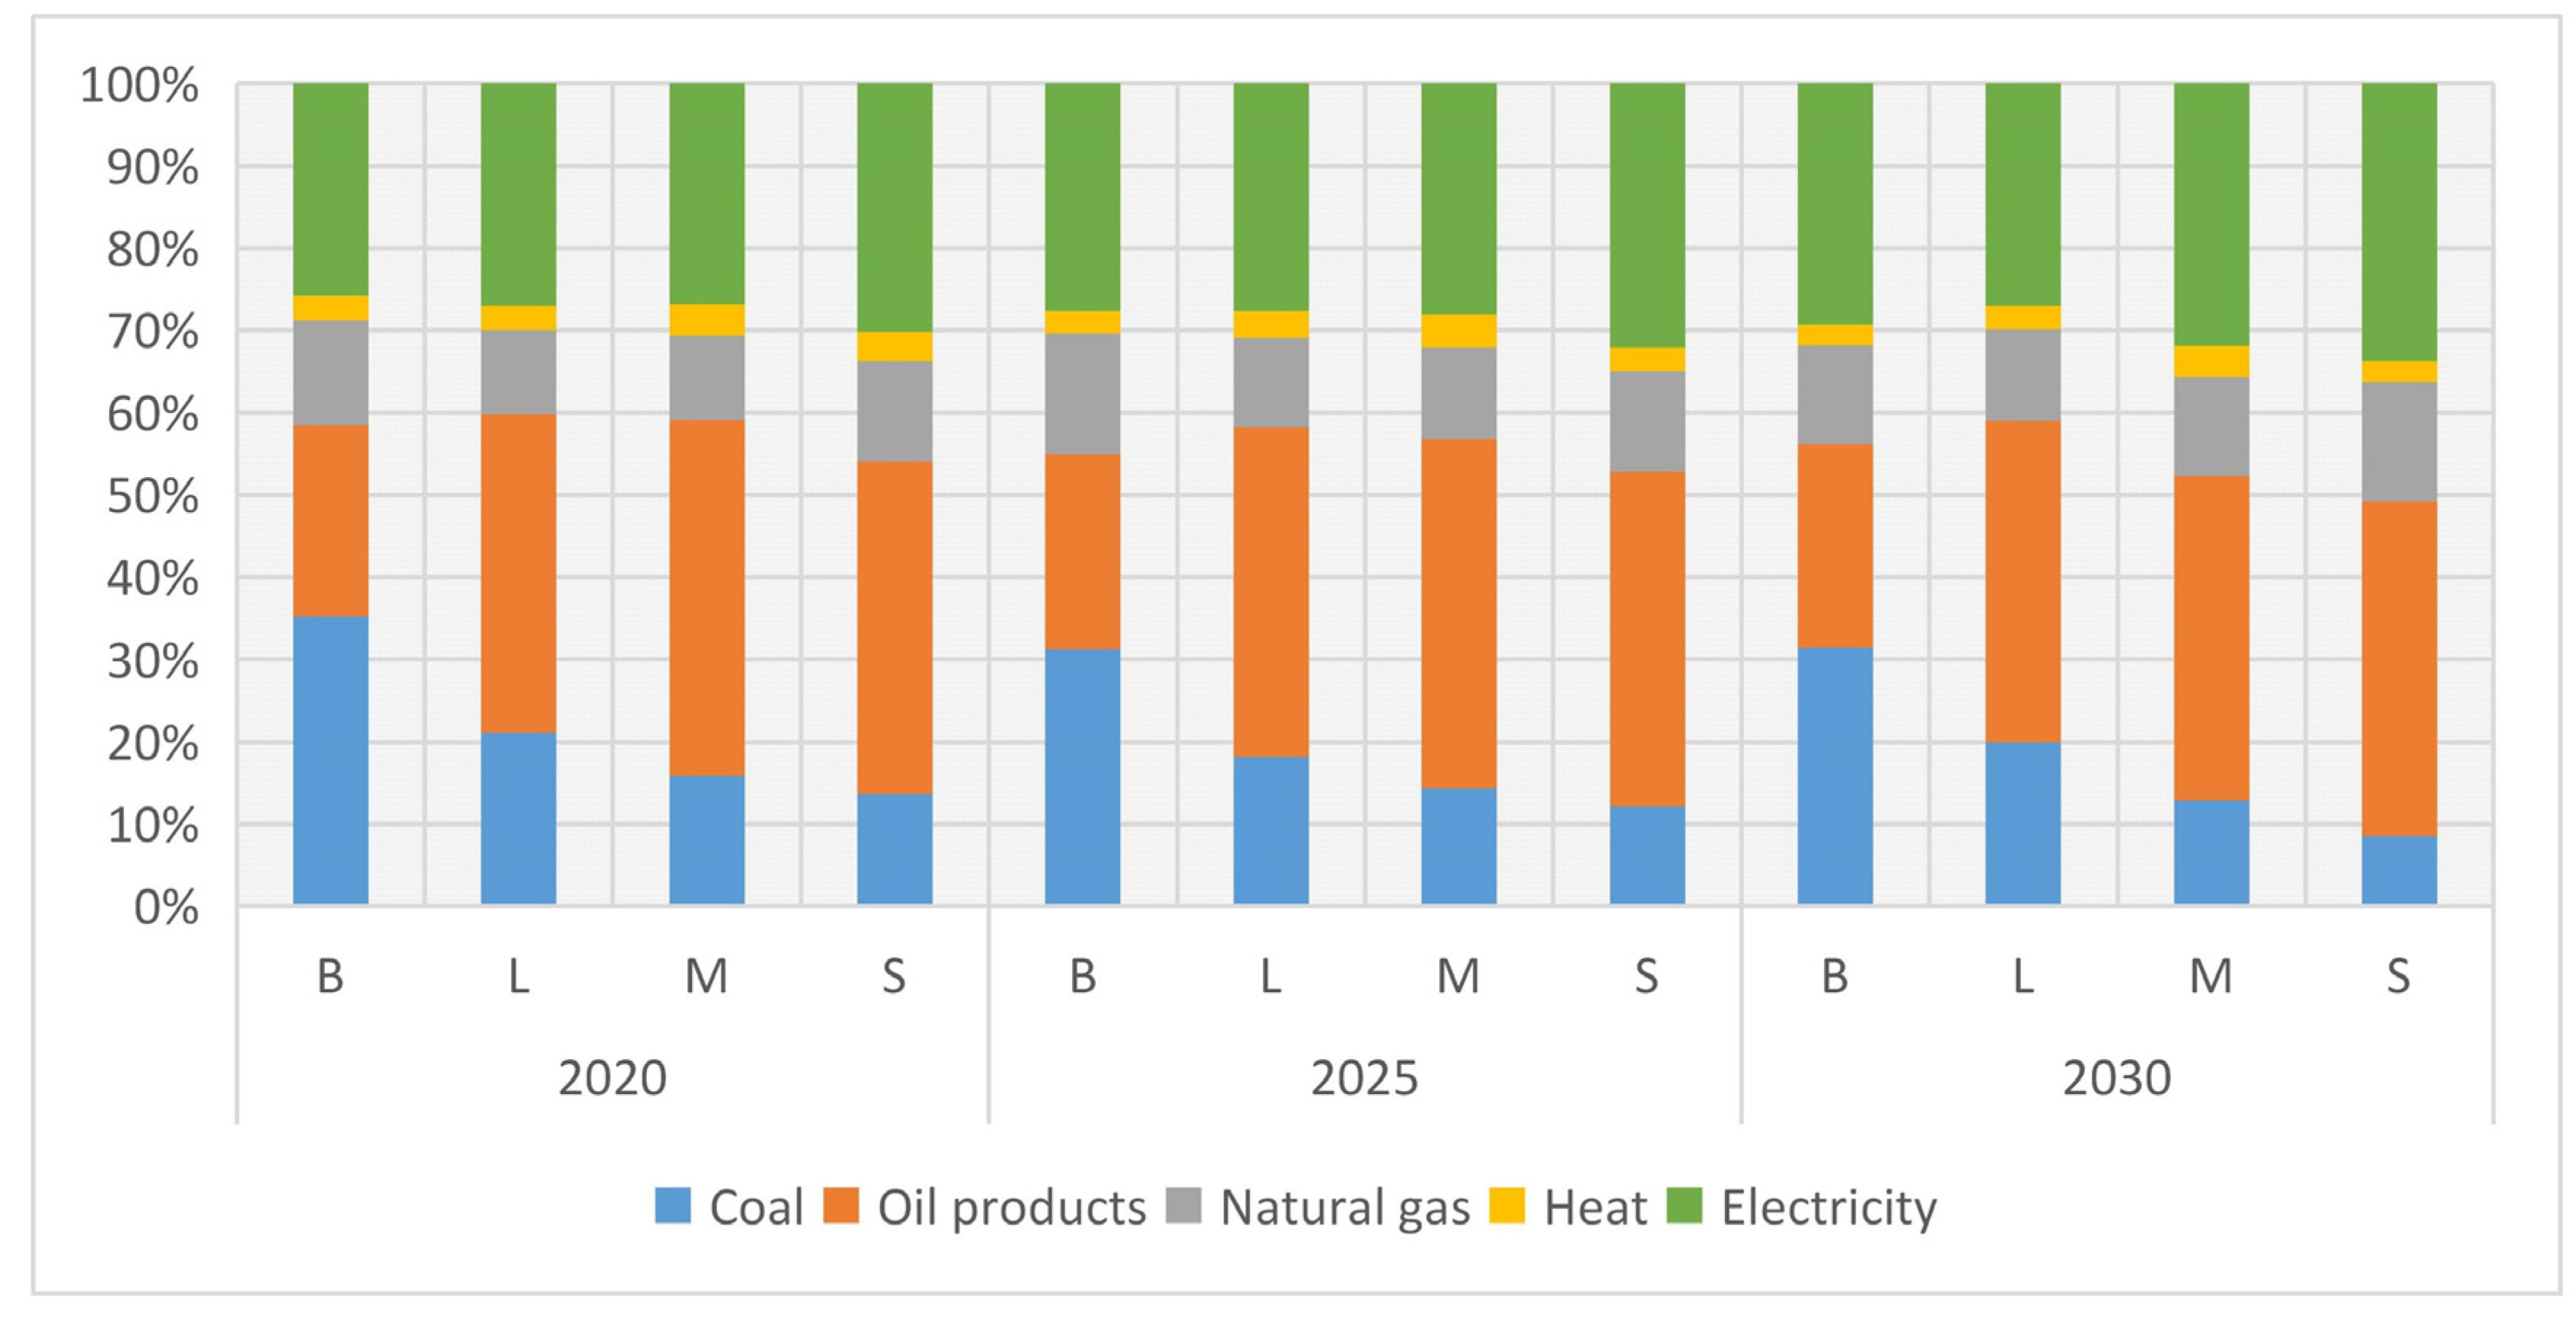
4.1. Energy Consumption

The total energy consumption in Shanghai will increase over time in all four scenarios (see Table 4). Under the BAU scenario, energy consumption will reach 1.56 Mtce in 2020 and 2.03 Mtce in 2030. Due to the constraints imposed by the energy policy, the growth of energy consumption in three policy scenarios is significantly slower than that in the BAU scenario. Total energy consumption is 1.34 Mtce (2020) and 1.86 Mtce (2030) under the LP scenario, 1.24 Mtce (2020) and 1.76 Mtce (2030) under the MP scenario, 1.19 Mtce (2020) and 1.62 Mtce (2030) under the SP scenario.
Compared with the BAU scenario, the policy scenarios can effectively control the increase in the terminal energy demand by implementing energy constraint policies, economic means, and technology updates to achieve total amount control. In the period of 2020–2025, the growth rate of energy conversation in the MP scenario is higher than that of the SP scenario, which means that the marginal benefits of policies and measures under the MP scenario are more evident.
The structure of the future energy demand in Shanghai by major end-use carriers is shown in Figure 6 under the four scenarios in 2020, 2025, and 2030. Because the BAU scenario is not subject to energy policy constraints, driven by the price of energy and technology, the lower-priced coal products will be the prioritized selection for fuel, and higher-priced oil products will become obsolete. The comparison of natural gas consumption in the different scenarios before 2030 revealed the ranking as follows: BAU > SP > MP > LP. The total consumption in the BAU scenario is relatively high; natural gas consumption in 2020 will be 75 PJ more than that in the SP scenario. By 2030, the natural gas consumption of the SP scenario will be 593 PJ higher than that of the BAU scenario, and BAU scenario still consumes more natural gas than under the MP and LP scenarios. The proportion of terminal electricity consumption to total energy consumption is strictly controlled. The proportion of electricity under the SP scenario is significantly higher than that of the other scenarios. The high carbon tax and environmental tax in the SP scenario encourage the industrial sector to choose electricity as the terminal energy because of more stringent energy conservation technology replacement, especially in the transportation sector.

4.2. CO2 Emissions

The simulation results of CO2 emission under the different scenarios are shown in Table 5.
In the BAU, LP and MP scenarios, the total amount of carbon dioxide emission continues to increase, and can hardly reach its peak by 2030. The peak only occurs under the SP by 2030, and the peak carbon emissions is 253.35 Mt. The MP scenario was defined in accordance with the planning constraints of 13th Five-Year Plan, with the carbon tax control means added. However, according to the results of the model calculation, the emission of carbon dioxide in Shanghai in 2020 is 2.58 million tons under the MP, surpassing the goal of CO2 emission control, which is 2.5 million tons. Therefore, during the implementation of the 13th Five-Year Plan, the executive departments must calculate the annual inventory calculations of CO2 emissions, adjust the energy system and quickly formulate more stringent emission reduction measures. Under the SP, the total carbon dioxide emission in 2020 amounts to 2.26 billion tons, reaching the target of CO2 control in the 13th Five-Year Plan.
From the perspective of sectoral emissions, the constraints of the policy scenario have an obvious effect on emission reductions of the power generation sector. The emission reductions of the power sector under the SP, MP and LP scenarios in 2030 are 129.38, 95.74, and 64.05 million tons respectively, with proportions of 63.2%, 46.7%, and 31.3%, respectively. With the implementation of economic measures and related policies, the power generation sector will be inclined to choose low-emission IGCC and CHP technology, which are conducive to the reduction of carbon dioxide and air pollutants. Under the SP scenario, the CO2 emission reduction of the transportation sector is the most significant. In 2030, the emissions from transportation sector in the SP scenario is reduced by 40.6% compared with BAU scenario, whereas those for the MP and the LP scenarios are respectively reduced by 19% and 20%. In the three policy scenarios, the reductions in CO2 emissions from the industrial sector are lower than in the electricity and transportation sectors, with 22% under the SP, 18.4% under the MP, and 8.8% under the LP in 2030. The proportion of CO2 emission reductions from the commercial sector in the three policy scenarios are ranked as follows: SP (39.1%) > MP (23.2%) > LP (22.4%). From the ratio of emission reductions, we found that the reduction effect in the commercial sector under the MP is not significant compared with the LP, which has only increased by 1%. Since taxes such as environmental taxes, carbon taxes, etc., were not imposed on the commercial sector in the scenario setting, the slight increases in energy consumption and structural control will have little impact on the current energy consumption system in the commercial sector of Shanghai.
However, when the total consumption volume is strictly controlled and the proportion of coal consumption reaches the level of the international energy consumption structure, the effect of carbon dioxide emission reduction in the commercial sector can become very obvious. In terms of residential sector, the carbon dioxide emission reduction ratios under the LP and MP scenarios in 2030 are 40% and 51%, respectively, and the proportion of emission reductions in strict control scenario is 29.5%.

4.3. LAPs Emissions

The simulation results of emissions of the local air pollutants SO2, NOx, PM10, and PM2.5 under the different scenarios are shown in the Table 6.

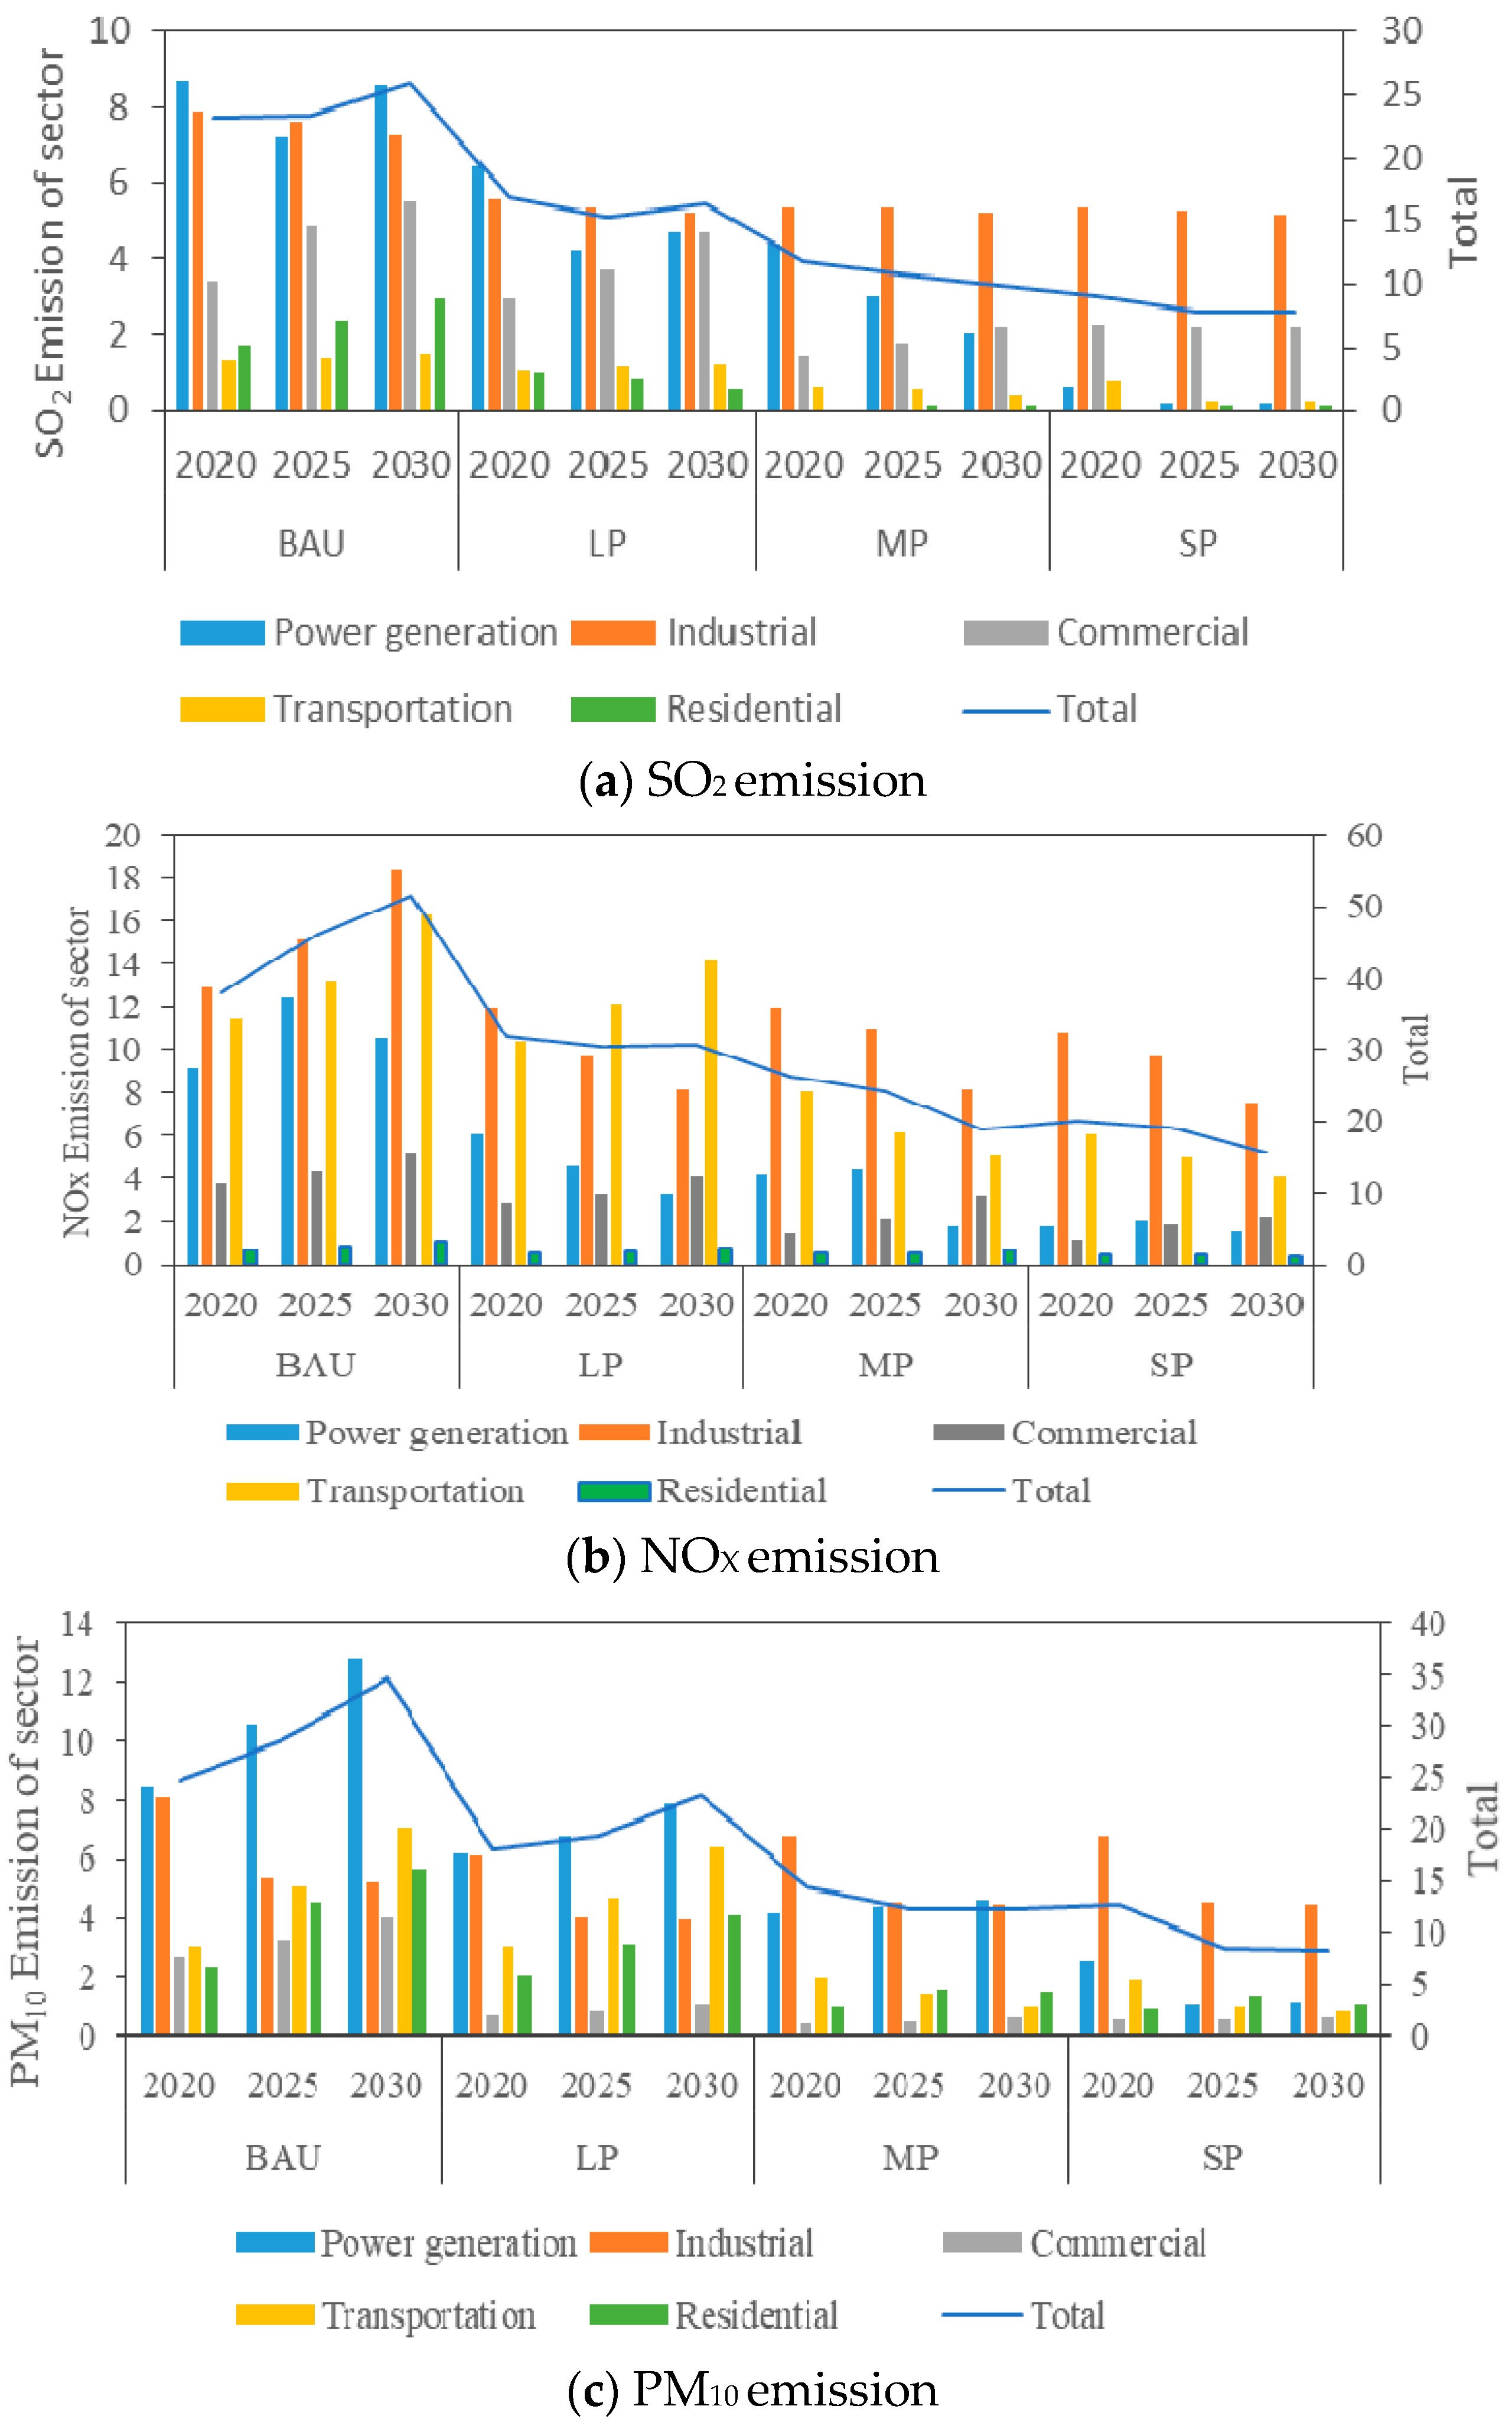
4.3.1. SO2 Emissions

According to Figure 7a, under the LP scenario, the trend in SO2 emission is consistent with that in BAU scenario, decreasing during the period from 2020 to 2025 and then increasing. The total emission of SO2 continues to decline in the MP and SP scenarios, reaching 99.4 and 78.3 kilotons in 2030, respectively. Compared with BAU scenario, SO2 emission reduction of the LP scenario is obvious, with a reduction of 39.5 Kt in 2030. The largest emission reduction is seen in the power generation sector. In the LP, the emission reduction ratios of the residential, power generation, industrial, transportation, and commercial sectors in 2030 are 80.4%, 45.8%, 27.6%, 20.4%, and 15.7%, respectively, demonstrating that the energy policy constraints have an obvious effect on the emission reduction of SO2 in both the power generation and residential sectors. With strict control of the proportion of coal consumption, the emissions in the power generation sector decrease significantly with the increasingly strict constraints. The emission reduction rate in 2030 will reach 76.4% in LP and 97.4% in SP, compared to the BAU. In addition, the emission reduction rate in the residential sector reaches 97.3%, with the emission of 800 tons, which is close to saturation under the LP and SP scenarios.

4.3.2. NOx Emissions

As shown in Figure 7b, the total NOx emission under the BAU scenario increases quickly during the period from 2020 to 2030, mainly produced by the industrial sector, the transportation and the power generation sectors. Under the LP, the change in NOx emissions is relatively stable. In the transportation sector, since the new-energy vehicles are not mandated, the quantity of traditional-fuel vehicles still outnumbers its new-energy counterparts due to costs, resulting in the continuous growth of NOx emission. Compared with the BAU, the LP scenario, with a constraint on the energy policy, estimates a significant emission reduction in the energy consumption sectors, among which the industrial sector has the largest emission reduction (102.2 kilotons), while the power generation sector has the highest emission reduction rate in 2030 (68.6%), followed by the industrial sector (55.5%), the residential sector (27.1%), the commercial sector (18.9%), and the transportation sector (12.4%).
Under the MP and SP scenarios, the emissions of NOx will continue to decline. In the transportation sector, the NOx emissions show a continuous descending trend, while its emission reduction rate increases to 86.6% compared with that under the BAU. The findings proved that the increase in the number of new energy buses will play a significant role in the NOx emissions of the transportation sector. In addition, significantly more NOx under the MP is emitted from the industrial sector than that under the LP, which is possibly explained by the energy structure. As the consumption of compressed natural gas and electricity in the transportation sector increases, given the limited energy supply capacity, oil will be the main energy source for industry.

4.3.3. PM10 Emissions

The total emissions of PM10 under the BAU and LP scenarios increase at an average annual growth rates of 3.5% and 2.7% respectively, while that under the MP and SP scenarios show a continuous decline (Figure 7c). The emission reduction is mainly due to the power generation sector; compared with the BAU scenario, the reductions under the LP, MP, and SP are 48.9, 81.8, and 115.9 kilotons in 2030, respectively.
PM10 emissions from the industrial sector show a trend of gradual decline under all scenarios. Under the LP scenario, PM10 emissions of industrial sector in 2025 will be significantly lower compared with 2020 due to further adjustment of the energy structure. Under the SP, PM10 emissions of the industrial sector reduce at an average annual rate of 1.9%, and the emission reduction from the baseline scenario reaches 55.9 kilotons in 2030. Under the MP and SP scenarios with the new-energy vehicle replacement policy, the PM10 emissions of the transportation sector significantly reduce, and the emission reduction compared to the BAU scenario in 2030 is 60.7 and 62.5 kilotons, respectively. The emission reduction of the service sector reaches saturation in 2030 under the MP. Even if the control policy is strengthened, achieving a good emission reduction effect will be difficult.

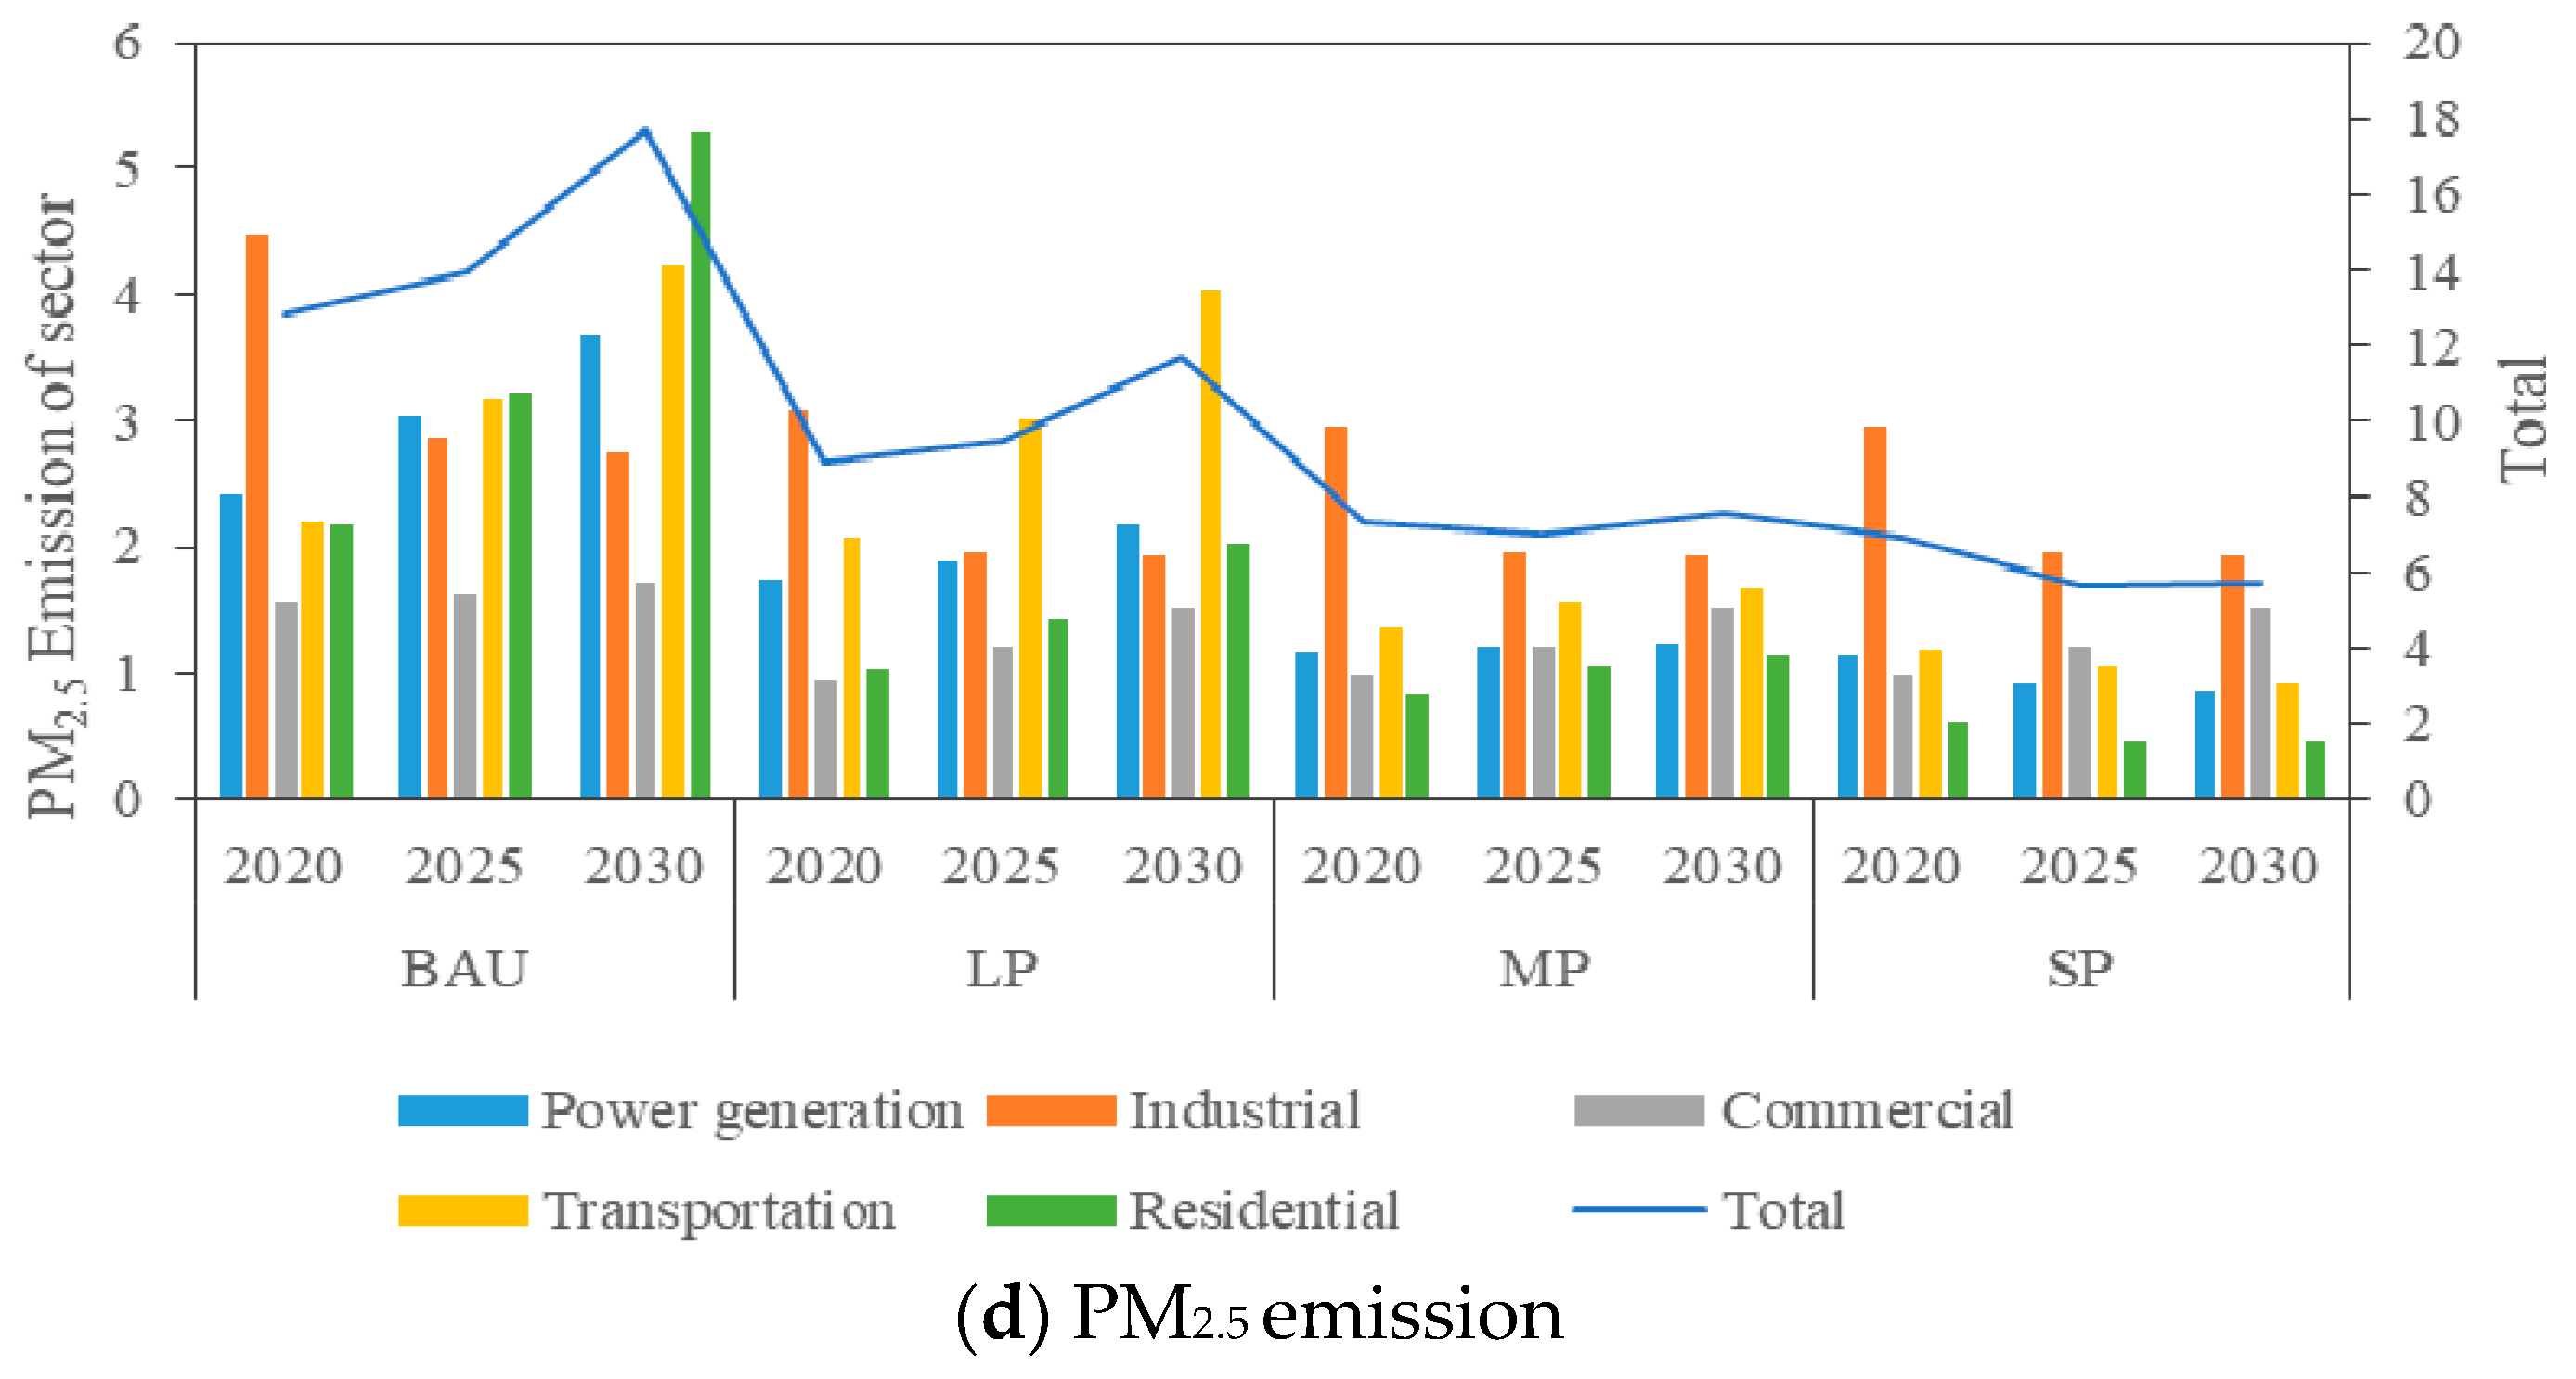
4.3.4. PM2.5 Emissions

According to Figure 7d, the total emission of PM2.5 gradually increases under the BAU, LP, and MP scenarios, with an average annual growth rate of 3.2%, 2.8%, and 0.3%, respectively. Under the SP scenario, PM2.5 emissions fluctuate steadily after falling.
Adopting stricter policies than that in the LP scenario will help the power generation sector to reduce PM2.5 emissions. The MP scenario can reduce PM2.5 emissions up to 41.6 kilotons compared with the LP scenario, while SP scenario only produces a 3.9 kiloton reduction compared with the MP scenario. The reduction rates of PM2.5 in the industrial sector under LP, MP, and SP scenarios in 2030 are 52.9%, 62.3%, and 76.5%, respectively, compared to the BAU. PM2.5 emissions from transportation sector increase each year under the BAU, LP, and MP scenarios, and decrease each year after the introduction of new-energy vehicles under the SP. From the reduction of PM2.5 emissions in the transportation sector under the LP compared to the BAU, the energy structure constraints in 2015 and the higher-than-planned total energy consumption control have no obvious effect on the reduction in PM2.5 emissions from the transportation sector. The emission reduction rate under the BAU scenario is only 4.7% (2030). The introduction of new-energy vehicles under the SP scenario will reduce the future PM2.5 emissions from the transportation sector by 32.9 kilotons in 2030 compared with the BAU scenario. The planned PM2.5 emission reduction of clean energy buses will reach 25.5 kilotons.

4.4. Contributions of the Energy-use Sectors to Emission Reductions of LAPs and CO2

We used the formula 3 to calculate the contribution rate of the energy-use sectors to emission reductions to identify primary sectors that can promote the synergistic emission reductions. The results are shown in Table 7.
R S , d , i = Δ E S , d , i / Δ E S , i
where R S , d , i is the contribution rate of energy-use sectors to emission reductions, %; Δ E S , d , i is the relative emission reduction of gas i in sector d in scenario S relative to the BAU scenario, Kt or Mt, Δ E S , i is the relative emission reduction of gas i in scenario S relative to the BAU scenario, Kt or Mt.
It can be seen from the results that the power generation sector contributes the most to the synergistic emission reduction of CO2, SO2, and NOx. The contribution rate of emission reduction in 2030 is 60~62%, 41~46% and 36~43%, respectively. In addition, the power generation sector will make the main contribution to NOx emission reduction in 2020, with an emission reduction contribution rate of 41~49%. With the development of alternative technologies in the sector, the emission reduction contribution rate will drop to 25~34% and the industrial sector has a significant effect on the emission reductions of NOx, PM2.5, and SO2. With the deepening of structural adjustments, the contribution rate of the industrial sector to NOx reduction will rise from 8~15% in 2020 to 30~49%. The transportation sector has the highest contribution to NOx emission reduction, reaching 34% in 2030. The emission reduction contribution of the commercial sector is mainly reflected in PM10 and SO2, whereas that of the residential sector is mainly reflected in PM2.5 and SO2.

5. Discussion

5.1. Scenarios Constraints Generate the Emission Reductions

The constraint parameters of energy policies, economic measures, and energy-saving technologies are defined in three policy scenarios. Energy policies effectively promote the emission reduction of air pollutants by facilitating technological upgrades within the power generation sector, adjusting the energy structure in the industrial and commercial sectors, and improving energy efficiency. According to the technology development curve, the cost of supercritical and ultra-supercritical technologies with higher energy efficiency and lower emission will decrease in the future. Therefore, the installed capacity of supercritical and ultra-supercritical units in power generation sector increases driven by the cost, leading to a decrease in the emission of LAPs and CO2. Economic measures have a certain degree of effect on the emissions reduction of carbon dioxide and air pollutants by increasing the cost of using energy, thus promoting all relevant sectors to choose energy-saving technologies. However, due to the limited energy supply and the increased consumption of electricity and natural gas in the transportation sector, the industrial sector will mainly adopt oil as the main source of energy, which might lead to increases in the emissions of nitrogen oxides in the industrial sector.
The MP scenario, which is close to the goal in the Shanghai’s 13th Five-Year Plan, was adopted to simulate the future development of energy in Shanghai. The results revealed that under the current policies, the emissions of carbon dioxide might not reach the target of less than 250 million tons in 2020. Therefore, during the implementation of the 13th Five-Year Plan, the executive department needs to calculate the carbon dioxide emissions on a yearly basis, adjust the energy system structure in time, and formulate more stringent emission reduction action plans. Under the SP, the total amount of carbon dioxide emissions can obtain the goal of reaching the peak before 2030. Including carbon tax in environmental tax might be an imperative measure to lower carbon emission. The tax threshold for carbon tax is suggested to be 40 CNY per ton of carbon dioxide, with an annual growth rate of 10% or higher.

5.2. Low-Emission Pathways for the Energy and Environment System Development

The total energy consumption of Shanghai is rather excessive and shows an upward trend. From the perspectives of energy security and health impact, more stringent policies need to be effectively implemented to control the energy consumption and emissions by intensifying the adjustment of the energy structure, as well as increasing the proportion of renewable energy consumption in the energy consumption structure. Specific measures can be optimized through discussion to promote sustainable development in Shanghai.
For planning of the power generation sector, we recommend increasing the proportion of the installed capacity of wind power and photovoltaic power in the power system, gradually eliminating small coal-fired boilers, and adding ultra-supercritical units and IGCC units to meet the demand for renewable electricity. In 2030, the installed capacities of wind and photovoltaic power generators are suggested to reach 1.8 and 1.2 million KW, respectively. Through technological substitution, the power generation sector can play a very good collaborative role in reducing CO2, SO2, PM10, and PM2.5.
For the industrial sector, according to the simulation results, the terminal energy consumption ratio of the future industrial sector still ranks first and oil products become the main fuel due to the limited power supply. To control the increase in the total energy consumption, Shanghai needs to control the layout of the future industries, gradually phase out some industries with high energy consumption and high pollution, and gradually reduce the consumption of the steel industry. The industrial sector needs to control its proportion of oil products and more efficient technologies should be adopted to reduce the emissions of SO2, NOx.
For transportation sector, the introduction of new-energy buses and vehicles helps to further reduce the emission of NOx, PM2.5, and PM10 in the transportation sector. The emission reductions of NOx, PM2.5, and PM10 in the transportation sector in 2030 are 122,100, 32,900, and 62,500 tons, respectively. The proportion of new energy buses and vehicles should continue to expand to the level defined in the SP.
For the residential and commercial sectors, energy policies play a significant role in reducing emissions in these two sectors, and the constraints of economic measures and energy-saving technologies have no direct effect on emission reductions. Under the BAU and LP scenarios, residential PM10 emissions will be distributed at annual growth rates of 9% and 7%, respectively. Under the MP and SP scenarios, the emissions first increase and then decrease, and the decrease is significant compared with the LP, indicating that the strict energy policy produces and effective control effect on the PM10 emissions of the residential sector. However, the PM10 and PM2.5 emission reductions in the SP are not obvious compared with the MP. After the strictness of the policy reaches that of the MP, it is difficult to further reduce the total amount of PM2.5 emissions from the commercial sector.

6. Conclusions

This study established a regional energy consumption model, the REESO model, to simulate the future energy consumption and the emissions of carbon dioxide and major local air pollutants under different policy scenarios from 2020 to 2030 for Shanghai. The simulated results based on the historical scenario confirmed the feasibility and validity of the model. Combined with the emission reduction analysis, the policy recommendations for the future development of Shanghai were introduced with the aim of optimizing the energy system and the environment. The main conclusions are as follows:
(1)
The energy consumption will reach 2.03 Mtce in 2030 with the average annual growth rate of 3.81% under the BAU. Additionally, the defined policy scenarios (LP, MP, SP) consume 8.23%, 13.24%, and 20.39% lower energy consumption in 2030, respectively, compared with the BAU.
(2)
The CO2 emissions in the BAU, LP, MP, SP will reach 349.32, 289.88, 258.57 and 226.12 Mt in 2020, respectively, and 465.32, 359.97, 312.69, and 253.35 Mt in 2030, respectively. From the predicted results of the MP, there is a possibility that the emission of carbon dioxide could not be able to realize the target of less than 250 million tons in 2020 under the current policies. Furthermore, only in the SP scenario, the total amount of carbon dioxide emission can obtain the goal of reaching the peak by 2030. The implementation of a carbon tax might be an imperative measure to lower carbon emission. The carbon tax threshold is suggested to be 40 CNY per ton of carbon dioxide, with an annual growth rate of 10% or higher.
(3)
The emissions of SO2, NOx, PM10, and PM2.5 are 259.1, 514.9, 347.0, and 176.6 Kt in 2030 under the BAU, respectively. With the constraints of energy policies, economic measures and technology updates, the emissions amount of SO2, NOx, PM10, and PM2.5 will be reduced by 95.3–180.8, 207.8–357.1, 149.4–274.5, and 59.5–119.8 Kt in 2030, respectively.
(4)
Considering the socio-economic development, the policies proposed in the MP could meet the required targets in the short term, and stricter policies proposed in the SP are recommended to be implemented in the medium-term.
(5)
The power generation sector contributes the most to the synergistic emission reduction of CO2, SO2, and NOx, and the industrial sector has a significant effect on the emission reductions of NOx, PM2.5, and SO2. The transportation sector has the highest contribution to NOx emission reduction, reaching 34% in 2030. The emission reduction contribution of the commercial sector is mainly reflected in PM10 and SO2, whereas that of the residential sector is mainly reflected in PM2.5 and SO2.
It should be noted that the REESO model only considered the energy-related emissions and process emission of steelmaking, coking and refining. The other process-related emissions should be taken into account in future analysis.

Supplementary Materials

The following are available online at https://www.mdpi.com/2073-4433/11/9/1006/s1, Table S1: The carbon emission factors calculated for the emission module, Table S2: The LAPs emission factors calculated for the emission module, Table S3: Environmental tax of LAPs in Shanghai.

Author Contributions

J.W. calculated the data and wrote the paper; Y.Z. guided the emissions calculations and revised the paper; L.W. provided constructive discussion and data for energy–environment model building; W.M. and L.C. made some suggestions for this paper. All authors have read and agreed to the published version of the manuscript.

Funding

This research was supported by National Natural Science Foundation of China, grant number 71673051 and 21677038, and the Major Program of the Shanghai Committee of Science and Technology, China (17DZ120290; No. 19DZ1205009).

Acknowledgments

We greatly appreciate the Shanghai Institute of Environmental Sciences and the Shanghai Environmental Monitoring Center for provide emission inventory data and thank MDPI for the editing assistance to the paper.

Conflicts of Interest

The authors declare no conflict of interest.

Abbreviations

The following abbreviations are used in this manuscript.
tceTons of coal equivalent
LPGLiquefied petroleum gas
CNGCompressed natural gas
LNGLiquefied natural gas
CHPCombined heat and power
SCPCSupercritical coal-fired plant
USCPCUltra-supercritical power plant
IGCCIntegrated gasification combined cycle
OCGTOpen cycle gas turbine
FGDFlue gas desulfurization
LGVLight goods vehicles
HGVHeavy goods vehicles

References

  1. BP. BP Statistical Review of World Energy 2020; BP: London, UK, 2020; pp. 8–15. Available online: https://www.bp.com/en/global/corporate/energy-economics/statistical-review-of-world-energy.html (accessed on 5 August 2020).
  2. Cao, J.; Ho, M.S. Changes in China’s Energy Intensity: Origins and Implications for Long-Term Carbon Emissions and Climate Policies. Eepsea Research Report 2010. Available online: http://www.eepsea.net/pub/rr/2010-RR12-Jing%20Cao%20and%20Mun%20S%20HO.pdf (accessed on 2 August 2019).
  3. Wei, C.; Ni, J.L.; Shen, M.H. China’s energy inefficiency: A cross-country comparison. Soc. Sci. J. 2011, 48, 478–488. [Google Scholar] [CrossRef]
  4. Yi, Z.; Rui, D.; Hao, L. Problems and countermeasures to energy sustainable development in China. In Proceedings of the World Automation Congress IEEE 2012, Puerto Vallarta, Mexico, 24–28 June 2012; pp. 1–4. [Google Scholar]
  5. Wang, J. Synergetic Control Strategy for Multiple Air Pollutants from Multiple Sectors in the Yangtze River Delta Region. Master’s Thesis, Tsinghua University, Beijing, China, 2014. (In Chinese). [Google Scholar]
  6. Owusu, P.A.; Sarkodie, S.A. Global estimation of mortality, disability-adjusted life years and welfare cost from exposure to ambient air pollution. Sci. Total Environ. 2020, 742, 140636. [Google Scholar] [CrossRef]
  7. Adjo, A. Placing carbon reduction in the context of sustainable development priorities: A global perspective. Carbon Manag. 2011, 2, 413–423. [Google Scholar]
  8. Ouyang, X.L.; Lin, B. Carbon dioxide (CO2) emissions during urbanization: A comparative study between China and Japan. J. Clean. Prod. 2017, 143, 356–368. [Google Scholar] [CrossRef]
  9. Zheng, J.; Zhang, L.; Che, W.; Zheng, Z.; Yin, S. A highly resolved temporal and spatial air pollutant emission inventory for the Pearl River Delta region, China and its uncertainty assessment. Atmos. Environ. 2009, 43, 5112–5122. [Google Scholar] [CrossRef]
  10. Fu, X.; Wang, S.; Zhao, B.; Xing, J.; Cheng, Z.; Liu, H.; Hao, J. Emission inventory of primary pollutants and chemical speciation in 2010 for the Yangtze River Delta region, China. Atmos. Environ. 2013, 70, 39–50. [Google Scholar] [CrossRef]
  11. Tian, H.; Hao, J.; Lu, Y.; Zhu, T. Inventories and distribution characteristics of NOx emissions in China. China Environ. Sci. 2001, 21, 493–497. (In Chinese) [Google Scholar]
  12. Zhao, B.; Ma, J. Development of an air pollutant emission inventory for Tianjin. Acta Sci. Circumstantiae 2008, 28, 368–375. (In Chinese) [Google Scholar]
  13. Yang, C.; Yeh, S.; Zakerinia, S.; Ramea, K.; McCollum, D. Achieving California’s 80% greenhouse gas reduction target in 2050: Technology, policy and scenario analysis using CA-TIMES energy economic systems model. Energy Policy 2015, 77, 118–130. [Google Scholar] [CrossRef]
  14. Wang, K.; Wei, Y.-M.; Zhang, X. A comparative analysis of China’s regional energy and emission performance: Which is the better way to deal with undesirable outputs? Energy Policy 2012, 46, 574–584. [Google Scholar] [CrossRef]
  15. Dedinec, A.; Taseska-Gjorgievska, V.; Markovska, N.; Pop-Jordanov, J.; Kanevce, G.; Goldstein, G.; Pye, S.; Taleski, R. Low emissions development pathways of the Macedonian energy sector. Renew. Sustain. Energy Rev. 2016, 53, 1202–1211. [Google Scholar] [CrossRef]
  16. Li, L.; Chen, C.; Xie, S.; Huang, C.; Cheng, Z.; Wang, H.; Wang, Y.; Huang, H.; Lu, J.; Dhakal, S. Energy demand and carbon emissions under different development scenarios for Shanghai, China. Energy Policy 2010, 38, 4797–4807. [Google Scholar] [CrossRef]
  17. Zhao, H.J.; Ma, W.C.; Dong, H.J.; Jiang, P. Analysis of Co-Effects on Air Pollutants and CO2 Emissions Generated by End-of-Pipe Measures of Pollution Control in China’s Coal-Fired Power Plants. Sustainability 2017, 9, 499. [Google Scholar] [CrossRef] [Green Version]
  18. Mao, X.; Zhou, J.; Corsetti, G. How well have China’s recent five-year plans been implemented for energy conservation and air pollution control? Environ. Sci. Technol. 2014, 48, 10036–10044. [Google Scholar] [CrossRef]
  19. Brown, K.E.; Henze, D.K.; Milford, J.B. How accounting for climate and health impacts of emissions could change the US energy system. Energy Policy 2017, 102, 396–405. [Google Scholar] [CrossRef]
  20. McCollum, D.; Yang, C.; Yeh, S.; Ogden, J. Deep greenhouse gas reduction scenarios for California—Strategic implications from the CA-TIMES energy-economic systems model. Energy Strategy Rev. 2012, 1, 19–32. [Google Scholar] [CrossRef]
  21. Ang, J.B. CO2 emissions, energy consumption, and output in France. Energy Policy 2007, 35, 4772–4778. [Google Scholar] [CrossRef]
  22. Chiodi, A.; Gargiulo, M.; Deane, J.P.; Lavigne, D.; Rout, U.K.; Ó Gallachóir, B.P. Modelling the impacts of challenging 2020 non-ETS GHG emissions reduction targets on Ireland′s energy system. Energy Policy 2013, 62, 1438–1452. [Google Scholar] [CrossRef]
  23. Loulou, R.; Remme, U.; Kanudia, A.; Lehtila, A.; Goldstein, G. Energy Technology Systems Analysis Programme—Documentation for the TIMES Model—Part I: TIMES Concepts and Theory. Available online: https://iea-etsap.org/docs/Documentation_for_the_TIMES_Model-Part-I_July-2016.pdf (accessed on 5 July 2020).
  24. Shanghai Municipal Bureau of Ecology and Environment. Shanghai Ecological and Environmental Bulletin 2010–2019. Available online: https://sthj.sh.gov.cn/hbzhywpt1143/hbzhywpt1144/index.html (accessed on 4 June 2020).
  25. Shanghai Statistical Bureau. Shanghai Statistical Yearbook 2016; Shanghai Stastics Press: Shanghai, China, 2016. Available online: http://tjj.sh.gov.cn/tjnj/20200427/4aa08fba106d45fda6cb39817d961c98.html (accessed on 20 June 2018).
  26. National Statistics Bureau. National Date. Available online: https://data.stats.gov.cn/easyquery.htm?cn=E0103 (accessed on 10 October 2018). (In Chinese)
  27. Shanghai Statistical Bureau. Shanghai Energy Statistical Yearbook; Shanghai Stastics Press: Shanghai, China, 2015.
  28. The National Coordination Committee for Climate Change; Energy Research Institute of National Development and Reform Commission. Study on National Greenhouse Gas Inventory in China; China Environmental Science Press: Beijing, China, 2007; pp. 72–92.
  29. Jiang, X.; Tang, X. Research on Air Pollution Control Strategy for the Beijing City; Beijing Environmental Protection Bureau & Peking University: Beijing, China, 2002. [Google Scholar]
  30. Zhao, Y.; Wang, S.; Nielsen, C.P.; Li, X.; Hao, J. Establishment of a database of emission factors for atmospheric pollutants from Chinese coal-fired power plants. Atmos. Environ. 2010, 44, 1515–1523. [Google Scholar] [CrossRef]
  31. Huang, H. The Environmental Impact Assessment Research on the Integrated Coal Gasification Combined Cycle (IGCC) Power Station. Master’s Thesis, Tianjing University, Tianjing, China, 2008. (In Chinese). [Google Scholar]
  32. Zhang, Q. Study on Regional Fine PM Emissions and Modeling in China. Ph.D. Thesis, Tsinghua University, Beijing, China, 2005. (In Chinese). [Google Scholar]
  33. Huang, C.; Chen, C.H.; Li, L. Anthropogenic air pollutant emission characteristics in the Yangtze River Delta region. Acta Sci. Circumstantiae 2011, 31, 1858–1871. (In Chinese) [Google Scholar]
  34. Cai, H.; Xie, S. Determination of Emission Factors from Motor Vehicles under Different Emission Standards in China. Acta Sci. Nat. Univ. Pekin. 2010, 46, 319–326. (In Chinese) [Google Scholar] [CrossRef]
  35. Shan, Y.; Guan, D.; Zheng, H.; Ou, J.; Li, Y.; Meng, J.; Mi, Z.; Liu, Z.; Zhang, Q. China CO2 emission accounts 1997–2015. Sci. Data 2018, 5, 170201. [Google Scholar] [CrossRef] [PubMed] [Green Version]
  36. Du, L.; Li, X.; Zhao, H.; Ma, W.; Jiang, P. System dynamic modeling of urban carbon emissions based on the regional national economy and social development plan: A case study of shanghai city. J. Clean. Prod. 2018, 172 (Pt. 2), 1501–1513. [Google Scholar] [CrossRef]
  37. Zhao, Q. Study on Greenhouse Gas Emission Inventory in Shanghai; Fudan University: Shanghai, China, 2011. [Google Scholar]
  38. Liu, Z.; Cai, B. High-resolution Carbon Emissions Data for Chinese Cities. Available online: https://www.docin.com/p-2139629408.html (accessed on 8 October 2018).
  39. Xie, S.; Chen, C.; Li, L.; Huang, C. The Energy Related Carbon Dioxide Emission Inventory and Carbon Flow Chart in Shanghai City. China Environ. Sci. 2009, 29, 1215–1220. (In Chinese) [Google Scholar]
  40. Wu, X. The Study of Air Pollution Emission Inventory in Yangtze Delta. Master’s Thesis, Fudan University, Shanghai, China, 2009. (In Chinese). [Google Scholar]
  41. Shanghai Municipal People’s Government. Notice on Relevant Issues Such as the Applicable Tax Standard of the City’s Taxable Air Pollutants and Water Pollutant Environmental Protection Taxes. Available online: http://www.shanghai.gov.cn/nw2/nw2314/nw2319/nw12344/u26aw54490.html (accessed on 21 December 2017).
Figure 1. Research area.
Atmosphere 11 01006 g001
Figure 2. The primary energy consumption in Shanghai during the period from 2004 to 2017. Date source: Shanghai Statistical Yearbook [25]; Shanghai Statistical Yearbook on Energy 2015 [27].
Atmosphere 11 01006 g002
Figure 3. The framework of the Regional Energy–Environment System Optimization (REESO) model.
Atmosphere 11 01006 g003
Figure 4. CO2 emission comparison of different sources. Data source: emission estimated by Shan’s research [35], emission estimated by Du’s research [36], emission estimated by Zhao’s research [37], and emission estimated by Liu’s research [38].
Atmosphere 11 01006 g004
Figure 5. The comparison of local air pollutants simulation results and emission inventory data. (a) SO2 (b) NOx (c) PM10 (d) PM2.5.
Atmosphere 11 01006 g005
Figure 6. The proportion of final energy consumption by fuel type.
Atmosphere 11 01006 g006
Figure 7. LAPs emissions of energy consumption sectors under different scenarios.
Atmosphere 11 01006 g007aAtmosphere 11 01006 g007b
Table 1. Historical scenario constraints.
Year2007201020122014
The ratio of coal (%)58504845
The ratio of natural gas (%)581012
Minimum installed capacity of ultra-supercritical (GW)05.25.25.2
Table 2. The results of carbon dioxide emission based on a historical scenario (unit: Mt).
SectorYear
20042007201020122014
Power generation 60.9163.5078.2281.5676.90
Industrial 52.4264.19100.87102.40104.59
Commercial 11.8215.4721.3122.6923.35
Transportation 6.639.3713.3013.2714.73
Residential 2.313.123.402.462.50
Total134.09155.66217.10222.40222.06
Table 3. The definition of the three policy scenarios.
MeasuresParametersLoose Policy (LP) ScenarioModerate Policy (MP) ScenarioStrict Policy (SP) Scenario
Energy PoliciesEnergy consumptionNo more than 135 million tce by 2020
No more than 200 million tce by 2020
No more than 125 million tce by 2020
No more than 180 million tce by 2030
No more than 115 million tce by 2020
No more than 150 million tce by 2030
Energy structureMaintain the structure in 2015, coal accounts for 38% of primary energyCoal consumption achieves negative growth, accounting for less than 33% of primary energy; Natural gas consumption achieves 14%.Coal consumption achieves negative growth, accounting for less than 28% of primary energy; natural gas consumption achieves 16%
Economic Measures Environmental
tax
Levied from 2018 with a five-year increase of 20%; tax threshold is from reference [41]Levied from 2018 with a five-year increase of 40% Levied from 2018 with a five-year increase of 60%
Carbon taxN/ALevied at the threshold price of 30 CNY per ton of carbon dioxide by 2020, with an annual growth rate of 5%;Levied at the threshold price of 40 CNY per ton of carbon dioxide by 2020, with an annual growth rate of 10%
Energy-saving TechnologiesElectricity generation technologiesNo restrictionsThe installed capacity of wind power and photovoltaic power reach 1.4 million and 800,000 kilowatts, respectivelyThe installed capacities of wind and photovoltaic power generators reach 1.8 and 1.2 million KW, respectively
New energy vehiclesThe proportion of new energy and clean energy buses will reach 50% by 2020The proportion of new energy and clean energy buses will reach 50% by 2020, the proportion of new energy vehicles will reach 50% by 2030
Table 4. The simulation results of energy consumption in Shanghai during the period 2015–2030 (unit: Mtce).
Scenario2015202020252030
BAU1.201.561.822.03
LP1.171.341.641.86
MP1.141.241.491.76
SP1.091.191.391.62
Table 5. CO2 emissions under the different scenarios for different sectors (unit: Mt).
ScenarioYearPower Generation Industrial Comm-Ercial Trans-Portation Residen-Tial Total
BAU2020145.79127.5938.2128.719.02349.32
2025174.67129.7648.5139.6312.12404.69
2030204.82136.3957.9749.8216.32465.32
LP2020114.21121.6126.3321.236.5289.88
2025124.06126.0435.5428.827.98322.44
2030140.77124.2944.9840.289.65359.97
MP202096.55110.0826.0620.615.27258.57
2025110.1411335.1928.716.83293.87
2030109.08111.2844.5339.827.98312.69
SP202066.91108.825.220.44.81226.12
202586.7109.4434.5332.675.65268.99
203075.44106.335.2729.556.79253.35
Table 6. Local air pollutants (LAPs) emissions under different scenarios for different sectors (unit: Kt).
PollutantSectorBAULPMPSP
202020252030202020252030202020252030202020252030
SO2Power generation87.472.086.264.342.246.744.130.120.36.41.31.7
Industrial7975.972.655.653.152.553.553.152.153.452.751.6
Commercial33.949.055.429.637.146.714.117.622.222.521.722.2
Transportation13.413.615.210.211.312.16.05.44.08.12.42.0
Residential17.423.629.79.58.65.80.50.70.80.50.70.8
Total231.1234.1259.1169.2152.3163.8118.2106.999.490.978.878.3
NOxPower generation91.7124.5105.761.046.233.142.044.817.617.720.515.6
Industrial129.5151.4184119.997.181.8119.6110.281.7107.496.775.5
Commercial37.943.951.728.233.041.914.921.332.411.319.622.4
Transportation114.3132.1162.8103.5121.4142.580.861.251.160.450.340.7
Residential6.68.610.75.36.57.85.35.66.94.34.83.6
Total380.0460.5514.9317.9304.2307.1262.6243.1189.7201.1191.9157.8
PM10Power generation84.5105.8127.861.467.878.941.443.64625.111.211.9
Industrial81.453.352.260.839.739.567.74544.867.744.944.7
Commercial26.432.640.0 6.98.610.94.05.16.45.65.86.4
Transportation30.650.770.930.247.164.220.114.110.219.310.28.4
Residential23.644.956.120.73.094.111.031.541.450.971.321.11
Total246.5287.3347.0180.0166.3197.6134.2109.3108.9118.773.472.51
PM2.5Power generation24.130.436.817.418.821.811.612.212.511.49.48.6
Industrial44.828.727.530.919.619.429.619.619.429.719.619.3
Commercial15.616.217.19.612.115.29.812.215.49.712.215.4
Transportation22.131.742.320.930.140.313.715.516.81210.69.4
Residential21.732.352.910.314.420.48.310.411.43.84.44.1
Total128.3139.3176.689.195.0117.173.069.975.566.656.256.8
Table 7. The contribution rate of the energy-use sectors to emission reductions (unit: %).
GasYearPower GenerationIndustrialCommercialTransportationResidential
CO2202053–6410–1910–197–123.4–4.2
203060–6211–168–127–103.9–6.3
SO2202037–5718–376–173–612–14
203041–4611–219–203–716–25
NOx202041–498–1514–1917–301–2
203025–3430–494–89–341
PM10202034–4911–3017–290.6–104–12
203036–432–1112–256–2613–18
PM2.5202017–2225–359–153–1724–29
203023–256–131.4–33–2740–54

