1. Introduction
Achieving a proper knowledge of precipitation variability in space and time poses many challenges, as precipitation behaves differently on different scales. In topographically complex areas such as the French island of Corsica in the western Mediterranean a particularly heterogeneous, small-scale distribution of precipitation patterns is expected. Where orography is modulating the effect of both larger weather systems (e.g., frontal systems) and regional circulations (breeze systems) [
1] on the land surface, precipitation and extreme precipitation events mostly reveal locally varying patterns. It was pointed out by [
2] that the topography also leads to small-scale breeze systems which modify the large-scale precipitation signals in the Mediterranean. Depending on the geographical settings of mountainous islands in combination with specific prevailing synoptic conditions, a clear influence of orography particularly on the area of formation and on the intensity and sums of precipitation was found [
3,
4]. It was shown by [
5], for instance, for two heavy precipitation events in Taiwan, that the synoptic situation overlapped the diurnal breeze effects, but that the pronounced topography of the island had a large influence on the spatial variation of the distribution of the precipitation totals. It was pointed out by [
1] that meso- and microscale systems in the Mediterranean area are important for precipitation formation.
Additionally, the seasonal cycle of the extratropical westerlies in the Mediterranean region strongly affects the precipitation dynamics (e.g., [
6]). Westerlies dominate the wet winter season (December to February, DJF), contrasting with dry summers (June to August, JJA) due to the absence of frontal passages. In DJF, extratropical westerlies transport the water vapor from the Atlantic to the Mediterranean, associated with cyclones and frontal precipitation. In contrast, during JJA the synoptic forcing is rather weak, without any cyclonic activities, while sea-slope breezes predominate the onshore moisture transport [
7,
8]. For the Valencian region on the Iberian Peninsula, [
9] found an increase in precipitation on the coastal areas related to breeze systems when investigating the period 1959–2000. At the same time, precipitation in the interior mountainous regions, mostly caused by Atlantic frontal systems, decreased. Regarding the spatial extent of precipitation, the topographical conditions play a major role for precipitation formation through the coupling of mountain and sea breeze systems under complex topography situations. Usually, complex spatial patterns of convective precipitation are observed. A study on the island of Sardinia (Italy) showed that local circulation patterns in coastal areas occur on more than one third of all days, particularly between May and August [
8]. In addition to the local breeze systems and the low-pressure systems that propagate from the Atlantic to the Mediterranean in winter time, also mesoscale low-pressure systems are occasionally formed within the Mediterranean region (in the Gulf of Genoa or in the Gulf of Lion [
10]), with high precipitation totals in the storm center.
Regarding the development of precipitation trends in the Mediterranean a decrease in the total amount can be observed. By means of observed time series of the Monthly Precipitation Dataset, Mediterranean Spain (MOPREDAMES) which consists of over 1100 complete and homogenized monthly precipitation time series for the Iberian Peninsula over the period 1951–2000, a decreasing annual precipitation amount has been observed [
11,
12]. Reference [
13] demonstrated on a seasonal basis over the time period 1952–1999 that a negative trend in precipitation accompanied by a decrease in precipitation days occurred, especially during the rainy season of DJF and spring (March–May, MAM). At the same time, it was pointed out that intense precipitation events will play a greater role in JJA. In addition, [
14] found a decrease in winter precipitation for the island of Sardinia, with an impact for the western coast higher than for the eastern coast. With respect to climate change, the fifth assessment report of the Intergovernmental Panel on Climate Change (IPCC AR5 2013) described the Mediterranean region as a highly risk area, due to a dramatic decrease of water availability. Under the RCP8.5 scenario the annual precipitation amount will likely decrease, associated with modifications in the seasonal precipitation amount by the end of this century.
While [
15] assumed that the shift in large-scale circulation patterns will have significant effects on precipitation and its distribution in the Mediterranean, [
16] assumed that the effects of climate change are clearly underestimated by regarding the shift in large-scale circulation patterns alone. They stated that relatively coarsely resolved models have not been able to properly consider the effects on precipitation changes due to changes in local, breeze-system induced precipitation events.
For the island of Corsica it is also shown that precipitation is produced by both large-scale extratropical systems, mainly in winter, and local breeze systems. However, most of the studies at hand focused on heavy precipitation events only [
17,
18,
19,
20,
21]. Reference [
21] for instance investigated a total of over 170 heavy precipitation events on the island of Corsica with an accumulated precipitation of more than 100 mm/24 h, and classified them on the basis of their synoptic characteristics using ERA interim data. Three synoptic situations were identified which lead to such heavy precipitation events. However, they mentioned that hourly precipitation data were still needed to provide further insights into the spatial and temporal distribution of precipitation in terms of duration, intensity and variability in Corsica. They also stressed clearly that further investigations are required in Corsica for different classes of precipitation intensities and daily totals, particularly focussing on the temporal and spatial distribution of precipitation in the diurnal course, in order to properly understand the interaction of large- and local-scale precipitation formation in Corsica, today and under climate change conditions also in the context of water availability.
Thus, the main objective of this study is to analyze different spatio-temporal precipitation regimes (i.e., regimes that can be defined by the spatial and temporal variability of the precipitation) of different classes of precipitation intensities on Corsica, and their driving factors such as large-scale atmospheric conditions, topography, and local wind regimes. For this, we use in situ measurements provided by the national weather service Meteo France and ERA5 reanalysis data [
22], the latter for the classification of synoptic weather types. The overall aim of this study is (i) to discriminate spatial precipitation regimes using event duration and intensity, (ii) to attribute large scale and local scale influences using weather types and local circulations, and (iii) to assess temporal changes in their occurrences. Consequently, the paper is structured as follows. The following section shows a description of the methods used for cluster analysis, the objective classification of weather situations using the ERA-5 mslp (mean sea level pressure) [
22] data, as well as the division into different precipitation event classes with regard to duration and intensity. In
Section 3 the classification of Corsica into its precipitation regimes is shown (
Section 3.1), followed by the description of the large-scale (
Section 3.2) and local-scale driving factors (
Section 3.4). Finally, the precipitation regimes along a west-to-east altitude transect in central Corsica are investigated.
Section 4 starts with an evaluation of the objective classification of the weather situations, followed by the interpretation of influencing factors for the formation of different types of precipitation event.
Section 5 summarizes the results.
2. Study Area, Data and Methods
Our study focuses on the Island of Corsica which is located in the central western Mediterranean between 41° 22‘ N and 43°01‘ N latitude and 8° 33‘ E and 9° 34‘ E longitude (
Figure 1). With 8680 km² it is the fourth largest island in the Mediterranean. The topography traverses the island from North to South, including terrain altitudes up to 2700 m above sea level (a.s.l) with more than 20 peaks exceeding 2000 m a.s.l. In the western and northern part of the island several high mountain ridges extend close to the coastline, breached by valleys oriented in the southwest to northeast direction reaching far inland. In contrast, the eastern part of the island is characterized by valleys which enlarge to coastal plains [
23]. Due to its latitudinal location and its altitudinal extent the climate of Corsica ranges from subtropical conditions in the lowlands to alpine conditions in the mountains.
In order to investigate the spatio-temporal precipitation regimes on Corsica (location in
Figure 1b) daily precipitation data obtained by automatic weather stations provided by Météo France were used. The total data coverage was at least 99%, and a percentile of 99% is considered to remove unreliable outliers. The daily precipitation data were also tested for homogeneity.
Table S1 shows the meta information of the weather stations used for this purpose.
For the detection and delineation of different precipitation regimes a partitioning cluster analysis using the k-medoid algorithm [
24] is conducted, as also demonstrated by [
25,
26]. For this, we used daily precipitation data over the time period 2011–2016 to allow for the highest density in weather stations, i.e., 64 different locations.
The clustering algorithm is defined as follows:
with
k being the number of partitions,
x the respective precipitation data,
Ci the ith cluster and
ci the ith medoid of the ith cluster.
The cluster analysis aims to divide the data into k partitions while minimizing the sum of pairwise dissimilarities (DISS) of the cluster medoids. The latter represent the respective centrally located data point with the lowest average dissimilarity to all weather stations in the cluster. This means that the daily precipitation sums obtained from the 64 stations are the objects (x) of the cluster analysis, and the resulting medoid describes the representative station within a cluster. The objects reaching their final cluster when the similarity is greatest, the latter is calculated using the Euclidean distance. Since the application of this medoid-based approach relies on the data structure it allows for a partitioning of the temporal variability of the precipitation, and topographical influences such as slope and exposure are implicitly considered and thus can be neglected, as also described by [
27] and [
26]. The proper numbers of clusters are derived by means of the isolation of each cluster [
28] and the size shows how many stations are grouped to this cluster. The isolation represents the maximum distance of the medoid divided by the minimum distance of the medoid to another medoid.
To analyze the large-scale atmospheric circulation conditions associated with rainfall events, an objective weather type classification by means of a principal component analysis (PCA) was conducted [
25], using the mean sea level pressure (mslp) derived from the ERA5 reanalysis data (0.25° × 0.25°) [
22] over the time period 1980–2018. To physically relate the resulting PCs to the rainfall occurrences, the medoids obtained from the clustering analysis were correlated with the time scores which describe the time component of the PCA and indicate the variability of the anomalies at each grid point.
For further analyses concerning local scale effects such as topography and local wind systems, the clustered precipitation regimes, the co-factors 2 m air temperature, water vapor pressure deficit (vpd), and the wind field are used. Since these analyses are conducted on an hourly basis, the time period considered here is reduced to 1993–2018, due to the limited availability of hourly data in the time before 1993. The total data coverage for hourly data was at least 95%. For the respective precipitation regimes, precipitation events are examined with regard to their distribution during the day and their duration. A precipitation event is delimited in this study as a period with a rain rate of the respective station equal to or exceeding 1 mm per hour. Although precipitation can also fall in the form of snow at higher altitudes, this study does not distinguish between rain and snow events.
Precipitation events were divided into four categories according to duration and intensity (cf.
Table 1). It is advised by [
29] to use a region-specific threshold value when assessing heavy rain events, such as the upper 90th percentile. In this study, intensive rain events are investigated instead of heavy precipitation events and thus the relative threshold at the 75th percentile is determined. Hence, a precipitation event is considered intensive if at least 3.6 mm precipitation falls per hour. This value is the average of all 75th quantiles of all precipitation regimes. All hours in which at least 1 mm precipitation was measured serve as data basis. Regarding the duration, a distinction was made between short (maximum 3 h of precipitation) and long (minimum 3 h of precipitation). This results in four precipitation event classes. Firstly the short, intensive precipitation events (SI), which last a maximum of 3 h and have dropped at least 3 times the threshold value, secondly the short, light precipitation events (SL), for which the threshold value was not exceeded. Thirdly, the long-intensive precipitation events (LI) with a minimum duration of 3 h and at which the threshold value is exceeded in at least 75% of the hours, and fourthly the long-light precipitation events (LL) with the threshold value not being reached in at least 75% of the hours (cf.
Table 1).
The presence of local wind systems is investigated by means of wind field data for each precipitation regime on the island. The method for deriving local circulations was adapted from [
8] who investigated sea breezes in Sardinia. It is based on the fact that the wind blows offshore (onshore) during at least 9 h during the night (during the day), whereby day and night are defined differently within the seasons, depending on sunrise and sunset. In addition, it is defined that on at least 2 consecutive hours per day, the wind must blow onshore. The division of directions for onshore and offshore breeze was defined with respect to the coastline and topography adjacent to the meteorological station.
3. Results
3.1. Spatial Precipitation Regimes
First, we analyze the spatial delineation of the precipitation regimes using the partitioning cluster analysis as described in the previous section, over a time period 2011–2016. The five resulting clusters, hereinafter also referred to as precipitation regimes, are summarized in
Table 2 and characterize different regions in Corsica (cf.
Figure 2). The clusters were defined along contour lines (cf.
Figure 1b) and the number of clusters was chosen a priori and shows a reasonable isolation.
The first cluster, which encompasses most of the stations, covers the western coastal region and exhibits the best isolation (0.87). The second cluster comprises the northern and eastern coastal section including the Cap Corse peninsula. Cluster three and four cover comparable amounts of stations, with cluster three representing the central mountainous region having a stronger isolation. The third cluster comprises the central and higher regions of the island, and is delimited in the west by the first cluster. The fourth cluster extends to the southeast, including the plain and coastal areas east of the main ridge. The western clusters (western coastal area and central mountainous region) are separated from the eastern clusters (north-eastern coastal area and eastern coastal area) by the main mountain ridge. The fifth cluster includes the coastal sections of the southern coastal region of the island and is delimited to the north by higher terrain.
The climate in Corsica is generally characterized by a period of high precipitation from October to April, when on average 78% of the annual precipitation falls. While the annual course of rainfall in general is equal at all stations, the cluster analysis discriminates between areas of different precipitation totals. In the terrain-dominated cluster in central Corsica, the highest precipitation totals with an average of 1350 mm are present, followed by the northeastern and eastern coastal regions with 1000 mm and 800 mm, respectively. The south and west of the island show lower values with an average of 650 mm. Interestingly, slight alterations in the annual course of rainfall between the regions are also contributing to the cluster discrimination. While in almost all regions the winter precipitation peak occurs in November, it is shifted to October for the eastern coastal area. This is the only area which is completely in a lee situation with regard to the predominant extratropical westerlies. Generally, the driest month in the year is August, but it shifted towards September for the central mountainous area. In the beginning of the year, the westerly exposed regions (W, S coastal and central) show the highest rain amounts in January, which is shifted towards March in the NE and E coastal regions. In all regions, the dry season in the summer reaches maximum temperature values of 28 to 30 °C. The minimum value in the north-east and east of the island of around 20 °C is higher than in the other regions with values of around 16 °C and 14 °C in the higher regions of Central Corsica. In the winter months, however, the coastal regions in the south, west and east of the island are warmer with values of 5 °C (minimum) and 14 °C (maximum) than the north-east and central Corsica with values of 1 and 3 °C, respectively, at a maximum of 10 °C.
3.2. Large-Scale Driving Factors
To decompose the origin of the total rainfall in the precipitation regimes, large-scale driving factors are analyzed.
One of the main influences of precipitation in Europe and the Mediterranean region are the large-scale weather conditions which determine the air masses over Corsica.
Figure 3 shows the six leading PCs (principal components) for the selected region and the associated explained variances. Overall, PC1 revealed a uniform pattern with a north-west to south-east gradient in its loadings ranging between 0.005–0.015. With an explained variance of 71%, it is the dominant weather situation over the year.
While PC3 and PC6 also indicate zonal pressure patterns, they both have a distinct dipole structure. While PC3 shows a gradient from northeast to southwest with values between 0.025 in the northeast and −0.025 in the southwest, PC6 reveals an alternating gradient from north to south with the highest positive loadings of 0.028 in the Gulf of Lion and the lowest loadings of −0.028 in Brittany and North Africa.
In contrast, PC2 and PC5 show a meridional dipole arrangement of the loadings. PC2 reveals negative values of −0.028 over Brittany and positive values of 0.016 in the southern Adriatic. PC5 shows values around 0.03 in the west and east, which is divided by a meridional extension of negative values over the western Mediterranean. This range reveals values of up to −0.02.
PC4 depicts a mixed form of the loading patterns. While in the northwest over Brittany and in the southeast in the Ionian Sea, positive loadings with values up to 0.03 are predominant, in the northeast and southwest negative values up to −0.03 arise. In the area of the Pyrenees a weak bridge between the two areas with positive loadings is formed.
In summary, PC1 with a declared variance of 70.9% shows a zonal arrangement of the loadings, as do PC3 and PC6, where the latter only plays a minor role with an explained variance of 0.8%. The patterns PC2 and PC4 can be assigned to a mixed circulation type and PC5 to a meridional one. The largely dominating pattern PC1, however, reveals very weak large scale gradients in comparison to the other modes.
Table 3 shows the correlations between the time scores of the PC patterns and the precipitation in the respective regions on monthly mean values. While the patterns of PC1, PC4 and PC6 reveal consistently negative correlations, the correlations of PC2 and PC5 are positive. With PC3 the correlation values are different according to the region, with the two regions west of the main ridge, namely the western coastal area and the central mountain area, showing negative correlations, while the remaining three regions namely the north-eastern, the eastern and the southern coast, show positive correlations.
For all PC patterns, the negative correlations are associated with the influence of positive loadings for the area of Corsica, whereas positive correlations are influenced by negative loadings for Corsica.
3.3. Relevance of Weather Situation for Rainfall Totals in the Rainfall Regimes
Table 4 shows the percentage distribution of all precipitation days within the PC patterns and the regions. The high explained variance of PC1 is also reflected in the high distribution of rain events. PC2 shows an increased occurrence of precipitation events for the eastern side, whereas PC3 shows that most events occur in the central mountainous region.
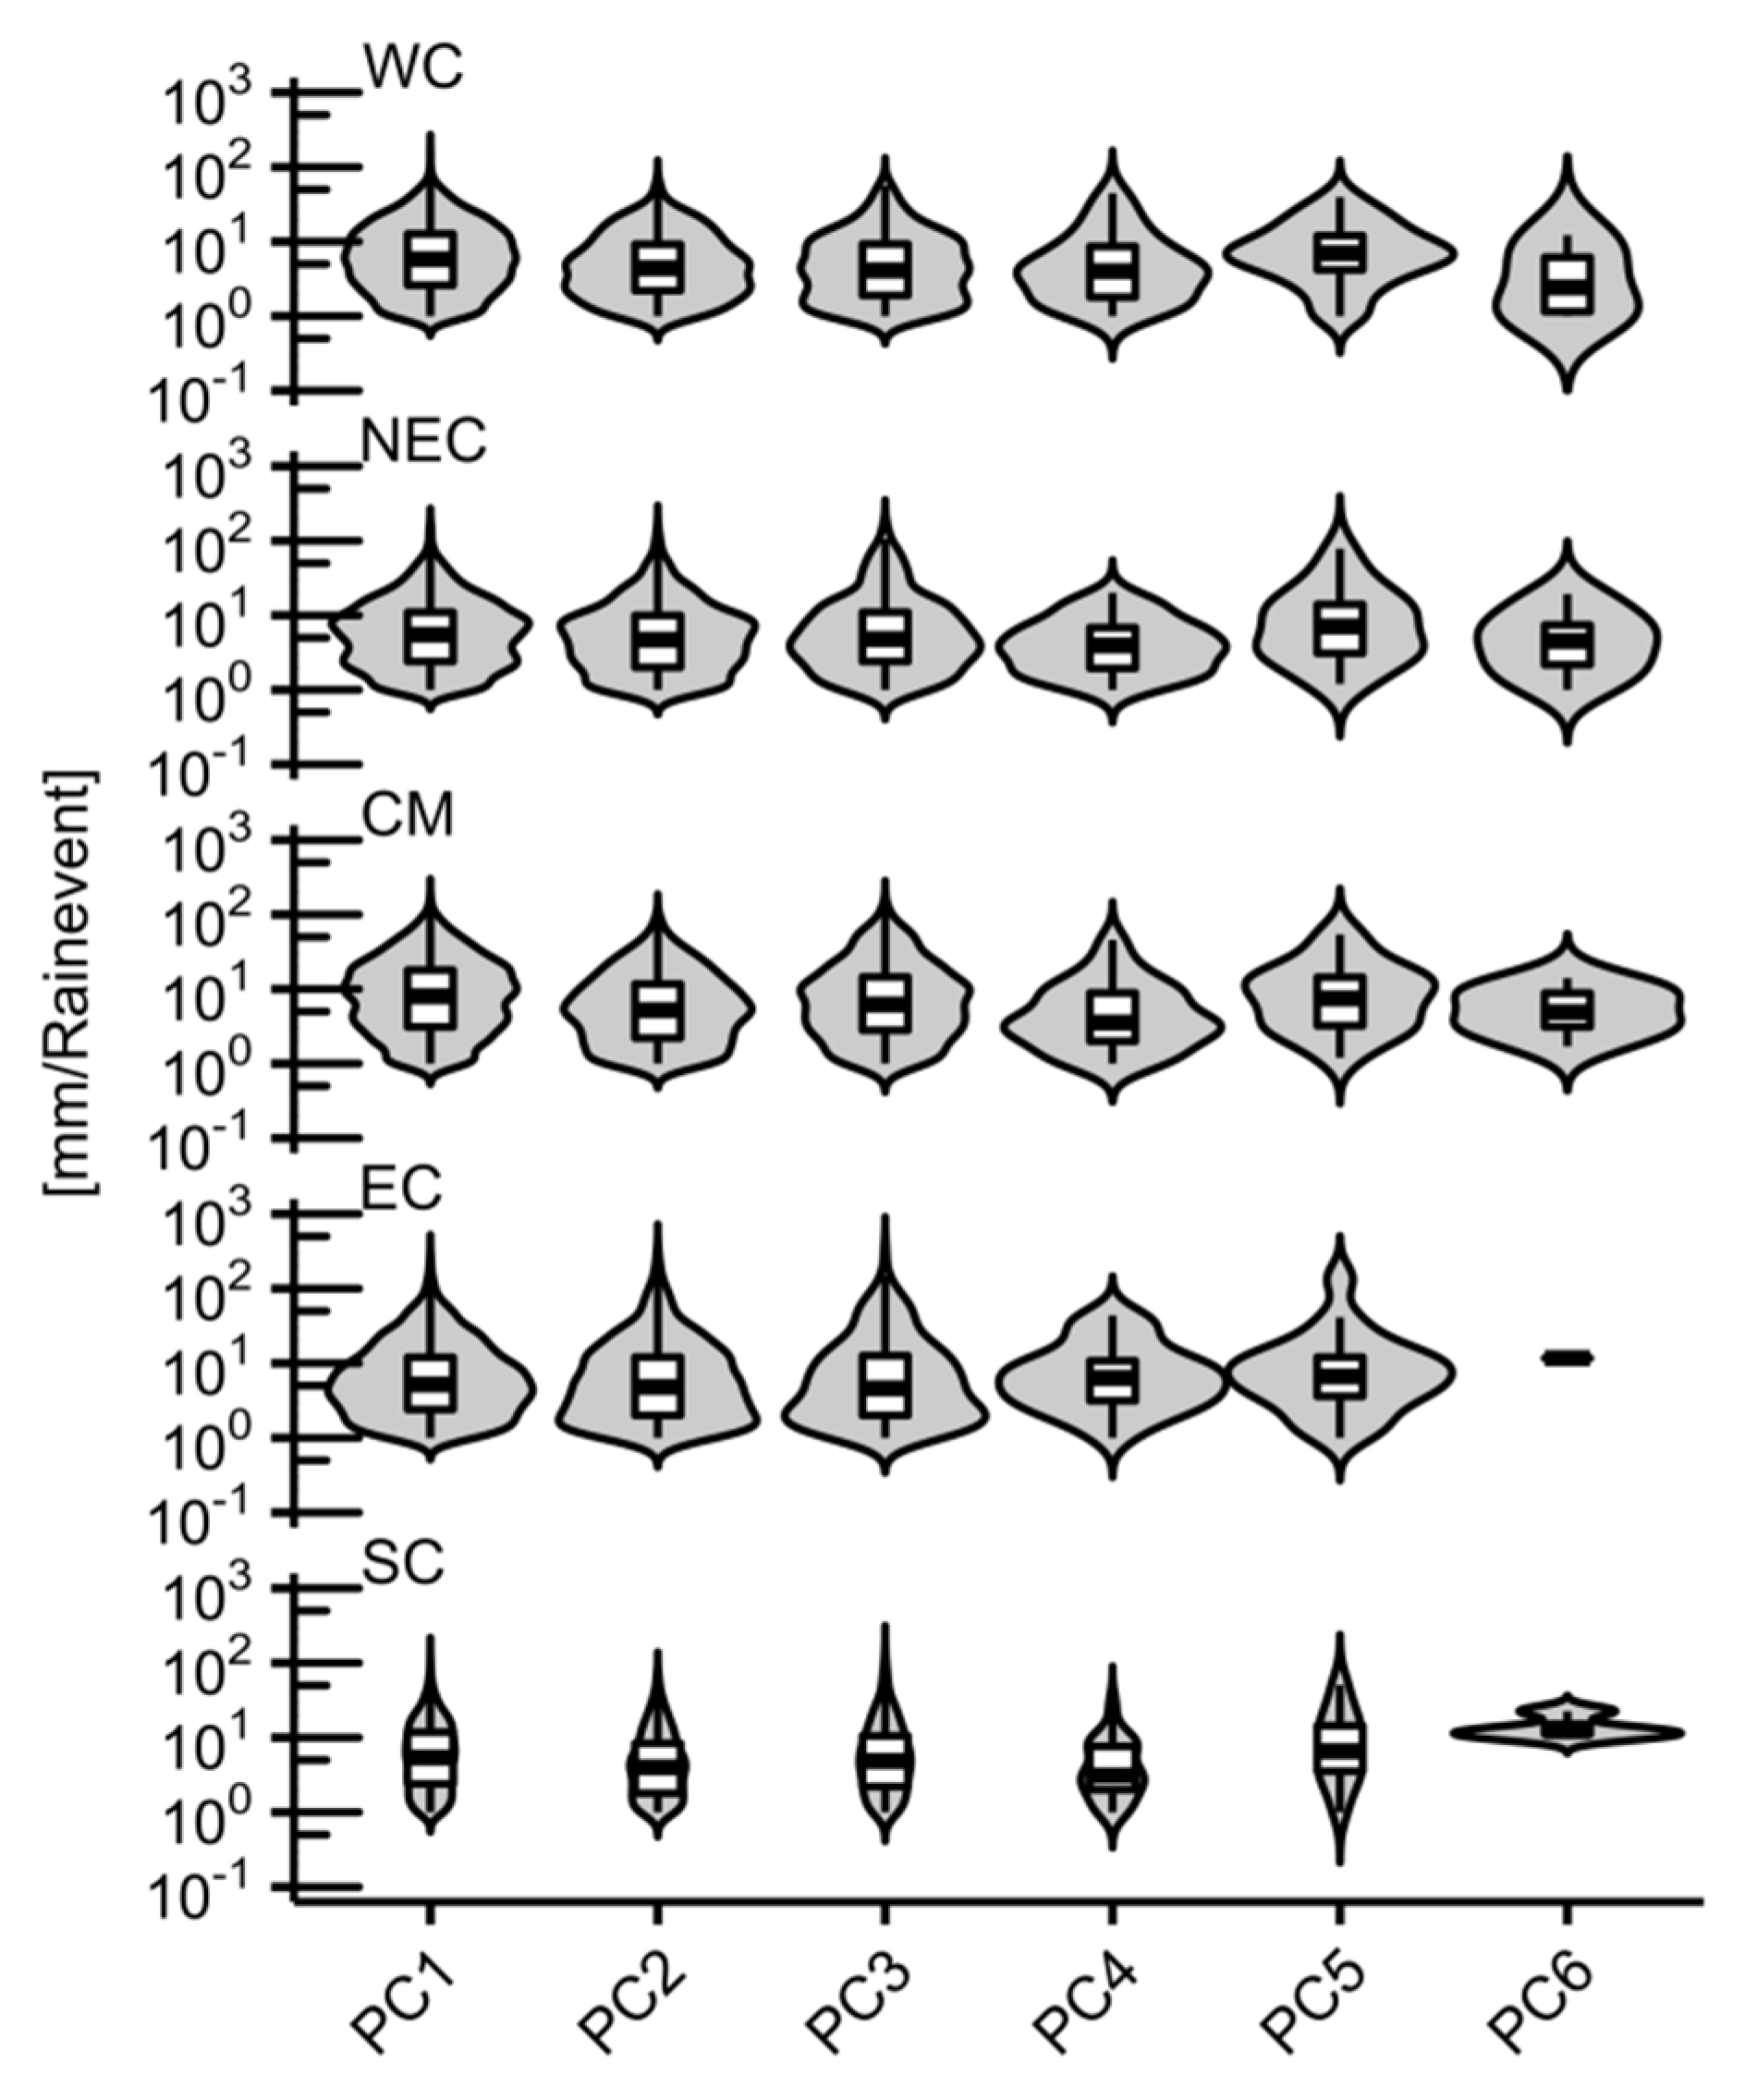
Figure 4 relates precipitation totals per precipitation event to the six circulation patterns from the objective weather type classification.
Regardless of the prevailing weather conditions, the median is highest in the central mountainous region (CM), while in the south coastal area (SC) the number of precipitation events is almost evenly distributed for different precipitation sums.
On the east coast (EC), PC1 reveals the lowest number of precipitation events, with event totals above 10 mm, and the lowest median of 5.2 mm. There, most precipitation events occur at 5 mm, whereas in the central mountainous region most precipitation events release 14 mm, at a median of 8 mm.
During PC2 weather conditions, in all regions the median is lower than in PC1. Also, the distribution of the frequencies of precipitation events is shifted towards weaker events. Only in the north-eastern coastal area, most precipitation events are characterized by 10 mm precipitation, whereas the frequency distribution of PC1 still shows a maximum value of 9 mm. For PC3, most precipitation events in the eastern coastal area occur at low total precipitation sums per event. Although the median for PC3 in the central mountainous region with 6.2 mm is lower than for PC1, the distribution shows more precipitation events with a precipitation sum of more than 50 mm, with an average event duration of 17 h. In the western and northeast coastal area regions there are proportionally more precipitation events with sums above 50 mm, with an average duration of 5 h and 15 h, respectively. For precipitation events occurring during PC4 conditions, the east in particular shows a shift in frequency towards more precipitation events with higher rainfall sums. Here, most precipitation events occur with a total precipitation sum of 10 mm at a median of 6.35 mm. In addition, more precipitation events with precipitation sums of greater than 50 mm occur, whereby the average event duration for precipitation events with more than 50 mm is 11 h. In contrast, the central mountainous region shows the lowest median. Also, the frequency distribution reveals the maximum at the lowest precipitation sum of all weather conditions at 5 mm. PC5 again shows a shift of the frequency distribution towards higher precipitation sums. In almost all regions the median reveals the highest value of 7 mm on average.
For further analysis of precipitation events according to duration and intensity,
Figure 5 shows the percentage of occurrence of each precipitation class (cf.
Table 1) for the predominant PC distributed over the respective region, and the resulting percentage of precipitation. The numbers indicate the absolute amount of precipitation sum and number of precipitation events within a regime per precipitation class.
In PC1 most precipitation events occur, independent of their region, as well as most precipitation amounts per precipitation class. West of the main mountain ridge, all events, regardless of class, occur with a frequency of at least 69%, with most events occurring in class LI. In the regions east of the main mountain ridge as well as in the south, PC1 is still the pattern with the most rain events in percentage and the highest precipitation sums, but the distribution between the different classes shows greater inhomogeneity, especially on the northeast coast, than in the regions on the west side. For example, only 54% of all LI events occur at PC 1 on the northeast coast and bring almost 50% of the precipitation in this class in this region.
At PC2 most precipitation events occur on the west side in the class SL, whereas events of class LI occur on the west coast (in the western mountainous region) with only 5% (9%) and thus are much less strongly represented than other precipitation classes. The situation is different in the eastern part of the island, where 30% (16%) of LI events occur at PC2 on the northeast coast (east coast). Also on the east side of the island more events of class SI occur, with 30% (northeast coast) and 25% (east coast) of all events within this class. On the west side, the SI class has a distribution of 13% (west coast) and 18% (central mountainous Region). It can be seen that during PC2 there are more rain events on the east side than on the west side of the island.
For PC3, LI events with 22% (central mountainous region) and 21% (southern coastal area) of the precipitation amount within this class are more intensive than in other PC patterns and regions, as the number of precipitation events is lower in the Central Mountainous Region (South Coast) with 13% (17%) and thus more precipitation per single event falls. In addition, SI events are slightly more intense in the Central Mountainous Region and on the East Coast.
In the remaining patterns (PC4, PC5 and PC6), only about 1–2% of rain events occur, regardless of class and region.
Within the individual regimes there is a shift in precipitation totals and precipitation days within the precipitation classes. While on the west and south coasts the majority of precipitation days and precipitation amounts fall during short events, further east in the central mountainous region it is the long events which have higher precipitation sums.
3.4. Local-Scale Driving Factors
As stated in the introduction, an important driver in precipitation formation and thus in determining precipitation regimes, are local-scale circulation patterns such as coupled land-sea and mountain-valley breeze systems. Since these local circulations have a diurnal cycle, hourly data are used for the analysis. Particularly during daylight, coupled sea-up slope breezes can carry water vapor inland, and lead, under strong thermal convection through heating of the slopes and a less stable stratification of the atmosphere, to convective clouds and precipitation.
Figure 6 shows the diurnal cycle of the mean wind field for DJF and JJA for days where the precipitation regimes are associated with breeze system. Based on the diurnal change of the wind direction, local circulations can be observed in all regions and seasons.
In the coastal regions, a land-sea breeze system forms during the course of the day, where the sea breeze is generally stronger than the nocturnal land breeze, which combines weaker thermal land-sea contrasts with nocturnal katabatic flows from the mountains. In JJA, the sea breeze wind speeds also increase during the course of the day, but the east coast reveal slower wind speeds in comparison to the other stations. The strongest diurnal cycle is recognized for the western coastal area, which might be due to the unique concave shape of the bay which fosters the nocturnal confluence of katabatic flows and strong daylight sea breezes due to thermal heating of the surrounding terrain. In DJF, the daylight breeze systems are weaker for most stations. Only in the regions further inland (northeastern coastal area and central mountainous region) are the winds more pronounced during the day in DJF compared to the regions directly on the coast. This might be (i) due to the lower land-sea thermal contrast and (ii) due to the perpendicular inclination as a result of inclined slopes and higher solar zenith angles. In JJA the differences in wind speeds between land and sea winds are less pronounced on the eastern coastal areas than in the other regions. While at the most coastal areas (western coastal area, eastern coastal area and southern coastal area) a rotation of the wind with nearly opposite directions is observed, only a slight rotation of the wind takes place inland (central mountainous region and north-eastern coast). Wind changes here might be more a result of topographic channelization of the synoptic wind than of thermal origin. Altogether, it is striking that also in winter diurnal changes in the wind systems occur, although the temperatures and thus the thermal land-sea contrast is reduced in comparison to JJA.
Figure 7 shows the distribution of the four precipitation classes in the respective regions and their percentage share, taking into account the presence of local winds on the day of the precipitation event. Most precipitation events occur in the SL class, with 16% occurring in the central mountainous region without local winds. Taking local winds into account, the percentage of SL events increases to 22% in the central mountainous region, with a percentage increase in SL events also in the northeast coast and south coast regions, and with local winds causing one third less precipitation events than without local winds. The second largest percentage difference between precipitation events with and without local winds occurs in class SI. In the northeast and south coast regions and in the central mountainous region, SI events on days with local winds occur more frequently, in percentage terms, on days with local winds than on days without local winds.
The remaining precipitation classes LI and LL show a lower or constant percentage of days with local winds compared to days without local winds.
In the regions of the west and east coast, all precipitation classes show a lower percentage of days with local winds than days without local winds.
The atmospheric vapor situation during short intense (SI) precipitation events with regard to weather situation and absence / occurrence of diurnal breeze systems is of particular interest for the formation of convective precipitation.
Figure 8 shows the daily course of the water vapor pressure deficit (vpd) anomaly on days of SI events taking into account local winds, divided into the respective regions and the predominant PCs, expressed as a percentage of the daily mean vpd. If no lateral vapor advection was present, a thermally driven positive vpd anomaly should be expected during noon-to-afternoon, and a negative at night. Due to the low temperatures during the night and the high relative humidity, the vpd is negative compared to the daily average, whereas during the day the temperature is high, the relative humidity is lower and as a consequence the vpd increases. If changes between high and low vpd values occur in short periods of time, this can be inferred from lateral humidity advection or very high evapotranspiration.
PC1 shows a similar course, irrespective of the region; with the vpd in the hours before sunrise being significantly lower than the daily average. This is due to the low air temperature and the simultaneously high relative humidity. During the course of the day, this deficit increases due to the higher air temperature and the decrease in relative humidity, with the greatest deficit reached in the early afternoon. In the central mountainous region, the deficit is higher on days with local winds at noon, with 61% of the daily mean, which is rapidly reduced from 12:00 onwards.
At PC2, especially on the east coast, the deficit is quickly compensated during the course of the day from 13:00 on, taking into account local winds, and the vpd falls from 94% of the daily mean to −6% at 16:00. In the central mountainous region, the deficit is also compensated on days with local winds after reaching the maximum at 11:00 with a vpd of 94% of the daily mean. At 14:00 the vpd is already at −16% of the daily average.
On days with the prevailing PC3 pattern, the vpd on the west coast between 12:00 and 14:00 shows a short-term decline from around 40% of the daily average to 7% of the daily average vpd and arises again. In the central mountainous region, which directly borders to the east, a compensation of the deficit can also be observed. Here the values from 14:00 onwards fall from the previous 35% of the daily mean to −27%. Due to the later decline of the vpd further inland, a moisture transport from the west coast towards the east is discernible. On the north-east coast, too, a short-term compensation of the deficit similar to that of the west coast can be seen. Here, the vpd is already compensated between 10:00 and 12:00, decreases from the daily mean to 66% of the mean and re-increases thereafter. From 14:00 on, the vpd starts to fall again and drops to −9% of the daily average by 16:00.
4. Discussion
The classification of the regions in Corsica, on the basis of their precipitation totals, shows a clear spatial delimitation depending on the location and topographical conditions of the stations on the island. The two regions east of the main mountain ridge reveal influences of the rain shadow, which is reflected in the lower precipitation amount especially in the northeast. The lowest rainfall totals can be seen in the southern region of the island. Here the proximity to the neighboring island Sardinia plays a role in the precipitation distribution. Sardinia prevents the transport of humid marine air to South Corsica and thus the formation of precipitation. Numerical simulations of [
27] showed that, if Sardinia was completely removed, humid sea air masses could be transported from southeast to South Corsica more easily and, in combination with increased wind speeds, enhance precipitation formation. The west coast shows similar amounts of precipitation as the other coastal regions of the island. Although the west coast is exposed to frontal passages due to the westerly wind zone, the precipitation sums are not increased compared to the other coastal regions. Further inland, towards the east, higher precipitation totals are present throughout the year due to the strengthening effect of the topography (cf. Central Mountainous Area).
Local wind systems in Corsica are developed year-round in the form of land-sea wind systems on the coasts, mountain wind systems in the interior, or a combination of both. In the low-radiation winter months, the wind speeds are lower and the reverse wind direction weaker due to smaller temperature differences between land and sea. On the east side of the island, the differences in direction and speed are less pronounced compared to the west, due to the characteristics of the coastline. While there is a straight coastline on the east coast in which the exchange of water takes place constantly, the west coast is characterized by many concave-shaped bays in which the SST can increase even in winter, with little exchange with the environment, and thus strengthen the local land-sea wind system. During the summer months, wind speeds increase during the day due to the greater temperature differences between land and sea. Due to the intensification of the sea winds and the interaction with local mountain winds on the west coast it can be assumed that the sea winds also transport humid air, which leads to convective precipitation during the course of the day, due to the structure of the terrain. Especially long events are an indicator of frontal precipitation, which is usually connected, east of the main mountain ridge, with westerly wind circulation. This shows that despite the overflowing of the main ridge there is still sufficient humidity in the atmosphere, leading to precipitation on the east side.
In the summer months, when synoptic forcing is low, local wind circulations may increase during the day (e.g., [
8]) thus frontally induced precipitation in the form of long precipitation events are reduced. In all areas of the island, long precipitation events are reduced or on the same percentage level when local winds occur.
SI events occur more often, except in the coastal regions of the west and east coasts, when local winds prevail. In this case, moisture is also transported inland, which means that the greatest difference is in the central mountainous region. This is also due to the fact that in the interior of the country, due to the distinctive topography, an amplification effect can be observed which favors the formation of SI events.
In the East Coast region the percentage of SI events with local winds is reduced. One reason may be the topography in this region, which is characterized by a large plain, such that the possibility of a reinforcing effect by the topography is not given.
Within the regions there are shifts in the number of precipitation events and their precipitation sum. On the west coast, for example, it can be seen that both the number and the precipitation sum during short events outweigh that of long events. Despite the influence of the westerly wind drift and on the precipitation-facing side of the island, the number of LI-events, as an indicator for frontal precipitation events, is with 76 events significantly lower than the number of LI-events in the east bordering the central mountainous region, where the number is over 200 events and the amount of precipitation with almost 8500 mm is 3.5 times the amount on the west coast. LI events in these two regions also differ in their average intensity per event. This suggests that the terrain has a significant influence on the genesis of precipitation events and leads to an intensification of precipitation events.
The pattern of the PC1 is characterized by high pressure in the whole region. Due to the weak gradient and the associated low synoptic force behind it within the pressure area, the formation of local winds is favored, which mostly form on radiation days during the summer months. This situation encourages the occurrence of orographic and convective precipitation events, which is also reflected in the higher precipitation sums per precipitation event. The vpd shows for a higher deficit at noon PC1 at all stations. Due to the high pressure situation and the associated radiation days, this deficit is temperature-related and will not be compensated until the afternoon. Due to the radiation days, local breezes can better develop and transport moisture towards the interior of the island. On the western side in the regions of the west coast and the central mountainous region it can be seen that humid air masses are transported by the local breezes from the coast to the interior of the country, since the deficit is compensated later in the interior. With a strengthening of the inland local breezes by the westerly wind circulation, the moisture is also transported further to the northeast coast and compensates the vpd in the early afternoon from 13:00 onwards. Due to the transport of moisture and the associated compensation of the vpd, it can be concluded that this is related to convective precipitation events (SI events). Also, [
30] showed in their study that especially in late summer and autumn there is increased lightning activity in Corsica in the afternoon, which was evaluated as an indicator for convective precipitation events.
At PC2 there is a circulation over Corsica from the south and southeast, which comes as wind from North Africa known as sirocco. It is caused by pressure differences between a low-pressure area over southern Europe and hot air over the Sahara and absorbs moisture over the Mediterranean Sea and causes precipitation on Corsica. It was shown by [
20] in his study about extreme precipitation events on Corsica that in a meridional pressure situation with a flow from southeast, especially on the east side of the island, very high precipitation was measured, which was derived from 24 h accumulated precipitation values. In this study it was shown that LI events on the east side of the island, in the areas of east coast and northeast coast, bring the largest amount of precipitation with a small number of events. As already observed in PC1, PC2 of the vpd shows a daily cycle with the largest deficit at noon. Due to the prevailing southeast circulation and the resulting stronger local winds on the east side of the island, the moisture transported by the sea breezes reaches the regions at 12:00 (east and northeast coastal area). On the west side in the central mountainous region the vpd decreases from 13:00 on and on the western coastal area it decreases at 15:00.
PC3 shows a zonal circulation with a pronounced flow direction over Corsica from the west and southwest. On the one hand, this could indicate the Libeccio wind which, especially in the north of Corsica, blows all year round from the west and southwest [
31]. On the other hand, this PC pattern increasingly leads to frontal passages. This is reflected in a higher precipitation sum per event but also the percentage of LI events is highest and LL events show a higher occurrence than in the other PC patterns. Both types of precipitation events are an indicator of frontal precipitation due to their event duration. On the eastern side, however, the precipitation sum per event is lower than in the other regions. Here, the air masses sink as they overflow the main mountain ridge, which favors the formation of lee waves, which affect the local wind systems by reducing their intensity.
PC4 shows for Corsica a circulation from southern directions which are based on higher air pressure with their center over Malta. This high pressure forms a weak high pressure bridge over the Pyrenees with a stronger high pressure with its center over the Biscay. Despite a weak gradient over Corsica, the winds bring more humidity to the east side of the island, with a south-easterly wind direction, and strengthen the local wind circulation during the day. The increased humidity in the atmosphere leads to an average higher precipitation sum per event in this part of the island. In addition, the northeastern and eastern coastal areas show the highest rainfall during long precipitation events.
In the pattern of PC5, Corsica shows a circulation from northern directions with a pronounced trough position. This can be considered as a basis for the mistral wind. Characteristic for this are an area with high air pressure over the Bay of Biscay and an area with lower air pressure in Italy. In this situation, polar air flowing into the Mediterranean area and blocked by the Alps is canalized by the Rhône valley. The fact that cold polar air meets warm air masses from the Mediterranean region provides the conditions for the formation of Genoa lows. Thus, intensive precipitation occurs, which is also reflected in a higher precipitation sum per precipitation event.
Reference [
23] analyzed the integrated water vapor (IWV) at three different locations, located in the regions of the west coast, the northeast coast and the east coast, for days where differences in the IWV are associated with locally induced and topographically determined differences. This is consistent with the group of days defined in the present study on which local winds occur. It is shown by [
23] that, especially on the west coast, sea breezes have only a minor influence on the IWV in the lower atmospheric layers. Here too, the analysis of the near-ground layers shows that in the morning the vpd cannot be compensated despite the onset of sea breezes, and the deficit increases.
In the interior of the country there is also a larger deficit of water vapor in the morning, which cannot be compensated by the onset of sea breezes, and shows the largest deficit in the late morning. However, [
23] indicates an increase of the IWV for the region in the interior of the country, whereby it can be assumed that this is related to moisture transports outside the air layers near the ground, since this increase in moisture cannot be observed there.
On the east coast an increase in humidity could also be observed due to a decrease in the vpd in the early afternoon. In contrast to [
23], where the IWV on the east coast rises only in the late afternoon, the water vapor in the layers near the ground rises already at noon.
At PC3, where more westerly winds overlap the local breeze circulation, a decrease of vpd and thus an increase of humidity in the atmosphere can only be registered in the late afternoon. This is consistent with the observations of [
23], where the east coast of the island is often influenced by the mountains and the effect of advective venting, which can be observed later than in the regions further west.
5. Summary and Conclusions
In this study, we investigated precipitation events in different regions on the mountainous island of Corsica, and divided them into locally and large-scale induced events with regard to their drivers. In order to better identify the regional differences, a cluster analysis based on hourly precipitation data was carried out in advance and, therefore, the island was divided into 5 precipitation regimes. The precipitation events were subdivided into four classes with respect to their duration and intensity, representing both local/non-local and convective/non-convective types: long intensive (LI), which characterizes non-local frontal precipitation with convective periods, long light (LL), which includes non-local and non-convective precipitation, short intensive (SI), which occurs during local and convective events, and short light events (SL), which represent local but non-convective precipitation events. Quantification of the large-scale factors influencing the rain events were provided by a PCA using the ERA-5 reanalysis data. For the investigation of locally induced precipitation events within the regimes, diurnal wind direction changes were used to quantify moisture transport due to a developed land-sea breeze and strengthening effects caused by mountain breezes.
Overall, 6 resulting patterns (98% of explained variance) were identified representing the high-pressure weather situation, meridional as well as zonal circulation types. Particularly, during high pressure conditions (PC1) local winds developed on radiation days due to the low gradient situation. Due to the high explained variance (71% PC1), this pattern occurred most frequently and thus was associated with a large number of precipitation days. Nevertheless, it can be seen that on the east and south side of the island less-intensive precipitation events were registered. In the western part of the island, however, more intensive but also longer continuous precipitation events occurred due to a reinforcing effect of the pronounced topography. Here it was also revealed that local conditions and factors have a strong influence on large-scale precipitation events. On the west coast short precipitation events were predominant, while further inland long precipitation events prevailed, although both regions were under the direct influence of the westerly wind circulation. The pronounced topography further inland is a determining local factor for the intensity and length of frontal precipitation events.
In contrast, the meridional pattern of pressure centers as demonstrated in PC2 resulted in a south-easterly flow onto the island. This situation is reflected in a higher moisture transport in the afternoon in both regions of the eastern side of the island. The consequence is an increase of the number of more intensive precipitation events and, due to the topography, a higher number of long events in the higher elevations in the north-east of the island. On the west side, however, SL events prevailed due to the leeward position of the southeast current.
Finally, the zonal circulation (e.g., PC3) featured frontal passages more frequently in Corsica, which is generally reflected in higher precipitation totals per event. However, on the west coast a topographical amplification effect is retarded, which means that the number of events and the sum per event is lower. On the other hand, in the interior of the island as well as on the south coast, intensive events of the classes SI and LI offered higher precipitation in total.
With regard to water availability, this study helps us to understand both the origin of precipitation and the precipitation formation, and shows how different circulation patterns affect the distribution of precipitation. The results and processes described in this article could also be applied to other islands with similar topographic characteristics and dimensions, and may thus be useful for other regions.

 ,
, 


