Article

Wet Inorganic Nitrogen Deposition at the Daheitin Reservoir in North China: Temporal Variation, Sources, and Biomass Burning Influences

1
State Key Laboratory of Simulation and Regulation of Water Cycle in River Basin, China Institute of Water Resources and Hydropower Research, Beijing 100038, China
2
State Key Laboratory of Severe Weather & Key Laboratory for Atmospheric Chemistry, Chinese Academy of Meteorological Sciences, Beijing 100081, China
*
Author to whom correspondence should be addressed.
Atmosphere 2020, 11(11), 1260; https://doi.org/10.3390/atmos11111260
Submission received: 27 October 2020 / Revised: 17 November 2020 / Accepted: 17 November 2020 / Published: 23 November 2020
(This article belongs to the Section Biosphere/Hydrosphere/Land–Atmosphere Interactions)

Abstract

:
Atmospheric nitrogen deposition is of great concern to both air quality and the ecosystem, particularly in northern China, which covers one-quarter of China’s cultivated land and has many heavily air polluted cities. To understand the characteristics of wet N deposition at rural sites in northern China, one-year wet deposition samples were collected in the Daheitin reservoir region. Due to the intense emissions of gaseous nitrogen compounds from heating activities during cold seasons and distinct dilution effects under different rainfall intensities and frequencies, the volume weighted mean concentrations of wet N deposition showed higher levels in dry seasons but lower levels in wet seasons. In contrast, the wet N deposition rates varied consistently with precipitation, i.e., high during the wet season and lower during the dry season. The annual wet deposition rate of total inorganic ions (the sum of NO3–N and NH4+–N) at the rural site in North China from July 2019 to June 2020 was observed at 18.9 kg N ha−1 yr−1, still remained at a relatively high level. In addition, biomass burning activities are ubiquitous in China, especially in northern China; however, studies on its impact on wet N deposition are limited. Non-sea salt potassium ion (nss-K+) was employed as a molecular tracer to investigate the characteristics of biomass burning activities as well as their impact on the chemical properties of wet N deposition. Three precipitation events with high nss-K+ levels were captured during the harvest season (June to July). The variations in the patterns of nss-K+, deposited N species, and ratios of nss-K+ to nitrogen species as well as their relationships all indicated that biomass burning emissions contributed remarkably to NO3–N but had a minor influence on NH4+–N.

1. Introduction

With the rapid development of agriculture, industry, and the expansion of the urban population over the last several decades, anthropogenic activities, such as fossil fuel combustion, chemical fertilizer, etc., have greatly increased the levels of reactive nitrogen (N) in the atmosphere [1,2,3,4]. Reactive N in the atmosphere not only leads to air quality degradation by contributing to the production of ozone and PM2.5 [5,6,7,8,9,10,11] but also disturbs the N cycle through excess deposition of N, leading to aquatic eutrophication, soil acidification, and impacting on ecosystem functions [2,12,13,14,15].
Nitrogen deposition rates decreased in the USA and Europe several decades ago [3,12,16,17,18]. In China, however, NH3 and NOx have both continuously increased due to the high loading emissions from agricultural and industrial activities under the rapid economic development over the past few decades [19,20]. The annual total reactive nitrogen deposition (27.2 ± 6.7 kg N ha−1) significantly increased at a rate of 10% from 2011 to 2018 [21]. SO42− has previously been reported for many sites to be the most dominant inorganic PM2.5 component in China, followed by NO3 and NH4+ [22,23]. Under rising NOx emissions, a result of industrialization and increase in vehicle numbers, NO3 concentrations have been observed to exceed those of SO42− in parts of China [10,24,25,26]. Meanwhile, NH3 emissions have increased over the several past decades [27]; for example, the annual concentration of NH3 in 2018 was 14.2 μg N m−3, which is twice that in 2011 (7.0 μg N m−3), in Zhengzhou, China [28]. High emissions of NH3 and NOx, combined with high loading of NO3 and NH4+ in ambient particulates subsequently contributed to the high deposition of atmospheric N in China [2,29,30,31,32]. In spite of the site-to-site variability in the data, total inorganic N deposition increased significantly with an average annual increase of 0.41 kg of nitrogen per hectare (kg N yr−1) between 1980 and 2010 [2]. To address severe air pollution issues, the Chinese government implemented the Air Pollution Prevention and Control Action Plan (Action Plan) in 2013. As a result, China’s air quality has improved through the substantial reduction of several pollutants, in particular, SO2 and particulates [19,20]. Under these air pollutant control measures, a subsequent decrease in atmospheric N deposition was expected. For example, the average wet total inorganic N deposition rate in Beijing during 1998 to 2004 was 30.6 kg N ha−1 yr−1 [33], while it decreased to 8.0 kg N ha−1 yr−1 at a rural site in Beijing during 2017–2018 [34].
The North China Plain (NCP) is one of the most polluted regions in China and also greatly affects the air quality status of downwind regions [35,36,37]. Scattered among the vast areas of farmlands in the NCP, which comprises one-quarter of China’s cultivated land [26,38], are many industries of (such as power, steel, chemical industry, etc.) heavily populated large cities. High loadings of ambient particles and gas phase pollutants (e.g., NH3, NO2, and SO2) in the NCP are transferred from the atmosphere to the Earth’s surface and input into ecosystems increasing the N deposition rate [39]. The annual deposition of inorganic N in northern China was in the range of 15 to 50 kg N ha−1 yr−1 over 2003 to 2006 [40] and 16.3 to 28.2 kg N ha−1 yr−1 over 2007 to 2010 [32]. This deposition can lead to significant and serious ecological degradation in terrestrial and aquatic systems. Previous works evaluating N deposition fluxes as well as the influence of air pollutant control measures were mostly limited to urban areas [28,34,41], while researches in rural areas of North China were rarely reported.
Additionally, previous works have mostly focused on the agricultural or industrial sources of N deposition in the atmosphere, while the influence of biomass burning on N deposition has rarely been reported [29,42,43,44]. Biomass burning activities are ubiquitous in China, especially in North China, where there is an enormous rural population and winter heating custom. Based on previous studies, two intensive biomass burning episodes are typically observed in China: one occurring in the late spring and early summer (mostly in June), featuring open-field burning of agricultural residue after wheat straw harvest, and the other one in the late fall (between October to November), caused by agricultural residue burning after wheat or corn harvest [45,46]. Thus, the objectives of this study were to quantify: (1) the amount and temporal variation of wet N deposition at a rural site in North China after the clean air policy in China was implemented; (2) the sources of information as well as the influences of biomass burning for wet N deposition at the rural site in North China.

2. Experimental Section

2.1. Sample Collection

This study was carried out at the area of Daheitin Reservoir (DHT) (40.17° N, 118.33° E), which is an important drinking water source for the city of Tianjin and Tangshan (two megacities in North China) (Supplementary Materials, Figure S1). The sampling station was located on top of a two-story building, approximately 3.0 m above ground, surrounded by a small village with approximately 500 inhabitants, roughly 1.0 km to the DHT Reservoir. Precipitation samples were collected using an automatic wet deposition collector that opens its lid automatically to collect a rainwater sample when it rains and closes automatically when the rain stops. The collected rainwater samples were transferred to pre-cleaned brown polyethylene bottles (200 mL) and stored in a refrigerator at −20 °C until chemical analysis. A total of 37 precipitation samples were collected from June 2019 to June 2020, covering the whole year, including the wet season (June–September) as well as the dry season (October–May).

2.2. Chemical Analysis

The rain samples were filtered with 0.45 μm filters to separate insoluble fractions before chemical analysis of the ions. The water-soluble inorganic ions in precipitation sample, including three anions (i.e., SO42−, NO3, Cl) and five cations (i.e., NH4+, Ca2+, Na+, K+, and Mg2+) were analyzed by a Dionex ICS-3000 ion chromatograph (Thermo Fisher Scientific. Ltd., Waltham, MA, USA). The potassium concentrations presented here were corrected by a sea salt indicator (i.e., sodium; Cnss-K+ = CK+ − 0.0355× CNa+) that has been widely used for various field observations [47,48,49]. More details about the water-soluble inorganic ion analysis method can be found elsewhere [50].

2.3. Calculations

2.3.1. The Annual Volume-Weighted Mean Concentrations (Cvwm, mg N L−1)

C v w m = i = 1 n ( C i × P i ) i = 1 n P i
The annual volume-weighted mean (VWM) concentrations of inorganic nitrogen species (Cvwm, mg N L−1) were calculated using Equation (1). Ci is the mass concentration of inorganic nitrogen species in the ith sample (mg N L−1), Pi is the precipitation amount collected within the ith sampling period (mm), and n was the total number of precipitation samples during the whole year.

2.3.2. Flux of Wet N Deposition (Fwd, kg N ha−1)

F = 0.01 × i = 1 n C i × P i
Fwd represents the monthly, seasonal, and annual wet deposition N flux, calculated by Equation (2). Ci is the mass concentration of NH4+-N and NO3-N (mg N L−1), and Pi (in mm) is the total amount of precipitation over a month, season or year.

3. Results and Discussion

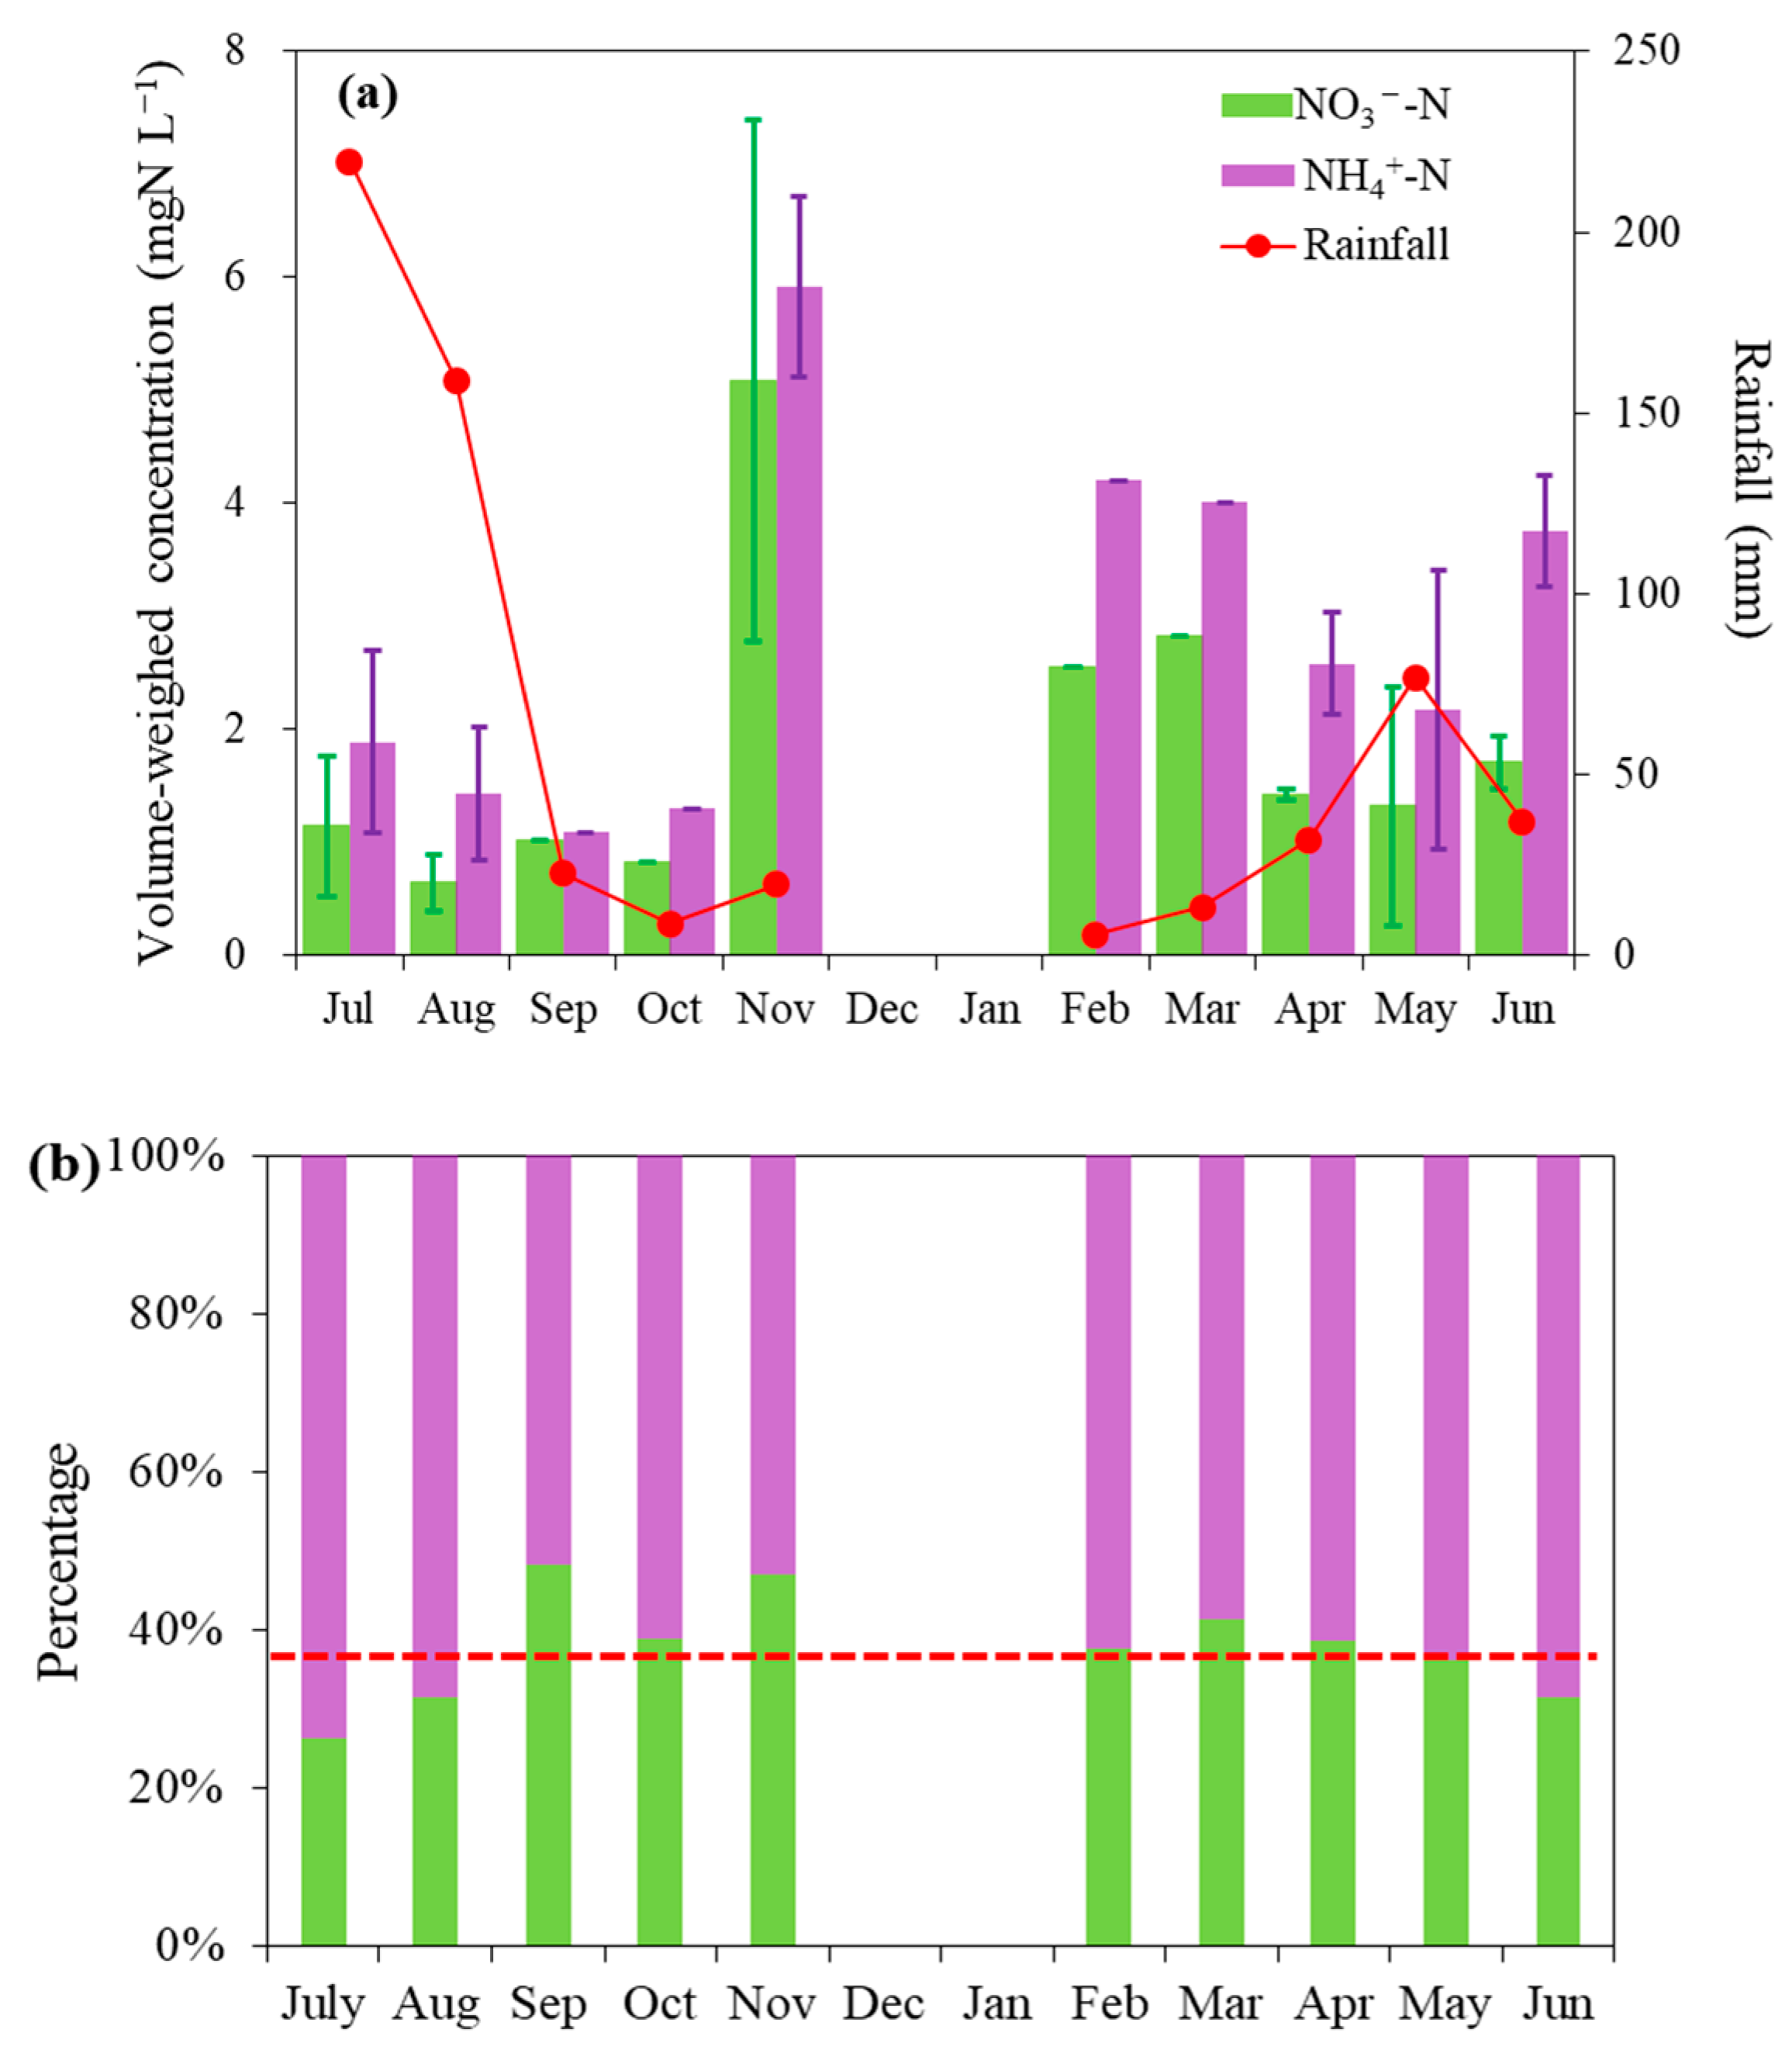
3.1. Concentrations of Inorganic Nitrogen Species in Rainwater

The total amount of precipitation for the whole year in the DHT reservoir area from July 2019 to June 2020 was 595 mm, similar to what was observed at other sites in North China [34] but obviously lower than in South China [29], East China [51], and Southeast China [42,52]. NO3, SO42−, and NH4+ were the three most abundant ions in the rainwater samples with annual VWM concentration of 4.69 mg L−1, 4.03 mg L−1, and 2.71 mg L−1, respectively. With the rapid urbanization and industrialization, vehicle emission sources have become increasingly prevalent in China, even in rural areas, leading to NO3 concentrations exceeding those of SO42− at the DHT site with an annual average mass ratio (NO3/SO42−) of 1.20, which is higher than previous aerosol observations in North China (<1.0) [22,23,24]. Ca2+ was the second most abundant cation with an annual VWM concentration of 1.54 mg L−1, exhibiting a non-negligible contribution of soil dust sources in the atmosphere at the rural site in North China (Table 1).
Most of the rain events occurred during the summer from June–August (Figure 1; Table 2). During the entire sampling period, precipitation in the DHT region was concentrated in the summer season (416 mm), 70% of the whole year’s precipitation (595 mm). The annual VWM concentrations of deposition of inorganic N species, i.e., NH4+–N, NO3–N, and TIN (the total sum VWM concentrations of NH4+–N and NO3–N) were 2.11 mg N L−1, 1.06 mg N L−1, and 3.17 mg N L−1, respectively. Notably, seasonal VWM concentrations of NH4+–N and NO3–N showed higher levels in autumn and winter, and the lowest in summer (Figure 1). In late autumn and winter, more gaseous nitrogen compounds (i.e., NOx) are accumulated in the atmosphere due to the increased emissions from coal combustion for heating and biomass combustion activities, as well as rare precipitation wash out, subsequently resulting in higher concentrations of N deposition. In contrast, there was no coal combustion for heating over the summer season, the emission of precursor gases were relatively lower, and coupled with the dilution of frequent rainfall events. The VWM concentration of NO3–N was observed at its lowest level in summer (Figure 1) and showed a negative relationship with precipitation amount (R2 = 0.22, p < 0.05, Figure S2).
Compared to summer months, the gap between NH4+–N and NO3–N was smaller in the autumn and winter months (Figure 1a). This may have been due to the large amount of NOx emissions during heating-related coal combustion in November to March in northern China and coupled with the decreased NH3 emissions from agriculturally associated sources; the gap between NH4+–N and NO3–N was reduced during the cold winter season. Accordingly, the proportion of NO3–N to TIN in wet deposition showed a similar variation pattern, with lower proportions in the summer months, i.e., June (31.3%) and August (31.0%) and higher ones in September (48.2%) and November (46.2%) as shown in Figure 1b. The annual VWM concentrations of NH4+–N and NO3–N observed in this study (2.11 mg N L−1 and 1.06 mg N L−1, respectively) were lower than those measured in North China during the years before the Action Plan was implemented in 2013, for example, during 1999 to 2004 (2.22 mg N L−1 for NO3–N and 4.76 mg N L−1 for NH4+–N) [33]. However, this level was still higher than those observed in South China over 2016–2017 (0.5–0.9 mg N L−1 for NO3–N and 0.7–1.3 mg N L−1 for NH4+–N) [29], a karst catchment from 2016–2017 (0.3 mg N L−1 for NO3–N and 0.7–0.9 mg N L−1 for NH4+–N) [42], and rural sites in the central Sichuan Basin of China from 2011–2013 (1.05 ± 0.91 mg N L−1 for NO3–N and 1.48 ± 1.05 mg N L−1 for NH4+–N) [52].

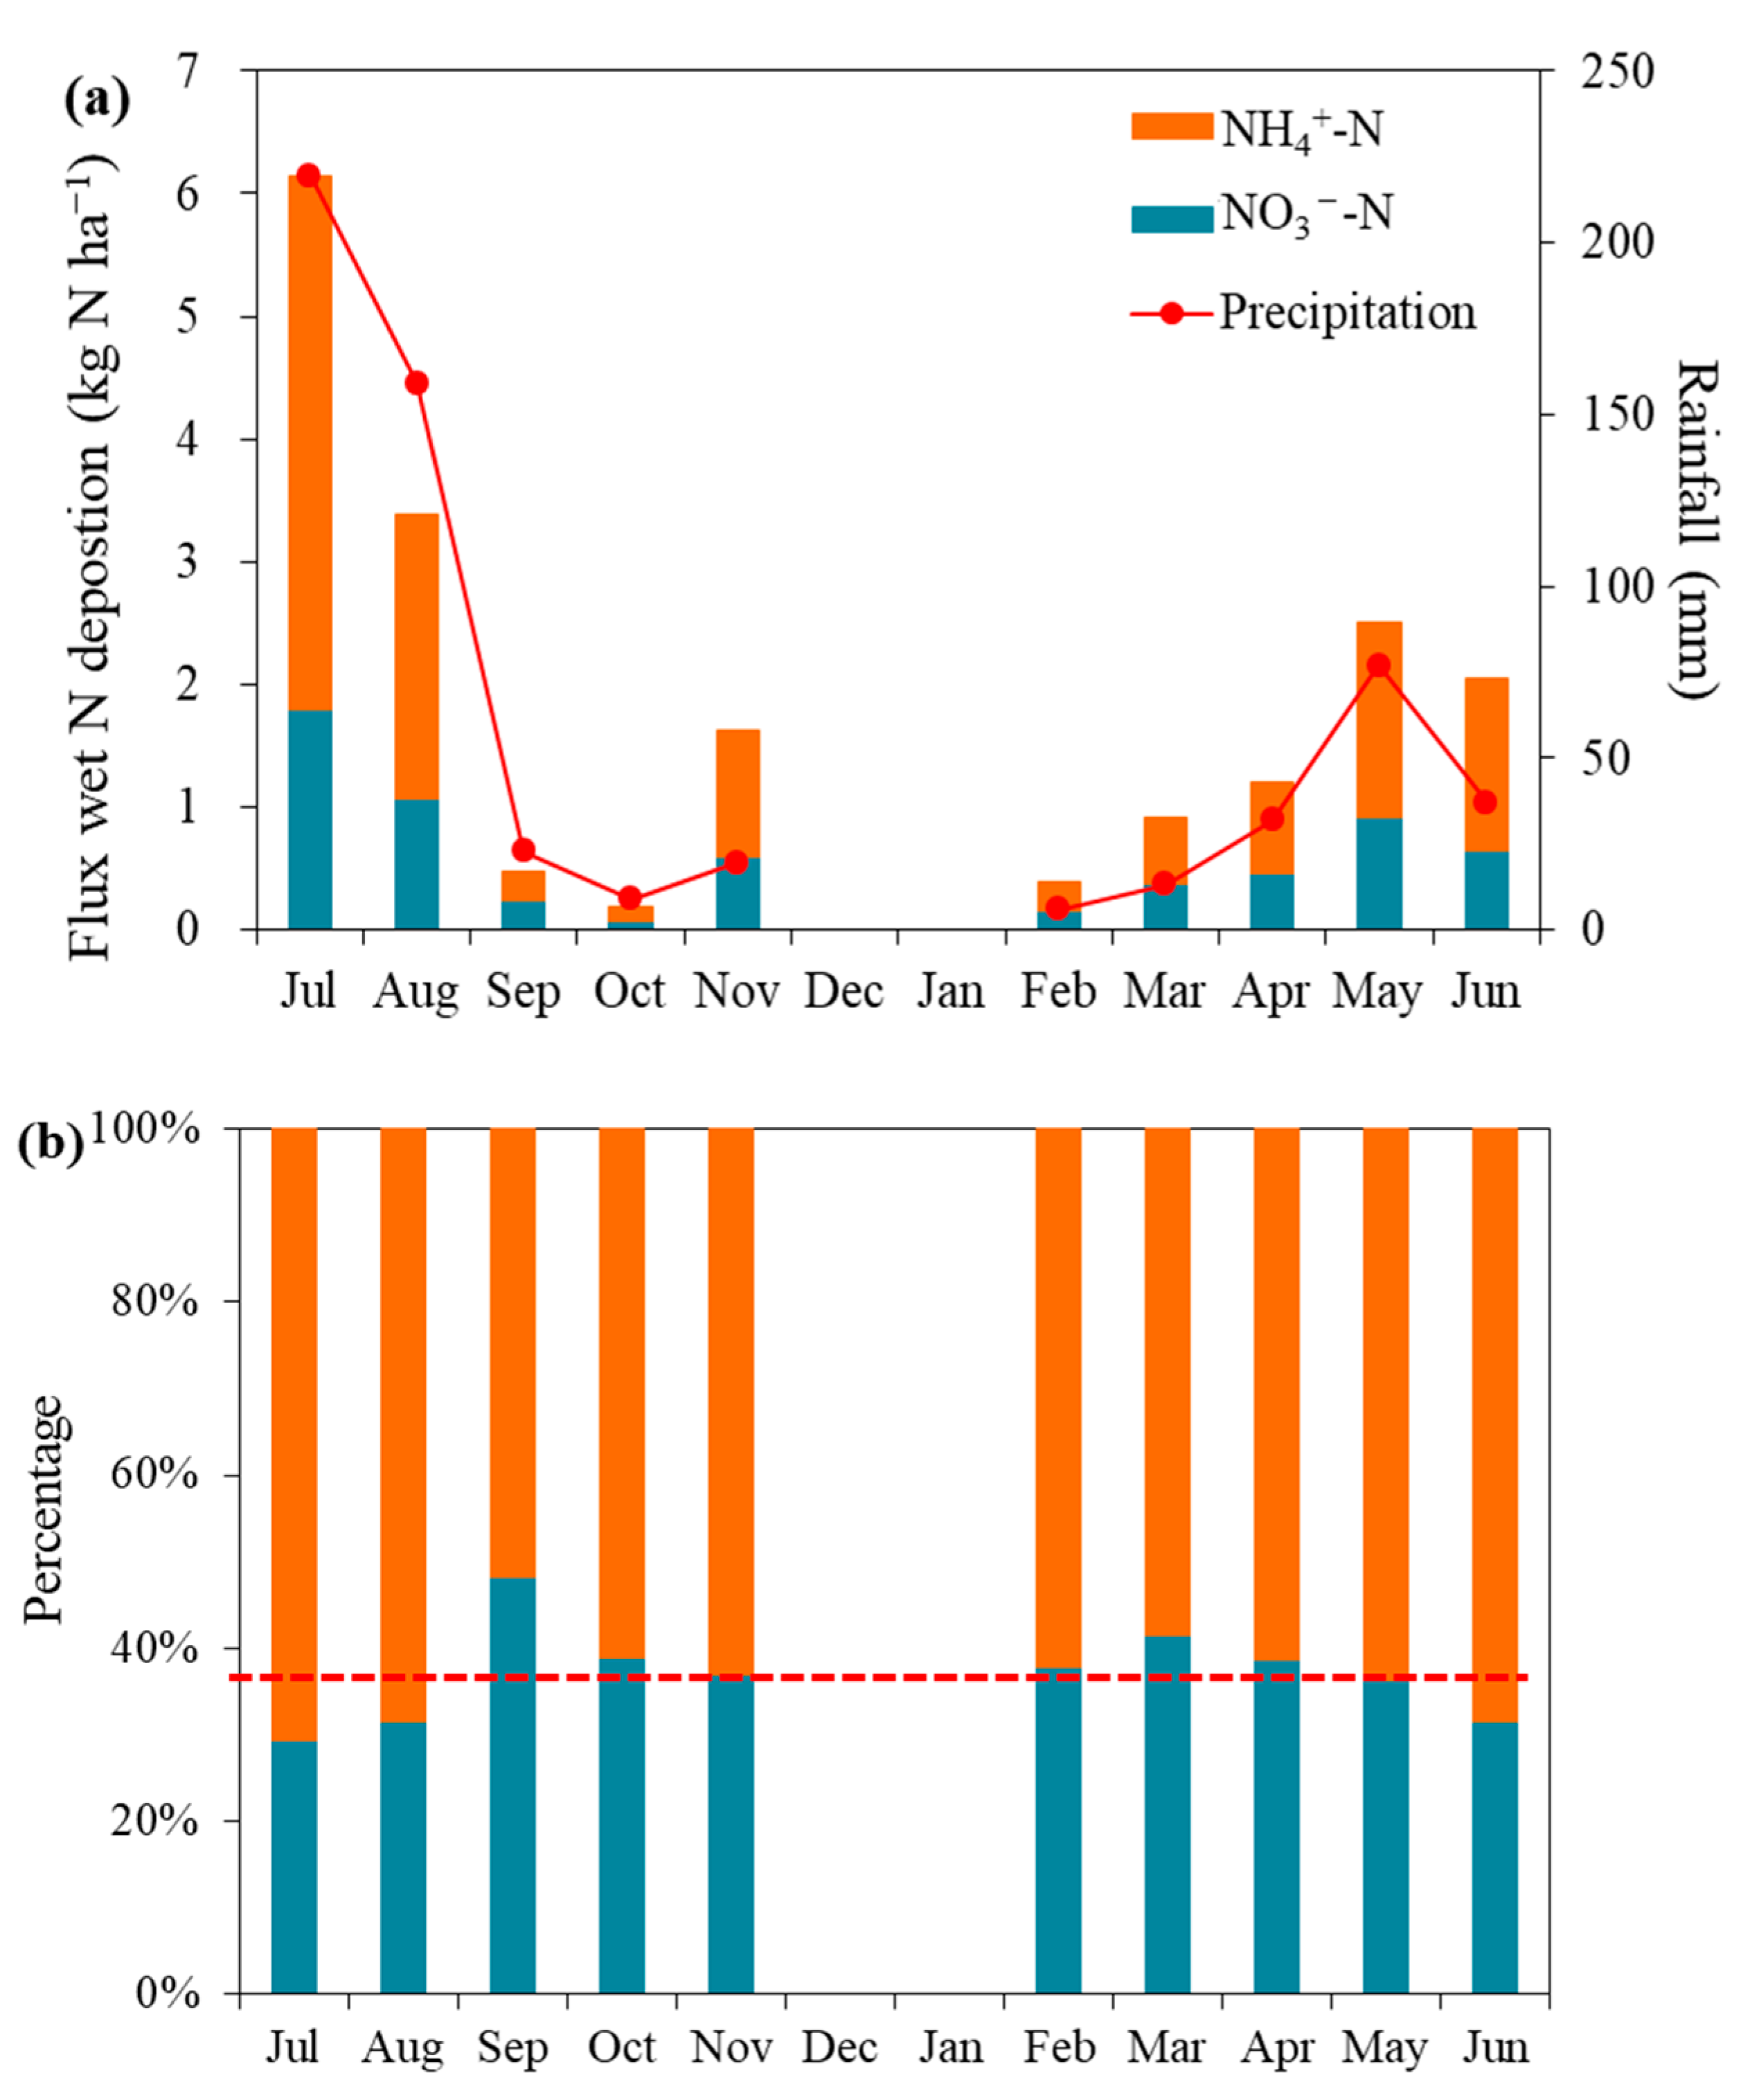
3.2. Wet Inorganic Nitrogen Species Deposition Flux

The monthly variations in the amounts of precipitation, wet deposition rates of N species, as well as their proportions of the total deposition rate of wet inorganic nitrogen (DIN, sum of wet deposition rates of NH4+–N and NO3–N) are shown in Figure 2. The deposition rates of NH4+–N, NO3–N, and DIN were generally higher in the wet season than those in the dry season. The wet deposition flux of NH4+–N, NO3–N, and DIN during summer were 8.06 kg N ha−1 yr−1, 3.51 kg N ha−1 yr−1, and 11.6 kg N ha−1 yr−1, respectively, which were 33.6 times, 23.4 times and 29.7 times of those at winter (0.24 kg N ha−1 yr−1, 0.15 kg N ha−1 yr−1 and 0.39 kg N ha−1 yr−1, respectively) (Table 2). Wet NH4+–N and NO3–N deposition accounted for 29.2–48.2% and 51.8–70.8% to DIN deposition, respectively (Figure 2b). The monthly varied patterns of wet N species deposition rates were consistent with that of precipitation as shown in Figure 2. Furthermore, the relationship between monthly deposition rates of NH4+–N and NO3–N were positively correlated with the amount of monthly rainfall (R2 = 0.89, p < 0.01; R2 = 0.92, p < 0.01, respectively, Figure S3) indicating that the amount of precipitation is crucial in controlling wet N deposition.
The annual total wet N deposition flux in this study was 18.9 kg N ha−1 yr−1; a comparison to previous studies is shown in Table S1. The level of annual wet deposition flux in this study was lower prior to the implementation of the Action Plan, when anthropogenic impact was even stronger, for example, in northern China from 2007–2010 (16.3–28.2 kg N ha−1 yr−1) [32], urban sites in East China from 2003–2005 (26.8 kg N ha−1 yr−1) [43], and urban sites, for example, Zhengzhou, China, during 2011 (33.3 kg N ha−1) [28]. However, these results were still higher than those observed at a rural site of Beijing from 2017–2018 (8.0 kg N ha−1 yr−1) [34], the Three Gorges Reservoir Region in the Southwest China in 2015 (7.1–16.8 kg N ha−1 yr−1) [44], and rural areas in South China from 2017–2018 (13.2) [29]. Moreover, this level was also obviously higher than the wet DIN deposition rate in the USA (0.5–3.5 kg N ha−1 yr−1) (Table S1) [3,16,53]. This indicates that although the wet N deposition flux at the rural site in North China decreased due to the Action Plan’s implementation; it still remained at a relatively high level.

3.3. Sources of Wet Inorganic N Deposition

3.3.1. NH4+–N/NO3–N Ratio

In general, NH4+ in rainwater is formed from the precursor gas NH3, the main anthropogenic source of which is the volatilization of fertilizer and livestock manure; while NO3 in rainwater is produced by the precursor gases NOx (i.e., NO and NO2), which are mainly emitted from fossil fuel combustion, such as from power plants, vehicles, and heating activities. Moreover, NH3 is readily converted to NH4+, having a relatively shorter transportation distance, indicating NH4+ in rainwater is subjected to local sources [42]. Thus, the NH4+/NO3 ratio is a good indicator of the relative contributions of agricultural sources (i.e., fertilizer and livestock manure) and non-agricultural sources (e.g., industrial fossil fuel combustion and vehicle emissions) [42,43,54,55]. Generally, in areas with advanced industrialization, the NH4+–N/NO3–N ratio is usually smaller than 1.0, e.g., at an urban site in Nanjing (0.94), China [43], Pearl River Delta (PRD) (0.33–4.0, averaged at 1.1), China [56], and New York (0.76–0.99) [57]. On the contrary, areas with intensive agriculture, such as rural or agricultural sites, are usually characterized by wet N deposition with NH4+/NO3 ratios greater than 1.0. In China, annual average NH4+–N/NO3–N ratio was reported to be 1.76 for an agricultural site and 1.14 for a rural site in South China [29], 2.2–2.5 for a rural site in the Three Gorges Reservoir Region, Southwest China [44,58], 3.6 for the grasslands at Qinghai Lake [59], 1.9–2.0 for the North China Plain [40,54], and 2.05 for an agricultural site in Northeast China [60].
The monthly variation of NH4+–N/NO3–N ratio at the DHT reservoir is shown in Figure 3. In this study, the annual average NH4+–N/NO3–N ratio was 1.97 with all monthly average values exceeding 1.0 (in the range of 1.08 to 2.26). Thus, compared to NO3 from fossil fuel combustion in industry and transportation, NH4+ deposition from agriculture and excrement from humans and animals still occupied the larger portion in the DHT region. This was mainly because the sampling site was located in a rural area, surrounded by scattered rice paddy fields and villages, where N fertilization had a great effect on NH4+ deposition. NH4–N was the dominant form of N deposition; however, the contribution from NO3 significantly increased over the past decades in China [2]. The ratio of NH4–N to NO3–N in wet precipitation decreased significantly by approximately five to two over time from 1980 to 2010 in China [2]. Similarly, the NH4–N/NO3–N ratio in wet deposition sharply decreased from 5.8 to 1.2 in Yangtze River Delta Region from 1980 to 2005 [43]. This indicates a great enhancement in NO3–N emissions over the past few decades, corresponding to the rapid increase in fossil fuel consumption in the industry and transportation sectors.
The NH4+–N/NO3–N ratios also varied with season, peaking in the summer months (i.e., June (2.23), July (2.02) and August (2.26)) and reaching lower values in the dry seasons, e.g., September (1.08), November (1.38), and March (1.43). This seasonal pattern is similar to those reported by other studies in China, e.g., high values, particularly, in the wet season and low values in the dry season were observed in South China [29,56]. At the same, the annual average NH4+–N/NO3–N ratio was 2.3 in the western part of South Korea from 2007–2008, but the lowest NH4+–N/NO3–N ratio was observed during the winter season (0.63) [14]. This seasonal variation of wet N deposition is in accordance with the nitrogen-fertilizing period during the crop growing season in China. Meanwhile, temperatures over the wet season were higher than in the winter season, and hot temperature conditions were much easier for agriculturally associated NH3 volatilization from fertilizer (urea, di-ammonium phosphate, etc.) and livestock manure applied in agricultural soils. The contribution of agricultural activity to atmospheric N deposition was substantially weakened during the winter season. Moreover, when entering into late autumn, the weather becomes cold, and the coal and biomass burning combustion activities for heating become abundant in North China, resulting in obvious elevated concentrations of NO3 in ambient particles, and thus decreased the NH4+–N/NO3–N ration during winter season.

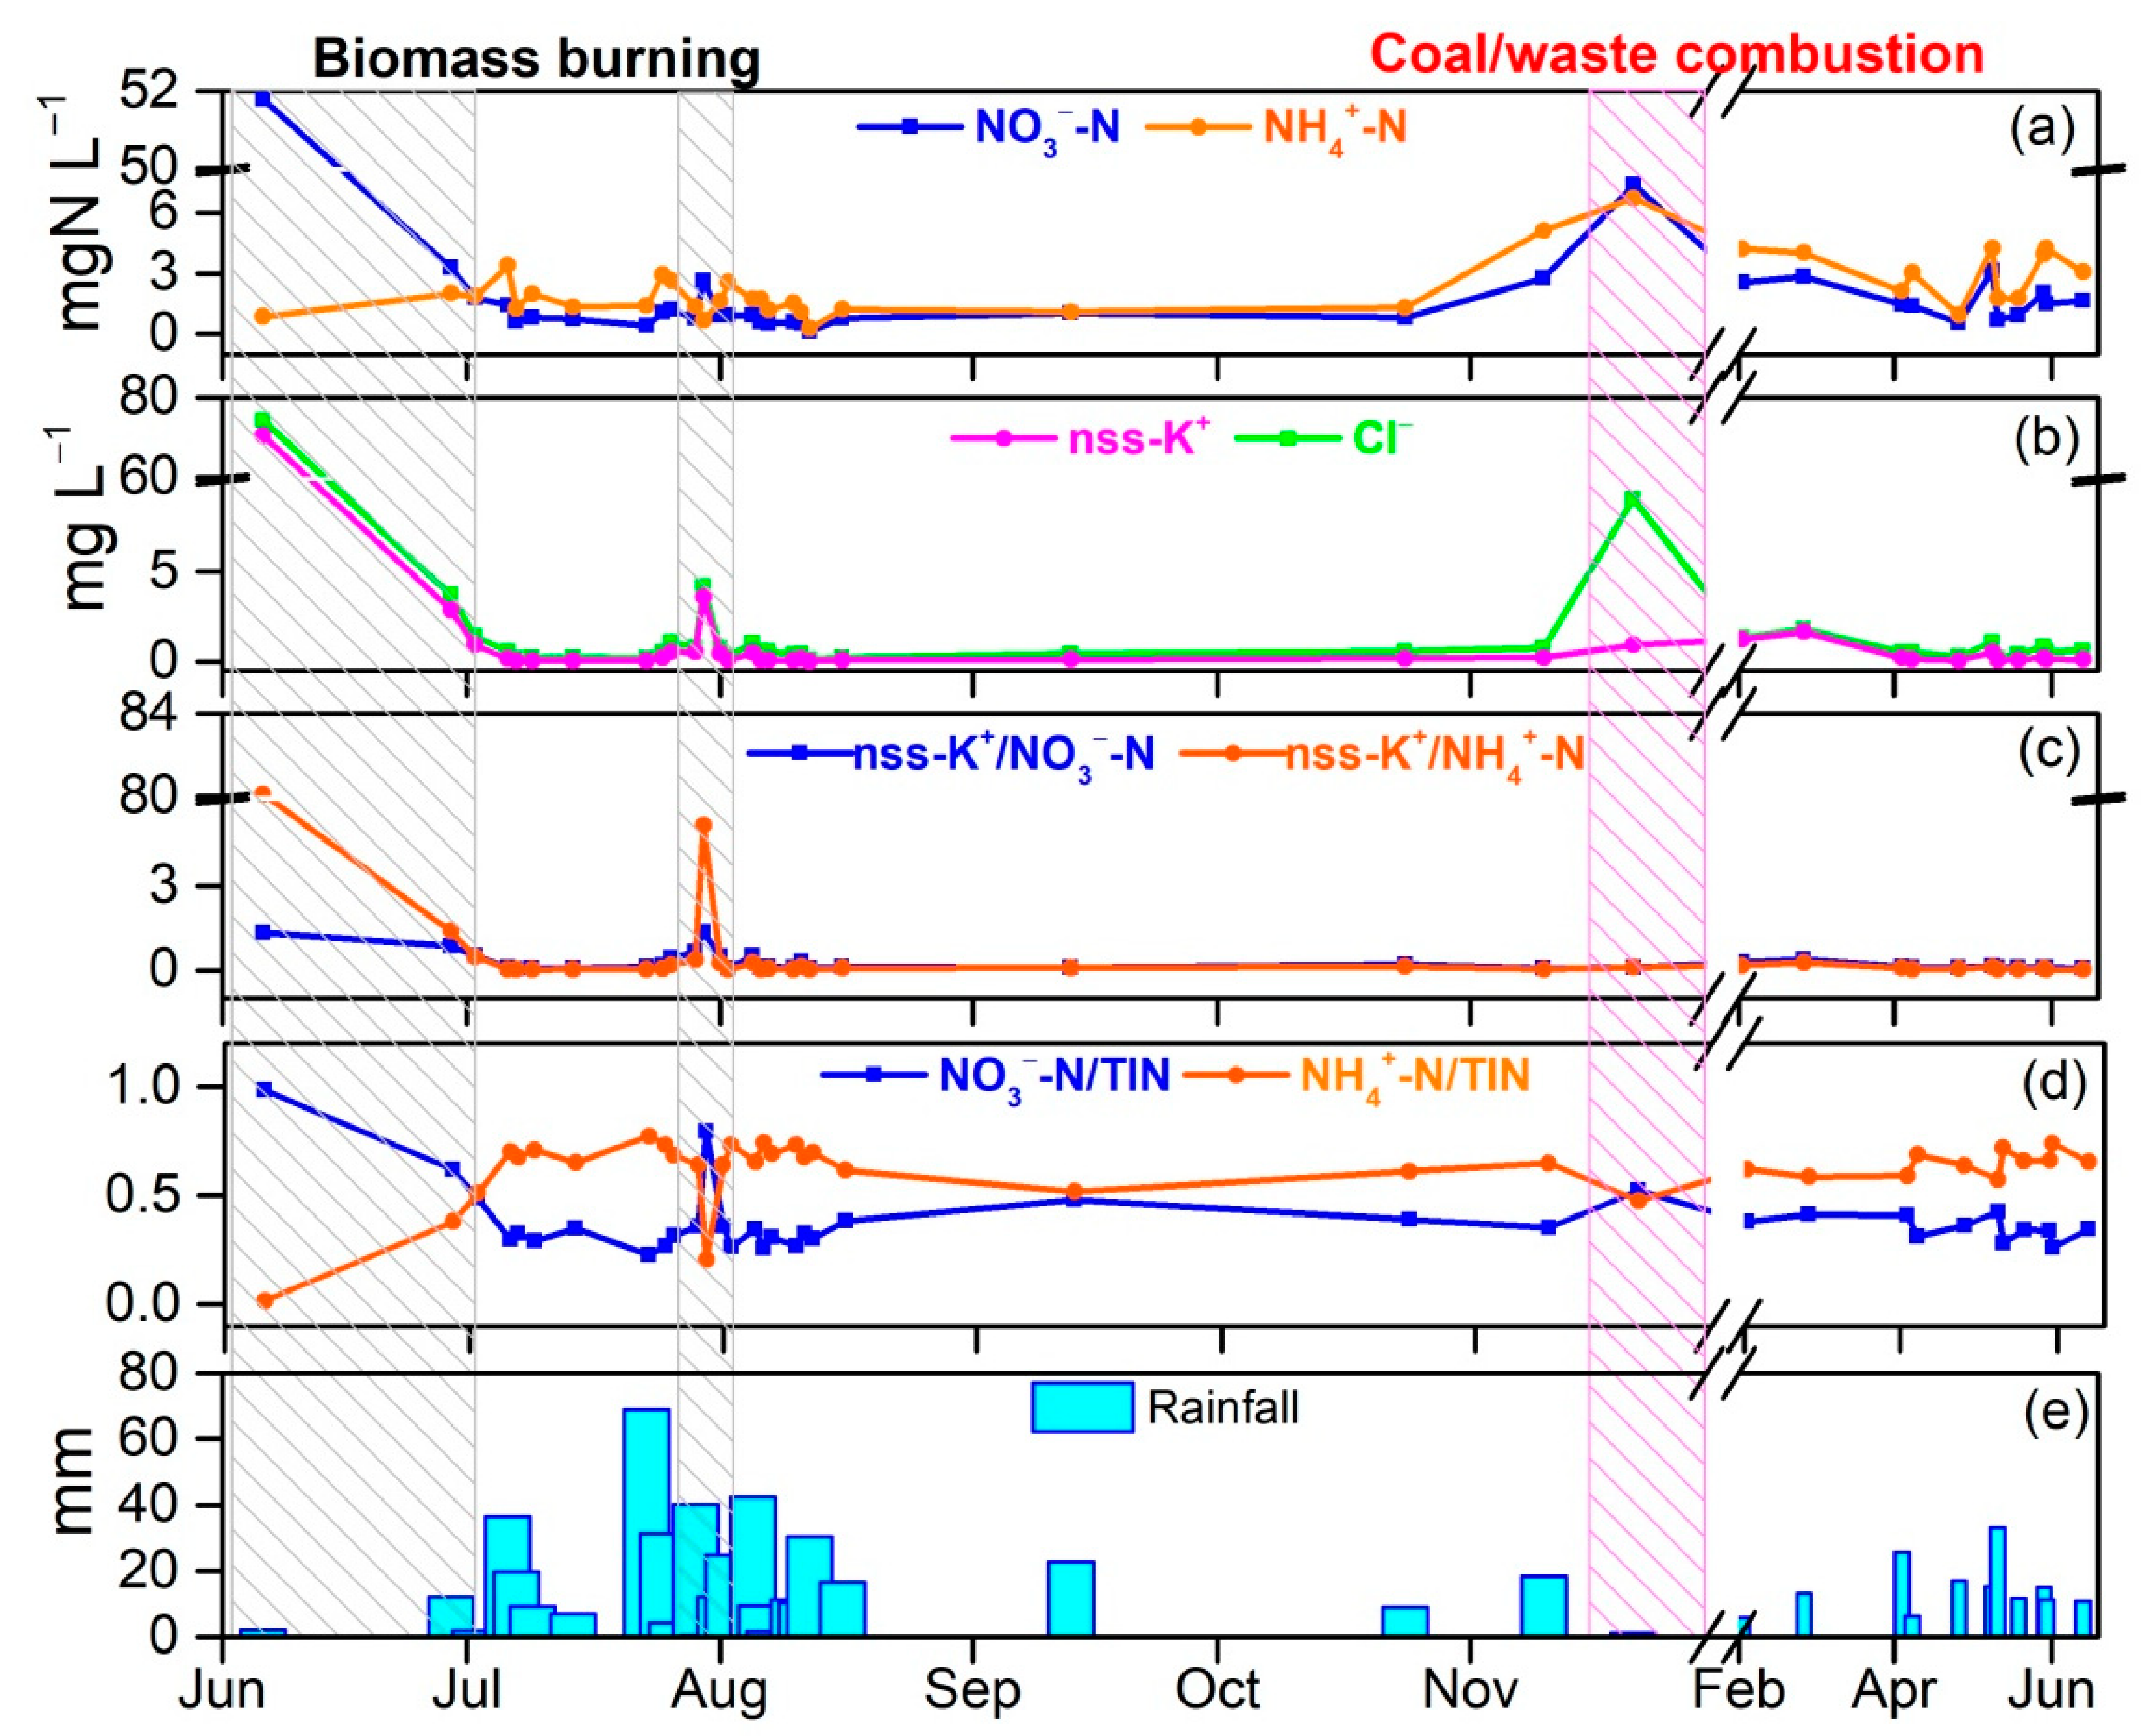
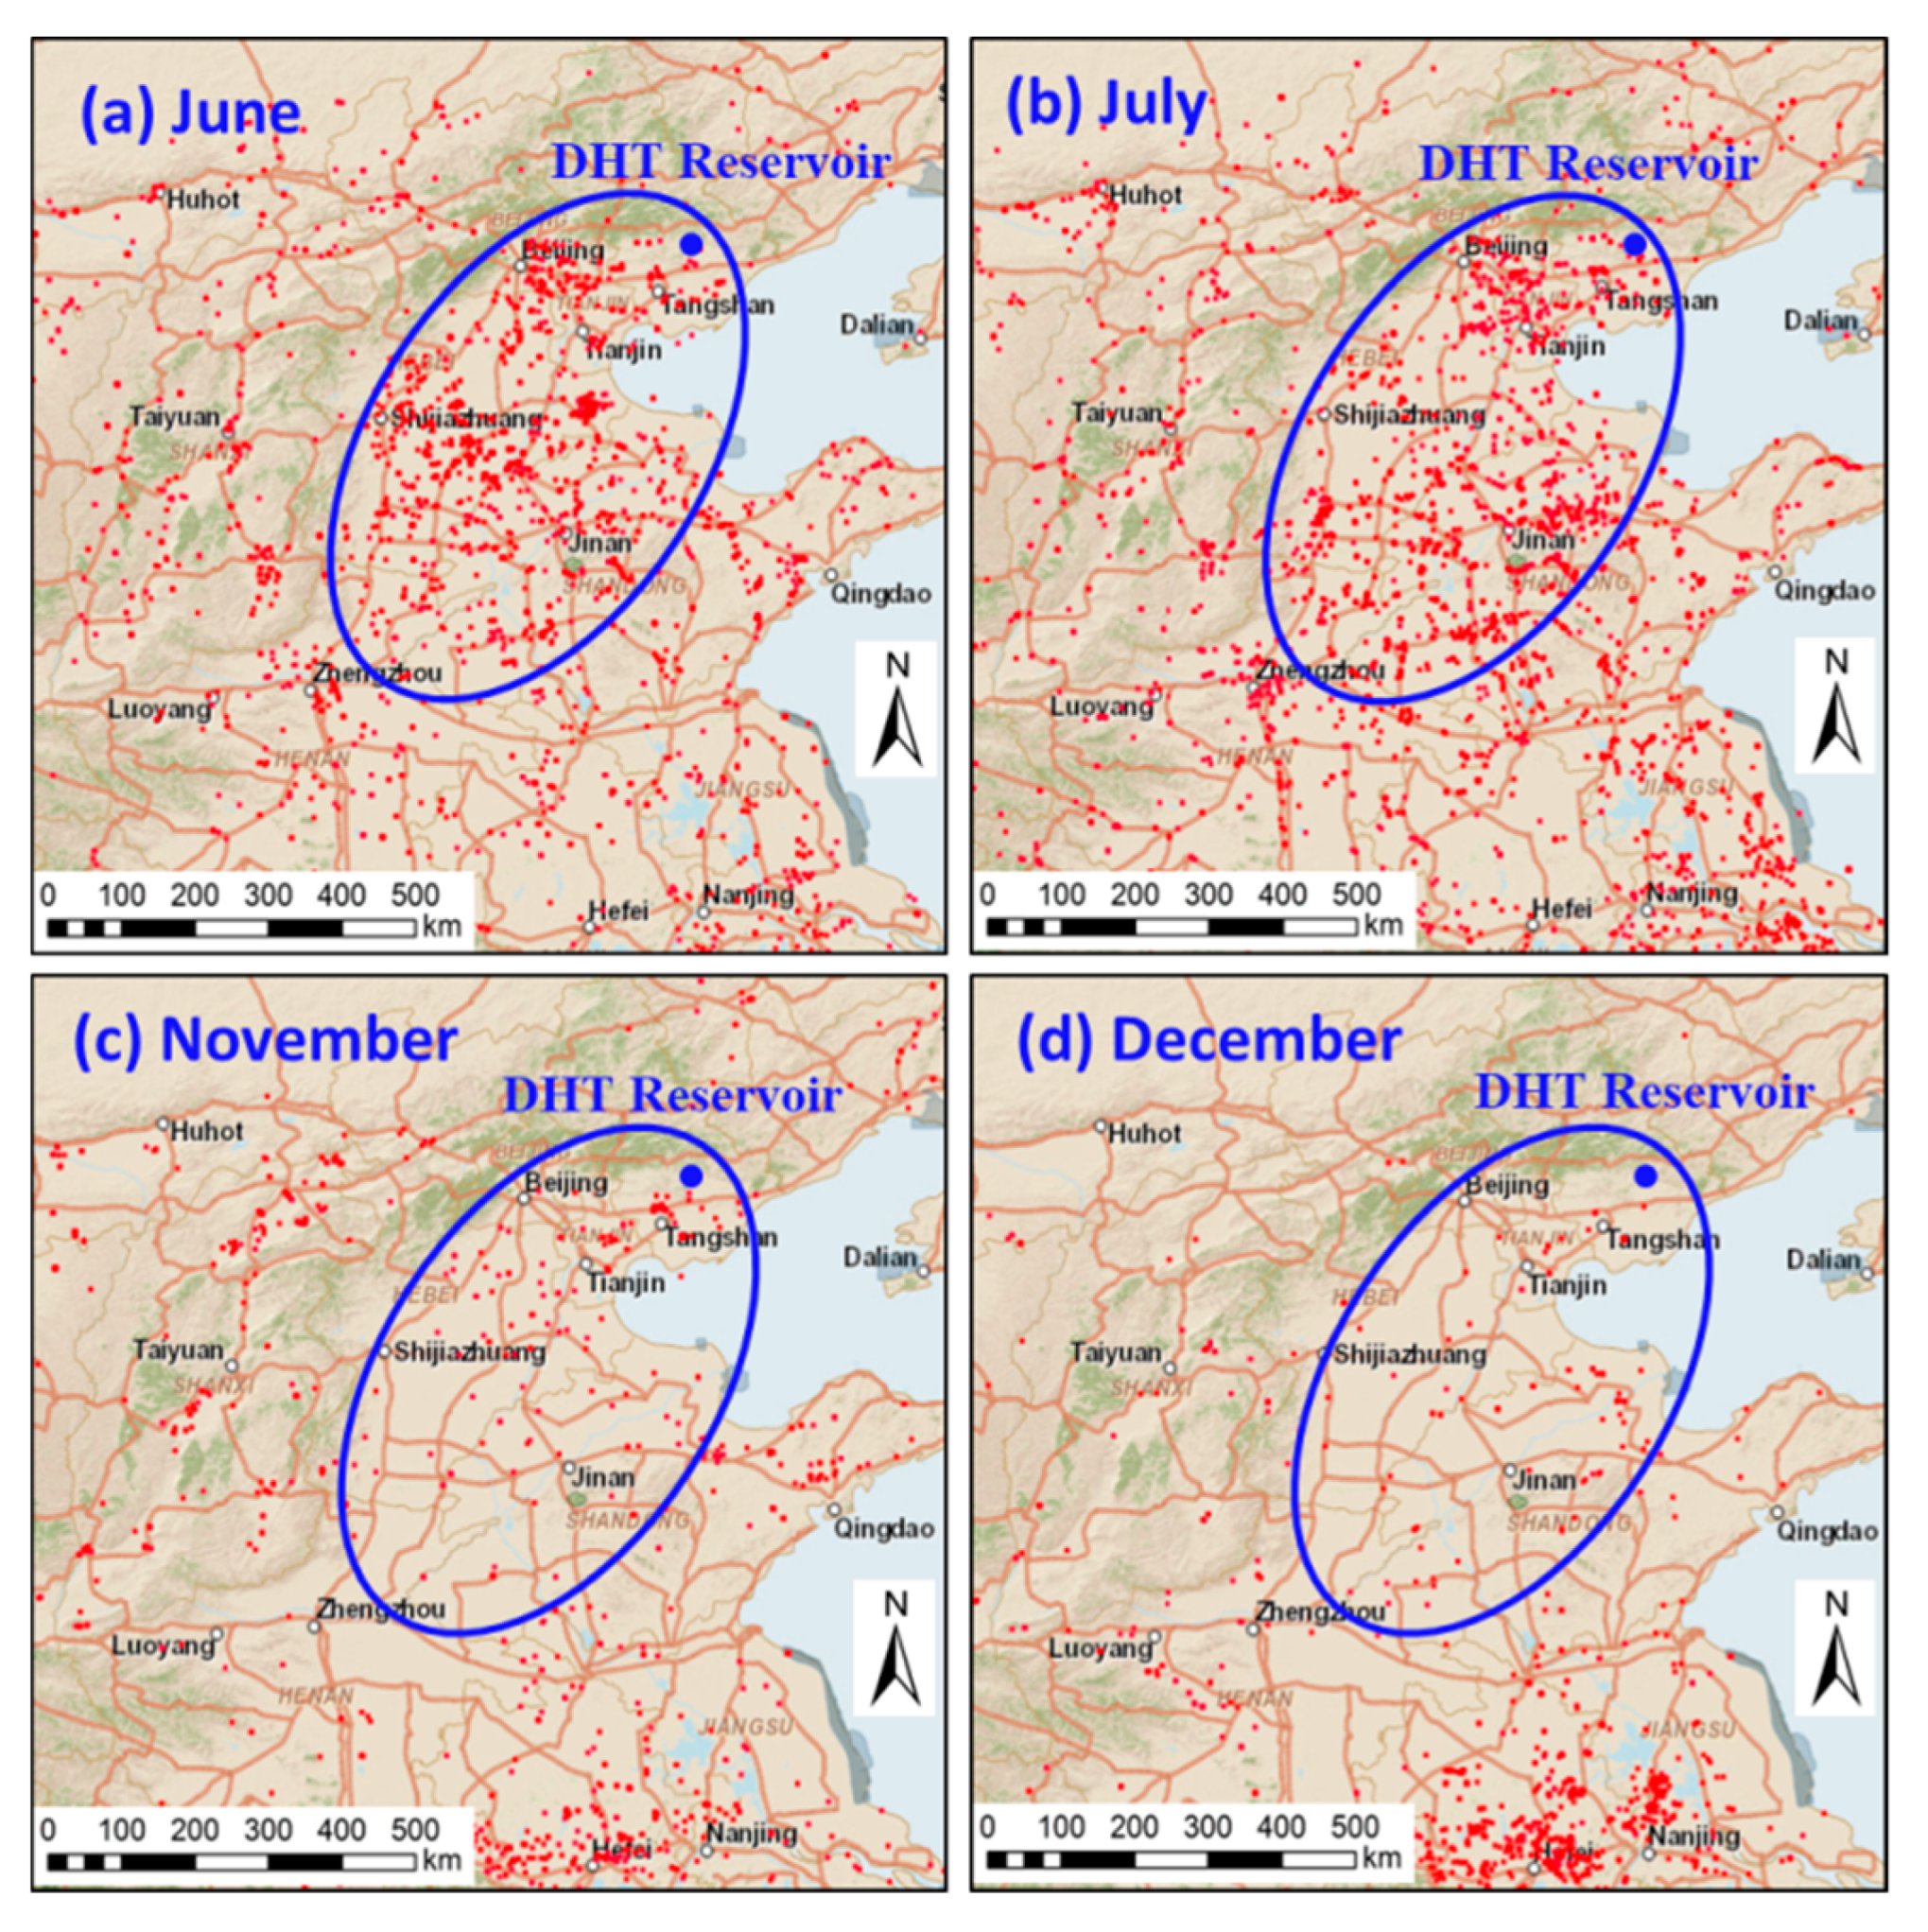
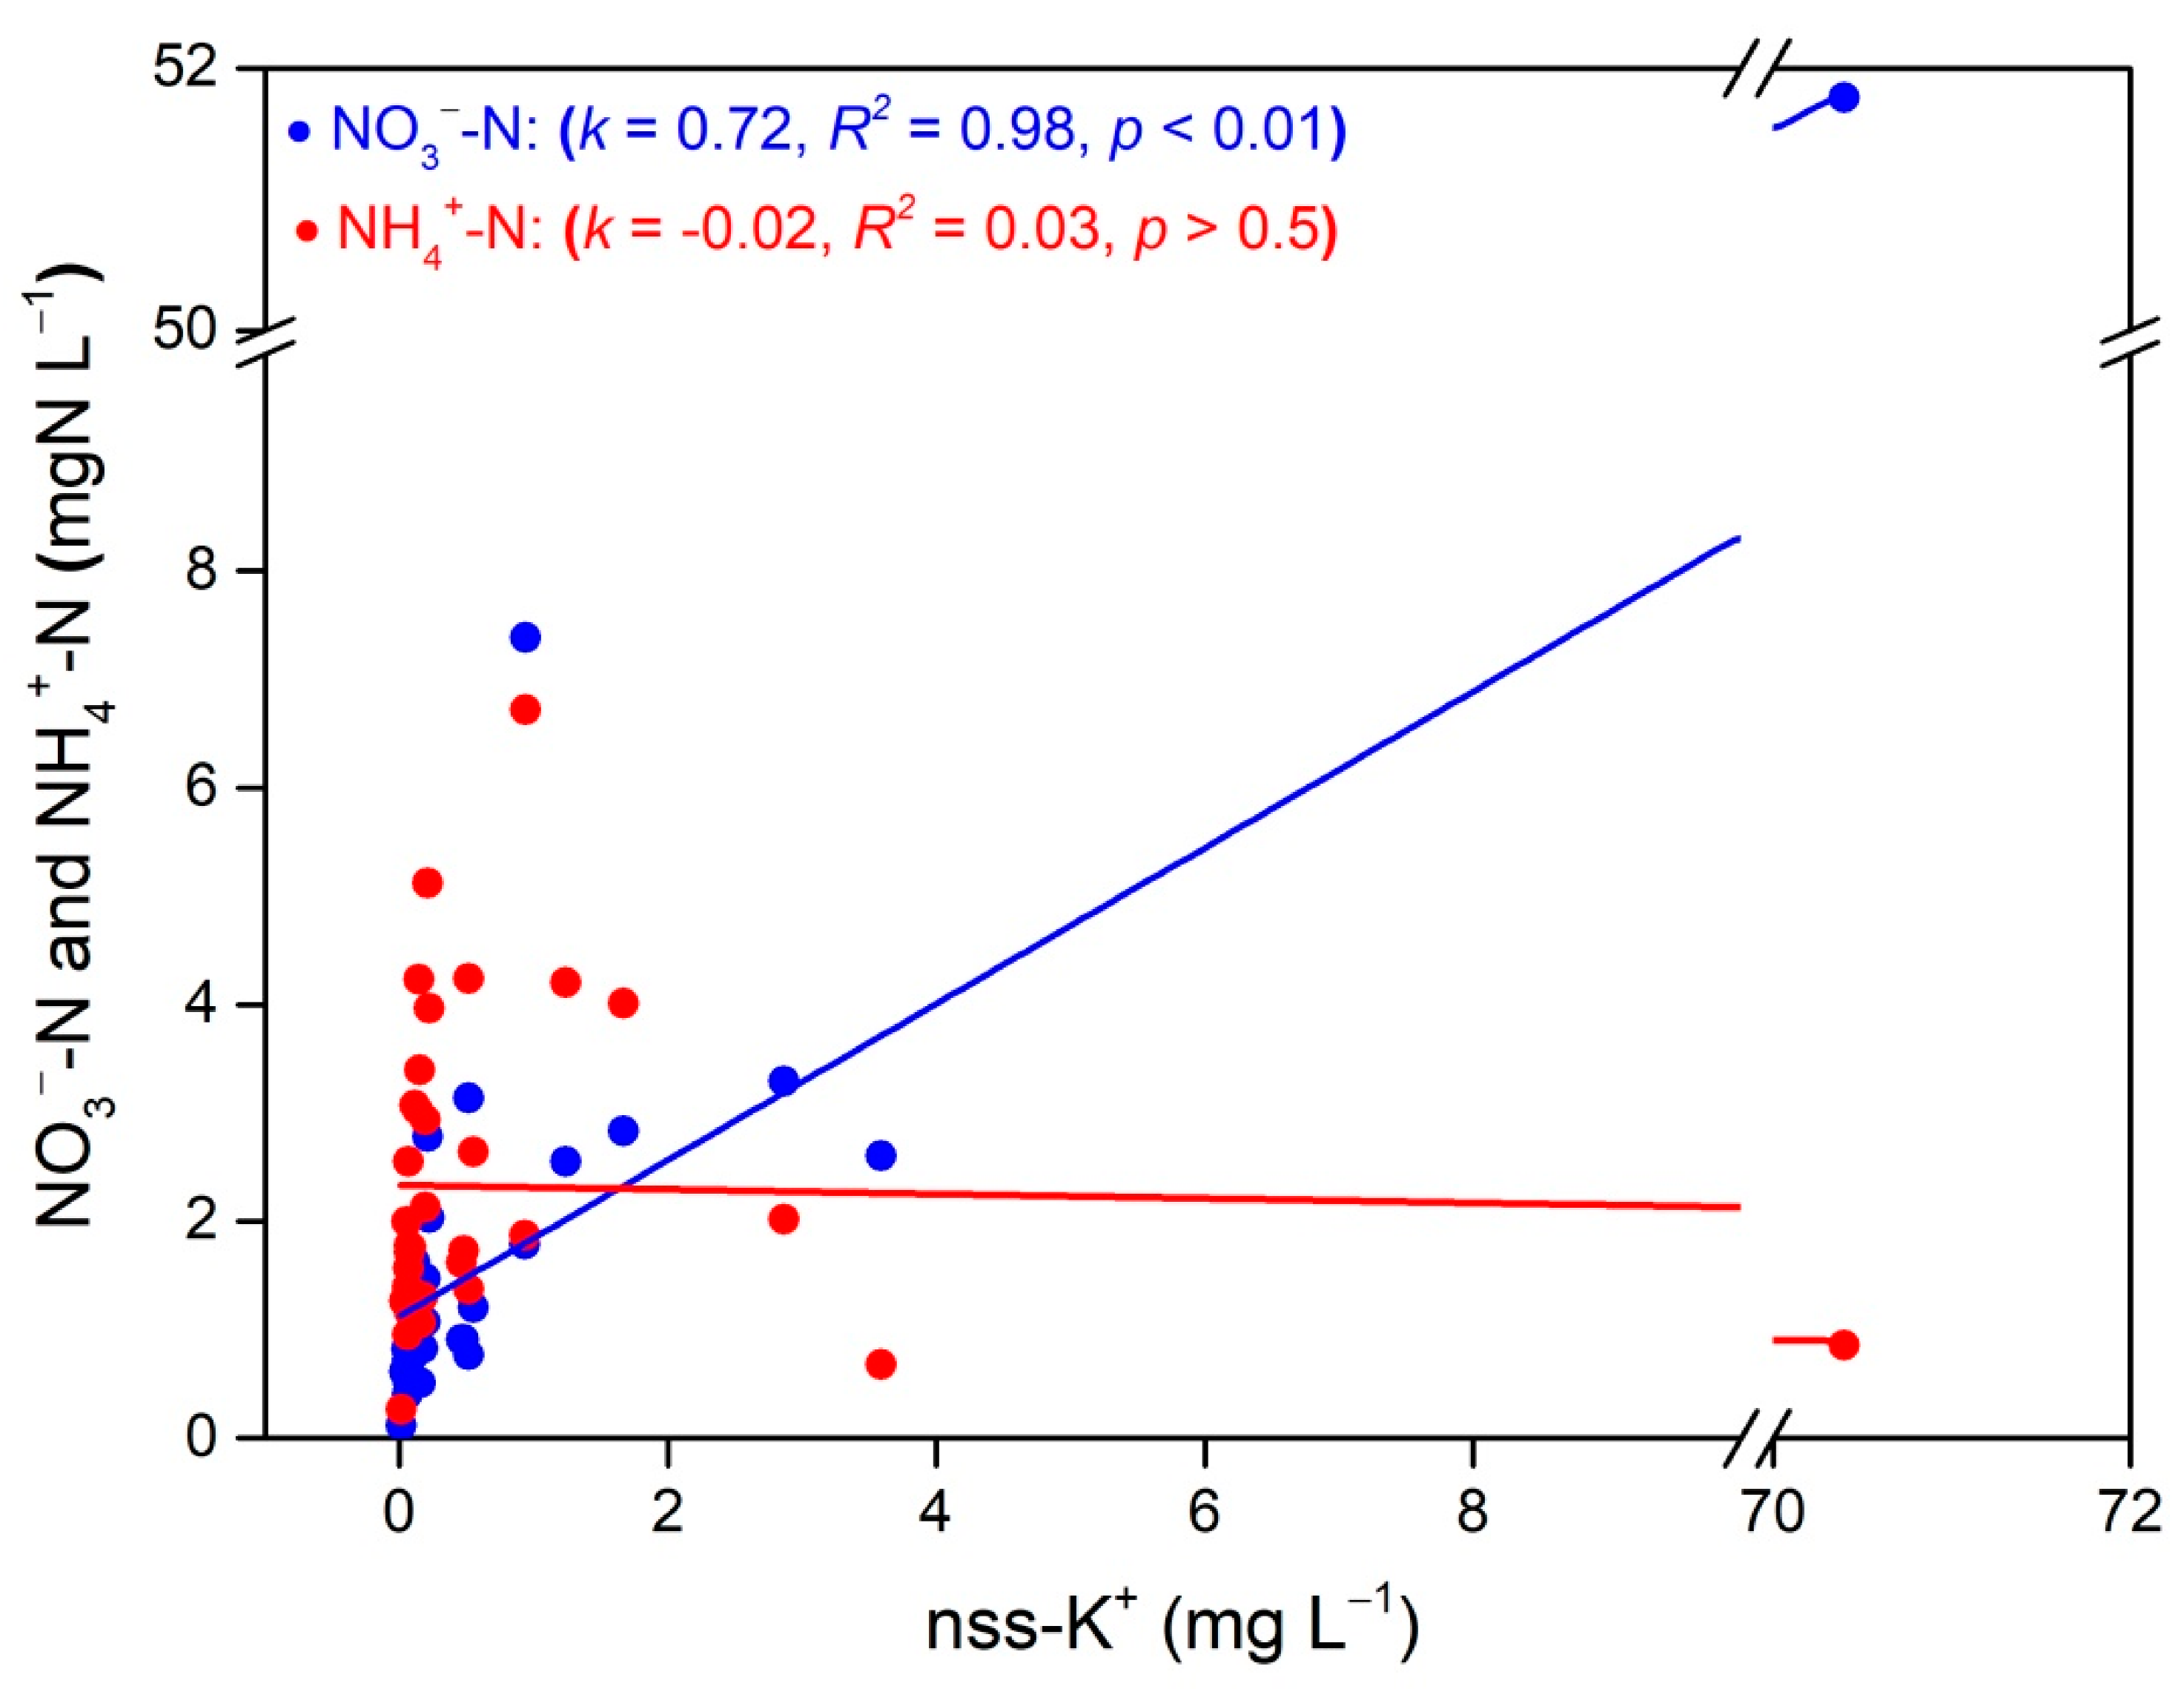
3.3.2. Biomass Burning Influences on Wet Inorganic N Deposition

Potassium is normally regarded as a tracer of biomass burning [5,47,61]. Non-sea-salt potassium concentrations were used to exclude the influence of potassium derived from sea-salt. Therefore, the ratio of non-sea salt (nss)-K+ to NH4+–N and NO3–N in the atmosphere can applied to estimate the effect of biomass burning to wet N deposition. Three precipitation events occurred during the harvest season on 6 June, 29 June and 30 July, 2019 (Figure 4). The nss-K+ concentrations in those rainwater samples were significantly higher than in other precipitation samples, indicating the field biomass combustion was active during these periods. Fire pixel counts observed from MODIS (Moderate Resolution Imaging Spectroradiometer) Terra and Aqua also identified many fire spots in North China during June and July 2019, when it is time to harvest wheat and corn along with the common practice of straw burning (Figure 5a,b).
Based on the 72 h backward trajectories for the three precipitation events during the summer season (6 June, 29 June, and 30 July 2019), most of the air masses arriving in the DHT region were restricted to the polluted areas of North China with dense fire spots (Figure S4a–c). Abundant combustion aerosols were transported from these source areas to the DHT region, associated with significantly increased levels of biomass burning tracers, i.e., nss-K+, as well as Cl (Figure 4). Cl is regarded as another common tracer for biomass burning [63], which synchronously changed with nss-K+ in the wet deposition over the entire year, except for the precipitation event on 21 November 2019. Based on fuel combustion studies, Cl in aerosols can also be contributed by coal combustion [64,65] and chlorinated plastics waste burning [66]. Entering into middle November, the weather became cold, thus, coal combustion activities commenced in rural areas and central heating systems started operating. Subsequently, the level of Cl sharply increased during the precipitation event on 21 November 2019 at the start of the heating period. There was almost no influence on NH3 emissions from biomass burning; hence, the ratio of nss-K+/NH4+–N in the atmosphere was expected to be higher when biomass burning occurred. Correspondently, the ratio of nss-K+/NH4+–N obviously increased during the summer harvest biomass burning episode but displayed no variation over the winter heating season (Figure 4c), which further confirmed that the high levels of Cl during the precipitation event on 21 November 2019 was emitted from coal combustion or chlorinated plastics waste burning but not biomass burning.
The concentration of nss-K+ was positively correlated with NO3–N (R2 = 0.98, p < 0.01), but revealed no relationship to NH4+–N (p > 0.5) (Figure 6). In general, NH4+–N/TIN ratios were higher than NO3–N/TIN ratios throughout the observations. However, due to the substantial contribution of biomass burning to atmospheric NOx emissions during the harvest season or intense fossil fuel combustion during the start of the heating season, the ratios of NO3–N/TIN were obviously elevated, and surpassed the ratios of NH4+–N/TIN (Figure 4d) during those intense air pollution periods. The change in the N species in the atmosphere exhibited the influences of air pollution on wet N deposition. Several studies speculate that biomass burning might be a source of water-soluble organic N in wet deposition [29]. In this study, we provided evidence for the fact that biomass burning evidently contributed to the wet deposition of some inorganic N (e.g., NO3–N); however, it had a minor influence on others (such as NH4+–N).

4. Conclusions

One-year wet deposition samples were collected at the Daheitin reservoir in North China. The annual VWM concentrations of NH4+–N and NO3–N were 2.11 mg N L−1 and 1.06 mg N L−1, respectively. Due to the intense emissions of more gaseous nitrogen compounds (i.e., NOx and NH3) in heating activities in the cold seasons and the dilution effect by different rainfall intensity and frequency, the seasonal VWM concentrations of NH4+–N and NO3–N showed higher levels during the dry season (i.e., autumn and winter) and lower levels during the wet season, i.e., summer. In contrast, the wet N deposition rates varied consistently with precipitation (i.e., high during the wet season and low during the dry season), indicating that the amount of precipitation was crucial in controlling wet N deposition. Compared to the years prior to the implementation of the Action Plan in 2013, the wet inorganic nitrogen deposition rate at the rural site in North China decreased to 18.9 kg N ha−1 yr−1 but still maintained a relatively high level.
Non-sea salt K+ was employed as a molecular tracer of biomass burning emission, and three precipitation events with high nss-K+ levels were captured during the harvest season (June to July). Based on the variations in the patterns of nss-K+ and deposition of N species, the ratios of nss-K+ to N species as well as their relationships, it was indicated that biomass burning emissions contributed remarkably to NO3–N but had a minor influence on NH4+–N. These results highlight that biomass burning activity had a substantial influence on the composition of wet nitrogen deposition at the rural site in North China. Understanding the variations in trends and the influences of wet nitrogen deposition is important for effective air pollution control and for gaining insight into the atmospheric nitrogen cycle.

Supplementary Materials

The following are available online at https://www.mdpi.com/2073-4433/11/11/1260/s1, Table S1: Wet N deposition rates (kg N ha−1 yr−1) in DHT region compared to those reported in other studies, Figure S1: Location of Daheitin Reservoir station (red star) and the surrounding cities, Figure S2: Relationship between the concentrations of NO3-N in rainwater and rainfall amounts during each precipitation event at the DHT reservoir, a rural site in North China from July 2019 to June 2020. Statistical analysis was conducted with logarithmic fitting method, Figure S3: Relationship between monthly deposition rates of NH4+-N and NO3-N and rainfall amounts at the DHT reservoir, a rural site in North China from July 2019 to June 2020. Statistical analysis was conducted with linear fitting method, Figure S4: Air mass origins to DHT region, shown by clusters of 72 h backward trajectories arriving at 500 m aboveground level in (a) 6 June, 2019, (b) 29 June, 2019, (c) 30 July, 2019, (d) 21 November, 2019.

Author Contributions

Conceptualization, L.W., L.L., and X.L.; Data curation, L.W., K.L., W.X., and G.Z.; Formal analysis, W.X.; Funding acquisition, L.L., L.W., X.L., K.L., and W.H.; Investigation, P.Z., X.Z., and C.L.; Methodology, L.W. and L.L.; Project administration, L.L.; Supervision, L.L.; Writing—original draft preparation, L.W. and L.L.; Writing—review and editing, L.W., L.L., X.L., K.L., W.X., and W.H. All authors have read and agreed to the published version of the manuscript.

Funding

This work was supported by the Open Research Fund of the State Key Laboratory of Simulation and Regulation of Water Cycle in River Basin, China Institute of Water Resources and Hydropower Research (No. 201913), the National Natural Science Foundation of China (No. 51879279), Beijing Natural Science Foundation (No. 8192055), and the National Key Research and Development Program of China (No. 2016YFC0401701; 2017YFC0405804).

Acknowledgments

We are grateful to Hongbing Cheng and Yusi Liu for their help with the analysis of water-soluble ions. The authors would like to acknowledge Chengbiao Zhao for their help with precipitation sample collection.

Conflicts of Interest

The authors declare that they have no known competing financial interests or personal relationships that could have appeared to influence the work reported in this paper.

References

  1. Galloway, J.N.; Dentener, F.J.; Capone, D.G.; Boyer, E.W.; Howarth, R.W.; Seitzinger, S.P.; Asner, G.P.; Cleveland, C.C.; Green, P.A.; Holland, E.A.; et al. Nitrogen Cycles: Past, Present, and Future. Biogeochemistry 2004, 70, 153–226. [Google Scholar]
  2. Liu, X.; Zhang, Y.; Han, W.; Tang, A.; Shen, J.; Cui, Z.; Vitousek, P.; Erisman, J.W.; Goulding, K.; Christie, P.; et al. Enhanced nitrogen deposition over China. Nature 2013, 494, 459–462. [Google Scholar] [PubMed]
  3. Du, E.; de Vries, W.; Galloway, J.N.; Hu, X.; Fang, J. Changes in wet nitrogen deposition in the United States between 1985 and 2012. Environ. Res. Lett. 2014, 9, 095004. [Google Scholar]
  4. Asner, G.P.; Townsend, A.R.; Riley, W.J.; Matson, P.A.; Neff, J.C.; Cleveland, C.C. Physical and biogeochemical controls over terrestrial ecosystem responses to nitrogen deposition. Biogeochemistry 2001, 54, 1–39. [Google Scholar]
  5. Liang, L.; Engling, G.; Zhang, X.; Sun, J.; Zhang, Y.; Xu, W.; Liu, C.; Zhang, G.; Liu, X.; Ma, Q. Chemical characteristics of PM 2.5 during summer at a background site of the Yangtze River Delta in China. Atmos. Res. 2017, 198, 163–172. [Google Scholar]
  6. Kulkarni, P.S.; Dasari, H.P.; Sharma, A.; Bortoli, D.; Salgado, R.; Silva, A.M. Nocturnal surface ozone enhancement over Portugal during winter: Influence of different atmospheric conditions. Atmos. Environ. 2016, 147, 109–120. [Google Scholar]
  7. Aksoyoglu, S.; Ciarelli, G.; El-Haddad, I.; Baltensperger, U.; Prévôt, A.S.H. Secondary inorganic aerosols in Europe: Sources and the significant influence of biogenic VOC emissions, especially on ammonium nitrate. Atmos. Chem. Phys. 2017, 17, 7757–7773. [Google Scholar]
  8. Pye, H.O.T.; Zuend, A.; Fry, J.L.; Isaacman-VanWertz, G.; Capps, S.L.; Appel, K.W.; Foroutan, H.; Xu, L.; Ng, N.L.; Goldstein, A.H. Coupling of organic and inorganic aerosol systems and the effect on gas-particle partitioning in the southeastern US. Atmos. Chem. Phys. 2018, 18, 357–370. [Google Scholar]
  9. Zheng, B.; Zhang, Q.; Zhang, Y.; He, K.B.; Wang, K.; Zheng, G.J.; Duan, F.K.; Ma, Y.L.; Kimoto, T. Heterogeneous chemistry: A mechanism missing in current models to explain secondary inorganic aerosol formation during the January 2013 haze episode in North China. Atmos. Chem. Phys. 2015, 15, 2031–2049. [Google Scholar]
  10. Zhang, R.; Sun, X.; Shi, A.; Huang, Y.; Yan, J.; Nie, T.; Yan, X.; Li, X. Secondary inorganic aerosols formation during haze episodes at an urban site in Beijing, China. Atmos. Environ. 2018, 177, 275–282. [Google Scholar]
  11. Yao, X.; Ge, B.; Yang, W.; Li, J.; Xu, D.; Wang, W.; Zheng, H.; Wang, Z. Affinity zone identification approach for joint control of PM2.5 pollution over China. Environ. Pollut. 2020, 265 (Pt B), 115086. [Google Scholar] [PubMed]
  12. Bobbink, R.; Hicks, K.; Galloway, J.; Spranger, T.; Alkemade, R.; Ashmore, M.; Bustamante, M.; Cinderby, S.; Davidson, E.; Dentener, F.; et al. Global assessment of nitrogen deposition effects on terrestrial plant diversity: A synthesis. Ecol. Appl. 2010, 20, 30–59. [Google Scholar] [PubMed] [Green Version]
  13. Liu, X.; Xu, W.; Duan, L.; Du, E.; Pan, Y.; Lu, X.; Zhang, L.; Wu, Z.; Wang, X.; Zhang, Y.; et al. Atmospheric Nitrogen Emission, Deposition, and Air Quality Impacts in China: An Overview. Curr. Pollut. Rep. 2017, 3, 65–77. [Google Scholar]
  14. Lee, K.-S.; Lee, D.-S.; Lim, S.-S.; Kwak, J.-H.; Jeon, B.-J.; Lee, S.-I.; Lee, S.-M.; Choi, W.-J. Nitrogen isotope ratios of dissolved organic nitrogen in wet precipitation in a metropolis surrounded by agricultural areas in southern Korea. Agric. Ecosyst. Environ. 2012, 159, 161–169. [Google Scholar]
  15. Xie, Y.; Xiong, Z.; Xing, G.; Yan, X.; Shi, S.; Sun, G.; Zhu, Z. Source of nitrogen in wet deposition to a rice agroecosystem at Tai lake region. Atmos. Environ. 2008, 42, 5182–5192. [Google Scholar]
  16. Benedict, K.B.; Carrico, C.M.; Kreidenweis, S.M.; Schichtel, B.; Malm, W.C.; Collett, J.L., Jr. A seasonal nitrogen deposition budget for Rocky Mountain National Park. Ecol. Appl. 2013, 23, 1156–1169. [Google Scholar]
  17. Ellermann, T.; Nygaard, J.; Christensen, J.; Løfstrøm, P.; Geels, C.; Nielsen, I.; Poulsen, M.; Monies, C.; Gyldenkærne, S.; Brandt, J.; et al. Nitrogen Deposition on Danish Nature. Atmosphere 2018, 9, 447. [Google Scholar]
  18. Houlton, B.Z.; Boyer, E.; Finzi, A.; Galloway, J.; Leach, A.; Liptzin, D.; Melillo, J.; Rosenstock, T.S.; Sobota, D.; Townsend, A.R. Intentional versus unintentional nitrogen use in the United States: Trends, efficiency and implications. Biogeochemistry 2012, 114, 11–23. [Google Scholar]
  19. Zhang, Q.; Zheng, Y.; Tong, D.; Shao, M.; Wang, S.; Zhang, Y.; Xu, X.; Wang, J.; He, H.; Liu, W.; et al. Drivers of improved PM2.5 air quality in China from 2013 to 2017. Proc. Natl. Acad. Sci. USA 2019, 116, 24463–24469. [Google Scholar]
  20. Zheng, B.; Tong, D.; Li, M.; Liu, F.; Hong, C.; Geng, G.; Li, H.; Li, X.; Peng, L.; Qi, J.; et al. Trends in China’s anthropogenic emissions since 2010 as the consequence of clean air actions. Atmos. Chem. Phys. 2018, 18, 14095–14111. [Google Scholar]
  21. Fu, Y.; Xu, W.; Wen, Z.; Han, M.; Sun, J.; Tang, A.; Liu, X. Enhanced atmospheric nitrogen deposition at a rural site in northwest China from 2011 to 2018. Atmos. Res. 2020, 245, 105071. [Google Scholar]
  22. He, K.; Zhao, Q.; Ma, Y.; Duan, F.; Yang, F.; Shi, Z.; Chen, G. Spatial and seasonal variability of PM2.5 acidity at two Chinese megacities: Insights into the formation of secondary inorganic aerosols. Atmos. Chem. Phys. 2012, 12, 1377–1395. [Google Scholar]
  23. Yang, F.; Huang, L.; Duan, F.; Zhang, W.; He, K.; Ma, Y.; Brook, J.R.; Tan, J.; Zhao, Q.; Cheng, Y. Carbonaceous species in PM2.5 at a pair of rural/urban sites in Beijing, 2005–2008. Atmos. Chem. Phys. 2011, 11, 7893–7903. [Google Scholar]
  24. Tan, J.; Duan, J.; Zhen, N.; He, K.; Hao, J. Chemical characteristics and source of size-fractionated atmospheric particle in haze episode in Beijing. Atmos. Res. 2016, 167, 24–33. [Google Scholar]
  25. Sun, Y.L.; Wang, Z.F.; Fu, P.Q.; Yang, T.; Jiang, Q.; Dong, H.B.; Li, J.; Jia, J.J. Aerosol composition, sources and processes during wintertime in Beijing, China. Atmos. Chem. Phys. 2013, 13, 4577–4592. [Google Scholar]
  26. Xu, D.; Ge, B.; Wang, Z.; Sun, Y.; Chen, Y.; Ji, D.; Yang, T.; Ma, Z.; Cheng, N.; Hao, J.; et al. Below-cloud wet scavenging of soluble inorganic ions by rain in Beijing during the summer of 2014. Environ. Pollut. 2017, 230, 963–973. [Google Scholar]
  27. Kang, Y.; Liu, M.; Song, Y.; Huang, X.; Yao, H.; Cai, X.; Zhang, H.; Kang, L.; Liu, X.; Yan, X.; et al. High-resolution ammonia emissions inventories in China from 1980 to 2012. Atmos. Chem. Phys. 2016, 16, 2043–2058. [Google Scholar]
  28. Luo, X.; Liu, X.; Pan, Y.; Wen, Z.; Xu, W.; Zhang, L.; Kou, C.; Lv, J.; Goulding, K. Atmospheric reactive nitrogen concentration and deposition trends from 2011 to 2018 at an urban site in north China. Atmos. Environ. 2020, 224, 117298. [Google Scholar]
  29. Yu, X.; Pan, Y.; Song, W.; Li, S.; Li, D.; Zhu, M.; Zhou, H.; Zhang, Y.; Li, D.; Yu, J.; et al. Wet and Dry Nitrogen Depositions in the Pearl River Delta, South China: Observations at Three Typical Sites With an Emphasis on Water-Soluble Organic Nitrogen. J. Geophys. Res. Atmos. 2020, 125, e2019JD030983. [Google Scholar]
  30. Li, Z.; Walters, W.W.; Hastings, M.G.; Zhang, Y.; Song, L.; Liu, D.; Zhang, W.; Pan, Y.; Fu, P.; Fang, Y. Nitrate Isotopic Composition in Precipitation at a Chinese Megacity: Seasonal Variations, Atmospheric Processes, and Implications for Sources. Earth Space Sci. 2019, 6, 2200–2213. [Google Scholar]
  31. Xu, W.; Liu, L.; Cheng, M.; Zhao, Y.; Zhang, L.; Pan, Y.; Zhang, X.; Gu, B.; Li, Y.; Zhang, X.; et al. Spatial–temporal patterns of inorganic nitrogen air concentrations and deposition in eastern China. Atmos. Chem. Phys. 2018, 18, 10931–10954. [Google Scholar]
  32. Pan, Y.P.; Wang, Y.S.; Tang, G.Q.; Wu, D. Wet and dry deposition of atmospheric nitrogen at ten sites in Northern China. Atmos. Chem. Phys. 2012, 12, 6515–6535. [Google Scholar]
  33. Liu, X.; Ju, X.; Zhang, Y.; He, C.; Kopsch, J.; Fusuo, Z. Nitrogen deposition in agroecosystems in the Beijing area. Agric. Ecosyst. Environ. 2006, 113, 370–377. [Google Scholar]
  34. Xu, W.; Wen, Z.; Shang, B.; Dore, A.J.; Tang, A.; Xia, X.; Zheng, A.; Han, M.; Zhang, L.; Zhao, Y.; et al. Precipitation chemistry and atmospheric nitrogen deposition at a rural site in Beijing, China. Atmos. Environ. 2020, 223, 117253. [Google Scholar]
  35. Sahu, L.K.; Kondo, Y.; Miyazaki, Y.; Kuwata, M.; Koike, M.; Takegawa, N.; Tanimoto, H.; Matsueda, H.; Yoon, S.C.; Kim, Y.J. Anthropogenic aerosols observed in Asian continental outflow at Jeju Island, Korea, in spring 2005. J. Geophys. Res. 2009, 114. [Google Scholar] [CrossRef]
  36. Pani, S.K.; Ou-Yang, C.-F.; Wang, S.-H.; Ogren, J.A.; Sheridan, P.J.; Sheu, G.-R.; Lin, N.-H. Relationship between long-range transported atmospheric black carbon and carbon monoxide at a high-altitude background station in East Asia. Atmos. Environ. 2019, 210, 86–99. [Google Scholar]
  37. Kanaya, Y.; Pan, X.; Miyakawa, T.; Komazaki, Y.; Taketani, F.; Uno, I.; Kondo, Y. Long-term observations of black carbon mass concentrations at Fukue Island, western Japan, during 2009–2015: Constraining wet removal rates and emission strengths from East Asia. Atmos. Chem. Phys. 2016, 16, 10689–10705. [Google Scholar]
  38. Boreddy, S.K.R.; Kawamura, K.; Okuzawa, K.; Kanaya, Y.; Wang, Z. Temporal and diurnal variations of carbonaceous aerosols and major ions in biomass burning influenced aerosols over Mt. Tai in the North China Plain during MTX2006. Atmos. Environ. 2017, 154, 106–117. [Google Scholar]
  39. Ge, B.; Wang, Z.; Lin, W.; Xu, X.; Li, J.; Ji, D.; Ma, Z. Air pollution over the North China Plain and its implication of regional transport: A new sight from the observed evidences. Environ. Pollut. 2018, 234, 29–38. [Google Scholar]
  40. Zhang, Y.; Liu, X.J.; Fangmeier, A.; Goulding, K.T.W.; Zhang, F.S. Nitrogen inputs and isotopes in precipitation in the North China Plain. Atmos. Environ. 2008, 42, 1436–1448. [Google Scholar]
  41. Cui, J.; Cui, J.; Peng, Y.; Yao, D.; Chan, A.; Chen, Z.; Chen, Y. Sources and trends of oxidized and reduced nitrogen wet deposition in a typical medium-sized city of eastern China during 2010–2016. Sci. Total Environ. 2020, 744, 140558. [Google Scholar] [PubMed]
  42. Zeng, J.; Yue, F.-J.; Li, S.-L.; Wang, Z.-J.; Qin, C.-Q.; Wu, Q.-X.; Xu, S. Agriculture driven nitrogen wet deposition in a karst catchment in southwest China. Agric. Ecosyst. Environ. 2020, 294, 106883. [Google Scholar]
  43. Zhao, X.; Yan, X.; Xiong, Z.; Xie, Y.; Xing, G.; Shi, S.; Zhu, Z. Spatial and Temporal Variation of Inorganic Nitrogen Wet Deposition to the Yangtze River Delta Region, China. Water Air Soil Pollut. 2009, 203, 277–289. [Google Scholar]
  44. Wang, H.; Shi, G.; Tian, M.; Chen, Y.; Qiao, B.; Zhang, L.; Yang, F.; Zhang, L.; Luo, Q. Wet deposition and sources of inorganic nitrogen in the Three Gorges Reservoir Region, China. Environ. Pollut. 2018, 233, 520–528. [Google Scholar] [PubMed]
  45. Liang, L.; Engling, G.; Du, Z.; Cheng, Y.; Duan, F.; Liu, X.; He, K. Seasonal variations and source estimation of saccharides in atmospheric particulate matter in Beijing, China. Chemosphere 2016, 150, 365–377. [Google Scholar] [PubMed]
  46. Zhao, M.; Huang, Z.; Qiao, T.; Zhang, Y.; Xiu, G.; Yu, J. Chemical characterization, the transport pathways and potential sources of PM2.5 in Shanghai: Seasonal variations. Atmos. Res. 2015, 158–159, 66–78. [Google Scholar]
  47. Liang, L.; Engling, G.; Cheng, Y.; Liu, X.; Du, Z.; Ma, Q.; Zhang, X.; Sun, J.; Xu, W.; Liu, C.; et al. Biomass burning impacts on ambient aerosol at a background site in East China: Insights from a yearlong study. Atmos. Res. 2020, 231, 104660. [Google Scholar]
  48. Zhang, Z.; Gao, J.; Engling, G.; Tao, J.; Chai, F.; Zhang, L.; Zhang, R.; Sang, X.; Chan, C.-Y.; Lin, Z.; et al. Characteristics and applications of size-segregated biomass burning tracers in China’s Pearl River Delta region. Atmos. Environ. 2015, 102, 290–301. [Google Scholar]
  49. Ho, K.F.; Engling, G.; Sai Hang Ho, S.; Huang, R.; Lai, S.; Cao, J.; Lee, S.C. Seasonal variations of anhydrosugars in PM2.5 in the Pearl River Delta Region, China. Tellus B Chem. Phys. Meteorol. 2014, 66, 22577. [Google Scholar]
  50. Liang, L.; Engling, G.; Duan, F.; Cheng, Y.; He, K. Characteristics of 2-methyltetrols in ambient aerosol in Beijing, China. Atmos. Environ. 2012, 59, 376–381. [Google Scholar]
  51. Chen, Z.; Huang, T.; Huang, X.; Han, X.; Yang, H.; Cai, Z.; Yao, L.; Han, X.; Zhang, M.; Huang, C. Characteristics, sources and environmental implications of atmospheric wet nitrogen and sulfur deposition in Yangtze River Delta. Atmos. Environ. 2019, 219, 116904. [Google Scholar]
  52. Kuang, F.; Liu, X.; Zhu, B.; Shen, J.; Pan, Y.; Su, M.; Goulding, K. Wet and dry nitrogen deposition in the central Sichuan Basin of China. Atmos. Environ. 2016, 143, 39–50. [Google Scholar]
  53. Fenn, M.E.; Ross, C.S.; Schilling, S.L.; Baccus, W.D.; Larrabee, M.A.; Lofgren, R.A. Atmospheric deposition of nitrogen and sulfur and preferential canopy consumption of nitrate in forests of the Pacific Northwest, USA. For. Ecol. Manag. 2013, 302, 240–253. [Google Scholar]
  54. Zhang, C.-H.; Guo, H.-R.; Huang, H.; Ma, T.-Y.; Song, W.; Chen, C.-J.; Liu, X.-Y. Atmospheric nitrogen deposition and its responses to anthropogenic emissions in a global hotspot region. Atmos. Res. 2021, 248, 105137. [Google Scholar]
  55. Calvo-Fernández, J.; Marcos, E.; Calvo, L. Bulk deposition of atmospheric inorganic nitrogen in mountainous heathland ecosystems in North-Western Spain. Atmos. Res. 2017, 183, 237–244. [Google Scholar]
  56. Zheng, L.; Chen, W.; Jia, S.; Wu, L.; Zhong, B.; Liao, W.; Chang, M.; Wang, W.; Wang, X. Temporal and spatial patterns of nitrogen wet deposition in different weather types in the Pearl River Delta (PRD), China. Sci. Total Environ. 2020, 740, 139936. [Google Scholar]
  57. Fahey, T.J.; Williams, C.J.; Rooney-Varga, J.N.; Cleveland, C.C.; Postek, K.M.; Smith, S.D.; Bouldin, D.R. Nitrogen Deposition In and Around an Intensive Agricultural District in Central New York. J. Environ. Qual. 1999, 28, 1585–1600. [Google Scholar]
  58. Zhang, L.; Tian, M.; Peng, C.; Fu, C.; Li, T.; Chen, Y.; Qiu, Y.; Huang, Y.; Wang, H.; Li, Z.; et al. Nitrogen wet deposition in the Three Gorges Reservoir area: Characteristics, fluxes, and contributions to the aquatic environment. Sci. Total Environ. 2020, 738, 140309. [Google Scholar]
  59. Zhang, X.; Lin, C.; Zhou, X.; Lei, K.; Guo, B.; Cao, Y.; Lu, S.; Liu, X.; He, M. Concentrations, fluxes, and potential sources of nitrogen and phosphorus species in atmospheric wet deposition of the Lake Qinghai Watershed, China. Sci. Total Environ. 2019, 682, 523–531. [Google Scholar]
  60. Yu, W.T.; Jiang, C.M.; Ma, Q.; Xu, Y.G.; Zou, H.; Zhang, S.C. Observation of the nitrogen deposition in the lower Liaohe River Plain, Northeast China and assessing its ecological risk. Atmos. Res. 2011, 101, 46–468. [Google Scholar]
  61. Liu, L.; Liu, Y.; Wen, W.; Liang, L.; Ma, X.; Jiao, J.; Guo, K. Source Identification of Trace Elements in PM2.5 at a Rural Site in the North China Plain. Atmosphere 2020, 11, 179. [Google Scholar]
  62. NASA, Fire Information for Resource Management System. Available online: https://firms.modaps.eosdis.nasa.gov/map. (accessed on 20 October 2020).
  63. Meng, X.; Zhou, W.; Rokni, E.; Chen, G.; Sun, R.; Levendis, Y.A. Release of Alkalis and Chlorine from Combustion of Waste Pinewood in a Fixed Bed. Energy Fuels 2019, 33, 1256–1266. [Google Scholar]
  64. Yu, S.; Zhang, C.; Yuan, C.; Xu, H.; Ma, L.; Fang, Q.; Chen, G. Investigation on the influence of sulfur and chlorine on the initial deposition/fouling characteristics of a high-alkali coal. Fuel Process. Technol. 2020, 198, 106234. [Google Scholar]
  65. Wilczyńska-Michalik, W.; Dańko, J.; Michalik, M. Characteristics of Particulate Matter Emittedfrom a Coal-Fired Power Plant. Pol. J. Environ. Stud. 2020, 29, 1411–1420. [Google Scholar]
  66. Zhao, K.; Hu, Y.; Tian, Y.; Chen, D.; Feng, Y. Chlorine removal from MSWI fly ash by thermal treatment: Effects of iron/aluminum additives. J. Environ. Sci. 2020, 88, 112–121. [Google Scholar]
Figure 1. Monthly patterns of (a) precipitation amounts and VWM concentrations (mg N L−1) of inorganic nitrogen species (i.e., NH4+–N and NO3–N); (b) proportion of NH4+–N and NO3–N to TIN in wet deposition at the Daheitin (DHT) reservoir, a rural site in North China from July 2019 to June 2020. There was no precipitation during December 2019 and January 2020.
Atmosphere 11 01260 g001
Figure 2. Monthly patterns of (a) wet deposition rates (kg N ha−1) of NO3–N, NH4+–N, and (b) their proportion of the total deposition rate of wet inorganic nitrogen (DIN) at the DHT reservoir, a rural site in North China from July 2019 to June 2020. There was no precipitation during December 2019 and January 2020.
Atmosphere 11 01260 g002
Figure 3. A box chart of the monthly patterns of NH4+–N/NO3–N ratios at the DHT reservoir, a rural site in North China from July 2019 to June 2020. There was no precipitation during December 2019 and January 2020. (×: The minimum and maximum values of the NH4+–N/NO3–N ratio; the average value; upper and lower edge mean the 25% and 75% value; lines in the box indicate the median value of the NH4+–N/NO3–N ratio).
Atmosphere 11 01260 g003
Figure 4. Temporal variations of (a) concentrations of NH4+–N and NO3–N, (b) nss-K+ and Cl, (c) the ratios of nss-K+/NO3-N and nss-K+/NH4+-N, (d) the ratios of NO3–N/TIN and NH4+–N/TIN, and (e) rainfall in wet depositions in the DHT reservoir region from 6 June 2019 to 30 June 2020. The gray shades in the biomass burning’s impact (precipitation events at 6 June 2019, 29 June and 30 July 2019), and the pink shades in the heating start time with coal combustion and waste incineration (precipitation event at 21 November 2019).
Atmosphere 11 01260 g004
Figure 5. Fire pixel counts in North China observed from MODIS Terra and Aqua [62] in (a) June, (b) July, (c) November, and (d) December 2019.
Atmosphere 11 01260 g005
Figure 6. The relationships between the concentrations of NO3–N, NH4+–N, and nss-K+ in wet depositions in the DHT reservoir region from 6 June 2019 to 30 June 2020. Statistical analysis of the data was conducted with the linear fitting method.
Atmosphere 11 01260 g006
Table 1. The statistical summary of water-soluble ions in precipitation and their volume-weighted mean (VWM) concentrations from July 2019 to June 2020. nss = Non-sea salt.
ParameterUnitAverageSDMinimumMaximumMedianCvwm
nss-K+mg L−10.350.670.013.590.140.21
Na+mg L−11.303.560.0415.30.190.74
Ca2+mg L−12.212.600.1712.61.391.54
Mg2+mg L−10.420.490.072.480.280.30
NH4+mg L−13.001.830.348.642.272.71
NO3mg L−16.245.270.5132.74.064.69
SO42−mg L−15.044.160.5925.53.904.03
Fmg L−10.090.090.010.430.060.07
Clmg L−10.961.580.109.040.550.59
NH4+–Nmg L−12.331.420.276.721.772.28
NO3–Nmg L−11.411.290.117.390.921.15
Ratio of NH4+–N/NO3–N-1.970.640.263.411.921.97
Mass ratio of NO3/SO42−-1.200.300.661.751.21-
Table 2. Annual and seasonal variations in rainfall (mm), NH4+–N/NO3–N ratios, annual VWM concentrations (mg N L−1) of inorganic nitrogen (NH4+–N, NO3–N, and TIN), and wet N deposition rates (kg N ha−1) at the DHT reservoir, a rural site in North China from July 2019 to June 2020.
SeasonsRainfall (mm)N Concentration in Rainwater (mg N L−1)Wet N Deposition Rate (kg N ha−1)
NH4+–NNO3–NTINNH4+/NO3 RatioNH4+–NNO3–NDIN
Spring (March–May)1222.351.433.781.812.871.754.62
Summer (June–August)4161.940.842.782.158.063.5111.6
Autumn (September–November)51.32.701.764.471.351.390.902.29
Winter (December–January)5.804.202.556.751.650.240.150.39
Annual5952.111.063.171.9712.6 *6.31 *18.9 *
* The unit is kg N ha−1 yr−1. DIN: deposition rate of wet inorganic nitrogen.
Publisher’s Note: MDPI stays neutral with regard to jurisdictional claims in published maps and institutional affiliations.

