Article

Intensification of Summer Rainfall Extremes over Nigeria during Recent Decades

by
Victor Nnamdi Dike
1,2,
Zhao-Hui Lin
1,3,* and
Chikwem Coleman Ibe
2
1
International Center for Climate and Environment Sciences, Institute of Atmospheric Physics, Chinese Academy of Sciences, Beijing 100029, China
2
Energy, Climate, and Environment Sciences Group, Imo State Polytechnic Umuagwo, Ohaji P.M.B 1472, Imo State, Nigeria
3
Collaborative Innovation Center on Forecast and Evaluation of Meteorological Disasters, Nanjing University of Information Science and Technology, Nanjing 210044, China
*
Author to whom correspondence should be addressed.
Atmosphere 2020, 11(10), 1084; https://doi.org/10.3390/atmos11101084
Submission received: 30 June 2020 / Revised: 24 August 2020 / Accepted: 28 September 2020 / Published: 12 October 2020
(This article belongs to the Special Issue Trends in Hydrological and Climate Extremes in Africa)

Abstract

:
Rainfall extremes can cause a significant loss of lives and economic losses in Nigeria. This study aims to investigate the trends of summer rainfall extremes over Nigeria with daily station datasets from 1975 to 2013. Using the rainfall extreme indices recommended by the Expert Team on Climate Change Detection Monitoring Indices (ETCCDMI), it is found that regionally averaged summer total wet-day rainfall amount (PRCPTOT), maximum consecutive 5-day rainfall amount (RX5day), and wet-day rainfall intensity (SDII) have increased in the three climatic regions of Nigeria namely Guinea coast, Sub-Sahel, and the Sahel regions. Meanwhile, heavy rainfall days (R20mm) increased significantly over the Guinea coast and sub-Sahel regions, while the wet-day frequency (RR1) only increased slightly. The increase in PRCPTOT over the two regions is mainly resulting from the increasing intensity and frequency of rainfall extremes. However, the Nigerian Sahel is characterized by a decreasing wet-day frequency, which demonstrates that a large proportion of the increasing PRCPTOT in the region is more associated with intense rainfall than its frequency. These characteristic increasing trends of rainfall extremes may explain the frequent flood events over Nigeria and as such this study may give guidance to stakeholders on how best to cope with it in the future.

1. Introduction

Climate change is characterized by the increasing global mean surface temperature which is known to have increased by 0.85 °C during 1880–2012 [1]. Recent studies have reported an increase in high-temperature extremes over Nigeria [2,3,4], however, considerable uncertainty remains concerning the changes in rainfall extremes in response to global warming. Arguably, in a warming climate, saturation vapor pressure will increase exponentially with atmospheric temperature according to the Clausius–Clapeyron relationship [5,6]. This increase in atmospheric water vapor, in turn, will invigorate rainstorms and produce heavier than normal precipitation [7,8]. Consequently, average summer rainfall has increased in many land areas in Africa [7,9], which is evident in the recent increase in extreme rainfall events observed over West Africa [3,10,11,12] and has caused unprecedented loss of lives as well as a tremendous increase in economic losses over entire Sub-Saharan Africa [9]. In the 2012 summer season alone, Nigeria experienced a devastating flood disaster that affected about twenty-seven states of the federation, causing the deaths of over four hundred persons and displaced over two million people from their homes with an estimated economic loss of about 11.5 billion USD. The frequency of occurrence of flood events has brought to fore the need to analyze the changes of extreme rainfall events, in terms of frequency and intensity of the events, as the perception of the effect of floods is growing [13,14].
To facilitate the investigation of rainfall extremes, the Expert Team on Climate Change Detection and Monitoring Indices (ETCCDMI) defined a set of extreme climate indices [15,16]. Several studies have used the recommended extreme rainfall indices to examine the variability and changes of rainfall extremes in many parts of the globe [12,17,18,19] in both observational [11,19,20,21,22] and numerical model [23,24,25] studies. However, few studies have examined variability and trends of extreme rainfall over Nigeria [3,12,22,26,27] using these indices. These studies evaluated the annual rainfall extremes over the country, For example, Gbode et al. [3] found a significant increase in annual total rainfall in some stations across the Guinea Coast and Sahel regions, which is consistent with the findings in Akinsanola and Ogunjobi [27] and suggests that the increasing annual total rainfall is perhaps resulting from a significant increase in extremely wet days across the country [3]. Using a limited number of stations in Nigeria, New et al. [12] demonstrated that daily rainfall intensity, maximum annual 1-day rainfall amount, and dry spell duration increased significantly during the 1961–2000 period. Similarly, Gbode et al. [26] reported a slight increase in annual total rainfall and a decrease in the maximum number of consecutive wet days in Kano. Relatedly, Bichet and Diedhiou [22] found less frequent and more intense rainfall along the coast of West Africa during the April–June and September–November seasons, consistent with the findings for other regions in Africa [10,28,29]. Notably, summer rainfall accounts for 75% of annual total rainfall over Nigeria [30,31]. However, the studies mentioned earlier focused on the annual mean rainfall extremes or seasons other than the summer period. It is therefore imperative to investigate the trends and variations of summer rainfall extremes over the country using widespread station data to gain insight into the characteristics of summer rainfall extremes across the climate regions of Nigeria.
Nonetheless, the seasonality and annual total rainfall amount in Nigeria varies across latitude [30,32], as such, three distinct climate regions are identified [3,33]. Variations in rainfall trends have been reported in these climate regions [3,32,33]. However, previous studies that investigated rainfall extremes have placed little emphasis on the regional differences of the trends in summer rainfall extremes. More so, the frequency and intensity have generally received less attention. Consequently, this study will focus on the spatiotemporal trends in summer rainfall extreme for the sixteen stations covering the three climatic zones in Nigeria during the 1975–2013 period, as well as the regional difference in trends of rainfall extremes and its frequency and intensity. This will be useful for exploring the impact of changing climate on extreme rainfall events over Nigeria for better adaptation and mitigation strategy. The rest of the paper is organized in the following sections: Section 2 introduces the study area, data, and rainfall extreme indices as well as the methodology. Characteristics of different aspects of summer rainfall extremes over Nigeria is described in Section 3. The paper ends with concluding remarks in Section 4.

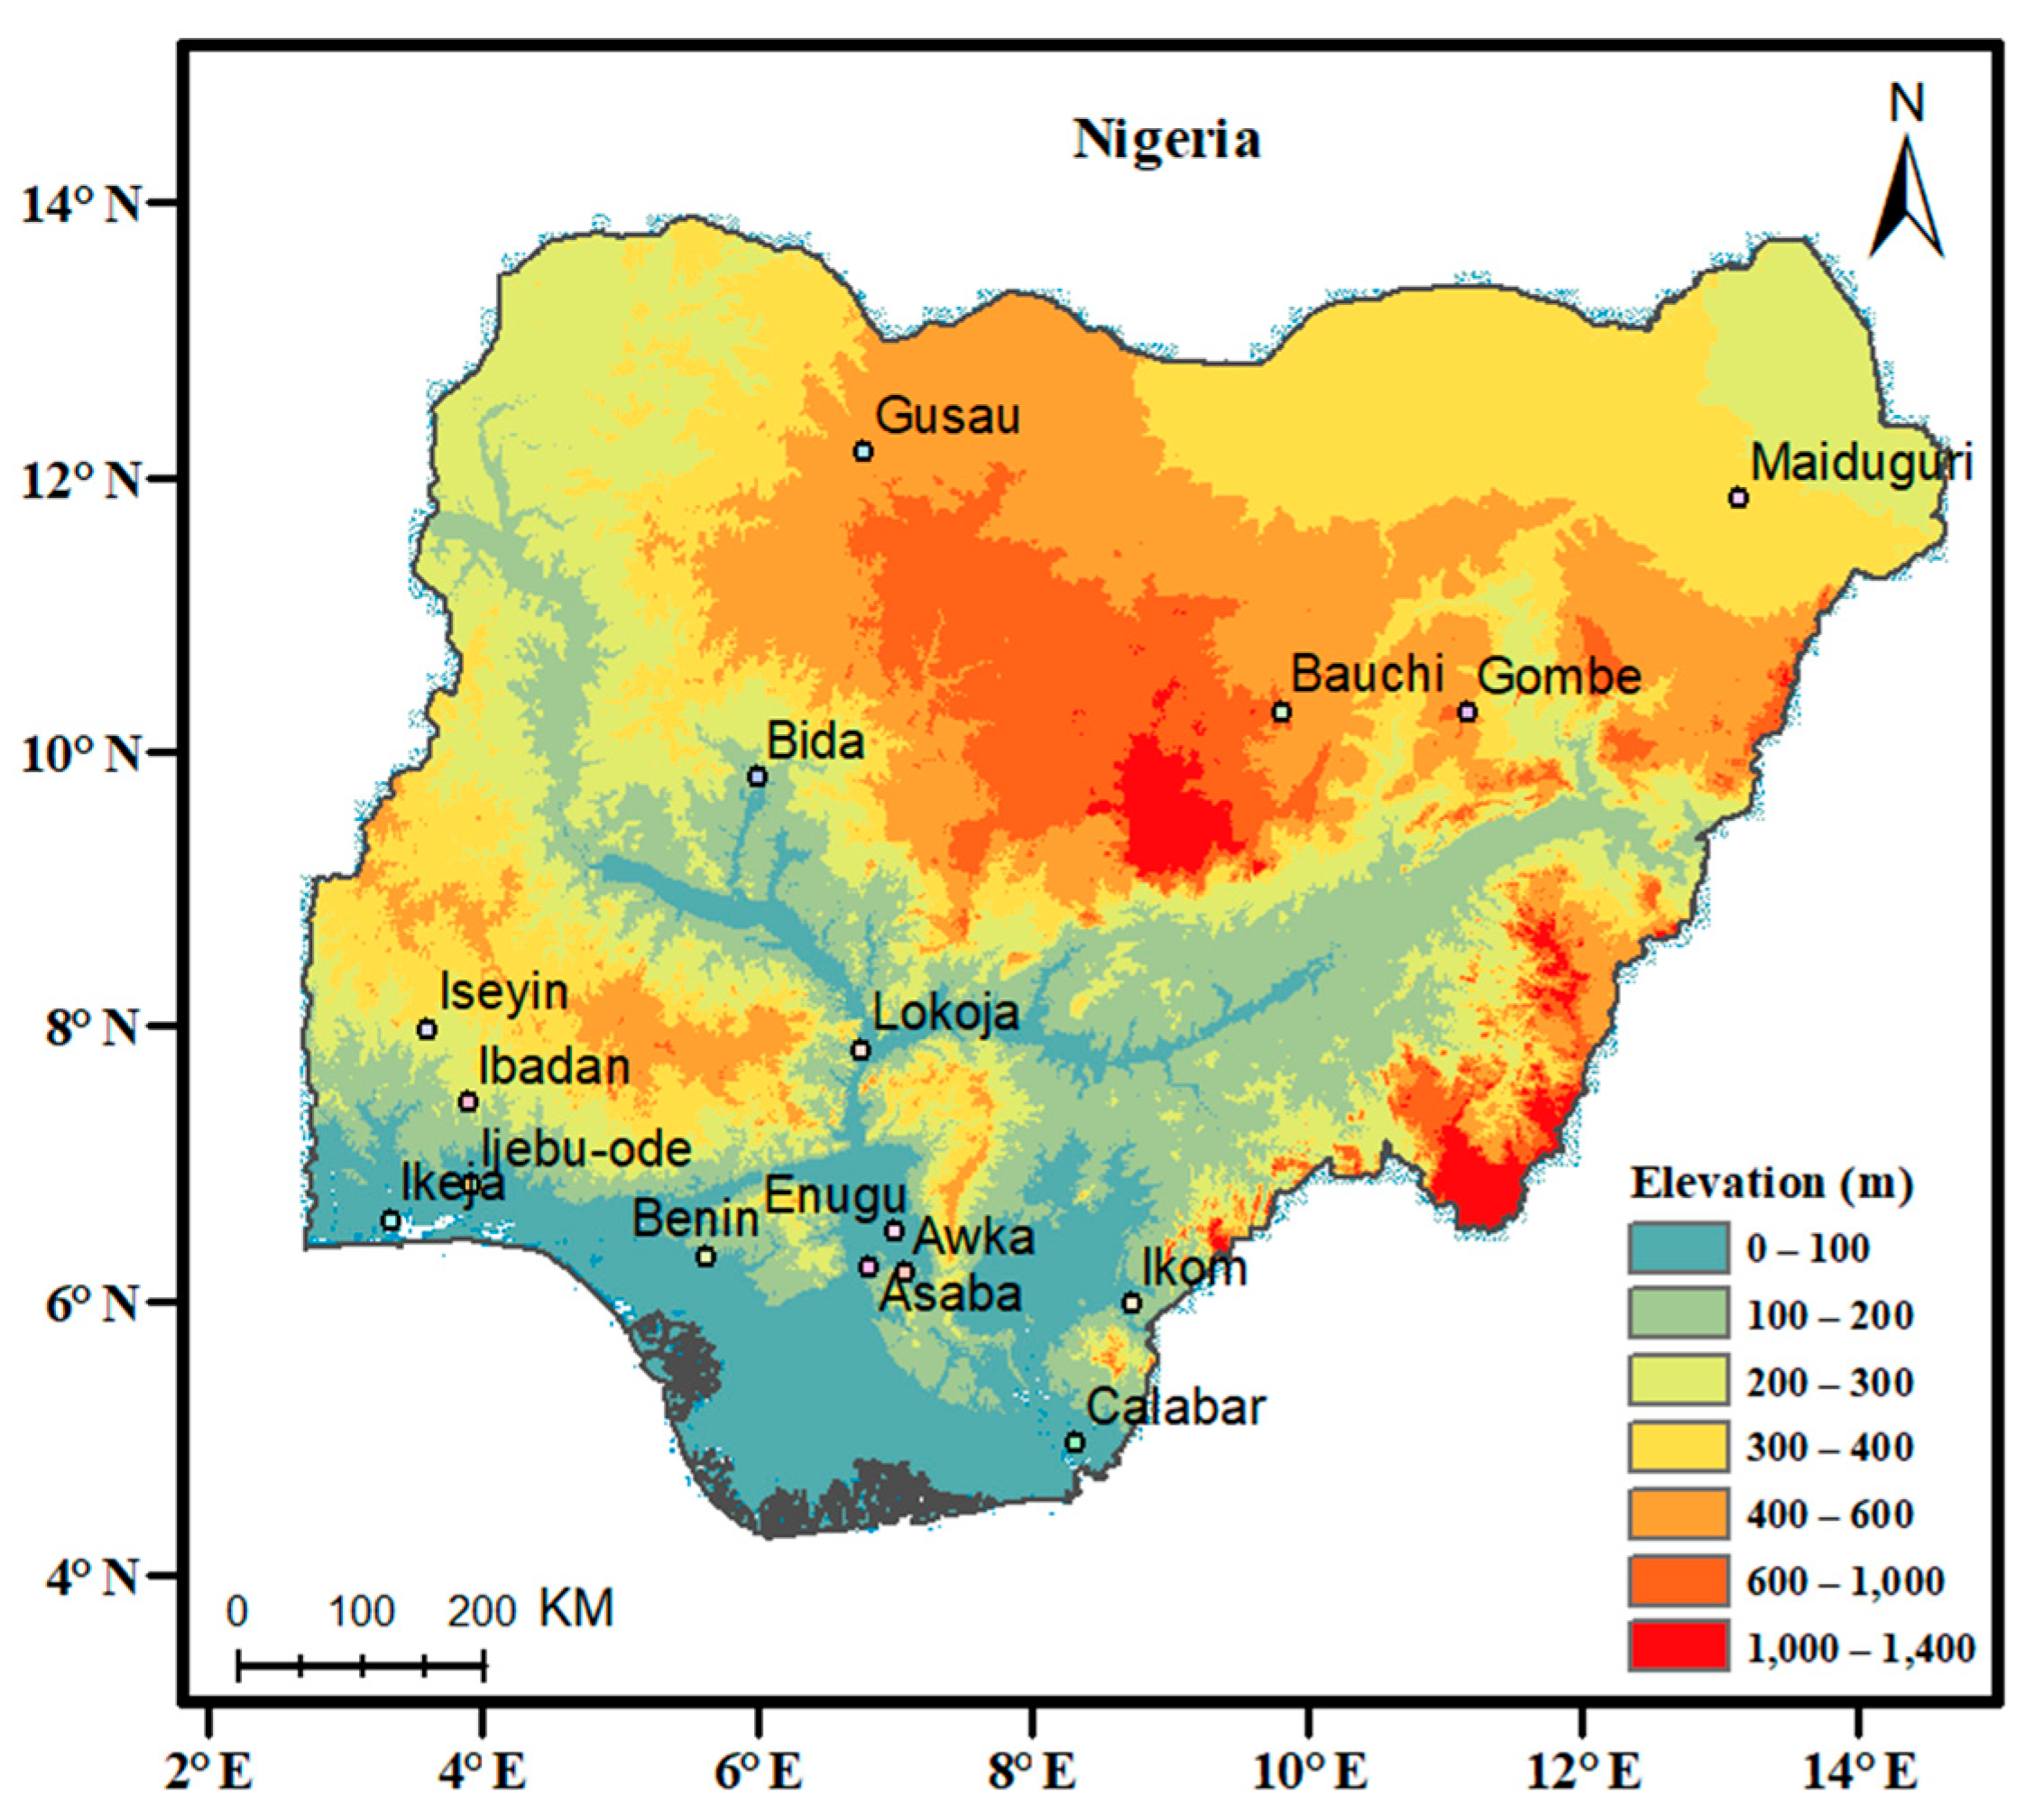
2. Study Area, Data, and Analytical Methods

Nigeria is located in the West African region between latitudes 4 °N–14 °N and longitudes 3° E–15° E, which has a total area of about 925,796 km2 (Figure 1). The Climate is governed by West African monsoon circulation with moisture from the Gulf of Guinea in the low levels of the atmosphere, bringing the Inter-Tropical Convergence Zone (ITCZ) and the associated rainfall northwards [34,35]. Rainfall variability in West Africa and indeed Nigeria is associated with complex interactions between atmosphere and land-surface, and ocean teleconnections [36,37]. The onset of the monsoon system over West Africa is linked to the northward migration of the ITCZ during the spring and summer season [35]. The northward movement of the ITCZ classifies Nigeria into three climatic regions which cover the north, middle and southern areas of the country, i.e., the Sahel (10°–15° N), Sub-Sahel (8°–10° N), and the Guinea (4°–8° N) zones. Rainfall commences approximately in March/April over the southern coastal regions, spreads through the middle zone in May/June, and reaches the northern region in August and September [32], and retreats afterward, as such the summer rainfall maxima are observed during June–September.
Time series of daily rainfall distributed evenly from January 1975 to December 2013 acquired from sixteen weather stations by the Nigerian Meteorological Agency (NIMET) were used in the analysis. With the 39-year data length of daily average rainfall values, it is possible to establish the seasonal cycle and long-term trends and other characteristics of rainfall extremes. The NIMET data has been employed to perform some studies [3,26,38] and so forth. To investigate the rainfall extremes variations over the three climate regions of Nigeria, the daily rainfall data were subjected to quality control and homogeneity assessment using the approach proposed by Wang et al. [39] and adopted in Dike et al. [38]. Stations with inhomogeneity, discontinuities, and missing data ≥ 30% were not used for the analysis. Based on the daily rainfall time series, the frequency, intensity, and duration of rainfall extremes were calculated based on six extreme rainfall indices (see, Table 1) which were selected from a suite of extreme climate indices as proposed by the Expert Team on Climate Change Detection Monitoring Indices [15,16]. These indices have been widely used for investigating the variation and changes in climate extremes [4,12,17,19,22,27,38,40]. The daily rainfall station datasets for the regions were used to calculate the indices. As shown in Figure 1, eleven stations fall within the Guinea Coast region, one station for the Sub-Sahel region and four for the Nigerian Sahel.
The trends in the rainfall extremes were computed using Theil–Sen estimator [41] and tested for statistical significance based on the non-parametric Mann–Kendall rank test [42,43]. This is a standard procedure for examining monotonic trends in climate data and it is widely applied because of its robustness [4,32,44]. The test of significance was conducted at 90% confidence levels. A positive value of Theil–Sen slope indicates an increasing trend, while a negative value indicates a decreasing trend. In this study, except for dry spell (CDD), positive (increasing) trends indicate wetter conditions, whereas negative (decreasing) trends suggest drier conditions.

3. Results and Discussion

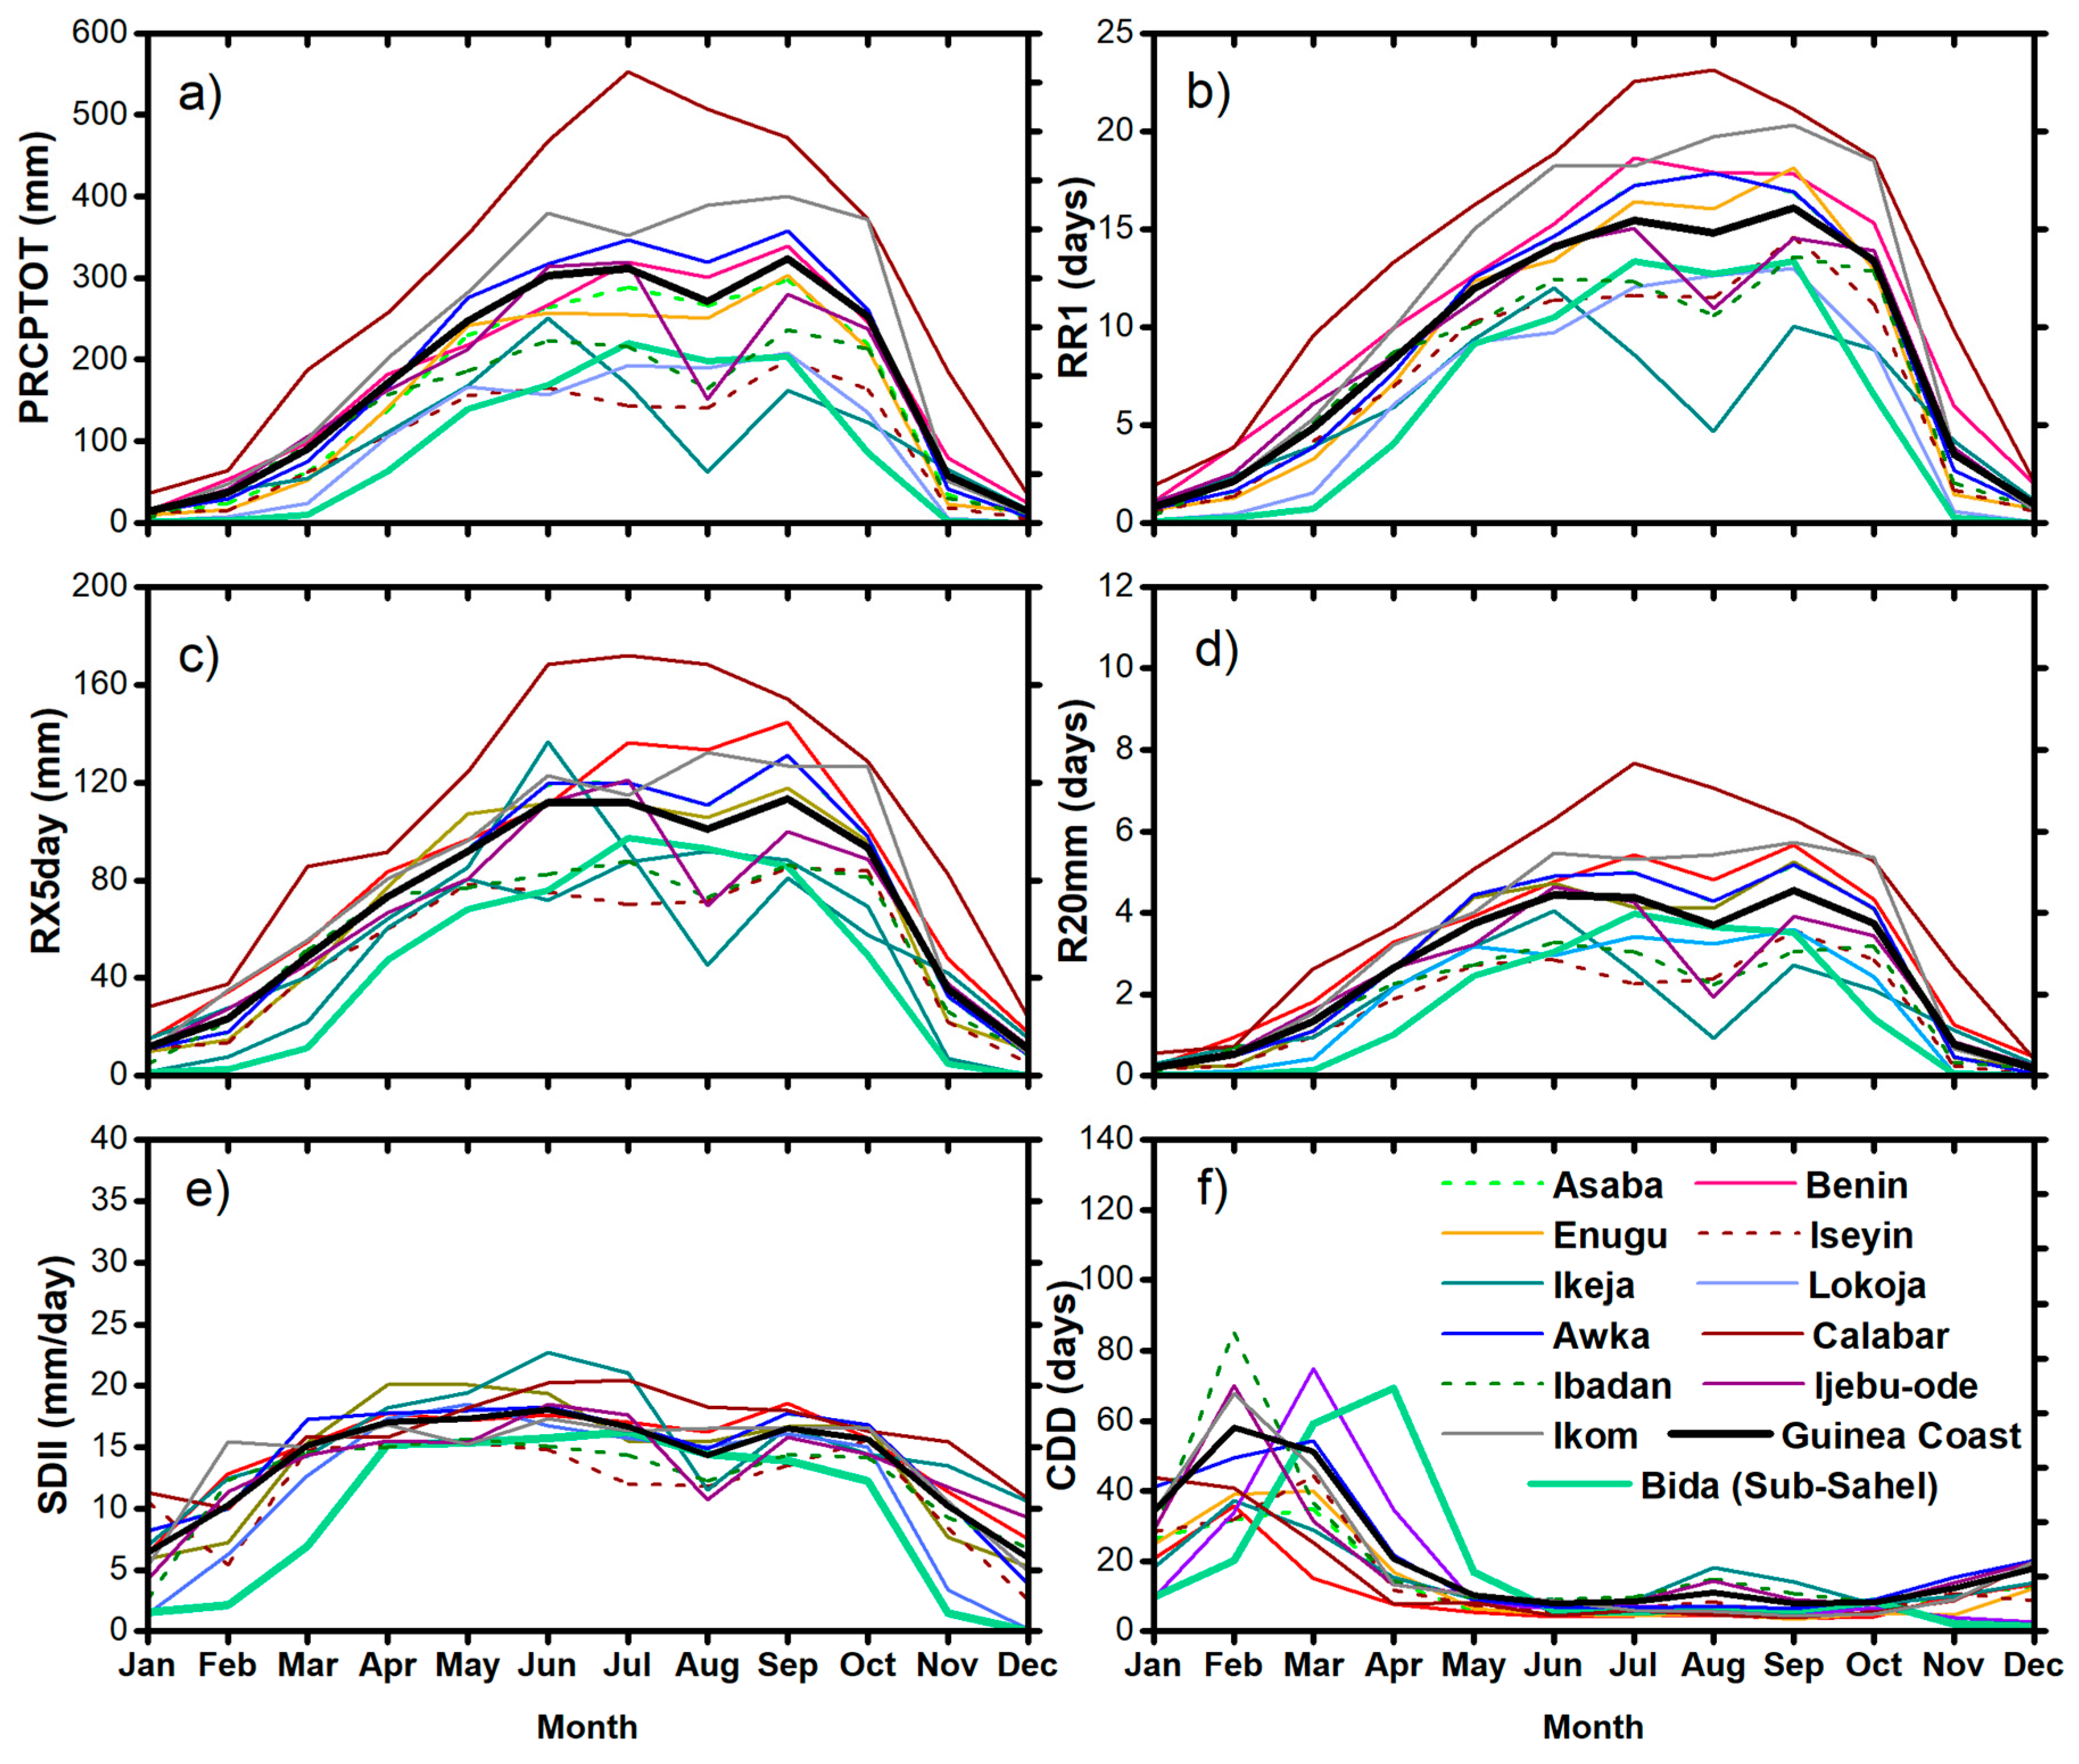
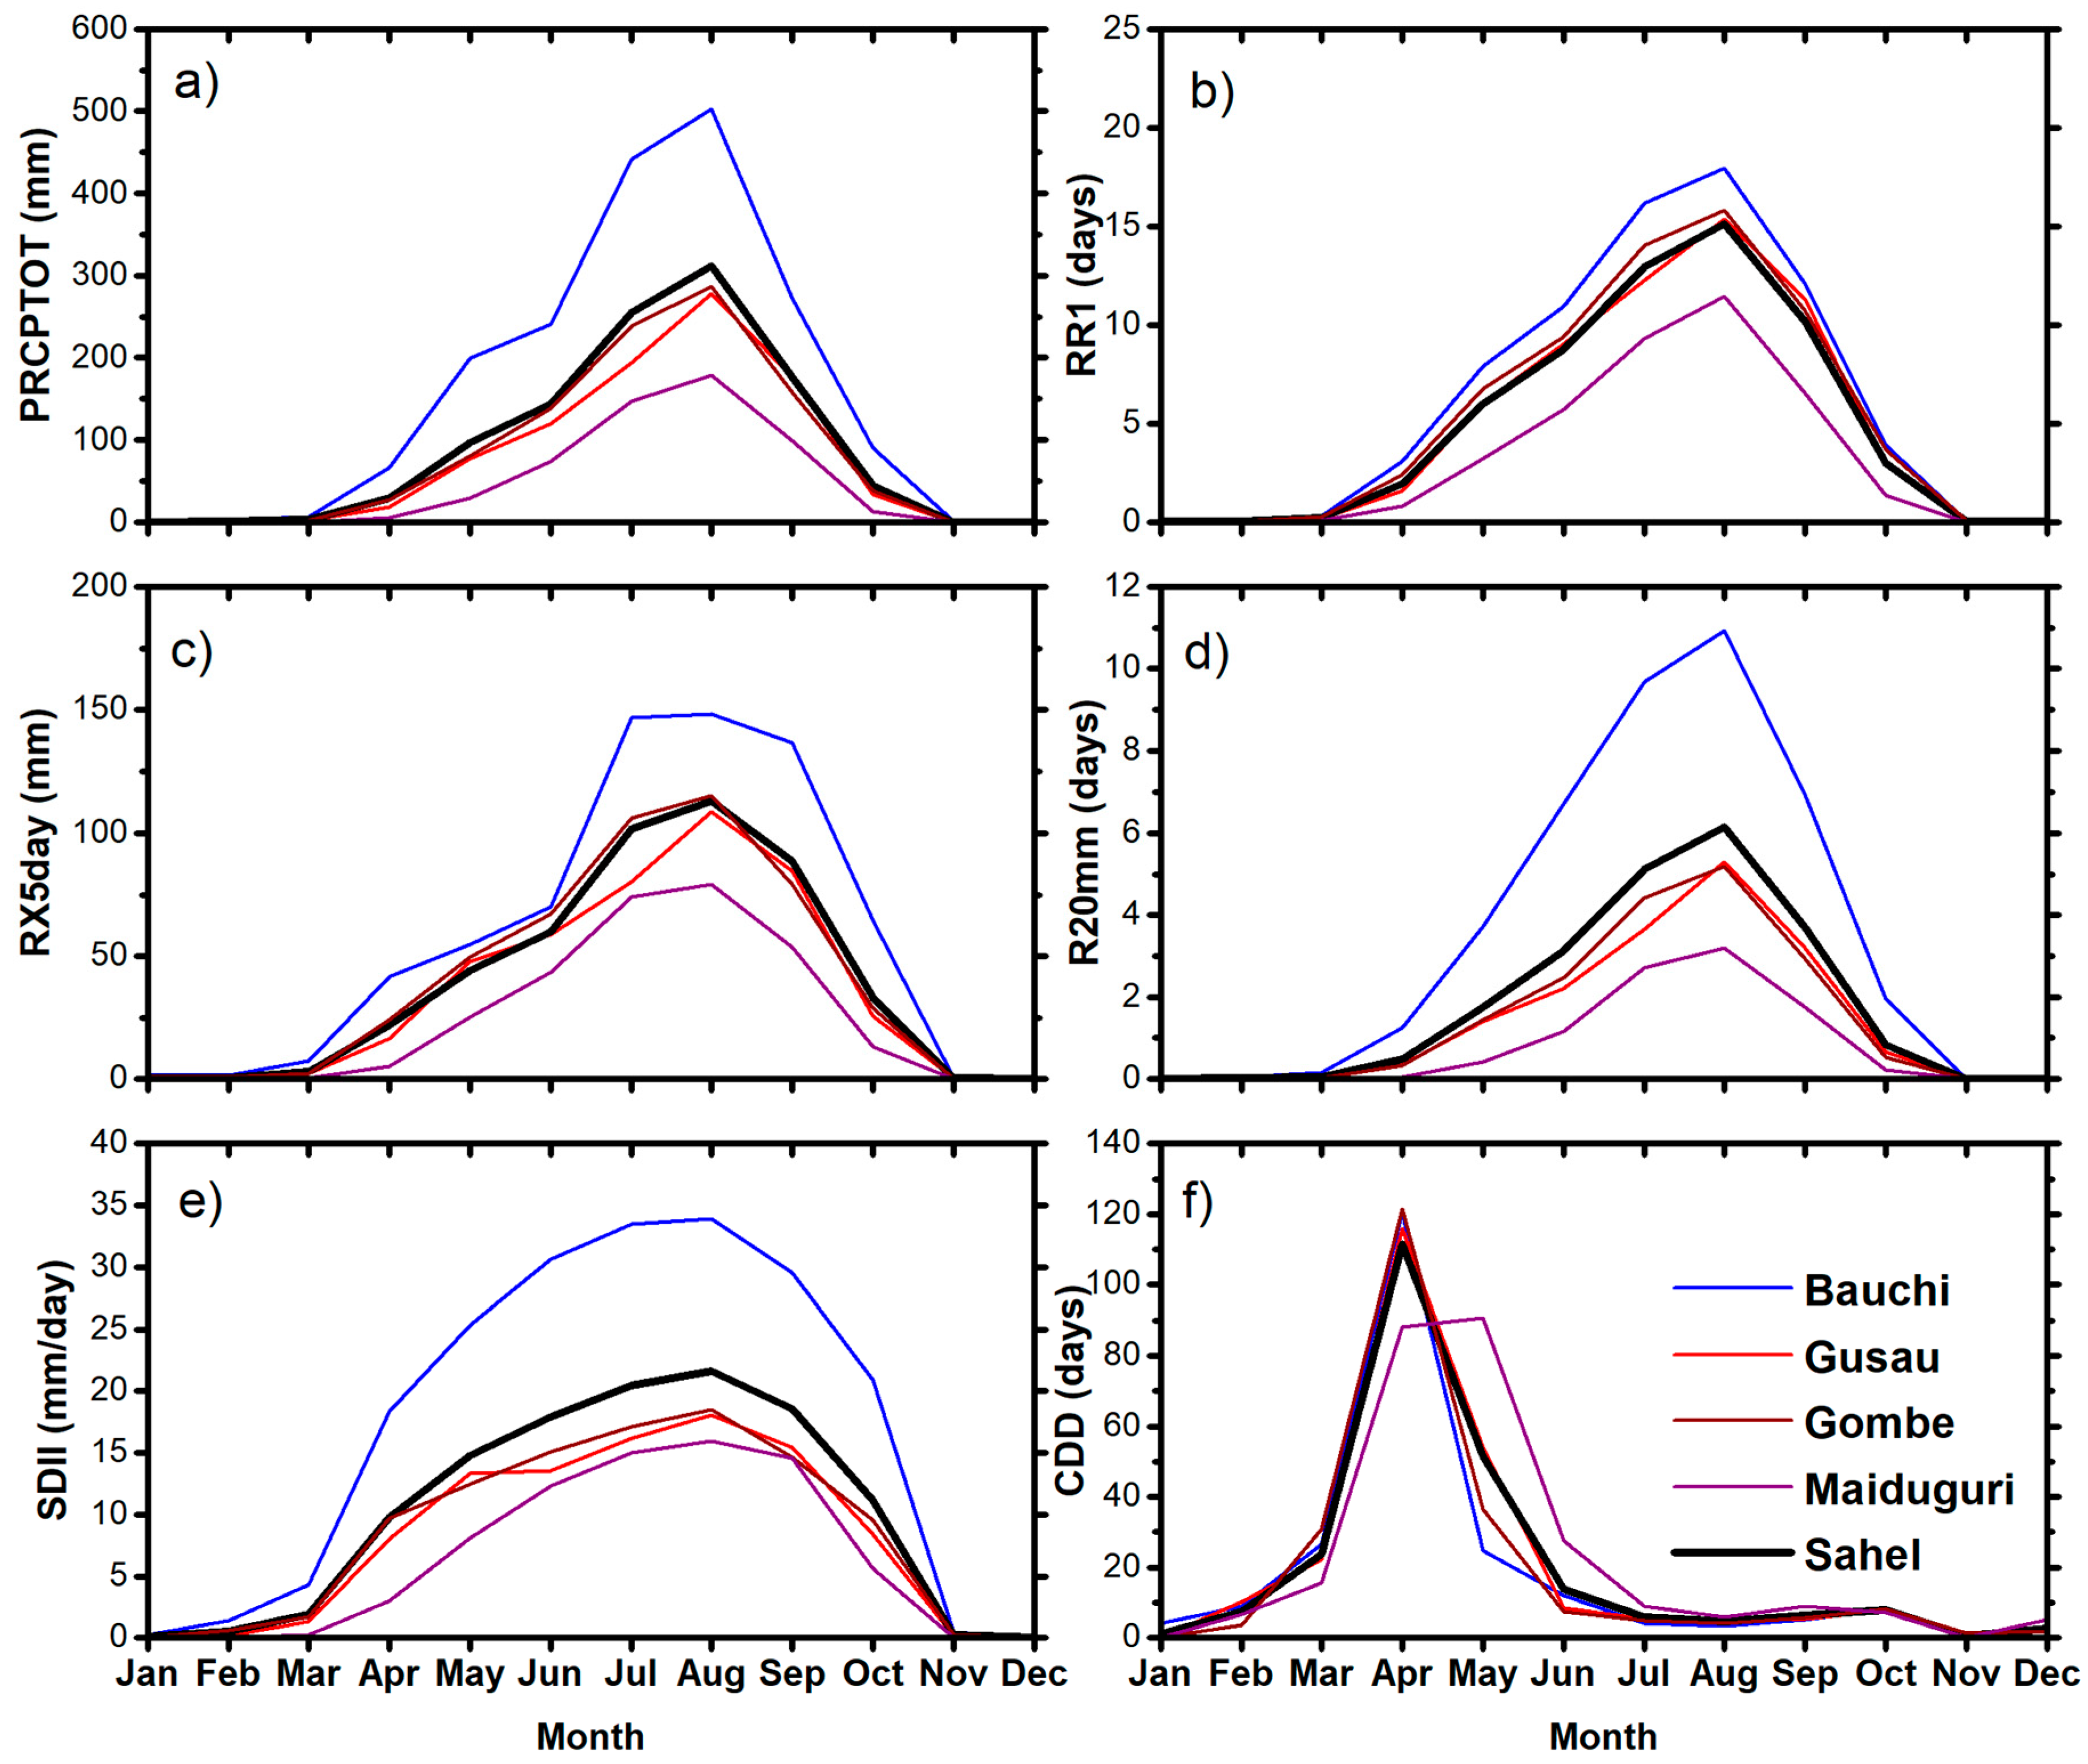
3.1. Seasonality of Rainfall Extremes over Nigeria

Figure 2 presents the mean seasonal cycle of extreme rainfall indices for the Guinea Coast and Sub-Sahel regions during the (1975–2013) period. The lines show the evolution of rainfall extremes for the individual stations. The line labeled Guinea Coast shows the mean of extreme rainfall index averaged from all the stations within the Guinea Coast while the line labeled Sub-Sahel (Bida) is for the Sub-Sahel region. In the regions, the rainy season starts around March–April with the first peak in June–July and second peak in September while August corresponds to the mid-summer monsoon low known as “August-break” in the region [45,46]. The onset of the rainy season corresponds to the period when the Intertropical Convergence Zone begins its northward migrations [35]. The June–July peak coincides with the period when the ITCZ is located at latitude 5° N [47]. The abrupt shift of ITCZ from 5° N to 10° N corresponds to the decrease of rainfall over the Guinea Coast in August known as “August-break” [45,46,48]. The southward retreat of the ITCZ in September is associated with the second peak over the region.
As shown in Figure 2, the indices of extreme rainfall follow the seasonal march of monsoon rainfall over the region and help to identify extreme rainfall minima and maxima. Figure 2a illustrates that during the summer season, most of the stations in the region recorded a large amount of PRCPTOT. For instance, the figure suggests that total wet-day rainfall maxima of about 550 mm/month are recorded in Calabar, and minima of 150 mm/month is seen over Awka in July. Similarly, during the second peak, about 470 mm/month total wet-day rainfall amount is observed in Calabar while Ibadan recorded the least ~150 mm/month. Furthermore, the seasonal cycle averaged over the entire region also depicts the well-known bimodal rainfall pattern within the June–July–August–September (JJAS) months. This pattern is a similitude to the observed pattern in Bida, the only Sub-Sahel location considered in this study.
The seasonal cycle of RR1 clearly shows the monthly distribution of wet-day frequency over the Guinea Coast. The double-peak structure found in PRCPTOT is evident in RR1, RX5day, R20mm, and SDII, except in CDD. Figure 2b suggests that Calabar experienced the highest number of wet-days of about 23 days/month during the summer season, particularly in July. In contracts, the average number of wet-days for the region is 17 days/month. This perhaps explains the high amount of monthly total rainfall in the stations, as such the intense rainfall extreme can be linked to the frequency of the extremes.
Furthermore, we show in Figure 2c the seasonal cycle of maximum consecutive 5-day rainfall for the Guinea Coast region and it suggests a high amount of RX5day over the region during the summer season. As the number of rainy days is relatively high intense rainfall is at is maxima. It further suggests that the flood events ravaging the region are perhaps associated with frequent and intense rainfall extremes in the region. We further show in Figure 2d that number of heavy rainfall days follows a similar pattern varying from 4 days in July to 5 days in September. This indicates that the occurrence of torrential rainfall of high magnitude is prevailing over the region.
To strengthen the point earlier made on the occurrence of intense rainfall extremes, we demonstrate in Figure 2e that wet-day intensity starts from the onset of rainy days in the region (March–April through September–October), mimicking the bimodal structure of summer rainfall in the region. Notably, the PRCPTOT, RR1, RX5day, R20mm, and SDII contribute substantially to the bimodal structure of the seasonal cycle of rainfall in the region. Interestingly, Fotso-Nguemo et al. [24] found the similar pattern for the central African region. As evident in Figure 2f, the seasonal cycle of dry spell shows that the high magnitude of a dry spell is only prevalent between October and March, with maximum dry days in February corresponding to the peak of the dry season in the region. Most of the observed extreme rainfall over the Guinea Coast is similar to that at Bida (the Sub-Sahel station) [49], but with lower magnitude.
Next, we show in Figure 3 the mean seasonal cycle of rainfall extremes for the Nigerian Sahel region. As expected, the extremes are characterized by a singular-peak corresponding to when the ITCZ is at its northernmost location [35]. Notably, the August maxima over the Sahel correspond to the “little dry period” in mid-summer season over the Guinea Coast and Sub-Sahel regions. Figure 3a–d shows that PRCPTOT, RR1, RX5day, and R20mm follows the unimodal rainfall pattern in the Sahel region. Nonetheless, the Sahel region is known for the drought that ravaged the region in the 1970s/1980s [50,51]. Several studies have reported rainfall recovery in the region [11,51,52,53]. Our results show a high magnitude of monthly total rainfall extremes in the region. Bauchi recorded a higher amount of monthly total rainfall as compared to other stations in the region. Although few stations are considered over the Nigerian Sahel, there are also indications that the magnitude of rainfall extremes over the region is comparatively similar to the magnitude obtained for the Guinea Coast region. As such the average number of wet days in the region is about 15 days in August (Figure 3b). Consequently, RX5day reaches its maximum value of 100 mm in the same month.
Furthermore, the number of heavy rainfall (RR ≥ 20 mm) days is more than 5 days/month over the Nigerian Sahel region. It is found that the rainfall intensity of wet-days is as much as 22 mm/day in the region, and this suggests that wet-day intensity contributes largely to the total monthly rainfall extremes in the region (Figure 3e). However, dry spells are more prevalent during the pre-monsoon season, as less than 5 days dry spell is observed during the summer months. The results clearly show that a proportion of the rainfall extremes is observed during the summer months; as such, the rest of this study will focus on the trends of summer rainfall extremes.

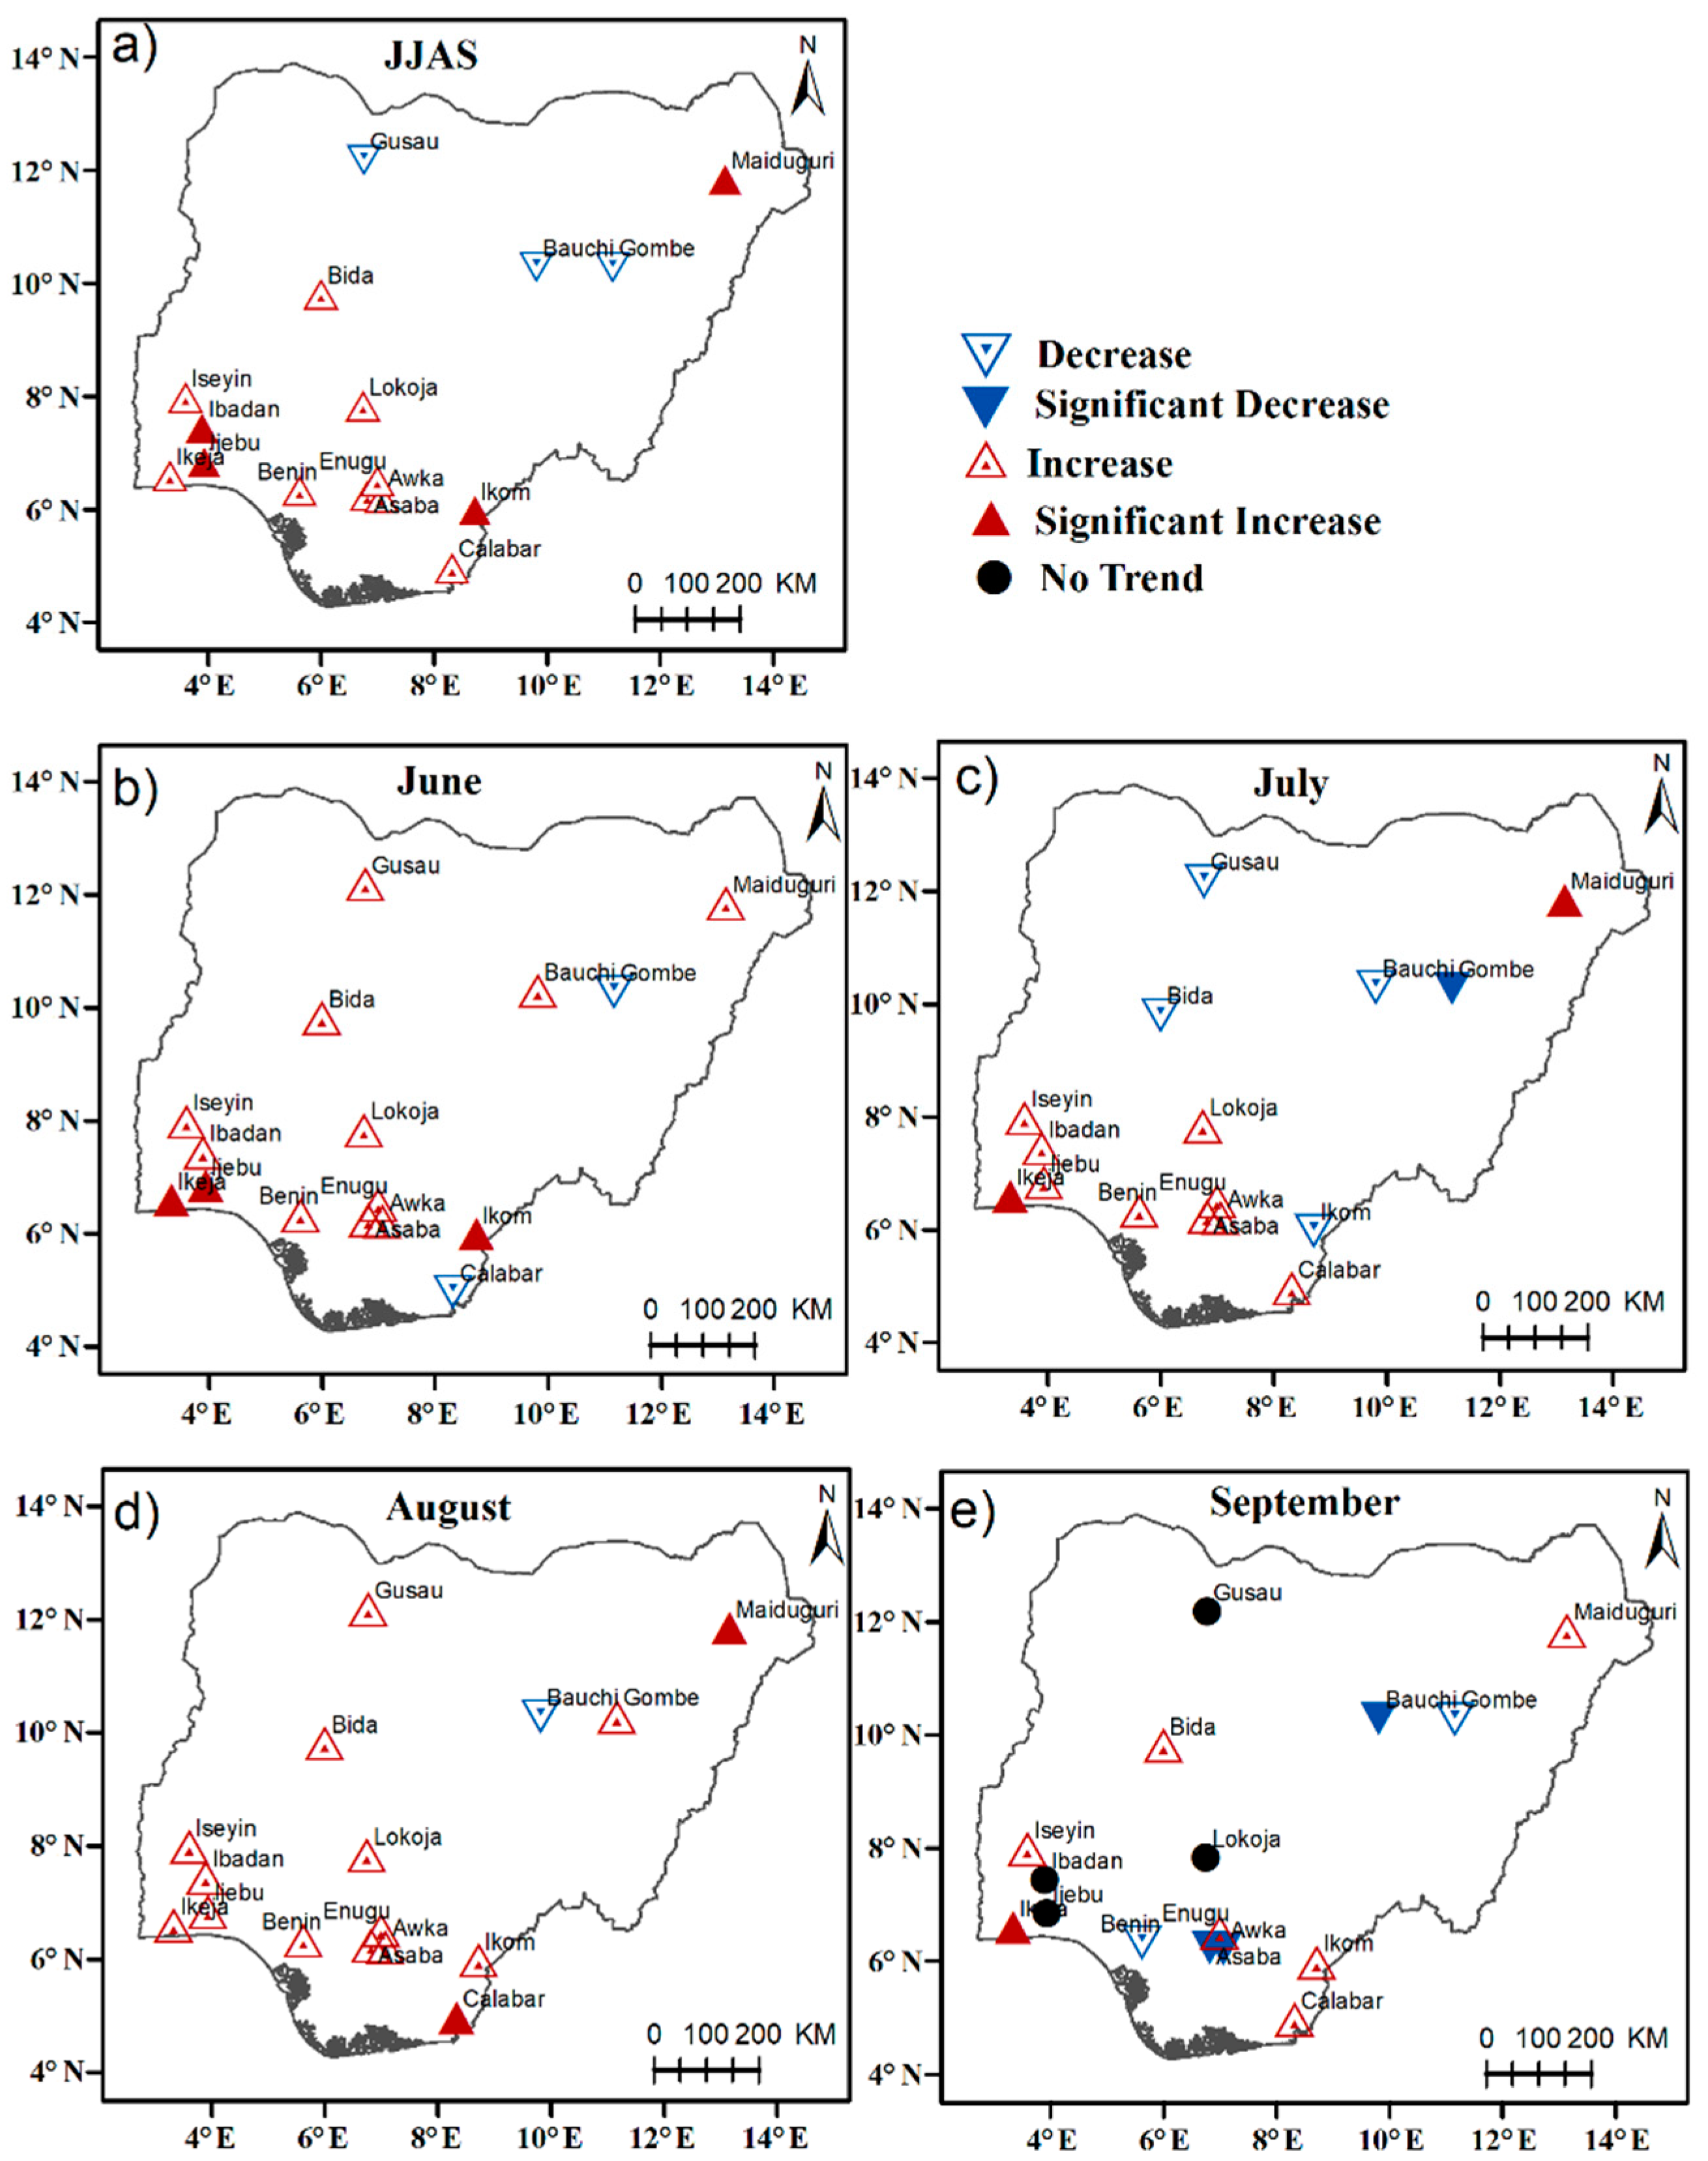
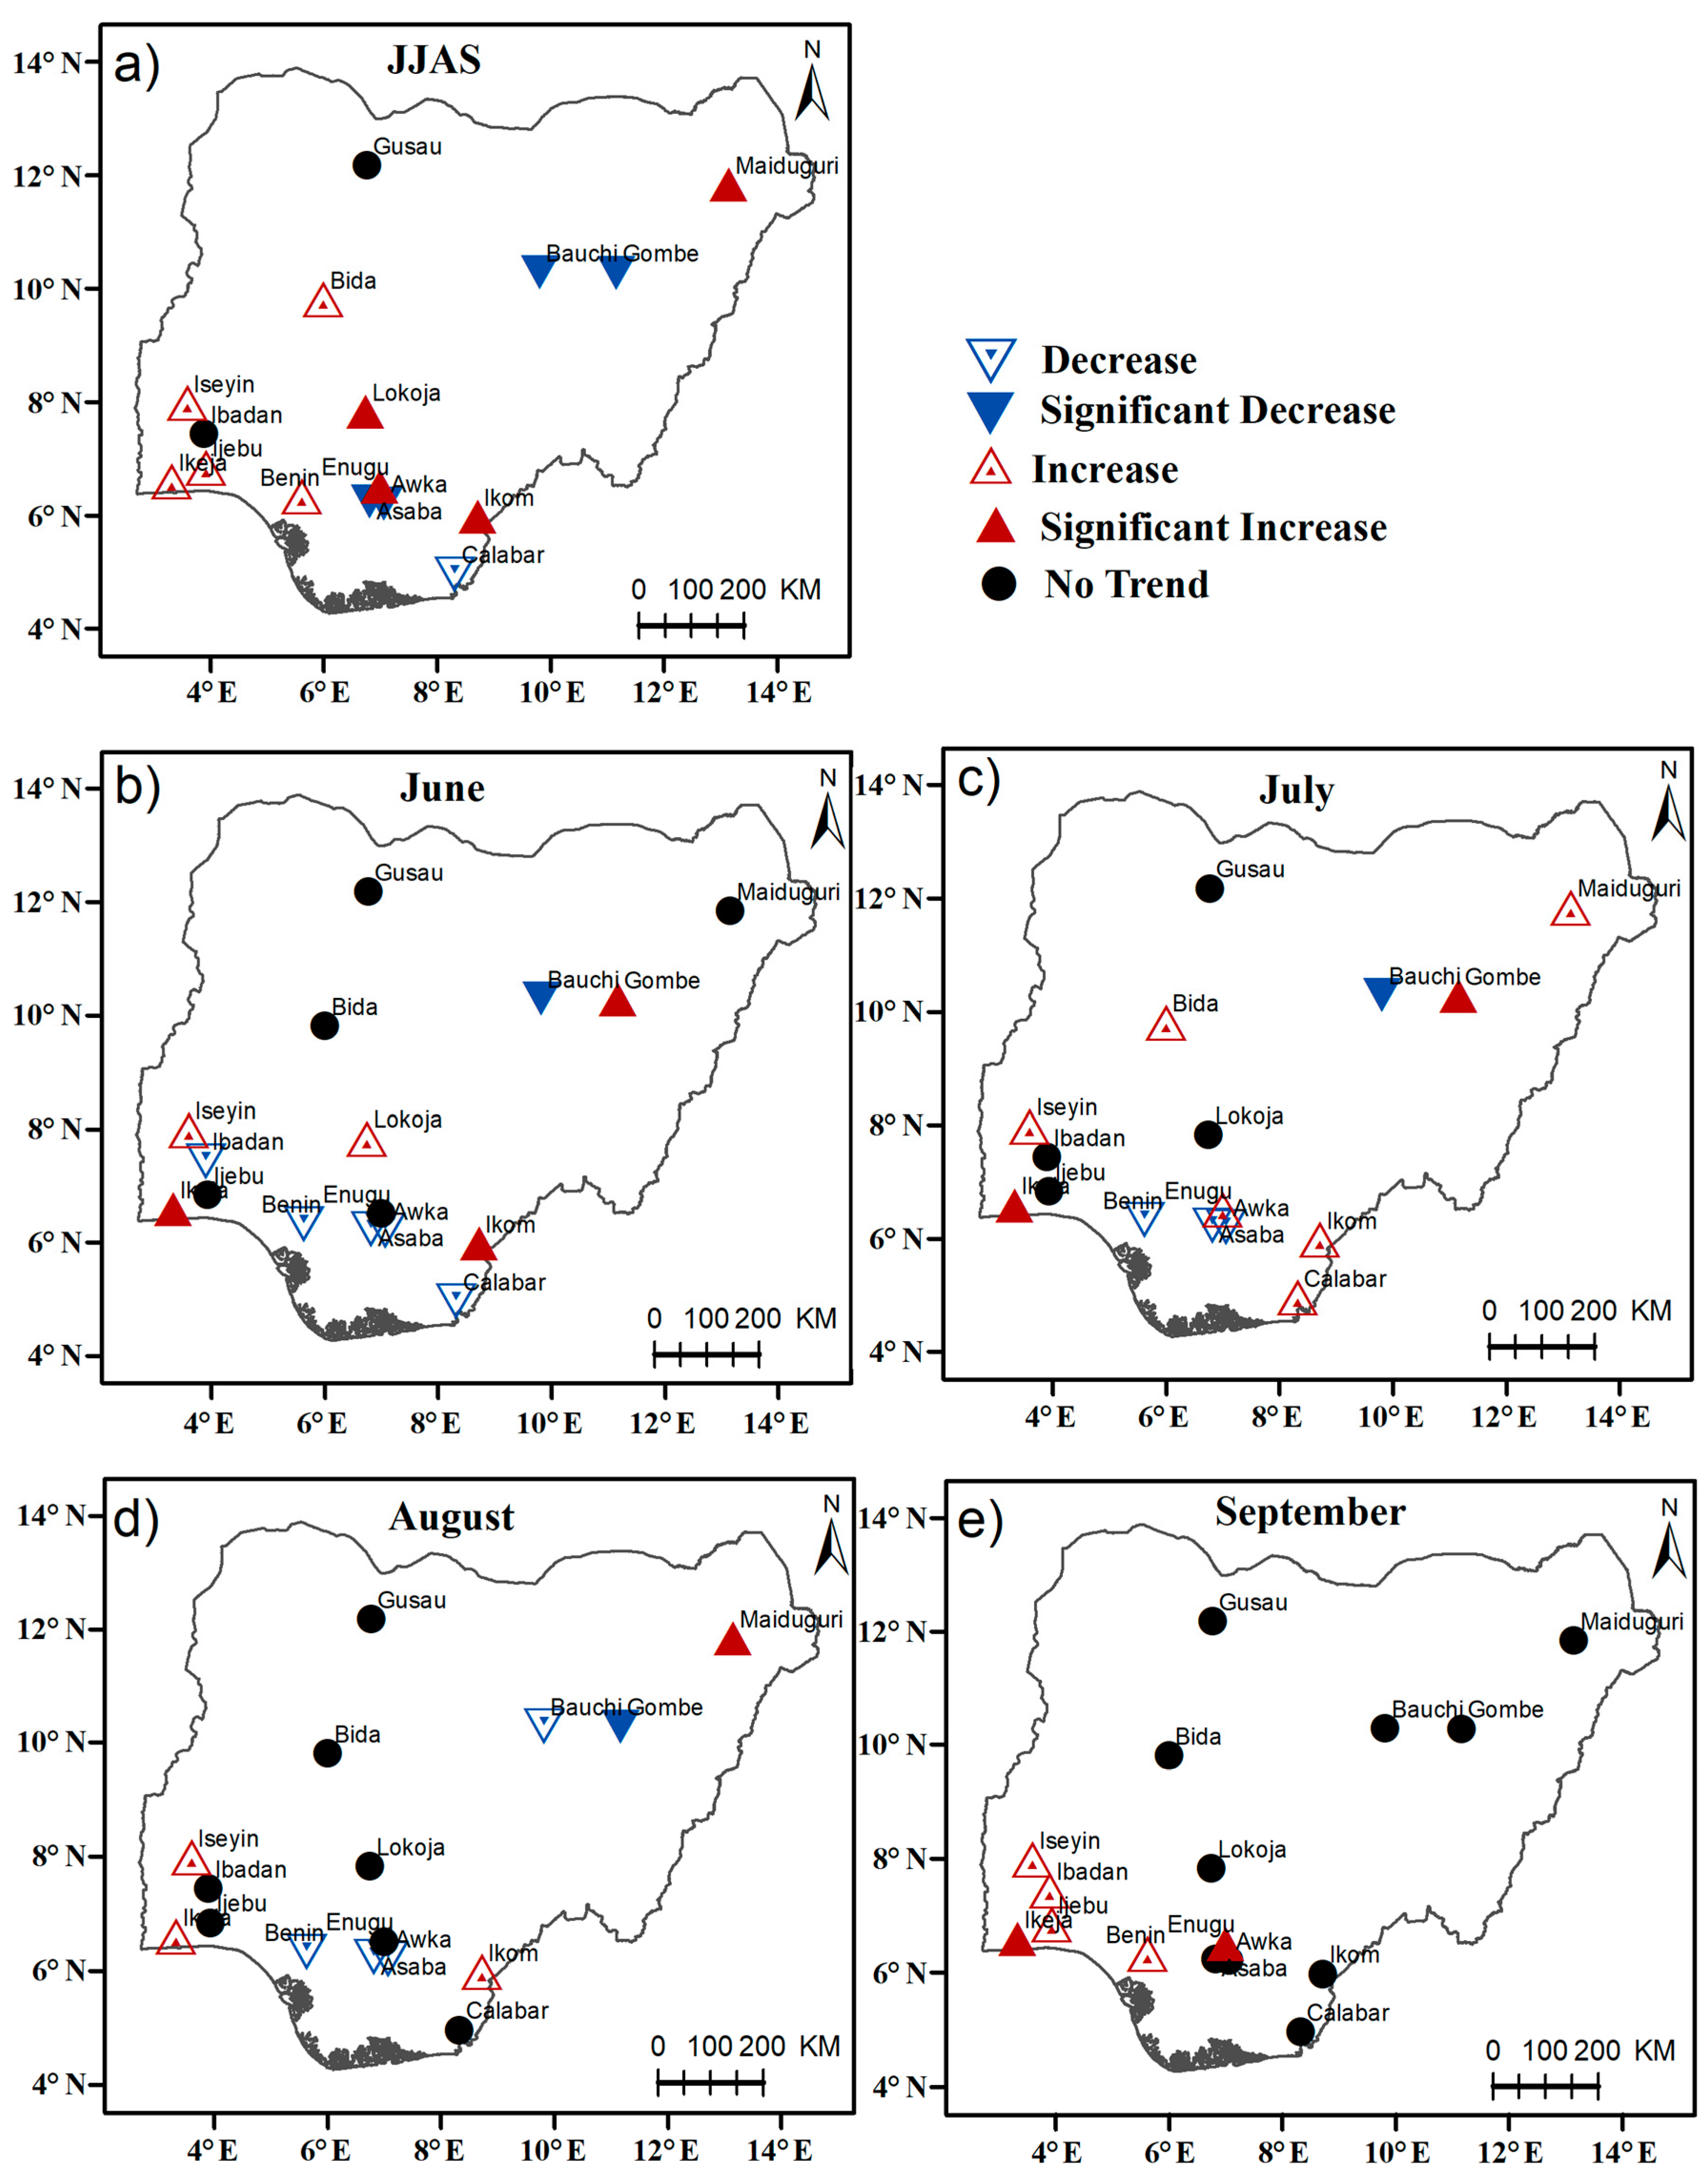
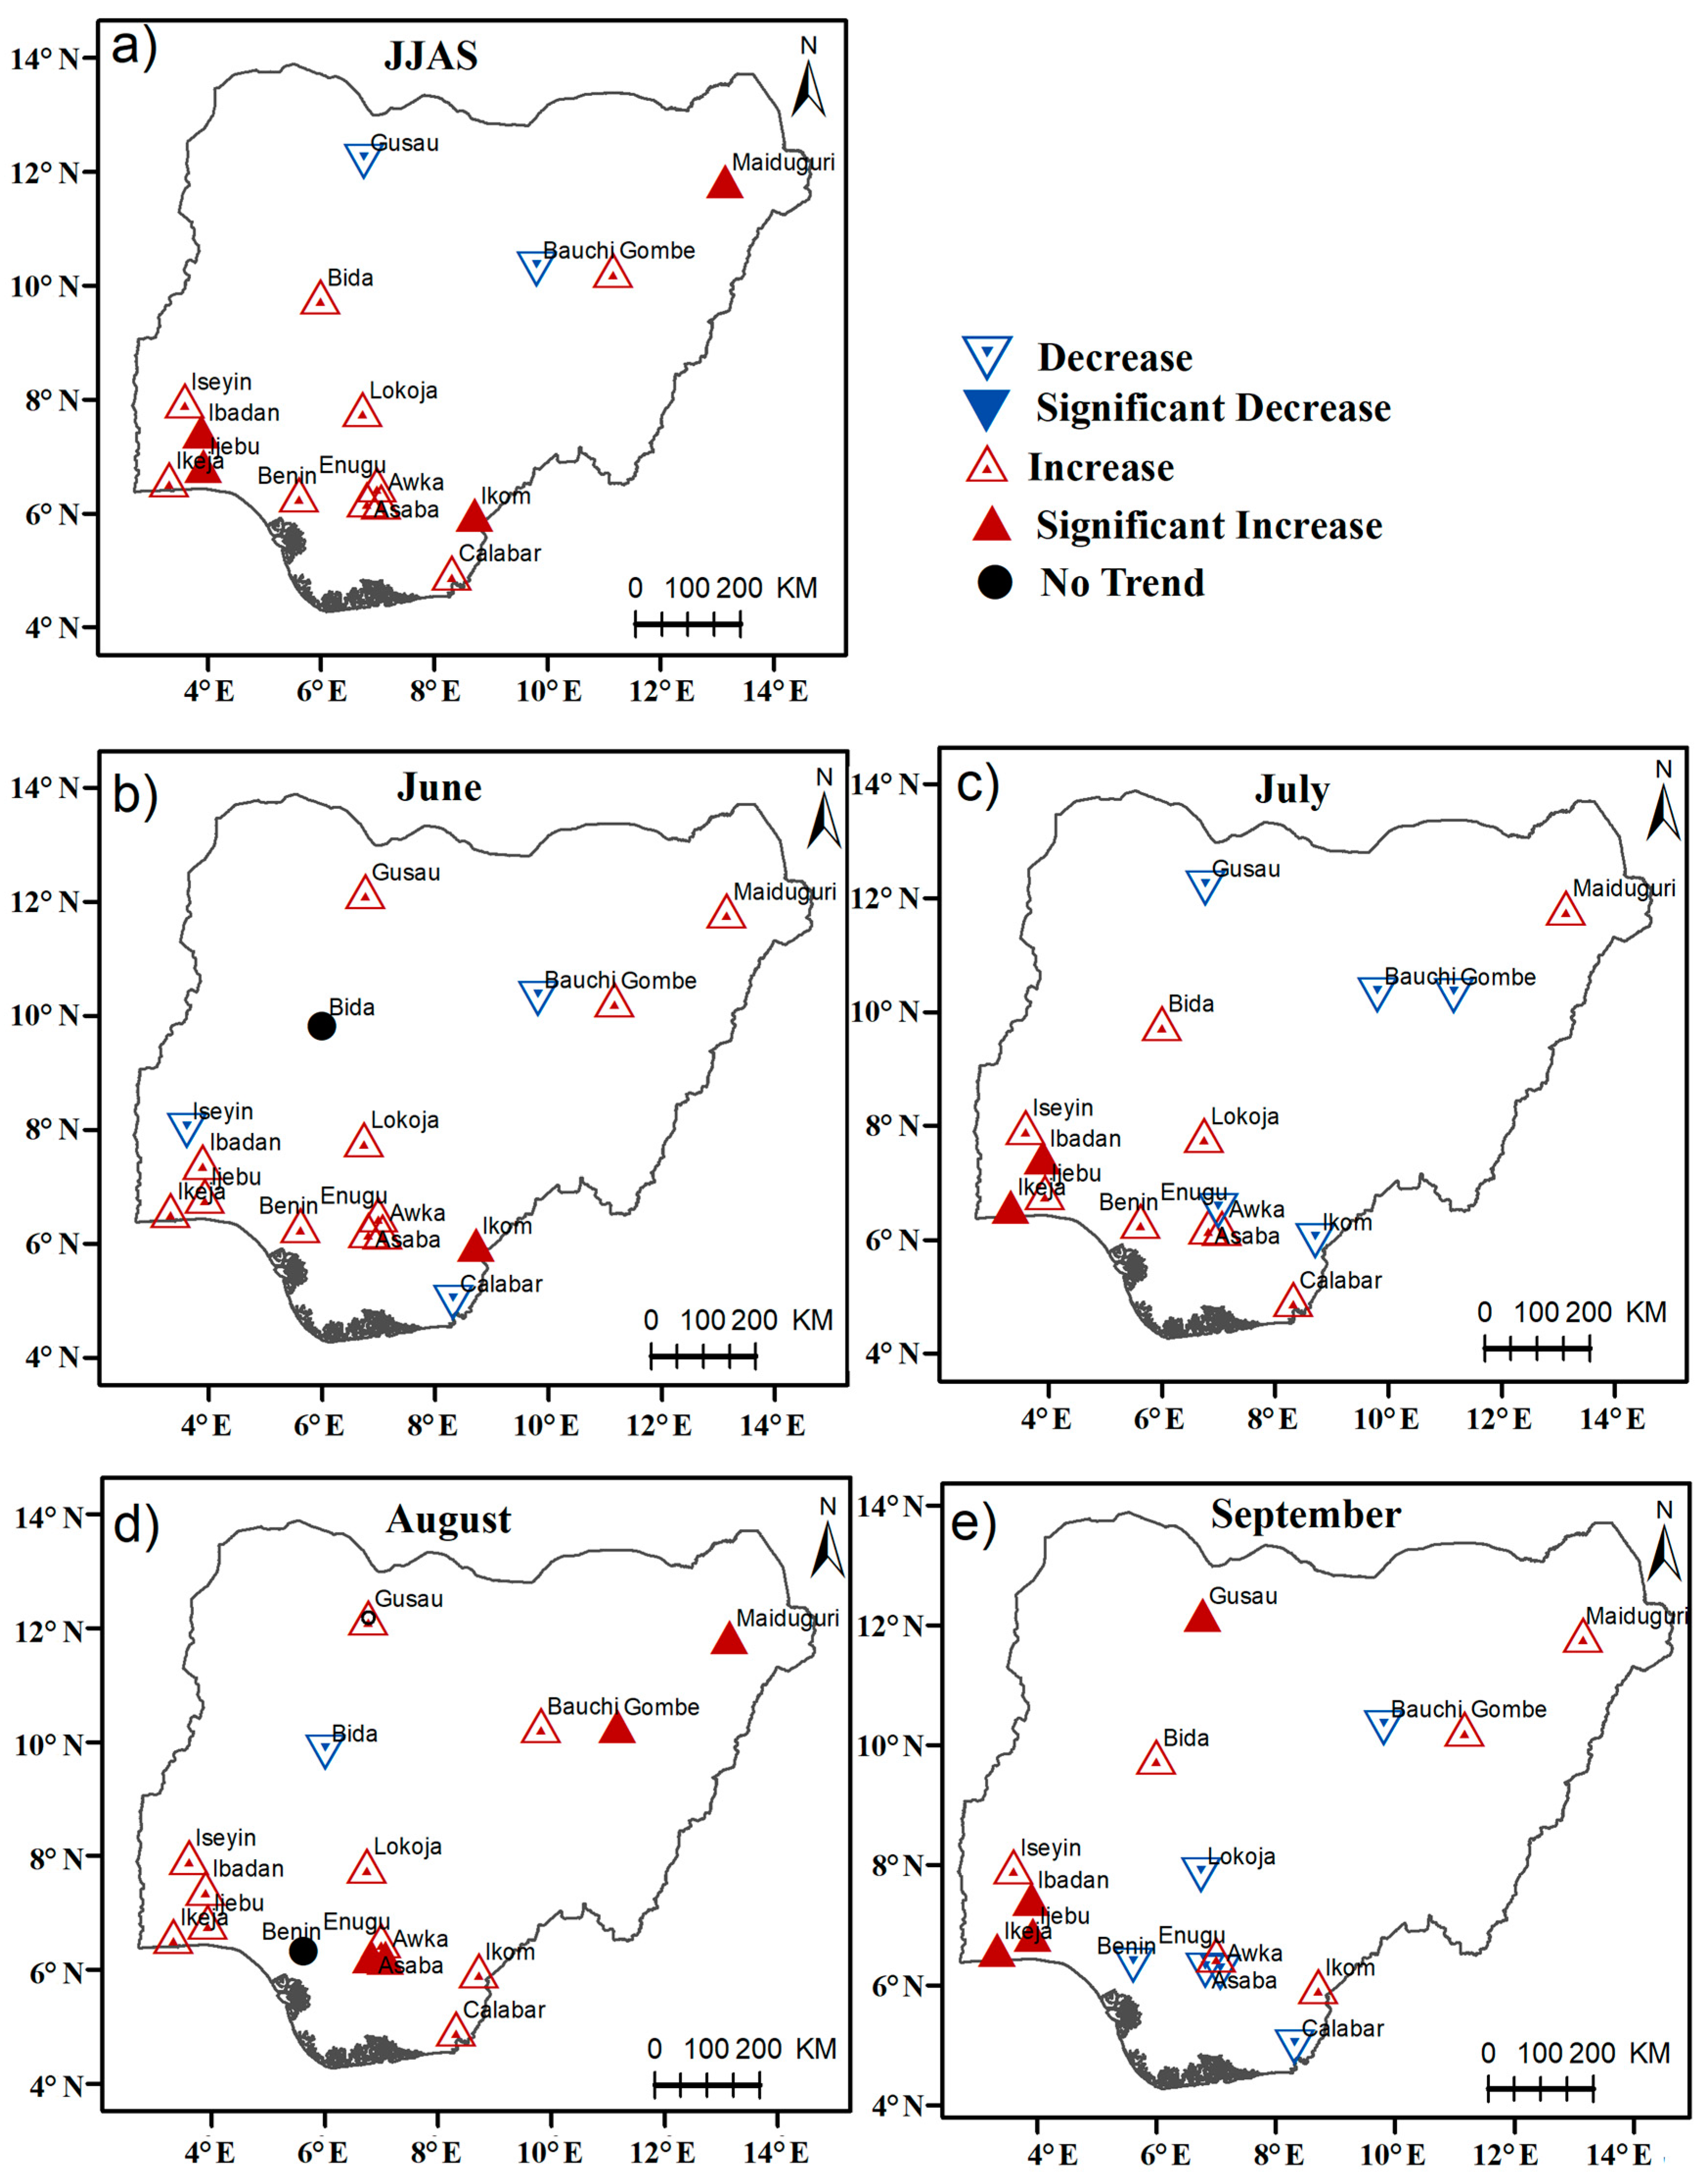
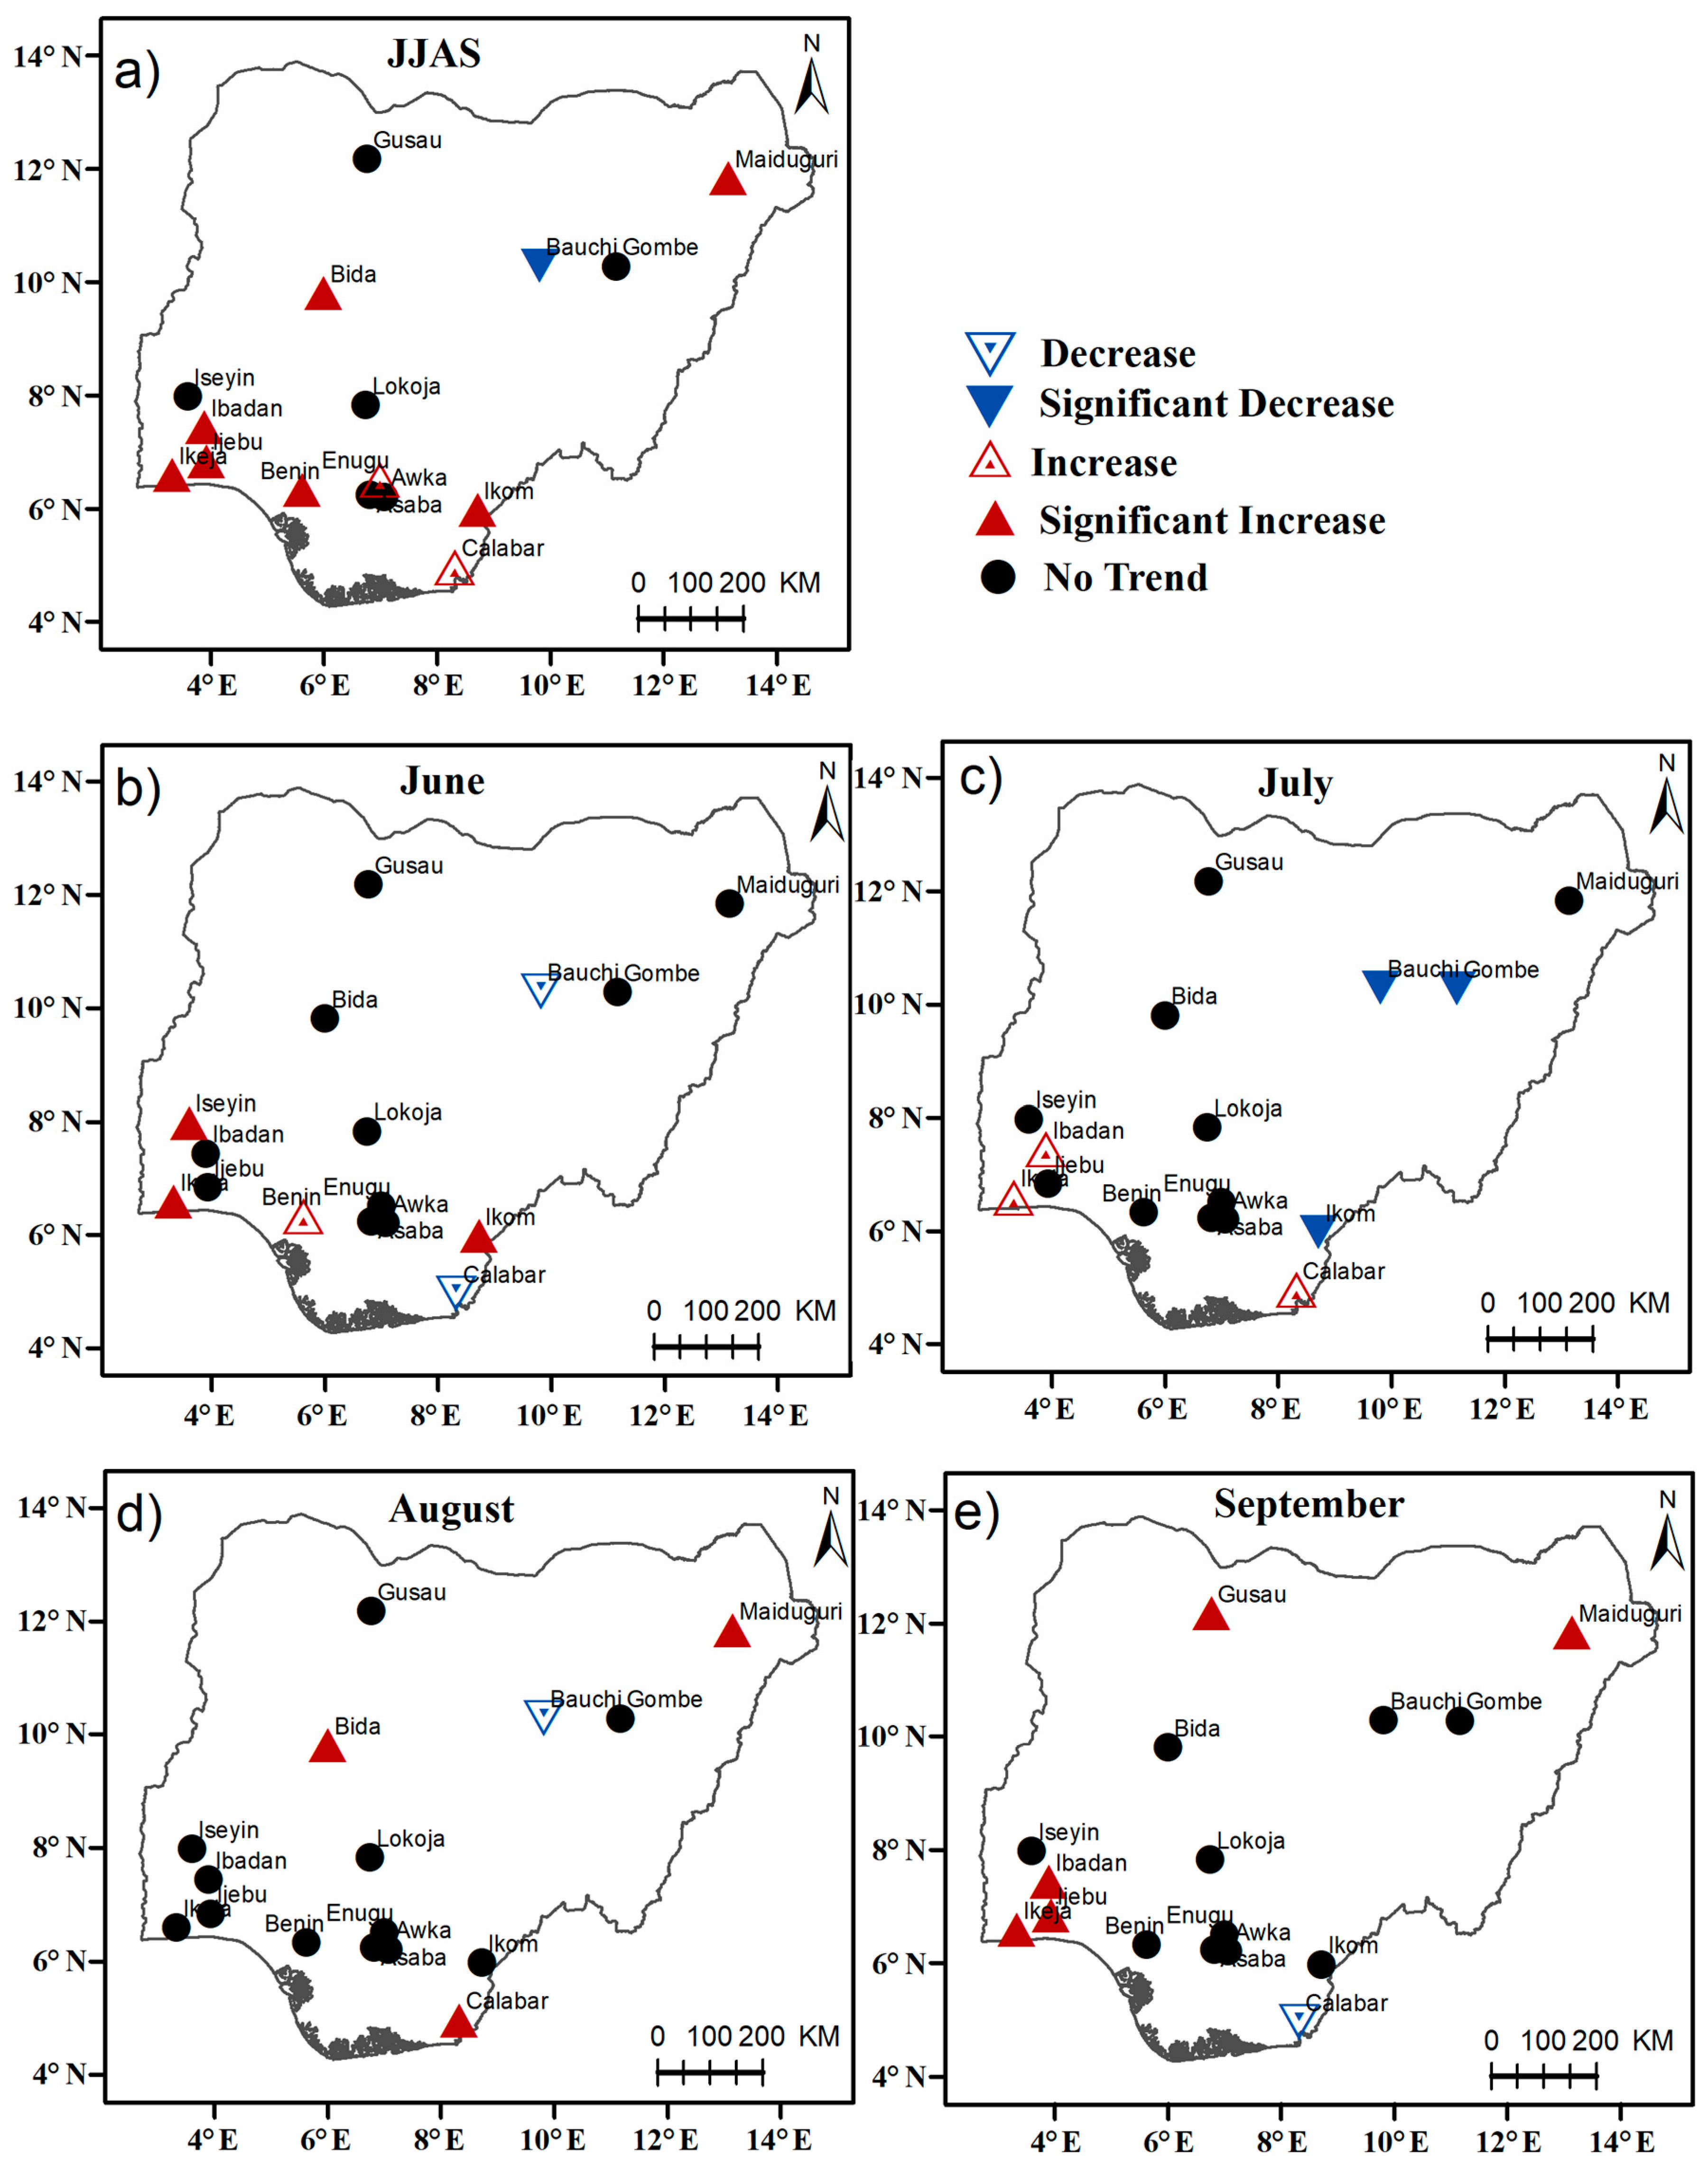
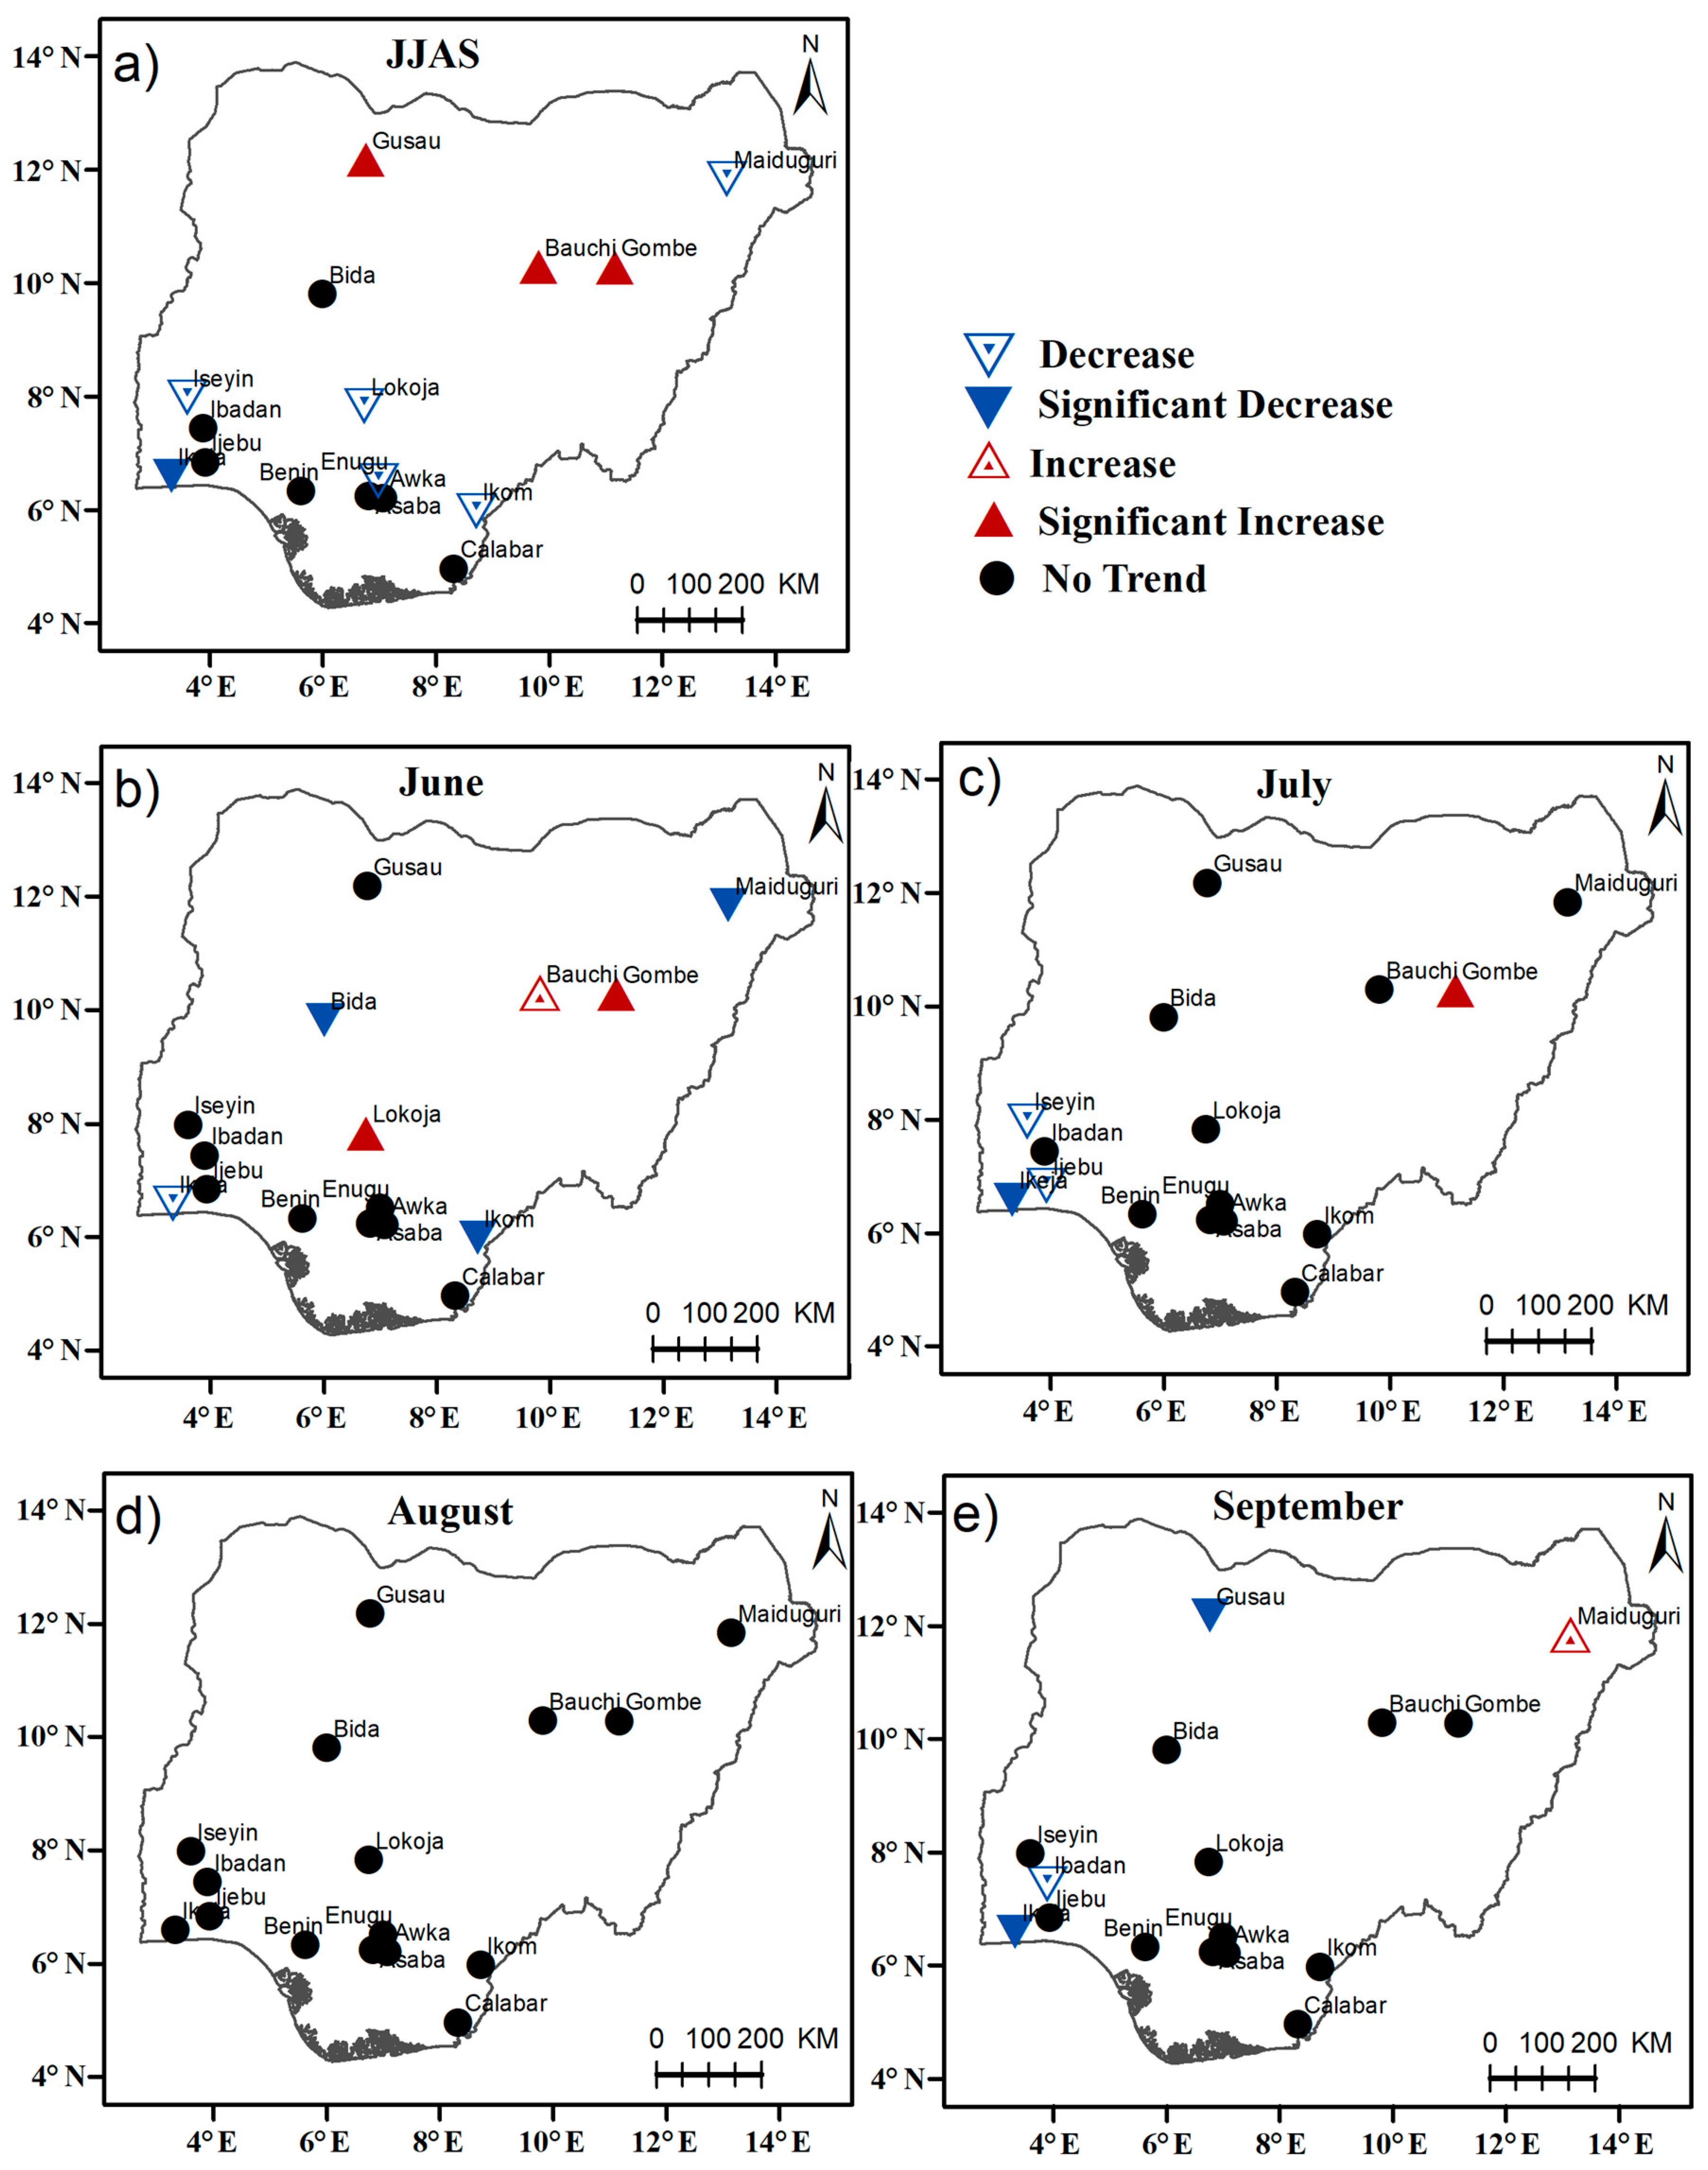
3.2. Spatial Distribution of Trends of Summer Rainfall Extremes over Nigeria

In this section, we investigate the trends in summer rainfall extremes across Nigeria. The rate of change of the summer trends are estimated using the Theil–Sen slope and tested for statistical significance based on the Mann–Kendall rank test. Slopes with integers +1, 0, −1 are assigned to positive change, no change, and negative change respectively.
Figure 4 shows trends of summer total wet-day rainfall amounts (PRCPTOT) across the stations in Nigeria. It suggests that PRCPTOT has increased significantly in a large part of the country during the 1975–2013 period. As shown in Figure 4a, obvious positive trends are seen over the Guinea Coast region as well as in Maiduguri, in contrast, a non-significant decreasing trend is observed at Bauchi, Gusau, and Gombe stations. Notably, during the JJAS season, PRCPTOT increased significantly in Ikom, Ibadan, Ijebu-ode, Ikeja, and Maiduguri at the rate of 12 mm/decade, 18 mm/decade, 21 mm/decade, and 20 mm/decade, respectively, which is similar to the results reported in Gbode et al. [3] for the annual total wet-day rainfall amount. The trends in PRCPTOT for individual months within the boreal summer are shown in Figure 4b–e. Figure 4b reveals that PRCPTOT increased in almost all the stations except Calabar and Gombe, where there are non-significant decreasing trend. While in July, most of the stations in the Guinea Coast region recorded an increasing trend except in Ikom, where PRCPTOT decreased by (9.2 mm/decade). More so, PRCPTOT decreased in July, in most of the Sahel stations considered in this study.
Nonetheless, PRCPTOT increased with varying magnitudes in the stations in August as shown in Figure 4d. This is expected for the Sahel region, as Sanogo et al. [11] suggest a substantial recovery of rainfall and the associated extreme events in August. The increasing trends over the Guinea Coast are consistent with the reported breaking of the “August break” over the region [48]. In September, most of the stations show decreasing trends or no noticeable trend. However, few stations like Ikeja, Calabar, Ikom, Enugu, Iseyin, Bida, and Maiduguri show positive trends. Generally, it is illustrated that the increasing total wet-day rainfall amount recorded during the JJAS summer season is mostly contributed by the occurrence of the rainfall extremes in June, July, and August.
Figure 5 presents the trends in the frequency of wet-days (RR1) for JJAS and the individual months. Notably, Figure 5a shows that RR1 exhibited positive trends over the southwestern part of Nigeria, which indicates that during the JJAS summer season, the frequency of wet-days increased in the area. While it decreased significantly in Gombe and Bauchi at −1.0 days/decade and −0.58 days/decade respectively. In June, the RR1 trends are not homogenous in the stations as shown in Figure 5b. There is no notable trend in Gusau, Maiduguri, Bida, Ijebu-ode and Enugu, while RR1 increased in Gombe, Ikeja, Iseyin, and Ikom stations. The situation is not far-fetched in July as the distribution of the trends follows a similar pattern. However, RR1 increased in Maiduguri, Bida, and Calabar (Figure 5c). In August, most of the stations show no trend while it decreased in Gombe, Bauchi, Benin, Awka, and Asaba. The positive trends seen over Ikeja, Iseyin, and Ikom are not statistically significant (See Table 2 for more details). Furthermore, the frequency of wet-days shows no trend in most of the stations in September while it increased in few stations over the southwestern extremity in September. Generally, decreasing trends were observed in Asaba, Awka, Benin, and Calabar, but no trend can be found in Ibadan during the (JJAS) summer season. These trends suggest that rainfall extremes become less frequent recently in these stations. However, the increase in wet-day frequency observed in other stations suggests a more frequent extreme rainfall over the Guinea Coast region.
We show in Figure 6a that the maximum consecutive 5-day rainfall increased in most stations across the country with a notable increase in Iseyin, Ibadan, Ikom, and Maiduguri. The increasing trends are more prevalent in the southwestern and northeastern parts of Nigeria. This perhaps explains the recurrent flash floods in these areas. The increasing trend is also noticeable during the individual months within the summer season, as Figure 6b–e illustrates that a large proportion of the stations recorded increasing RX5day extremes. However, there are indications that the increasing RX5day trends are more pronounced in August over the Nigerian Sahel. This further suggests that flood events are mostly observed in August over the Nigerian Sahel region while there are flood tendencies in all the summer months over other regions.
Besides, it is clear in Figure 7a that during the summer season, the number of heavy rainfall days increased significantly in most of the southwestern stations, such as Ikeja, Ibadan, Ijebu-ode, and Benin. The increasing number of heavy rainfall days in summer in these stations are mainly contributed by the observed increasing trend in June, July, and September (see, Figure 7b–e). In August, these aforementioned stations show no noticeable trend, while it increased significantly in Maiduguri, Bida, and Calabar.
Nonetheless, we observed a remarkable increase in wet-day intensity extremes across Nigeria, especially in Ibadan, Ijebu-ode, Benin, Awka, Asaba, Gombe, Bauchi, and Maiduguri, while in Ikeja, and Ikom the trends are weak (Figure 8a). Across the individual months, it is observed that intense rainfall is generally stronger in August, June, and July, respectively (Figure 8b–e). Finally, we present in Figure 9 the inherent trends in consecutive dry days (CDD). Figure 9a shows that CDD increased significantly in Gusau, Bauchi, and Gombe while it increased slightly in Benin. Other stations show decreasing or no weak trends, consistent with the findings in Gbode et al. [3] for annual CDD. Figure 9b–e further suggests that most of the stations have a weak CDD trend, especially in August. Thus, the decreasing trends, especially over the Guinea Coast, demonstrates that wet-days were dominant in the region during the (1975–2013) period.

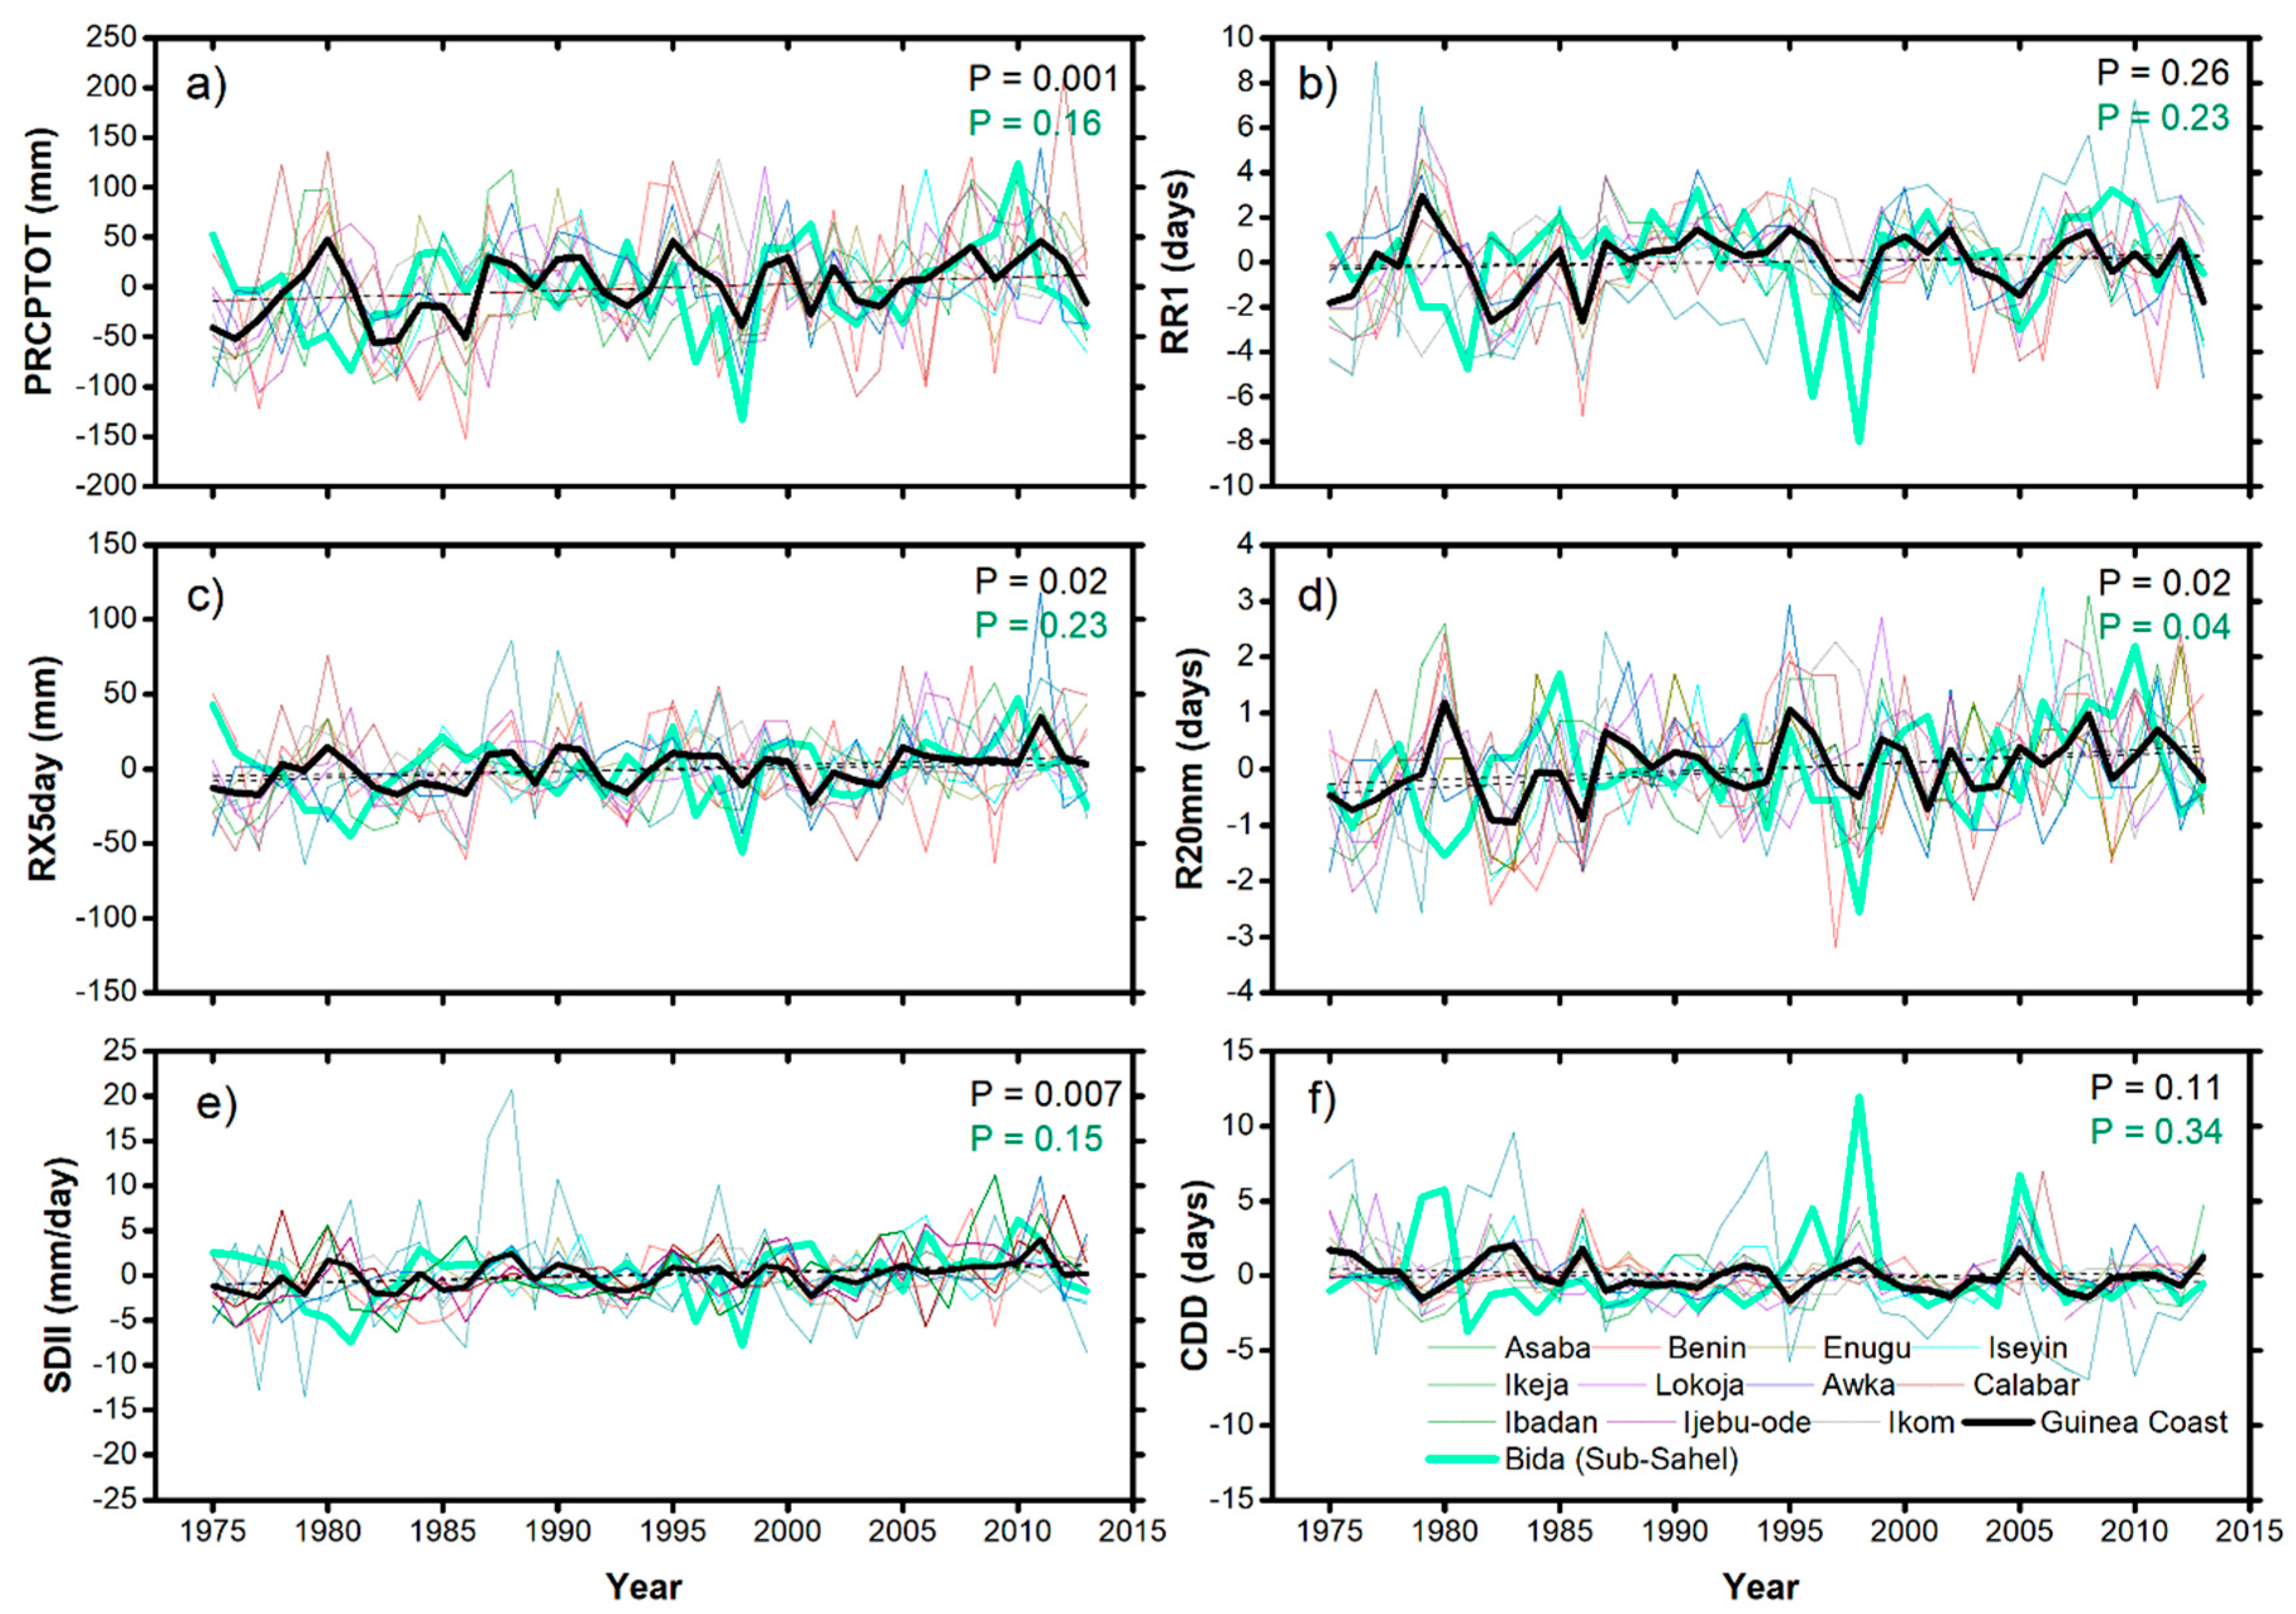
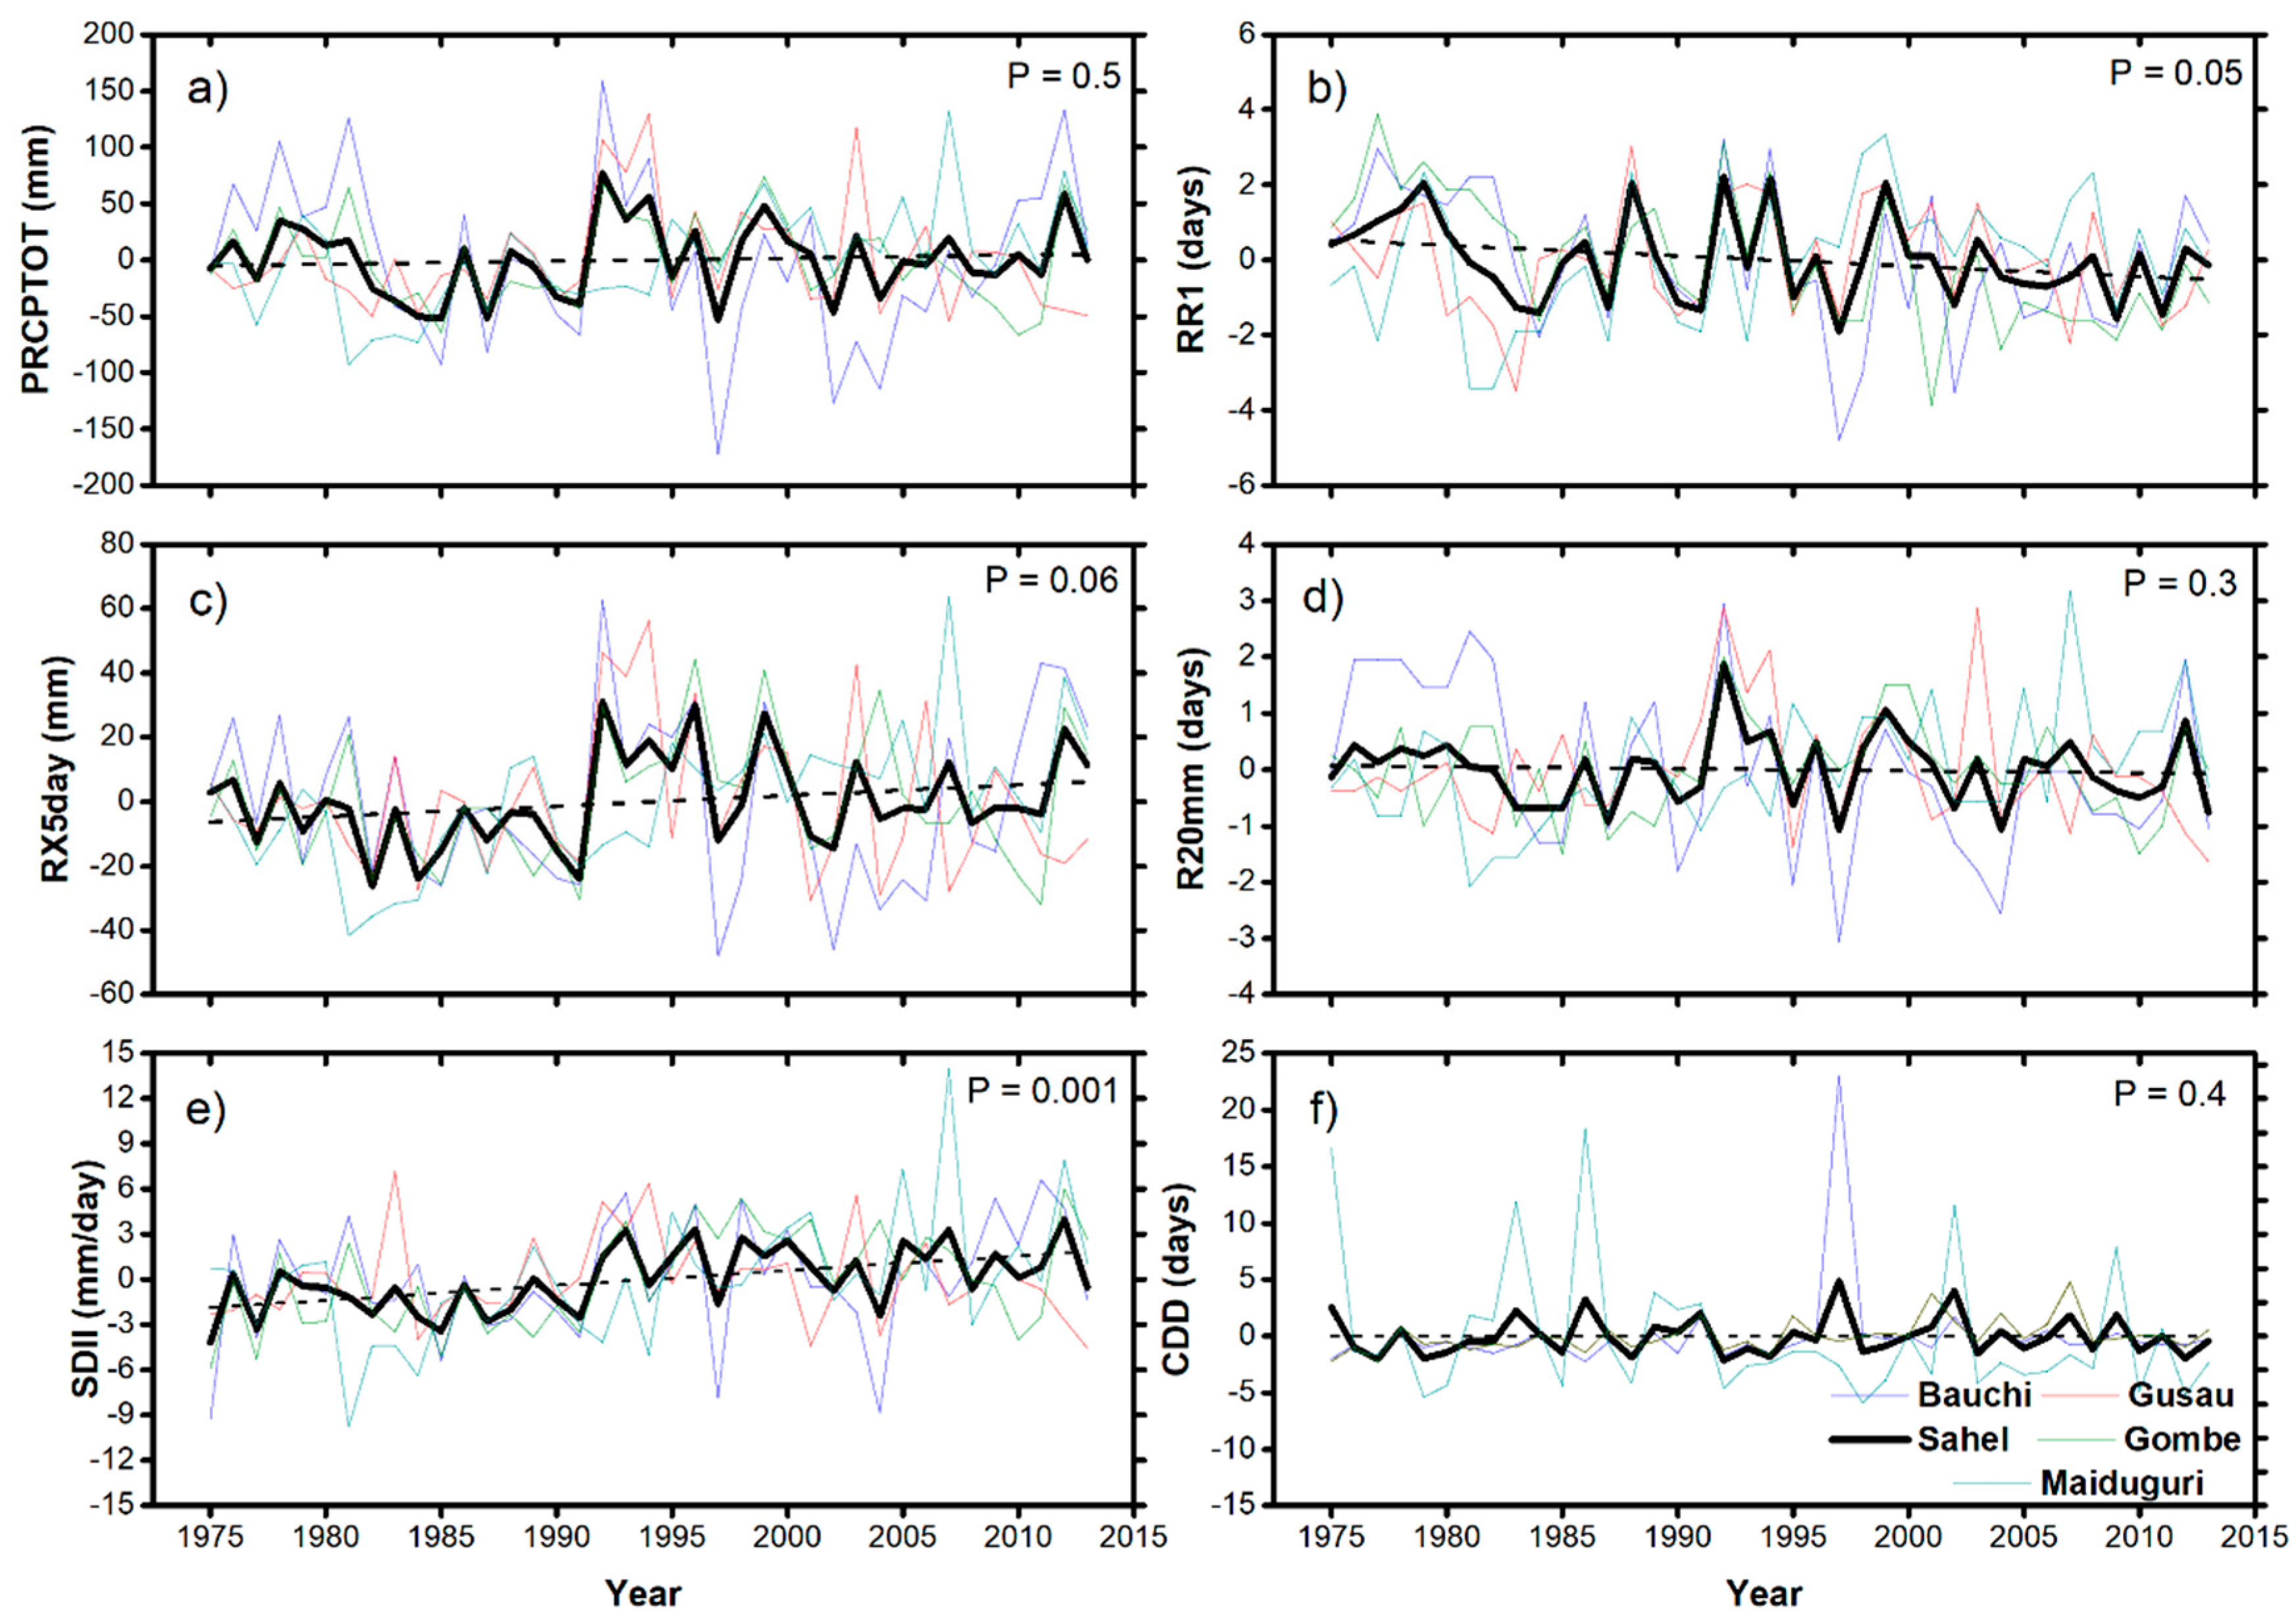
3.3. Variation of Summer Rainfall Extremes over Nigeria

To examine the temporal changes in summer rainfall extremes in Nigeria, we repeated the trend analysis for the JJAS time-series to highlight the variations in trends in different regions of Nigeria. Figure 10a reveals that PRCPTOT increased significantly by 11.61 mm/decade over the Guinea Coast region. Although, the magnitude of the trends varies at different stations as earlier discussed in the previous section and listed in Table 2 and Table 3. It is obvious that after the dry conditions that prevailed in the 1970s/early 1980s the PRCPTOT has increased progressively in the region, consistent with the results found between 5° N and 10° N [11,54]. In addition, Figure 10b suggests an increasing trend of 0.11 days/decade, implying frequent rainy days over the region. Furthermore, maximum consecutive 5-day rainfall increased significantly over the region by 3.64 mm/decade. This perhaps explains the inundations of the unprecedented magnitude seen over the region in the recent past, especially the 2012 flood events [14]. It is also clear in Figure 10d that heavy rainfall days increased significantly at the rate of 0.15 days/decade, which suggests that the region has gradually slid into the frequent occurrence of heavy rainfall events. Figure 10e shows the intensification of rainfall extremes over the region. Although there are indications that CDD decreased marginally, the foregoing demonstrates a more frequent and intense rainfall extremes over the Guinea Coast region. Indeed, it can be inferred that more frequent and more intense rainfall is prevalent over the Nigeria Guinea Coast region, contrary to the finding of Bichet and Diedhiou, [22] using gridded data. In Bida, the Sub-Sahel station, all the aspects of rainfall extremes considered in this study showed an increasing trend, apart from CDD with no obvious trends (see Figure 10a–f). More so, only positive trends in R20mm are statistically significant, which suggests that the count of the days when rainfall is greater than 20 mm/day is exceptionally on the increase, as such the dominance of heavy rainfall events in the region.
Over the Nigerian Sahel region, Figure 11a indicates that there is a marginal increase in PRCPTOT in the region. The dry conditions during the 1980s are evident after which the rainfall amount increased progressively in the region. There are also indications of dry conditions in the region as CDD increased slightly over the region which may affect the agrarian activities [3]. However, Figure 11b shows decreasing rainy days, which strengthens the point that less frequent rainy days were prevalent over Nigerian Sahel, especially between 2000 and 2013. Nonetheless, RX5day increased over the region by 2 mm/decade while the number of heavy rainfall days decreased slightly by −0.03 days/decade. Interestingly, Figure 11c further shows that RX5day was below normal in the 1980s, and increased above normal in the 1990s corresponding to the wet and dry decades as reported by [36] for the Sahel region. However, Figure 11e suggests the intensification of wet-day rainfall as SDII increased significantly at 0.96 mm/day/decade, consistent with the findings for other semi-arid regions [55]. The increasing trends are expected as previous studies like [26,29] have described similar features for other Sahel regions. Indeed, it is can be inferred that extreme rainfall events became more intense and less frequent from the 1990s as Figure 11b and e suggest, consistent with the reports of Bichet and Diedhiou [22] for some parts of West Africa. However, Bichet and Diedhiou [22] suggest that lack of trend in mean rainfall hides towards less frequent but more intense rainfall over the Gulf of Guinea for the April–May–June season. In agreement with this finding, our results suggest that trend in wet-day total rainfall amount is perhaps hidden in the less frequent but more intense rainfall over the Nigerian Sahel. This implies a slight recovery in rainfall amount after a persistent drought which ravaged the Nigerian Sahel region in the 1980s [11,51,52,53] and this is mostly a result of intensified rainfall, which could be related to the Trans-Atlantic-Pacific Ocean Dipole as described in Lin and Dike [56]. The study suggests that during the positive phase of the dipole, there are significant westerly anomalies over the tropical Atlantic Ocean, which drives anomalous water vapor convergence over West Africa, leading to enhanced precipitation in the region. As the prevalent flood events over the regions are associated with large-scale features that may be connected with the warming of the tropical Atlantic [9,57]. Besides, Li et al. [58] further indicated that the intensification of warm sea surface temperature over the Atlantic since the late 1990s is resultant to the significant increase in rainfall in the tropical region.
However, limitations should be noticed due to the sparseness of the rainfall data in some parts of Nigeria. This will perhaps lead to relative uncertainty in the results for the regions. Satellite rainfall data could be used for these regions after validation with available station data. Notably, this study mostly focused on the analysis of rainfall extremes based on the available station datasets, but the possible reasons for the observed extreme rainfall trends are yet to be quantified. Future studies could focus on a process-based analysis using the Coupled Model Intercomparison Project version 6 simulations to quantify the causal mechanism.

4. Conclusions

We have examined the variation of extreme rainfall for sixteen stations in Nigeria covering the 1975–2013 period. The annual cycle of the rainfall extremes exhibits a bimodal pattern that predominates the Guinea Coast and the Sub-Sahel regions. In these regions, the rainfall extremes are characterized by two peaks with the two peaks occurring during June–July and September. On the other hand, a unimodal pattern is found over the Nigerian Sahel with maximum wet-day rainfall amount in August. Generally, a large proportion of extremes occurred during the summer season. Indeed, some aspects of rainfall extreme have consistently increased in all the three climatic regions of Nigeria with varying degree of trends within the summer months. However, regionally averaged rainfall extremes show that the total wet-day rainfall amount, maximum consecutive 5-day rainfall, has increased significantly over Nigeria during the 39 years study period. The widespread increasing trends in total wet-day rainfall amount and maximum consecutive 5-day rainfall trends suggest spatial coherence of the rainfall extremes, consistent with the finding of [11,29]. Over the same period, we found that wet-day intensity increased consistently all over the country. Furthermore, as the wet-day intensity increased significantly over the Nigerian Sahel regions, the wet-day frequency decreased, amounting to less frequent rainy days. This is an indication that the increasing total wet-day rainfall amount is largely driven by increasing rainfall intensity than the frequency of rainfall events in the region. On the other hand, we observed that trend in the frequency of the wet-days (RR1) increase slightly over the Guinea Coast and the Sub-Sahel regions. The significant increase in wet-day intensity over the Guinea Coast and its environs is an indication that the increase in total rainfall amount is due to the intensity and frequency of rainfall in the region. Therefore, we infer that the intensification of rainfall extremes over the country is possibly the major cause of the recurrent flood events in Nigeria and the reports of irrigation dams exceeding their water carrying capacity in the Nigerian Sahel region.
In addition, the spatial coherence of the rainfall extreme may be associated with the large-scale atmospheric phenomenon identified in Lin and Dike [56]. Consequently, the implications of the observed increasing rainfall extremes are the risk of recurrent flood in Nigeria. As a large proportion of flood events are linked to extreme rainfall events [59], as such this study may give guidance to relevant stakeholders in their effort to design coping strategies to mitigate the impact of the recurrent flood events in Nigeria.

Author Contributions

Conceptualization, Z.-H.L. and V.N.D.; methodology, V.N.D.; formal analysis, V.N.D. and Z.-H.L.; resources, Z.-H.L.; data curation, C.C.I.; writing—original draft preparation, V.N.D. and C.C.I.; writing—review and editing, Z.-H.L.; funding acquisition, Z.-H.L and V.N.D. All authors have read and agreed to the published version of the manuscript.

Funding

This research was jointly supported by the Strategic Priority Research Program of the Chinese Academy of Sciences (Grant No. XDA19030403), National Natural Science Foundation of China (Grant No. 41661144032), and CAS “The Belt and Road Initiatives” Program on International Cooperation (Grant No. 134111KYSB20160010).

Acknowledgments

Dike Victor Nnamdi acknowledges the support of the CAS-TWAS President Fellowship for postdoctoral research.

Conflicts of Interest

The authors declare no conflict of interest.

References

  1. IPCC. Summary for Policymakers. In Climate Change 2013: The Physical Science Basis; Stocker, T.F., Qin, D., Plattner, G.-K., Tignor, M., Allen, S.K., Boschung, J., Nauels, A., Xia, Y., Bex, V., Midgley, P.M., Eds.; Cambridge University Press: Cambridge, UK; New York, NY, USA, 2013; pp. 1–1585. [Google Scholar]
  2. Abatan, A.A.; Abiodun, B.J.; Gutowski, W.J.; Rasaq-Balogun, S.O. Trends and variability in absolute indices of temperature extremes over Nigeria: Linkage with NAO. Int. J. Clim. 2017, 38, 593–612. [Google Scholar] [CrossRef]
  3. Gbode, I.E.; Oluwafemi, A.; Menang, K.P.; Intsiful, J.D.K.; Ajayi, V.O.; Omotosho, J.A.; Akinsanola, A.A. Observed changes in climate extremes in Nigeria. Meteorol. Appl. 2019, 26, 642–654. [Google Scholar] [CrossRef] [Green Version]
  4. Abatan, A.A.; Abiodun, B.J.; Lawal, K.A.; Gutowski, W.J. Trends in extreme temperature over Nigeria from percentile-based threshold indices. Int. J. Clim. 2015, 36, 2527–2540. [Google Scholar] [CrossRef]
  5. Skliris, N.; Zika, J.; Nurser, G.; Josey, S.A.; Marsh, R. Global water cycle amplifying at less than the Clausius-Clapeyron rate. Sci. Rep. 2016, 6, 3875. [Google Scholar] [CrossRef] [Green Version]
  6. Lenderink, G.; Barbero, R.; Loriaux, J.M.; Fowler, H. Super-Clausius–Clapeyron Scaling of Extreme Hourly Convective Precipitation and Its Relation to Large-Scale Atmospheric Conditions. J. Clim. 2017, 30, 6037–6052. [Google Scholar] [CrossRef]
  7. Trenberth, K.E.; Dai, A.; Rasmussen, R.M.; Parsons, D.B. The Changing Character of Precipitation. Bull. Am. Meteorol. Soc. 2003, 84, 1205–1218. [Google Scholar] [CrossRef]
  8. Liu, R.; Liu, S.C.; Shui, C.-J.; Li, J.; Zhang, Y. Trends of Regional Precipitation and Their Control Mechanisms During 1979–2013. Adv. Atmos. Sci. 2016, 33, 164–174. [Google Scholar] [CrossRef]
  9. Paeth, H.; Fink, A.H.; Pohle, S.; Keis, F.; Mächel, H.; Samimi, C. Meteorological characteristics and potential causes of the 2007 flood in sub-Saharan Africa. Int. J. Clim. 2010, 31, 1908–1926. [Google Scholar] [CrossRef]
  10. Aguilar, E.; Peterson, T.C.; Obando, P.R.; Frutos, R.; Retana, J.A.; Solera, M.; Soley, J.; García, I.G.; Araujo, R.M.; Santos, A.R.; et al. Changes in precipitation and temperature extremes in Central America and northern South America, 1961–2003. J. Geophys. Res. Space Phys. 2005, 110, 3233–3250. [Google Scholar] [CrossRef]
  11. Sanogo, S.; Fink, A.H.; Omotosho, J.A.; Ba, A.; Redl, R.; Ermert, V. Spatio-temporal characteristics of the recent rainfall recovery in West Africa. Int. J. Clim. 2015, 35, 4589–4605. [Google Scholar] [CrossRef]
  12. New, M.; Hewitson, B.; Stephenson, D.; Tsiga, A.; Kruger, A.; Manhique, A.; Gomez, B.; Coelho, C.A.S.; Masisi, D.N.; Kululanga, E.; et al. Evidence of trends in daily climate extremes over southern and west Africa. J. Geophys. Res. Space Phys. 2006, 111. [Google Scholar] [CrossRef]
  13. Adelekan, I.; Asiyanbi, A.P. Flood risk perception in flood-affected communities in Lagos, Nigeria. Nat. Hazards 2015, 80, 445–469. [Google Scholar] [CrossRef]
  14. Adeniyi, M.O. Sensitivity of two dynamical cores in RegCM4.7 to the 2012 intense rainfall events over West Africa with focus on Lau, Nigeria. Int. J. Model. Simul. 2019, 40, 355–365. [Google Scholar] [CrossRef]
  15. Peterson, T.C. Climate Change Indices. WMO Bull. 2005, 54, 83–86. [Google Scholar]
  16. Zhang, X.; Alexander, L.; Hegerl, G.C.; Jones, P.D.; Tank, A.M.K.; Peterson, T.C.; Trewin, B.; Zwiers, F.W. Indices for monitoring changes in extremes based on daily temperature and precipitation data. Wiley Interdiscip. Rev. Clim. Change 2011, 2, 851–870. [Google Scholar] [CrossRef]
  17. Caesar, J.; Alexander, L.; Trewin, B.; Tse-Ring, K.; Sorany, L.; Vuniyayawa, V.; Keosavang, N.; Shimana, A.; Htay, M.M.; Karmacharya, J.; et al. Changes in temperature and precipitation extremes over the Indo-Pacific region from 1971 to 2005. Int. J. Clim. 2011, 31, 791–801. [Google Scholar] [CrossRef]
  18. Braganza, K.; Karoly, D.J.; Arblaster, J.M. Diurnal temperature range as an index of global climate change during the twentieth century. Geophys. Res. Lett. 2004, 31. [Google Scholar] [CrossRef]
  19. Bhatti, A.S.; Wang, G.; Ullah, W.; Ullah, S.; Hagan, D.F.T.; Nooni, I.K.; Lou, D.; Ullah, I. Trend in Extreme Precipitation Indices Based on Long Term In Situ Precipitation Records over Pakistan. Water 2020, 12, 797. [Google Scholar] [CrossRef] [Green Version]
  20. Harrison, L.; Funk, C.; Peterson, P. Identifying changing precipitation extremes in Sub-Saharan Africa with gauge and satellite products. Environ. Res. Lett. 2019, 14, 085007. [Google Scholar] [CrossRef]
  21. Song, X.; Song, S.; Sun, W.; Mu, X.; Wang, S.; Li, J.; Li, Y. Recent changes in extreme precipitation and drought over the Songhua River Basin, China, during 1960–2013. Atmos. Res. 2015, 157, 137–152. [Google Scholar] [CrossRef]
  22. Bichet, A.; Diedhiou, A. Less Frequent and More Intense Rainfall Along the Coast of the Gulf of Guinea in West and Central Africa (1981–2014). Clim. Res. 2018, 76, 191–201. [Google Scholar] [CrossRef] [Green Version]
  23. Akinsanola, A.A.; Zhou, W. Projections of West African summer monsoon rainfall extremes from two CORDEX models. Clim. Dyn. 2018, 52, 2017–2028. [Google Scholar] [CrossRef]
  24. Fotso-Nguemo, T.C.; Diallo, I.; Diakhaté, M.; Vondou, D.A.; Mbaye, M.L.; Haensler, A.; Gaye, A.T.; Tchawoua, C. Projected changes in the seasonal cycle of extreme rainfall events from CORDEX simulations over Central Africa. Clim. Chang. 2019, 155, 339–357. [Google Scholar] [CrossRef]
  25. Sillmann, J.; Kharin, V.V.; Zwiers, F.W.; Zhang, X.; Bronaugh, D. Climate extremes indices in the CMIP5 multimodel ensemble: Part 2. Future climate projections. J. Geophys. Res. Atmos. 2013, 118, 2473–2493. [Google Scholar] [CrossRef]
  26. Gbode, I.E.; Akinsanola, A.A.; Ajayi, V.O. Recent Changes of Some Observed Climate Extreme Events in Kano. Int. J. Atmos. Sci. 2015, 2015, 1–6. [Google Scholar] [CrossRef] [Green Version]
  27. Akinsanola, A.A.; Ogunjobi, K.O. Recent homogeneity analysis and long-term spatio-temporal rainfall trends in Nigeria. Theor. Appl. Clim. 2015, 128, 275–289. [Google Scholar] [CrossRef]
  28. Panthou, G.; Vischel, T.; Lebel, T. Recent trends in the regime of extreme rainfall in the Central Sahel. Int. J. Clim. 2014, 34, 3998–4006. [Google Scholar] [CrossRef]
  29. Mouhamed, L.; Traoré, S.B.; Alhassane, A.; Sarr, B. Evolution of some observed climate extremes in the West African Sahel. Weather Clim. Extrem. 2013, 1, 19–25. [Google Scholar] [CrossRef] [Green Version]
  30. Omotosho, J.B. The separate contributions of line squalls, thunderstorms and the monsoon to the total rainfall in nigeria. J. Clim. 1985, 5, 543–552. [Google Scholar] [CrossRef]
  31. Abiodun, B.J.; Salami, A.; Matthew, O.J.; Odedokun, S. Potential impacts of afforestation on climate change and extreme events in Nigeria. Clim. Dyn. 2012, 41, 277–293. [Google Scholar] [CrossRef]
  32. Oguntunde, P.G.; Abiodun, B.J.; Lischeid, G. Rainfall trends in Nigeria, 1901–2000. J. Hydrol. 2011, 411, 207–218. [Google Scholar] [CrossRef]
  33. Adefolalu, D.O. Rainfall trends in Nigeria. Theor. Appl. Clim. 1986, 37, 205–219. [Google Scholar] [CrossRef]
  34. Nicholson, S.E. The intensity, location and structure of the tropical rainbelt over west Africa as factors in interannual variability. Int. J. Clim. 2008, 28, 1775–1785. [Google Scholar] [CrossRef]
  35. Nicholson, S.E. On the factors modulating the intensity of the tropical rainbelt over West Africa. Int. J. Clim. 2009, 29, 673–689. [Google Scholar] [CrossRef]
  36. Nicholson, S.E. Climatic and environmental change in Africa during the last two centuries. Clim. Res. 2001, 17, 123–144. [Google Scholar] [CrossRef] [Green Version]
  37. Paeth, H. Regionale Klimamodellierung zur Evaluation der Hauptfaktoren einer voraussichtlichen Klimaänderung in Afrika (Key factors in African climate change evaluated by a regional climate model). Erdkunde 2004, 58, 290–315. [Google Scholar] [CrossRef]
  38. Dike, V.N.; Lin, Z.; Wang, Y.; Nnamchi, H.C. Observed trends in diurnal temperature range over Nigeria. Atmos. Ocean. Sci. Lett. 2019, 12, 131–139. [Google Scholar] [CrossRef] [Green Version]
  39. Wang, X.L.; Chen, H.; Wu, Y.; Feng, Y.; Pu, Q. New Techniques for the Detection and Adjustment of Shifts in Daily Precipitation Data Series. J. Appl. Meteorol. Clim. 2010, 49, 2416–2436. [Google Scholar] [CrossRef]
  40. Karl, T.R.; Nicholls, N.; Ghazi, A. Clivar/GCOS/WMO Workshop on Indices and Indicators for Climate Extremes Workshop Summary. Clim. Chang. 1999, 42, 3–7. [Google Scholar] [CrossRef]
  41. Theil, H. A rank-invariant method of linear and polynomial regression analysis, 3; confidence regions for the parameters of polynomial regression equations. Indag. Math. 1950, 1, 467–482. [Google Scholar]
  42. Kendall, M.G. Rank Correlation Methods; Griffin: Saratoga Springs, NY, USA, 1975. [Google Scholar]
  43. Mann, H.B. Nonparametric Tests against Trend. Econometrica 1945, 13, 245–259. [Google Scholar] [CrossRef]
  44. Tank, A.M.K.; Peterson, T.C.; Quadir, D.A.; Dorji, S.; Zou, X.; Tang, H.; Santhosh, K.; Joshi, U.R.; Jaswal, A.K.; Kolli, R.K.; et al. Changes in daily temperature and precipitation extremes in central and south Asia. J. Geophys. Res. Space Phys. 2006, 111, 709–720. [Google Scholar]
  45. Adejuwon, J.O.; Odekunle, T.O. Variability and the Severity of the “Little Dry Season” in Southwestern Nigeria. J. Clim. 2006, 19, 483–493. [Google Scholar] [CrossRef]
  46. Omotosho, J. Spatial variation of rainfall in Nigeria during the ‘little dry season’. Atmos. Res. 1988, 22, 137–147. [Google Scholar] [CrossRef]
  47. Sultan, B.; Janicot, S. Abrupt shift of the ITCZ over West Africa and intra-seasonal variability. Geophys. Res. Lett. 2000, 27, 3353–3356. [Google Scholar] [CrossRef]
  48. Chineke, T.C.; Jagtap, S.S.; Nwofor, O. West African monsoon: Is the August break “breaking” in the eastern humid zone of Southern Nigeria? Clim. Change 2010, 103, 555–570. [Google Scholar] [CrossRef]
  49. Ogungbenro, S.; Morakinyo, T.E. Rainfall distribution and change detection across climatic zones in Nigeria. Weather Clim. Extrem. 2014, 5, 1–6. [Google Scholar] [CrossRef] [Green Version]
  50. Losada, T.; Rodriguez-Fonseca, B.; Mohino, E.; Bader, J.; Janicot, S.; Mechoso, C.R. Tropical SST and Sahel rainfall: A non-stationary relationship. Geophys. Res. Lett. 2012, 39. [Google Scholar] [CrossRef] [Green Version]
  51. Nicholson, S.E.; Fink, A.H.; Funk, C. Assessing recovery and change in West Africa’s rainfall regime from a 161-year record. Int. J. Clim. 2018, 38, 3770–3786. [Google Scholar] [CrossRef]
  52. Druyan, L.M. Studies of 21st-century precipitation trends over West Africa. Int. J. Clim. 2010, 31, 1415–1424. [Google Scholar] [CrossRef]
  53. Sylla, M.B.; Nikiema, P.M.; Gibba, P.; Kebe, I.; Klutse, N.A.B. Climate Change over West Africa: Recent Trends and Future Projections. In Adaptation to Climate Change and Variability in Rural West Africa; Yaro, J., Hesselberg, J., Eds.; Springer International Publishing: Cham, Switzerland, 2016; pp. 25–40. [Google Scholar]
  54. Sylla, M.B.; Giorgi, F.; Pal, J.S.; Gibba, P.; Kebe, I.; Nikiema, M. Projected Changes in the Annual Cycle of High-Intensity Precipitation Events over West Africa for the Late Twenty-First Century*. J. Clim. 2015, 28, 6475–6488. [Google Scholar] [CrossRef]
  55. Luong, T.M.; Dasari, H.P.; Hoteit, I. Extreme precipitation events are becoming less frequent but more intense over Jeddah, Saudi Arabia. Are shifting weather regimes the cause? Atmos. Sci. Lett. 2020, 21, 981. [Google Scholar] [CrossRef]
  56. Lin, Z.; Nnamdi, D.V.; Dike, N.V. Impact of Trans-Atlantic-Pacific Ocean Dipole–like pattern on summer precipitation variability over West Africa. Atmos. Ocean. Sci. Lett. 2018, 11, 509–517. [Google Scholar] [CrossRef] [Green Version]
  57. McGregor, S.; Timmermann, A.; Stuecker, M.F.; England, M.H.; Merrifield, M.; Jin, F.; Chikamoto, Y. Recent Walker circulation strengthening and Pacific cooling amplified by Atlantic warming. Nat. Clim. Chang. 2014, 4, 888–892. [Google Scholar] [CrossRef] [Green Version]
  58. Li, X.; Xie, S.-P.; Gille, S.T.; Yoo, C. Atlantic-induced pan-tropical climate change over the past three decades. Nat. Clim. Change 2015, 6, 275–279. [Google Scholar] [CrossRef]
  59. Tarhule, A.A. Damaging Rainfall and Flooding: The Other Sahel Hazards. Clim. Change. 2005, 72, 355–377. [Google Scholar] [CrossRef]
Figure 1. The location of Nigeria and the distribution of weather stations, and elevations are colored based on a Digital Elevation Model.
Atmosphere 11 01084 g001
Figure 2. Mean (1975–2013) seasonal cycle for (a) total wet-day rainfall amount (PRCPTOT), (b) wet-day frequency (RR1), (c) maximum consecutive 5-day rainfall amount (RX5day), (d) heavy rainfall (R20mm), (e) wet-day intensity (SDII), (f) dry spell (CDD).
Atmosphere 11 01084 g002
Figure 3. Mean (1975–2013) seasonal cycle for (a) total wet-day rainfall amount (PRCPTOT), (b) wet-day frequency (RR1), (c) maximum consecutive 5-day rainfall amount (RX5day), (d) heavy rainfall (R20mm), (e) wet-day intensity (SDII), and (f) dry spell (CDD).
Atmosphere 11 01084 g003
Figure 4. Trends of total wet day rainfall (PRCPTOT) (mm/decade) for (a) June–July–August–September (b) June (c) July, (d) August, and (e) September respectively. Upward-pointing triangles indicate positive Theil–Sen slopes, and downward-pointing triangles negative slopes. The filled red and blue triangles are statistically significant at the 90% confidence levels.
Atmosphere 11 01084 g004
Figure 5. Trends of number of rainy days (RR1) (days/decade) over Nigeria for (a) June–July–August–September (b) June (c) July, (d) August, and (e) September respectively. Upward-pointing triangles indicate positive Theil–Sen slopes, and downward-pointing triangles negative slopes. The filled red and blue triangles are statistically significant at the 90% confidence levels.
Atmosphere 11 01084 g005
Figure 6. Trends of maximum 5-day consecutive rainfall (RX5day) (mm/decade) for (a) June–July–August–September (b) June (c) July, (d) August, and (e) September respectively. Upward-pointing triangles indicate positive Theil–Sen slopes, and downward-pointing triangles negative slopes. The filled red and blue triangles are statistically significant at the 90% confidence levels.
Atmosphere 11 01084 g006
Figure 7. Trends of the number of heavy rainfall days (R20mm) (days/decade) for (a) June–July–August–September (b) June (c) July, (d) August, and (e) September respectively. Upward-pointing triangles indicate positive Theil–Sen slopes, and downward-pointing triangles negative slopes. The filled red and blue triangles are statistically significant at the 90% confidence levels.
Atmosphere 11 01084 g007
Figure 8. Trends of daily rainfall intensity (SDII) (mm/day/decade) for (a) June–July–August–September (b) June (c) July, (d) August, and (e) September respectively. Upward-pointing triangles indicate positive Theil–Sen slopes, and downward-pointing triangles negative slopes. The filled red and blue triangles are statistically significant at the 90% confidence levels.
Atmosphere 11 01084 g008
Figure 9. Trends of consecutive dry days (CDD) (days/decade) for (a) June–July–August–September (b) June (c) July, (d) August, and (e) September respectively. Upward-pointing triangles indicate positive Theil–Sen slopes, and downward-pointing triangles negative slopes. The filled red and blue triangles are statistically significant at the 90% confidence levels.
Atmosphere 11 01084 g009
Figure 10. Anomalous rainfall extremes for June–July–August–September over the Guinea Coast and Sub-Sahel regions (a) total wet-day rainfall amount (PRCPTOT), (b) wet-day frequency (RR1), (c) maximum consecutive 5-day rainfall amount (RX5day), (d) number of heavy rainfall days (R20mm), (e) wet-day intensity (SDII), and (f) dry spell (CDD). The tiny lines indicate variations at the different station over the region, the black tick line indicates the seasonal average rainfall extremes for the Guinea Coast region while the green tick line indicates the variation over the Sub-Sahel region. The dotted lines show the trends in the anomalous rainfall extremes and p represents the p-value for the trend lines.
Atmosphere 11 01084 g010
Figure 11. Anomalous rainfall extremes for June–July–August–September over the Nigeria Sahel region (a) total wet-day rainfall amount (PRCPTOT), (b) wet-day frequency (RR1), (c) maximum consecutive 5-day rainfall amount (RX5day), (d) number of heavy rainfall days (R20mm), (e) wet-day intensity (SDII), and (f) dry spell (CDD). The tiny lines indicate variations at the different station over the region, the black tick line indicates the regionally averaged rainfall extremes for the region. The dotted lines show the trends in the anomalous rainfall extremes and p represents the p-value for the trend lines.
Atmosphere 11 01084 g011
Table 1. Definitions and units of rainfall indices used in this study.
IDNameDefinitionsUnits
PRCPTOTTotal wet-day precipitationTotal precipitation in wet days (RR ≥ 1 mm)mm
RX5dayMaximum consecutive 5-day precipitationMaximum consecutive 5-day precipitationmm
SDIISimple daily intensityAverage precipitation from wet-daysmm/day
RR1Wet days frequencyNumber of days with precipitation amount (RR ≥ 1 mm)days
R20mmVery heavy precipitation daysNumber of very heavy precipitation days (RR ≥ 20 mm)days
CDDConsecutive dry daysMaximum number of consecutive dry days (RR ≤ 1 mm)days
RR is daily rainfall, wet day is when RR ≥ 1 mm, and dry day is when RR < 1 mm.
Table 2. Trends of PRCPTOT (mm/decade), RR1 (days/decade), and RX5day (mm/decade) over Nigeria for June–July–August–September (JJAS), and the individual summer months, June, July, August, and September. The bold numbers are significant at 90% confidence level.
StationPRCPTOTRR1RX5day
JJASJune July AugustSeptemberJJASJuneJuly AugustSeptemberJJASJune July AugustSeptember
Asaba5.170.8012.223.5−1.00−0.50−0.57−1.00−0.530.006.000.578.8110.6−1.52
Awka5.170.8012.223.5−1.00−0.50−0.57−1.00−0.530.006.000.578.8110.6−1.52
Bauchi−8.865.92−47.4−21.3−0.95−0.58−0.67−0.95−0.830.00−0.41−0.76−8.696.78−0.73
Benin12.210.11.5313.0−0.77−0.23−0.48−0.77−0.770.312.042.940.210.00−5.18
Bida5.420.60−1.8416.60.340.230.000.340.000.001.840.002.09−0.637.38
Calabar11.2−24.830.639.30.31−0.10−0.370.310.000.001.60−6.0914.28.00−5.72
Enugu11.813.58.044.700.300.420.000.300.000.740.181.95−1.711.374.64
Gombe−3.00−1.22−26.35.46−1.79−1.00−1.11−1.79−1.250.002.37−0.93−3.5912.00.25
Gusau−2.223.45−5.607.420.000.000.000.000.000.00−1.750.59−4.796.55−6.40
Ibadan18.114.418.27.700.000.00−0.450.000.000.429.165.6011.24.4710.8
Ijebu-ode21.425.216.34.270.000.360.000.000.000.638.898.0712.001.8113.9
Ikeja5.6145.922.44.572.310.232.412.310.862.500.5815.911.834.4013.0
Ikom28.629.3−9.204.080.881.961.050.880.530.0012.312.0−3.621.200.21
Iseyin9.158.718.7814.00.440.560.500.440.430.572.43−3.845.040.764.00
Lokoja7.563.7318.314.50.000.390.830.000.000.003.231.525.407.36−2.92
Maiduguri19.57.5420.334.60.430.450.000.431.070.009.354.837.8516.26.29
Table 3. Trends in R20mm (days/decade), SDII (mm/day/decade), and CDD (days/decade) over Nigeria for June–July–August–September (JJAS), and the individual summer months, June, July, August, and September. The bold numbers are significant at 90% confidence level.
StationR20mmSDIICDD
JJASJune July AugustSeptemberJJASJune July AugustSeptemberJJASJune July AugustSeptember
Asaba0.000.000.000.000.000.850.821.631.930.060.000.000.000.000.00
Awka0.000.000.000.000.000.850.821.631.930.060.000.000.000.000.00
Bauchi−0.65−0.42−1.15−0.370.001.001.54−0.820.722.120.250.300.000.000.00
Benin0.310.480.000.000.001.131.190.661.150.290.140.000.000.000.00
Bida0.220.000.000.710.000.380.48−0.591.420.780.00−0.530.000.000.00
Calabar0.11−0.370.561.11−0.360.65−0.401.261.66−0.790.000.000.000.000.00
Enugu0.110.000.000.000.000.360.93−0.200.290.92−0.120.000.000.000.00
Gombe0.000.00−0.500.000.001.491.700.341.671.100.360.670.670.000.00
Gusau0.000.000.000.00−0.310.230.74−0.280.25−0.910.360.000.000.00−0.43
Ibadan0.260.000.340.000.531.481.651.531.051.670.000.000.000.00−0.36
Ijebu-ode0.310.000.000.000.591.281.160.711.191.830.000.00−0.270.000.00
Ikeja0.270.570.360.000.81−0.93−0.31−2.40−0.160.76−2.02−0.53−1.580.00−2.73
Ikom0.450.53−0.300.000.00−0.080.67−1.500.100.05−0.07−0.290.000.000.00
Iseyin0.000.170.000.000.000.310.210.081.60−0.06−0.310.00−0.400.000.00
Lokoja0.000.000.000.000.000.15−0.510.710.68−0.24−0.120.710.000.000.00
Maiduguri0.400.000.000.710.331.290.421.531.641.61−0.94−1.600.000.000.37

