Article

Spatial Variation and Trend of Extreme Precipitation in West Africa and Teleconnections with Remote Indices

1
Laboratory for Oceanography, Environmental Science and Climate, Assane Seck University of Ziguinchor, Ziguinchor 27000, Senegal
2
Laboratory of Atmospheric Physics—Simeon Fongang, Polytechnics School of Dakar, UCAD, Dakar 10700, Senegal
3
Laboratory of Hydraulics and Fluids Mechanics, Faculty of Science and Technology, University Cheikh Anta Diop, Dakar 27000, Senegal
*
Author to whom correspondence should be addressed.
Atmosphere 2020, 11(9), 999; https://doi.org/10.3390/atmos11090999
Submission received: 1 July 2020 / Revised: 24 August 2020 / Accepted: 30 August 2020 / Published: 18 September 2020
(This article belongs to the Special Issue Trends in Hydrological and Climate Extremes in Africa)

Abstract

:
Extreme precipitation is a great concern for West Africa country, as it has serious consequence on key socio-economic activities. We use high resolution data from the Climate Hazards Group InfraRed Precipitation Stations (CHIRPS) to determine the spatial variability, trend of 8 extreme precipitation indices in West Africa and their relationship to remote indices. Spatial variability of extreme is characterized by maximum precipitation over the orographic regions, and in southern Sahel. The trend analysis shows a decrease of dry condition in Sahel and Sahara, and an increase tendency of wet indices over western Sahel and southern Sahel. The correlation analysis reveals that extreme precipitation in Sahel is strongly teleconnected to the Eastern Mediterranean Sea (EMS), whereas western and western-north Sahel is associated with both Atlantic Meridional Mode (AMM), Maiden Julian Oscillation phase 8 (MJO8), El Niño 3.4 index (NINO.3.4), and Trans-Atlantic-Pacific Ocean Dipole Index (TAPODI) but with different characteristics or directions. Guinean coast extreme precipitation is highly associated with Atlantic zone 3 SST anomaly (ATL3), Northern Cold Tongue Index (NCTI), TAPODI but also with an opposite sign with NINO.3.4 and in somewhat with the MJO8.

1. Introduction

Extreme events usually lead to serious human and economic impacts, especially in the Sahel and West Africa in general, due to a continuously growing population, high vulnerability and exposure, and a lack of adequate adaptation plans. Ref. [1,2] amongst others have reported that extreme events are very likely to change in intensity, frequency, and locations in the 21st century. Ref. [3] point out evidence from observations gathered since 2015 of change in some extremes. Ref. [4] found a general tendency of decreased annual total rainfall and the maximum number of consecutive wet days during their study period in West Africa. They also stated a positive trend of cumulated rainfall of extremely wet days. Using 35 years of satellite observations, Ref. [5] have shown a persistent increase in the frequency of extreme storms over the Sahel region. Similar conclusions are done by [6], they found a statistically significant increase in the number of wet days and a decrease in the number of dry days over the Sahel. However, they state also that trends in the occurrence of extreme summer rainfall events show significant decreases over West Africa, but local increases are found in West Sahel. More recently, an increase of daily rainfall intensity over the Sahel starting in the 1980s associated with an increase in extreme sub-daily intensities in south West Niger since 1990, is suggested by [7]. Ref. [8] have highlighted an increase in the 99th percentile daily rainfall threshold in Western Sahel. They have also shown that in the most recent decade extreme rainfall is more extreme than in the 1960s.
Climate extremes are the result of natural climate variability and natural decadal or multi-decadal variation in the climate provides the backdrop for anthropogenic climate changes [3]. It is the case of West Africa and Sahel, where the change in precipitation and extremes are related to large-scale circulation change. Numerous studies that tried for example to explain the severe drought in the 1970s and 1980s have concluded that oceanic forcing was the main driver of the Sahel and West Africa rainfall variability on interannual and decadal time scales, [9,10,11,12,13,14,15,16,17,18] amongst others. Ref. [19] has identified aspects of anomalous Pacific SST variability that are most strongly linked to the Sahel. He stated that El Niño phase increases the likelihood of Sahel drought, and has shown that although a part of this link is indirect and its main effect appears to be through a direct atmospheric teleconnection. Recently, Ref. [20] have studied drought patterns over the Sahel and their relationship to low frequency climate oscillations by testing seven climate modes with drought evolution; they found that the standard precipitation evapotranspiration index (SPEI) is more associated with the Atlantic Multi-decadal Oscillation (AMO) and the Pacific Decadal Oscillation (PDO). More specifically, Ref. [21] have highlighted the relationship between several indices and rainfall variability in West Africa, for example, SST in the Mediterranean Sea is linked to rainfall variability in the central Sahel, and Atlantic zone 3 (ATL3) has shown a change in the relationship with West Sahel before and after the 1970s. They concluded the existence of non-stationary behaviors in some associations. Evaluating the ocean forcing on interannual variability of heavy and moderate daily rainfall in the Sahel, Ref. [22] have shown that the occurrence of moderate daily rainfall events is enhanced by positive SST anomalies over the tropical North Atlantic and Mediterranean, whereas heavy and extreme daily rainfall events appear to be influenced by the El Niño-Southern Oscillation (ENSO) and Mediterranean variability. More recently, Ref. [23] have analyzed the influence of oceanic remotes forcing on Guinean coast intraseasonal rainfall variability, they found a strong variability on different timescales that are driven by SST variations amplified by land-atmosphere processes. Ref. [24] by studying the relationship between extreme precipitation indices in Ghana and ocean SSTs patterns have demonstrated that wet indices over Ghana have shown significant positive correlations with the Atlantic Ocean SST and negative correlations with the Pacific and Indian basin SSTs. Change in extreme precipitation in West Africa has been highlighted by [25] using regional climate models, whereas Ref. [4], based on stations located in the Sahelian band have studied extreme precipitation patterns. Recently, Ref. [24] have used high-resolution satellite data (Chirps) over Ghana to study extreme precipitation trends and their related teleconnections. The add-value of our work is the extent of the extreme precipitation study overall the West Africa using the high-resolution satellite data (Chirps) and combined with the study of the probability distribution function to have more insights about the trends of extreme precipitation for very recent periods. Besides, a wide range of teleconnection indices that may influence extreme precipitation variability in West Africa has been tested.
The present study aims to investigate first, the spatial variability and trends of extreme precipitation indices over West Africa using the high-resolution Climate Hazards Group InfraRed Precipitation with Station (CHIRPS) data during the summer season, and secondly the link between known remote indices and rainfall extremes in West Africa is explored. The paper is organized as follows. Section 2 presents the data and methodology used, while Section 3 is focused on results and discussion. A summary of the main finding is presented in Section 4 that concludes this paper.

2. Data and Methodology

2.1. Rainfall Dataset and Remote Indices

The Climate Hazards Group InfraRed Precipitation with Stations data (CHIRPS) is widely used in this study for calculating the extreme precipitation indices. The CHIRPS data consists of daily, gauge-calibrated, infrared precipitation estimates [26]. The dataset spans from 1982 to 2016 with a resolution of 0.25° × 0.25° and is only available over land. High spatial resolution and long records make CHIRPS data reliable and suitable for rainfall variability and extremes analysis. Some studies have validated the CHIRPS data with various rainfall observation data, they conclude a good performance for drought monitoring. Ref. [27,28] amount others have highlighted a general agreement with other observational data on annual trends over Africa. Using rain gauge observations from the BADOPLU database, Ref. [29] found a very similar statistical distribution for mean precipitation in AMJ and SON seasons. Furthermore, they concluded that the comparison of the corresponding time-series between the 2 datasets indicates that the distribution and to some extent the temporal variability, agree in both seasons showing a better fit for mean precipitation and number of wet days and then good confidence of the use of CHIRPS data in this region.
The remote indices consist of various climate and oceanic state indices in the Atlantic and/or in the Pacific Ocean and the eastern Mediterranean Sea. Known remote indices suggested by several authors (Table 1) in influencing either West Africa or Sahel regions have been tested. Details of climate indices used in this study are consigned in Table 1, it includes the areas of action and the corresponding references. SST based indices in bold (Table 1) are computed from Hadley Center Sea Ice and Sea Surface Temperature (HadISST), by calculating anomalies for the climatological period 1979–2009, smoothing the anomalies with a 5-month running mean (when needed) and normalizing the smoothed anomalies over the climatological period. The other indices are downloaded from websites, links are given in supplement materials (Table S1). The mean JJAS seasonal variability of these indices shows different patterns and will be the base of the interpretation of teleconnection they may have with extreme precipitation indices.

2.2. Methodology

2.2.1. Extreme Precipitation Indices

Extreme indices used in this study are derived from the Expert Team on Climate Risk and Sector-specific Climate Indices (ET-CRSCI) that have defined a “core set” of 34 descriptive sector-specific indices mainly for agriculture, health, and water resource applications, it includes also indices from the ETCCDI [41,42]. These indices provide a good mixture of daily statistics to assess changes in temperature and precipitation regimes in term of duration, intensity and occurrence [41,42]. The Climpact software an R based software ([43]; https://github.com/ARCCSS-extremes/climpact2); has been used to compute the 8 indices used in this study and listed in Table 2. We have computed three sets of extreme climate indices: (1) absolute indices like RXnday (n = 1 and n = 5), SDII and PRCTOT; (2) threshold exceedance indices like R10mm and R20mm, which refer to the number of days when a threshold is surpassed; (3) indices that highlight the length of wet and dry spell duration, for instance, CDD and CWD. These indices are approved by the WMO and are widely used. The CDD and CWD indices depend on the precipitation occurrence, whereas the Rkmm (k = 10, and k = 20) and the RXnday depend on precipitation amount and the SDII and PRCPTOT are considered aggregated indices as they depend on both the precipitation amounts and occurrence.

2.2.2. Trend Analysis and Regression

The trends analysis of the extreme precipitation indices was computed using the non-parametric Mann-Kendall (MK) trend test [44,45] as recommended by the World Meteorological Organization (WMO) together with the Sen’s test [46]. The null hypothesis H0 is that the data independent and randomly distributed, while the alternative hypothesis H1 is that a monotonic trend exist. The non-parametric Sen’s slope estimator estimates the trend magnitude of the variable-time by mean of a nonlinear, and the Man-Kendal test (Z Kendall’s coefficient) informs on the significance of the trend. This method is widely used in climate and hydrology [47,48,49,50,51,52]; amongst others.
The relationships between detrended precipitation extreme indices and remote indices time series were performed using a regression method. The significance level of Pearson correlation coefficients is computed to set a 95% confidence level according to a Fisher-test. The effective degree of freedom (EDOF) is computed [18,53,54] to take into account the autocorrelation in the time series. Furthermore, the standard degree of freedom is used for the significance level test of correlation between the areal averaged (west Africa subregions) of extreme precipitation indices and remote indices.

3. Results and Discussion

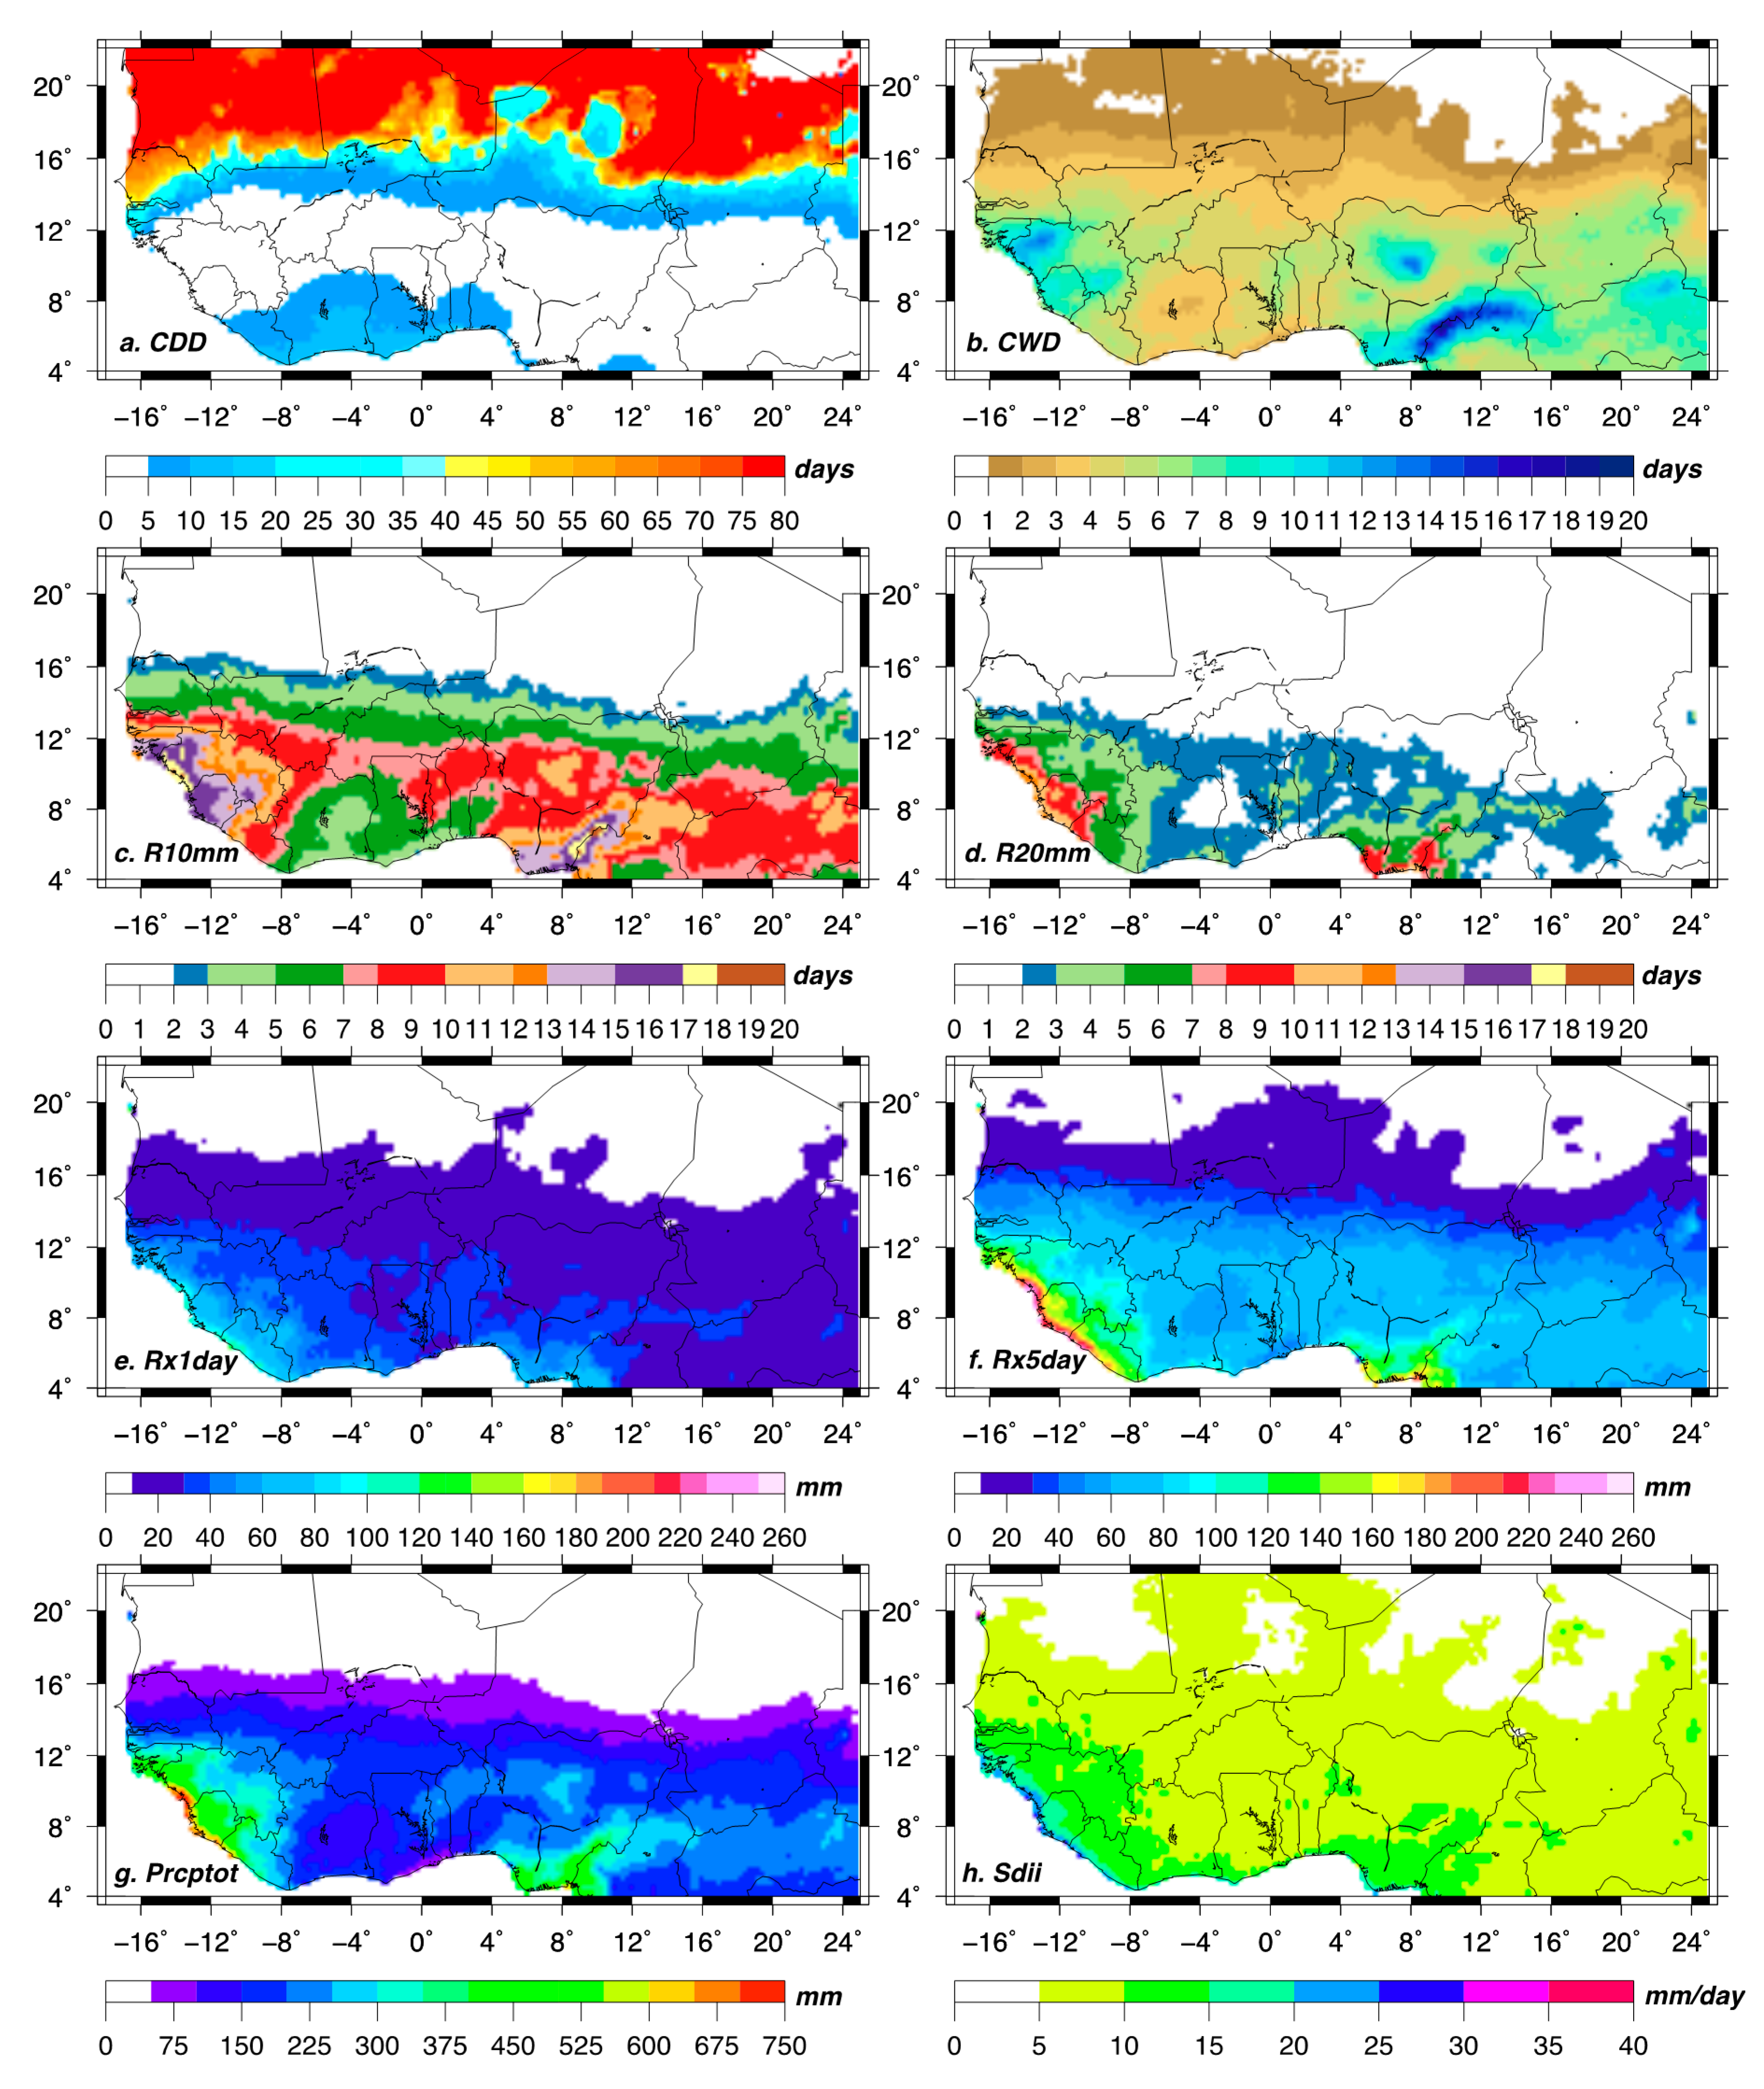
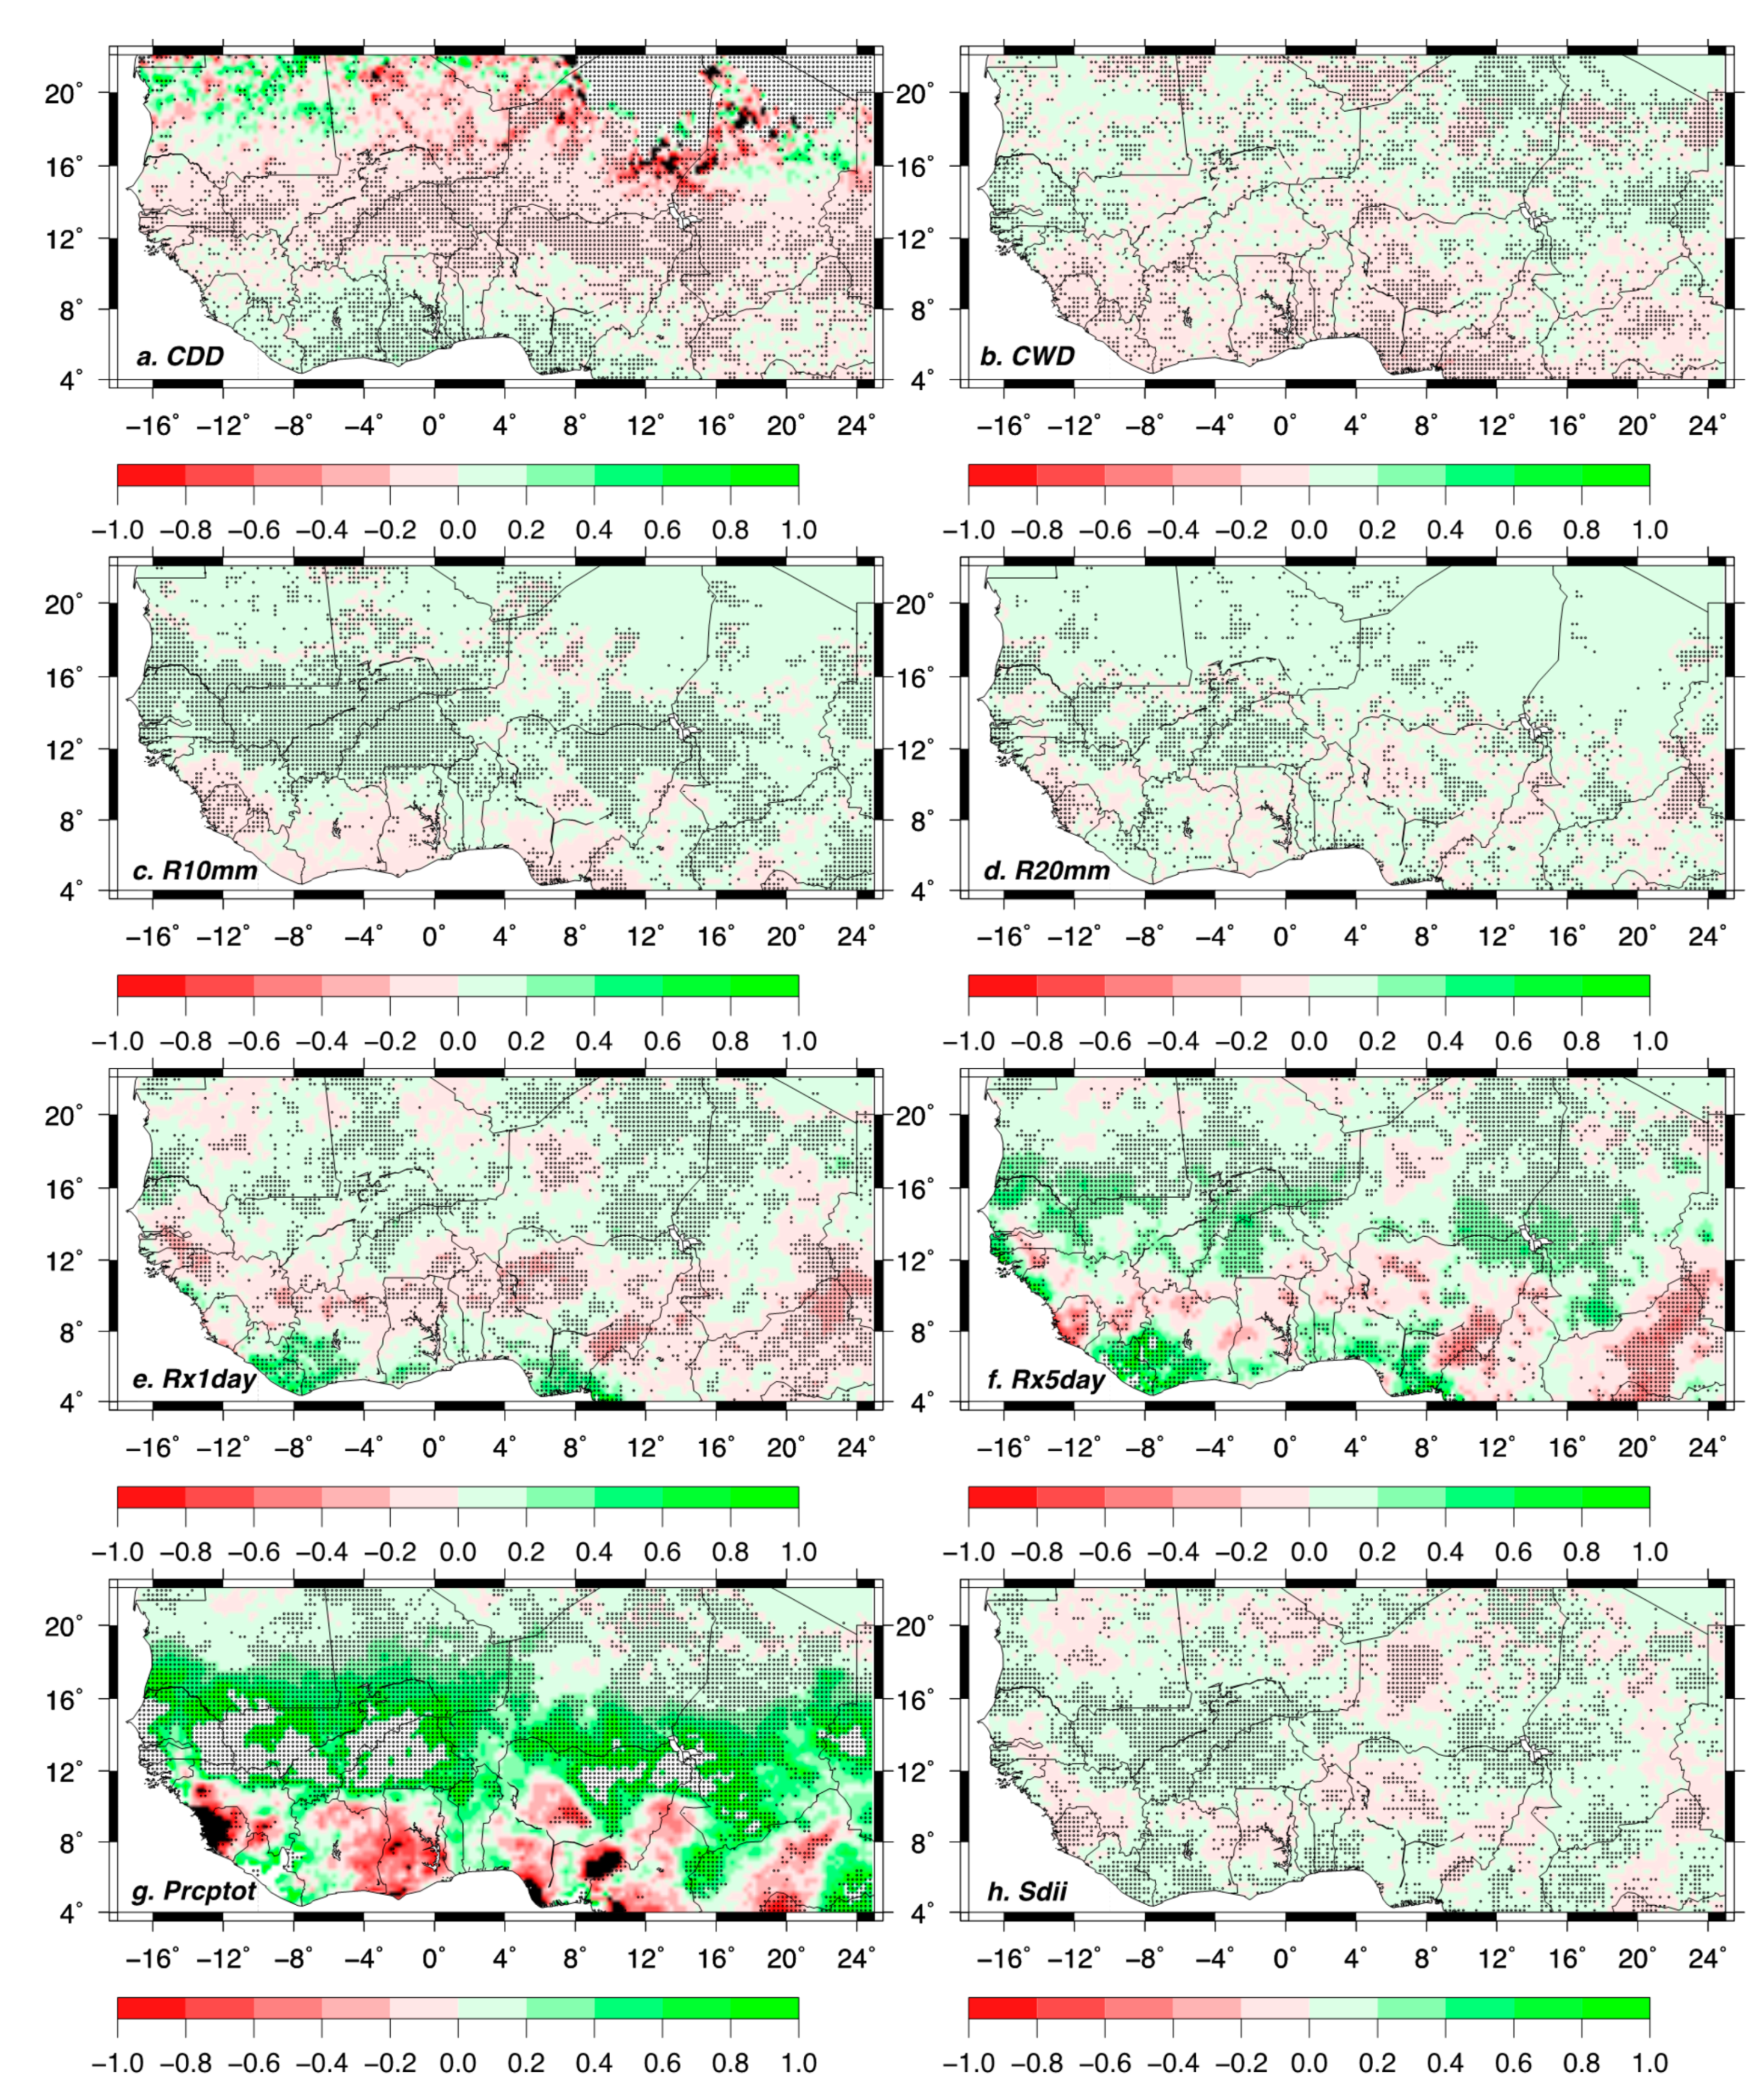
3.1. Variability and Trends in Extreme Precipitation over West Africa

The spatial distribution of the extreme precipitation indices is first analyzed using the Chirps dataset for the summer (JJAS) season and the period spanning from 1982 to 2016. Figure 1a shows the spatial pattern of the CDD over West Africa, the highest mean values are observed in the northern Sahel with a more pronounced occurrence in the Saharan band within mean more than 70 days of CDD in JJAS. The central Sahel band presents less than 20 days of CDD whereas the southern Sahel does show a spatial distribution of fewer than 5 days. We should note a similar CDD pattern to the central Sahel is observed in the Guinean coast regions close to the coast. The summer JJAS season in southwest Africa coincides with the second dry seasons and the CDD is found to be less than 15 days. The highest values of the CWD are observed in regions with high orography around Guinean highlands, Joss plateau, and West Cameroun highlands (Figure 1b). The Southern Sahelian band presents also a better distribution of the CWD compared to other regions within mean 7 to 12 days of CWD around highland regions. The threshold exceedance precipitation indices (R10mm and R20mm) does show a similar pattern to the CWD with maximum values located around the high orography but also in countries at the South-West coast (Guinea, Sierra Leone, and Liberia). However, the spatial variation of the R10mm is characterized by an increasing from the central Sahel to the coast in the southern West, except in most parts of Ivory Coast and in western Ghana where the R10mm has decreased. As for the CWD, the maximum is located around orographic regions. Similar behavior is observed with the R20mm, with an increasing started from the southern Sahel to the coast. However, two maximums are respectively located in the southern-west and the southern-east of Guinean coast region (Figure 1c,d). Figure 1e,f present the mean distribution of RX1day and RX5day indices. An increasing pattern is observed from the Sahel to the coast in the southern West Africa for both indices, but the intensity is more pronounced with the RX5day, and as previously the highest rainfall values are observed near highlands regions. The spatial distribution of the absolute precipitation index PRCPTOT shows also the similar pattern with an increase from 75 mm to 160 mm, with the highest maximum in the Coast of Sierra Leone, Guinea, and Liberia and the second maximum in the south of Joss plateau at the coast (Figure 1g). The same pattern is also highlighted by the SDII which corresponds to the daily precipitation annual index (Figure 1h). Using GPCP and TRMM datasets for model’s evaluation, Ref. [25] have shown very similar patterns to our results. They found that the minimum of dry days is located over the southern Sahel subregion in the two datasets, while the Guinean coast exhibits in mean between 10 and 15 CDD for the period 1998–2005. They have shown also that PRCPTOT maximum is located within the Guinean coast region of West Africa, especially over the Fouta Djallon highlands, Jos plateau and Cameroun Highlands as observed in Figure 1g.
Figure 2 shows the pattern from the Z and Sen trend test for extreme precipitation indices in summer (JJAS) over West Africa. The shadings represent the Sen’s slope for the study period and black dots correspond to points where the trend is statistically significant at a 5% significance level following the Z Man-Kendall’s coefficient. The CDD index moderately decreases significantly in Central-east Sahel and increases in Guinean coast regions (Figure 2a), a similar pattern has been depicted by [28], who found a decrease in the total number of dry days in the Sahel. The highest decreasing values are observed in Saharan areas. The number of CWD tends to slowly increase in West Sahel over Senegal and shows sparse and unregular trends in Central Sahel, however, it decreases significantly in the eastern Guinean coast around Joss and West Cameroon highlands but also the western coast of Guinean coast band around Sierra Leone and Liberia as seen in Figure 2b. This result shows slight discrepancy with [28], who have shown a uniformly positive trend of the number of wet spells and the number of wet days in the Sahel with a maximum in the western part over Senegal. The discrepancy is more observed in Central Sahel. Figure 2c,d show the trends of the R10mm and R20mm over West Africa. A positive and significant trend is observed over the whole Sahel (excepted in Niger) with a low rate of increase of about 0.2 namely with R10mm. An opposite pattern is seen in the Guinean coast region with less uniform behavior and less significant. The analysis of absolute indices RXnday spatial distribution shows an alike-dipole pattern with an increasing trend in “central” Sahel, a decrease in the southern Sahel or northern Guinean coast, and again an increase in coastal Guinean coast regions. For the RX1day the increasing trend is higher in Guinean coast areas near to the coast (Figure 2e), whereas the alike-dipole observed with the RX5day index is more pronounced and significant than the RX1day (Figure 2f). The PRCPTOT index shows a different pattern than the previous absolute indices with significant and high values of positive slope over the Sahel indicating an increasing tendency (Figure 2g). The greatest increasing rate are located in western Senegal, in western Mali, and in northern Burkina Faso. Guinean coast regions are characterized by a decreasing trend of the PRCPTOT index with no significant values except in Sierra Leone and some little areas in Nigeria. We should not also that the Benin and West part of the Ivory coast present a positive tendency with no significant signal. The spatial distribution of the SDII index is represented in Figure 2h. The SDII index tends to statistically significant increase in central and east Sahel and Guinean coast areas close to the coast with a low trend. The decreasing areas are sparse and located in the southern Sahel, in Sierra Leone, and central Niger with the same range as the increasing rate. Our results show a similarly pattern with [28] findings, who have reported an increasing of precipitation intensity over the southern-central part of the West Sahel and a decreasing over part of Senegal and eastern Mali. Ref. [7] have suggested a general increase of daily rainfall intensity over the Sahel since the beginning of the 1980s. Ref. [55] by studying recovery rainfall over Sahel, have found an increasing of extreme rainfall events.

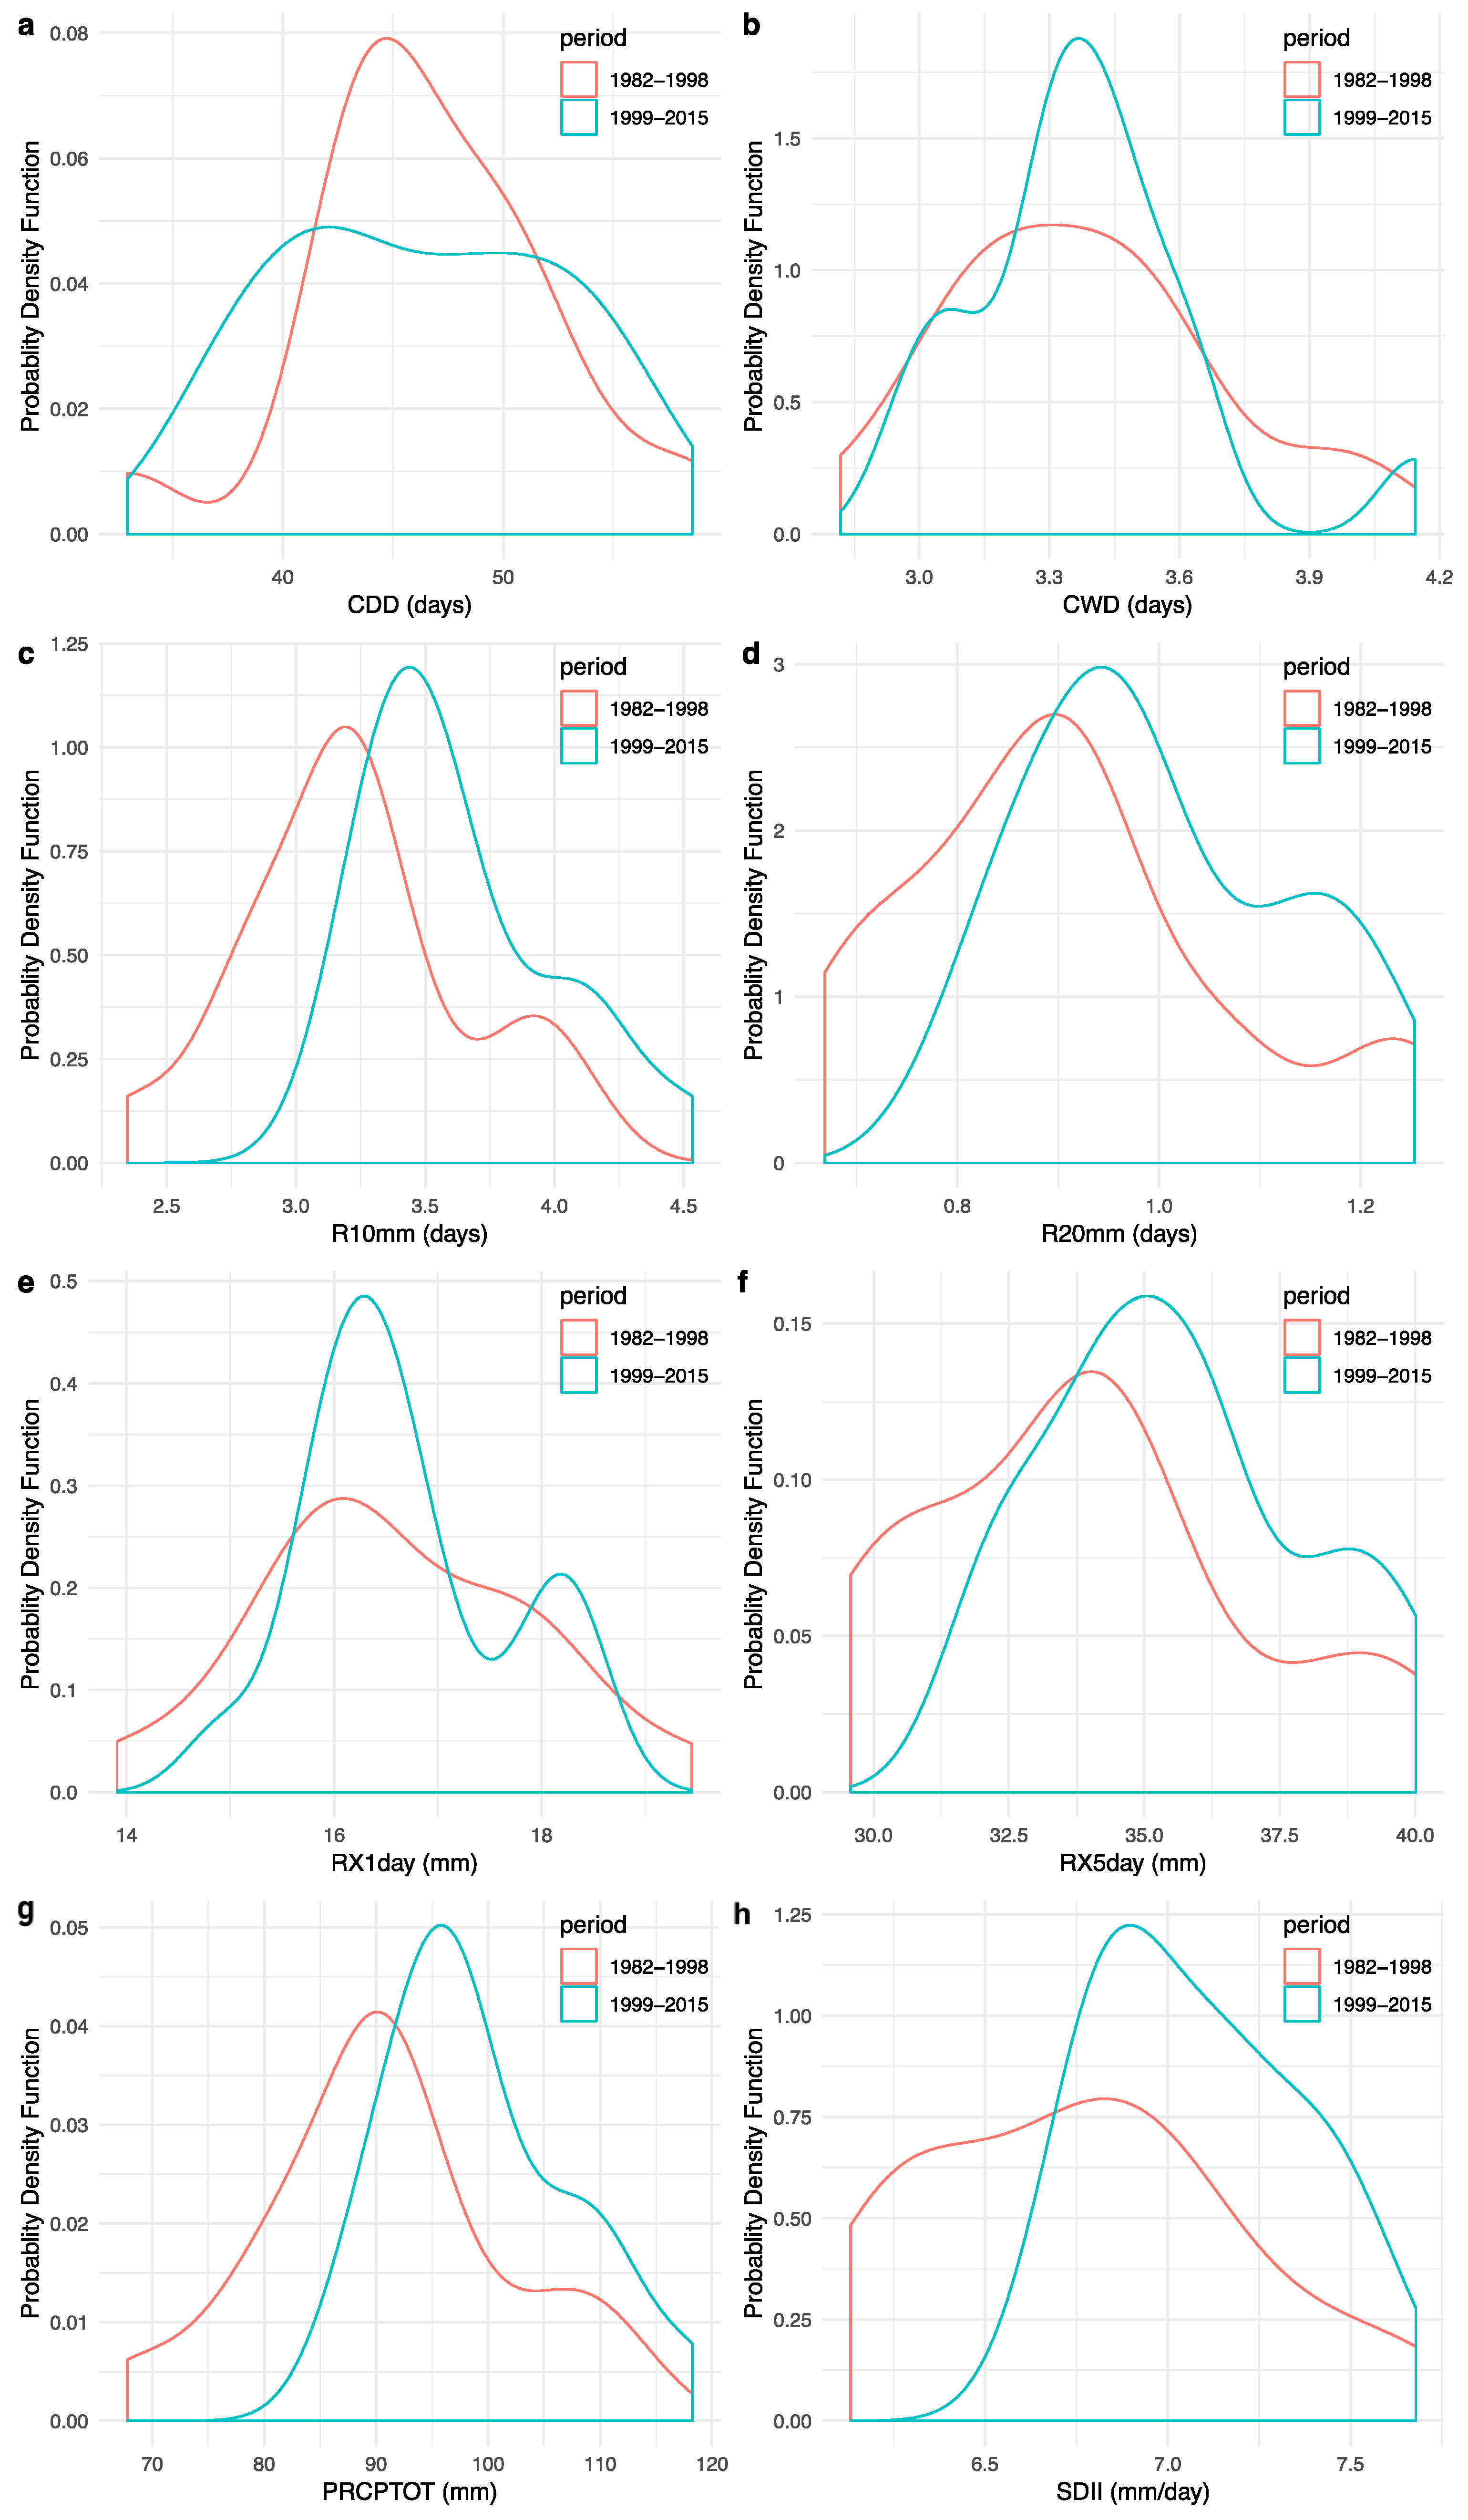
3.2. Probability Distribution Functions in Extreme Precipitation Indices

The temporal variation in extreme precipitation is also investigated using the probability distribution function (PDF) that tells about the probability of an event that will occur in a given period interval. We then divide all indices into two 17 years sub-periods: 1982–1998 and 1999–2015. Figure 3 shows the probability distribution function of all extreme precipitation indices into the two periods averaged over Sahel (West Sahel+ Central Sahel +Eastern Sahel, as stated further in Figure 4a).
An overall analysis states that all indices except CDD tend to shift to the right from sub-period 1 to 2, this result indicates that extreme precipitation in the Sahel has been probabilistically increasing in severity and frequency since the 1980s. We also note from the PDFs that the probability of occurrence of wet-condition has increased since the 1999s (Figure 3b–i), in contrast, the probability of getting CDD has decreased in Sahel (Figure 3a). Our results suggest more frequent extreme precipitation in the near in the Sahel.

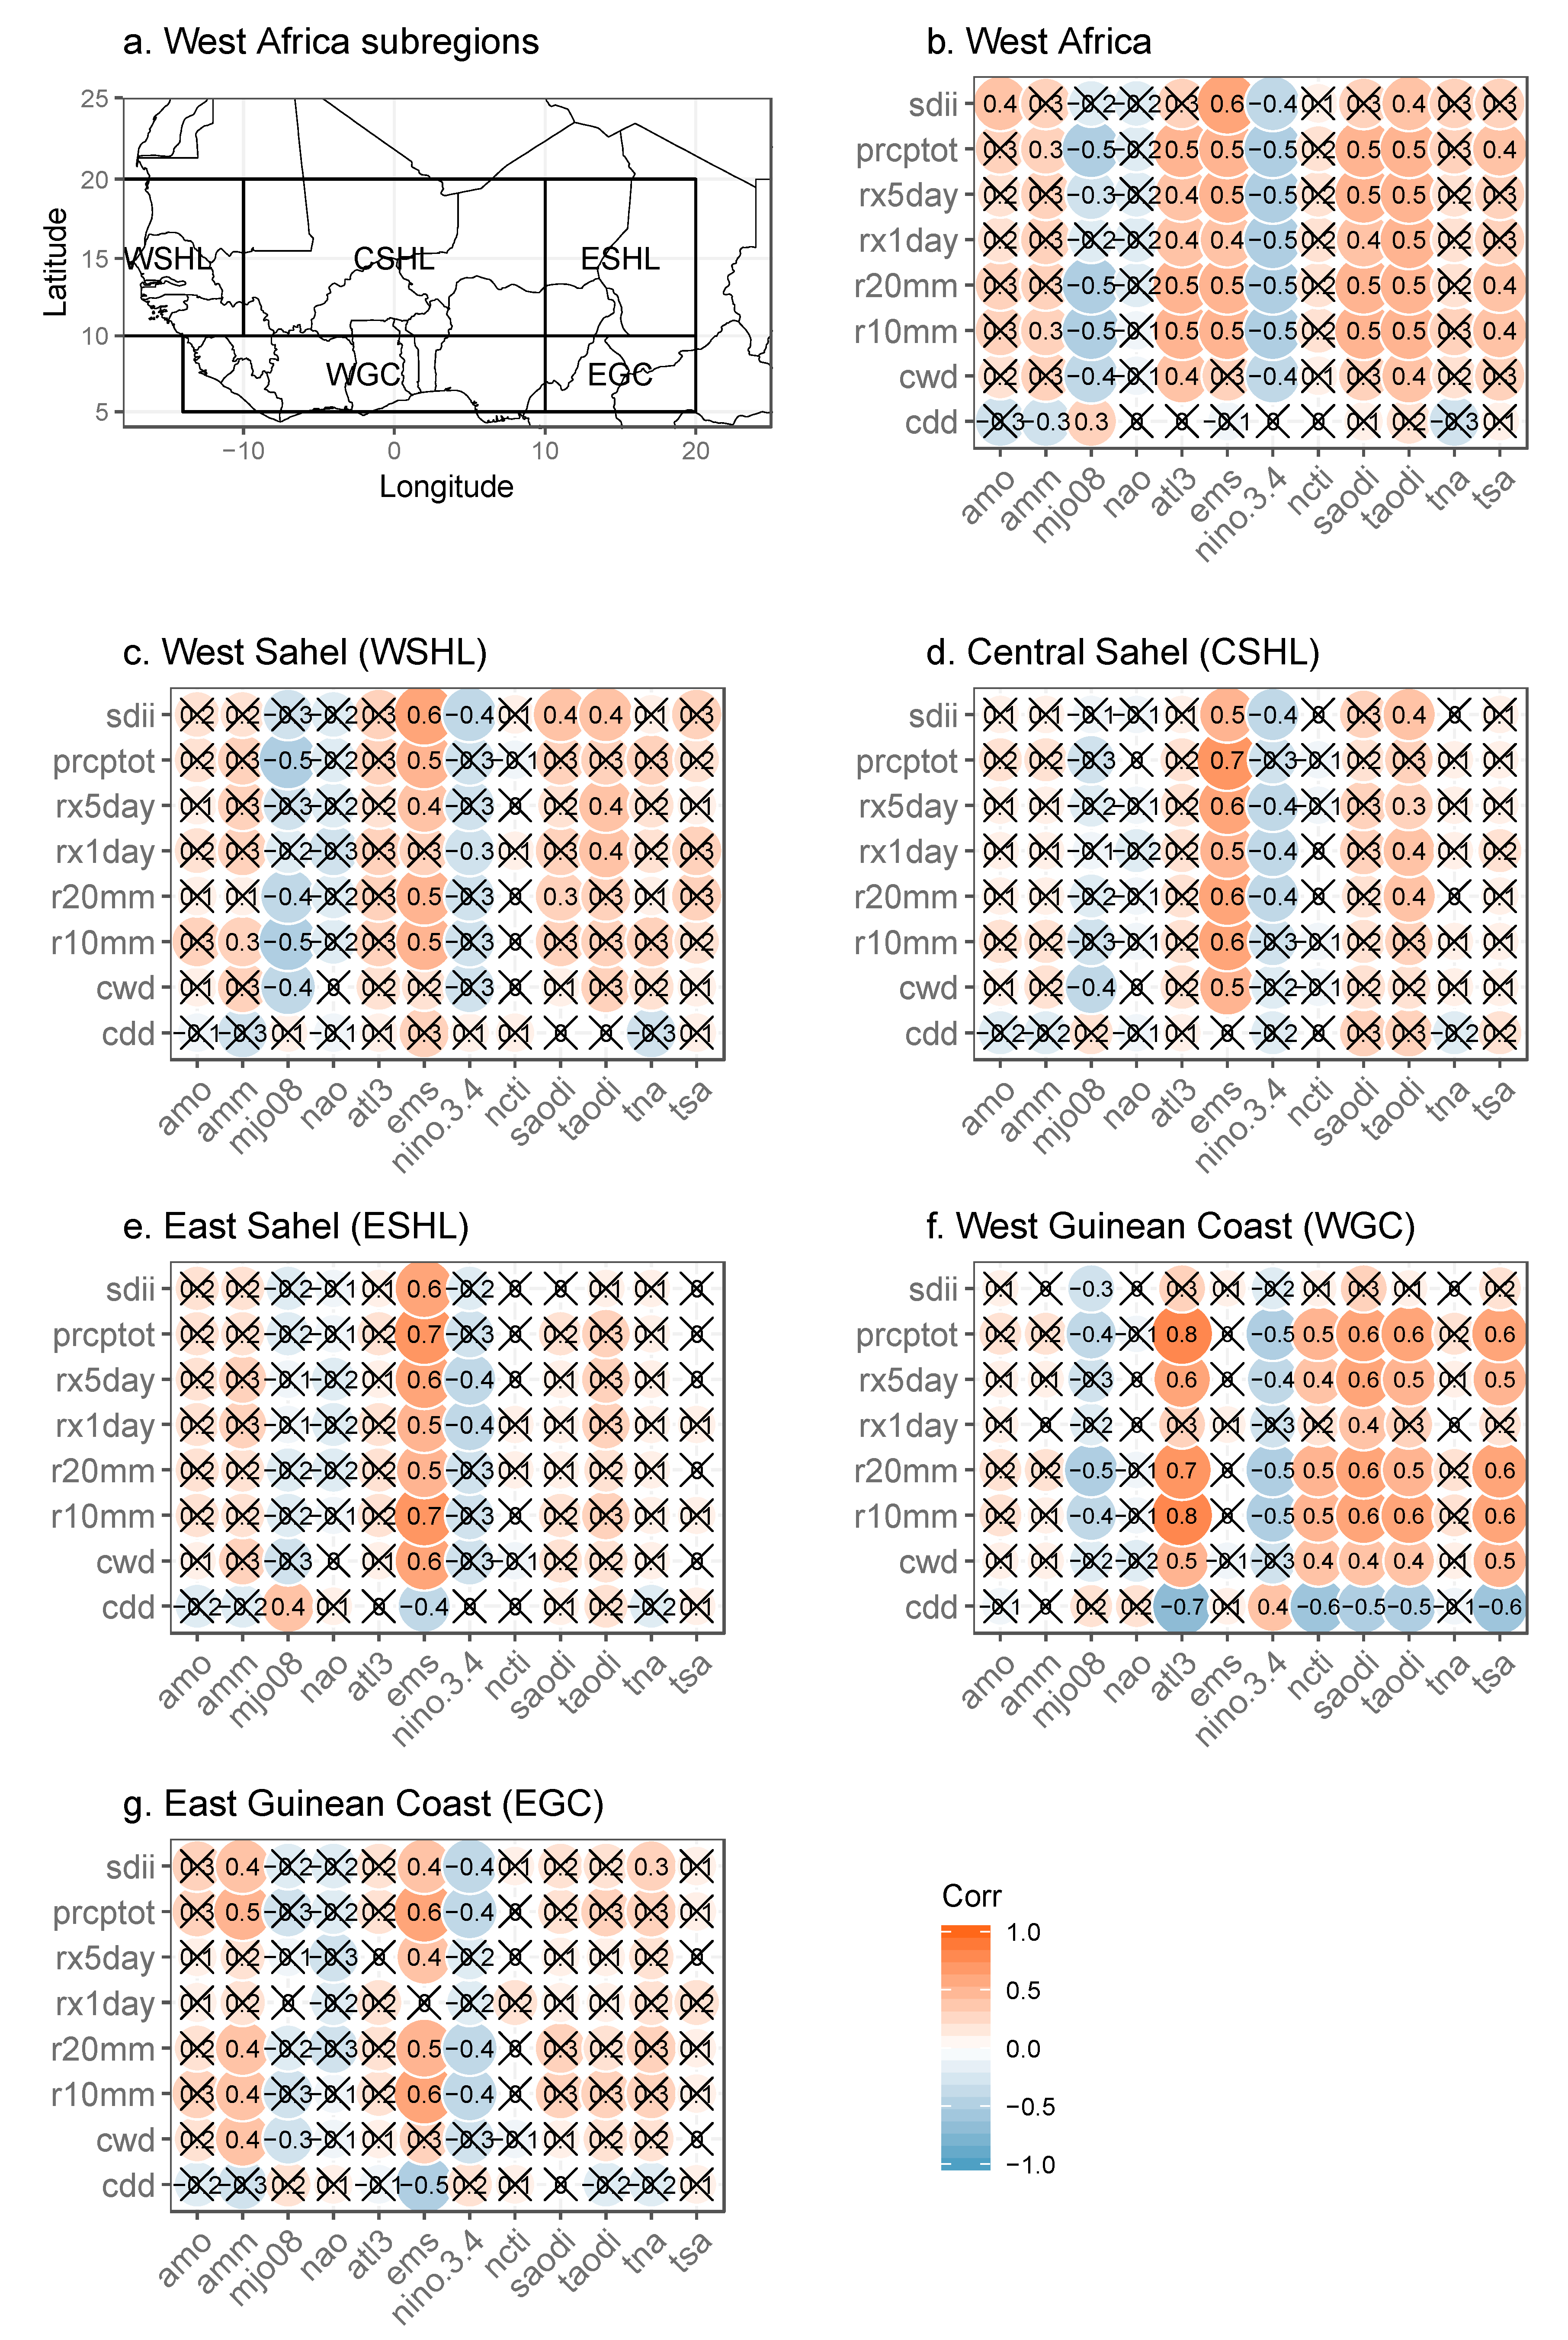
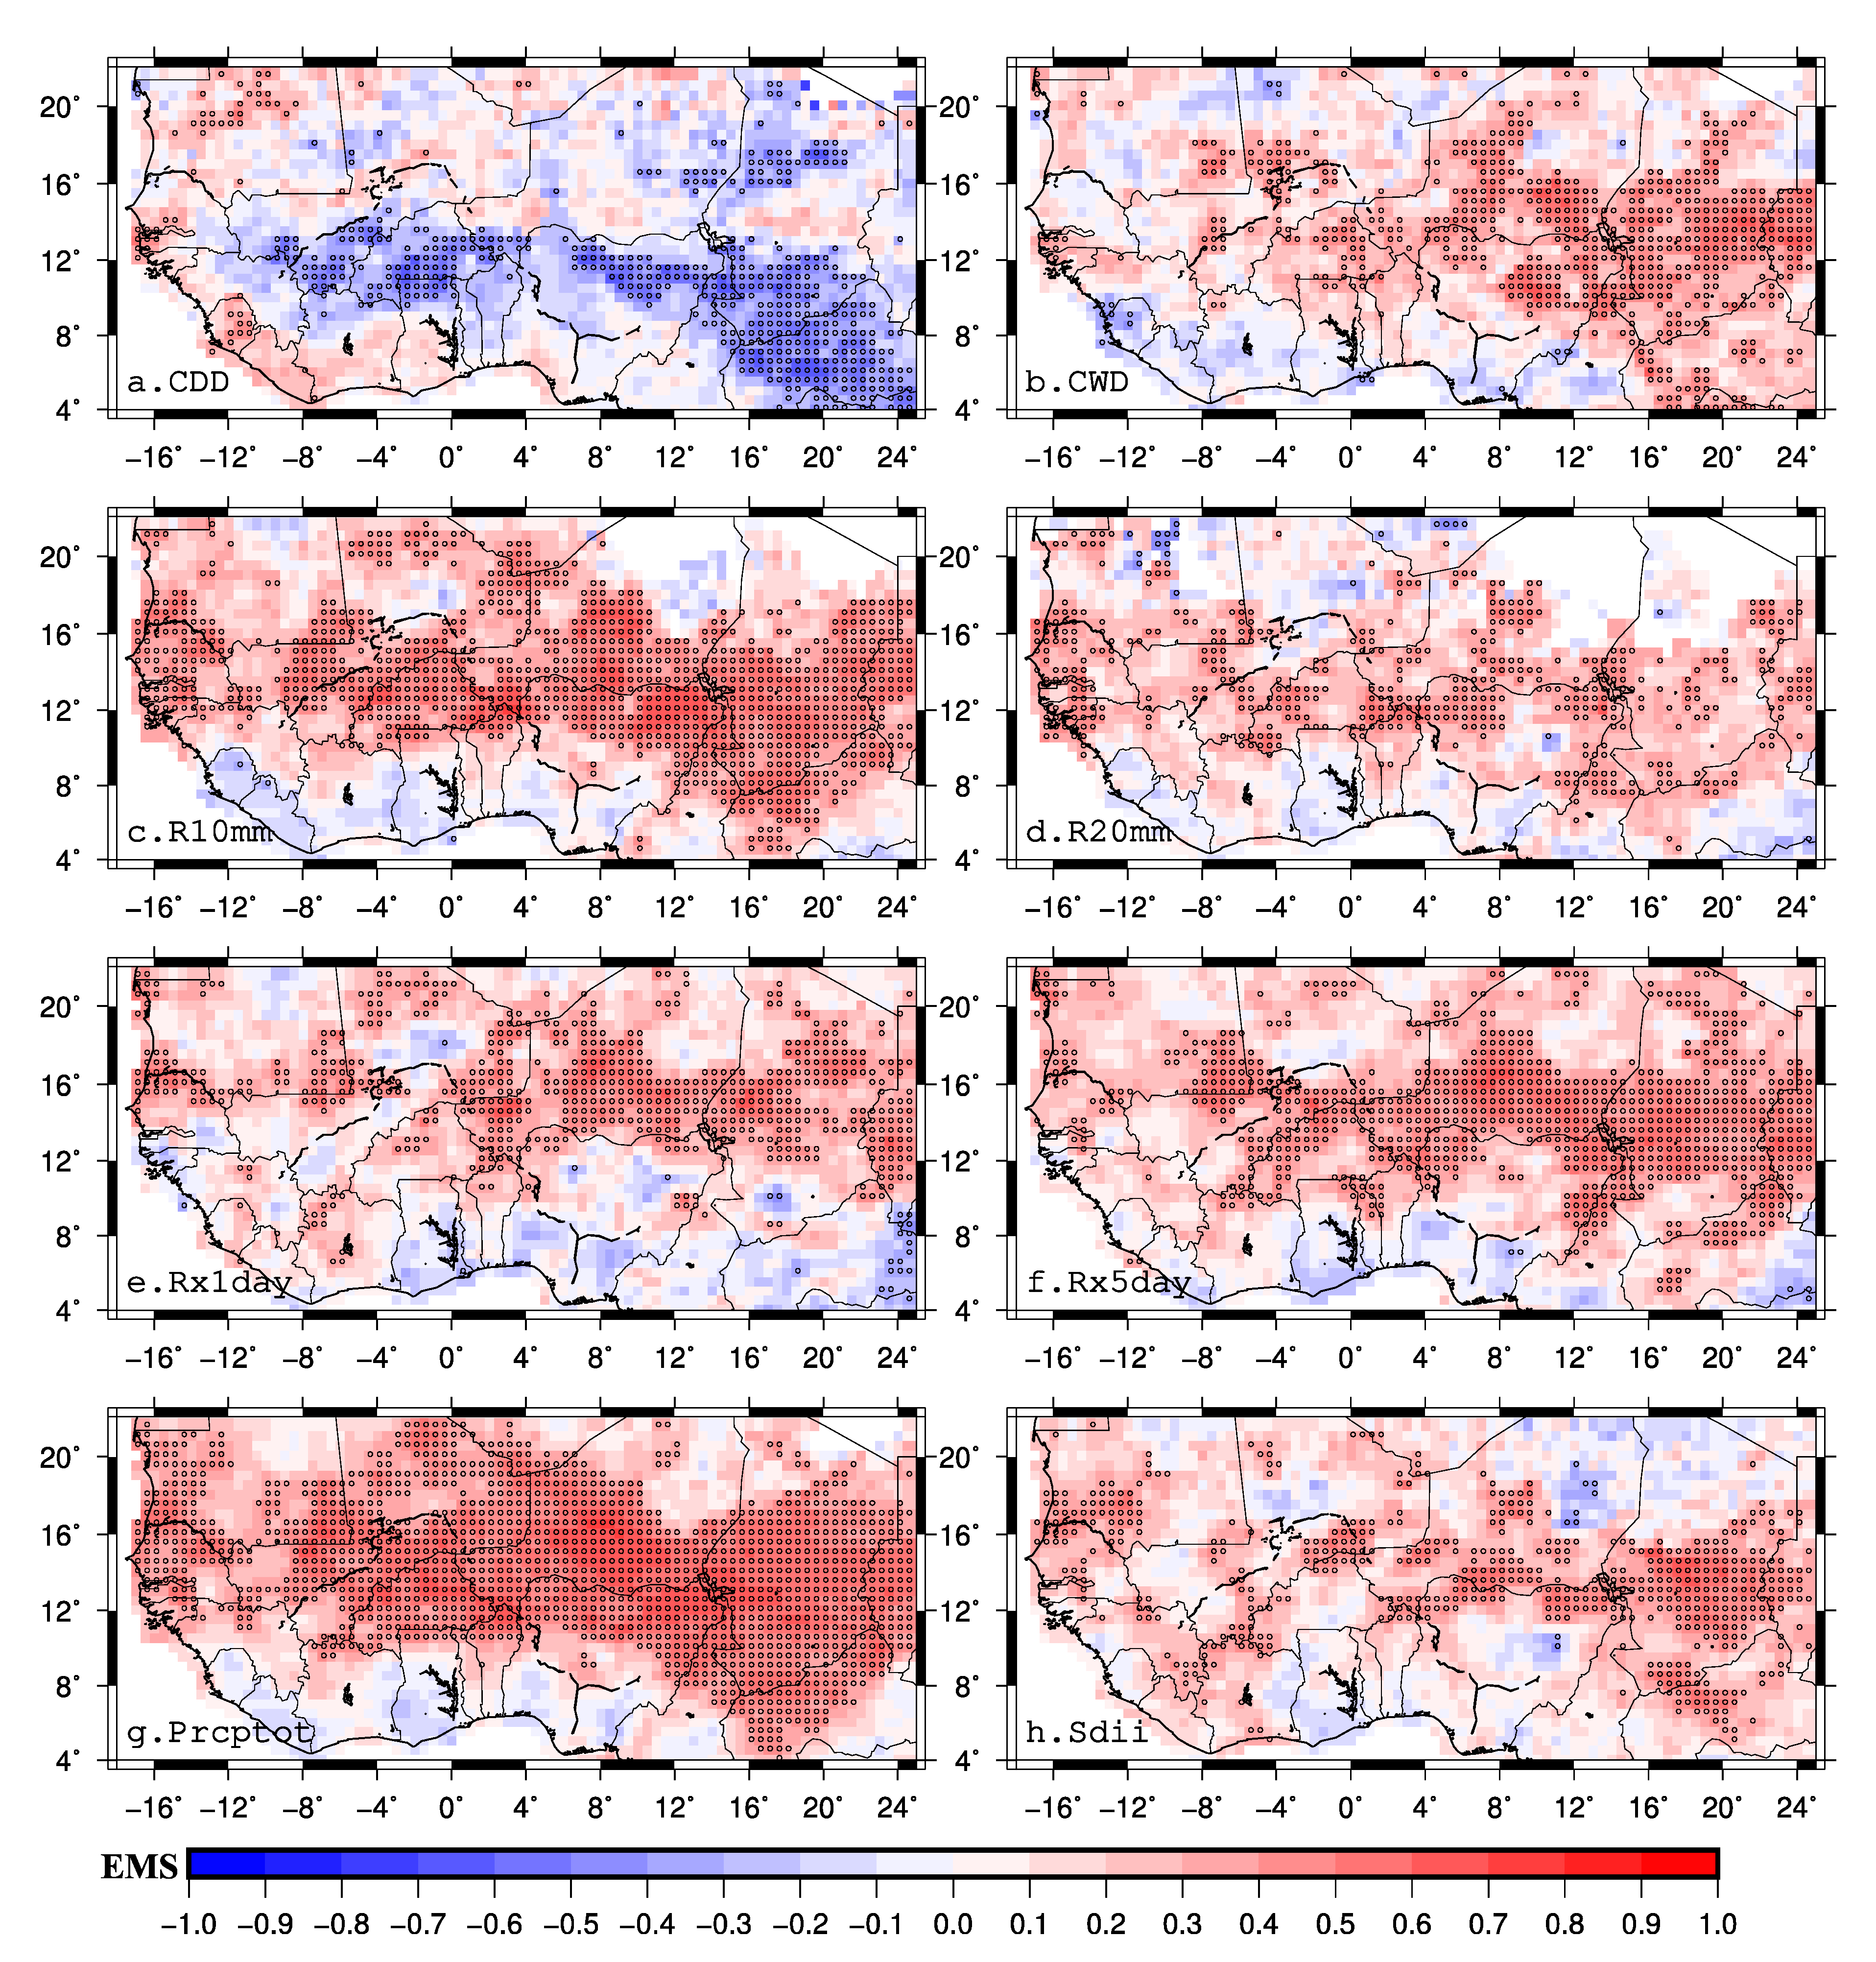
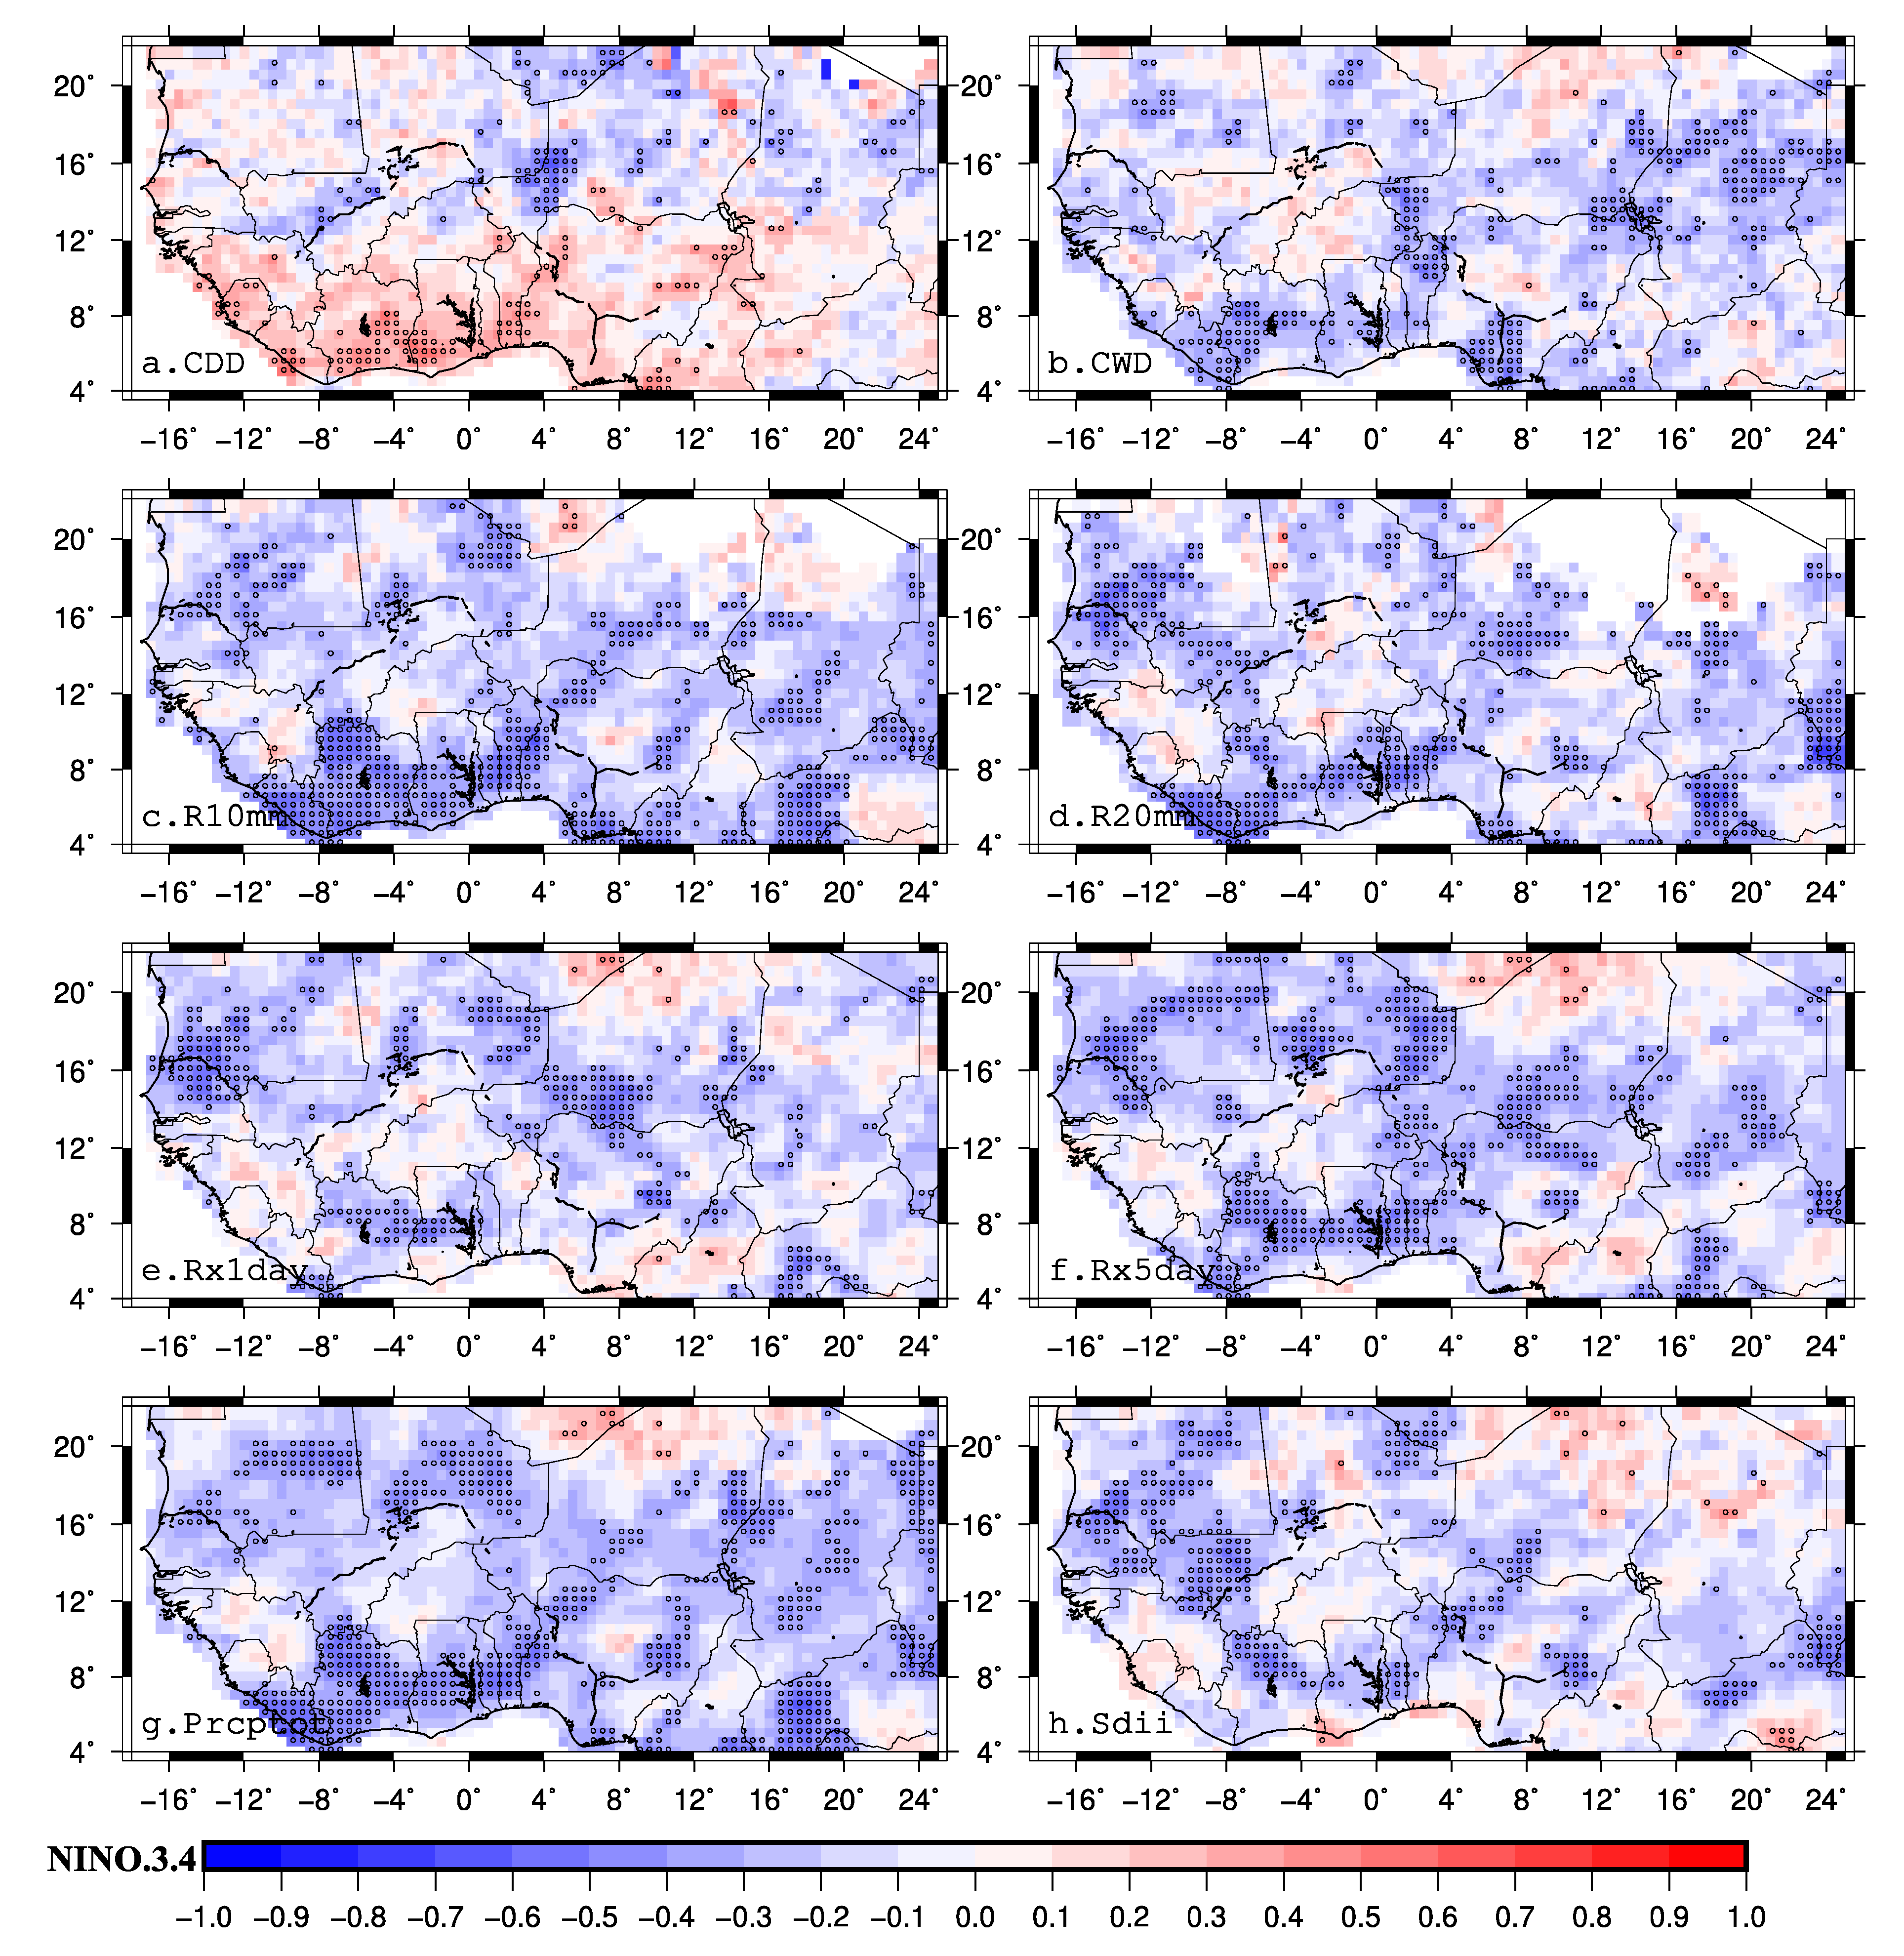
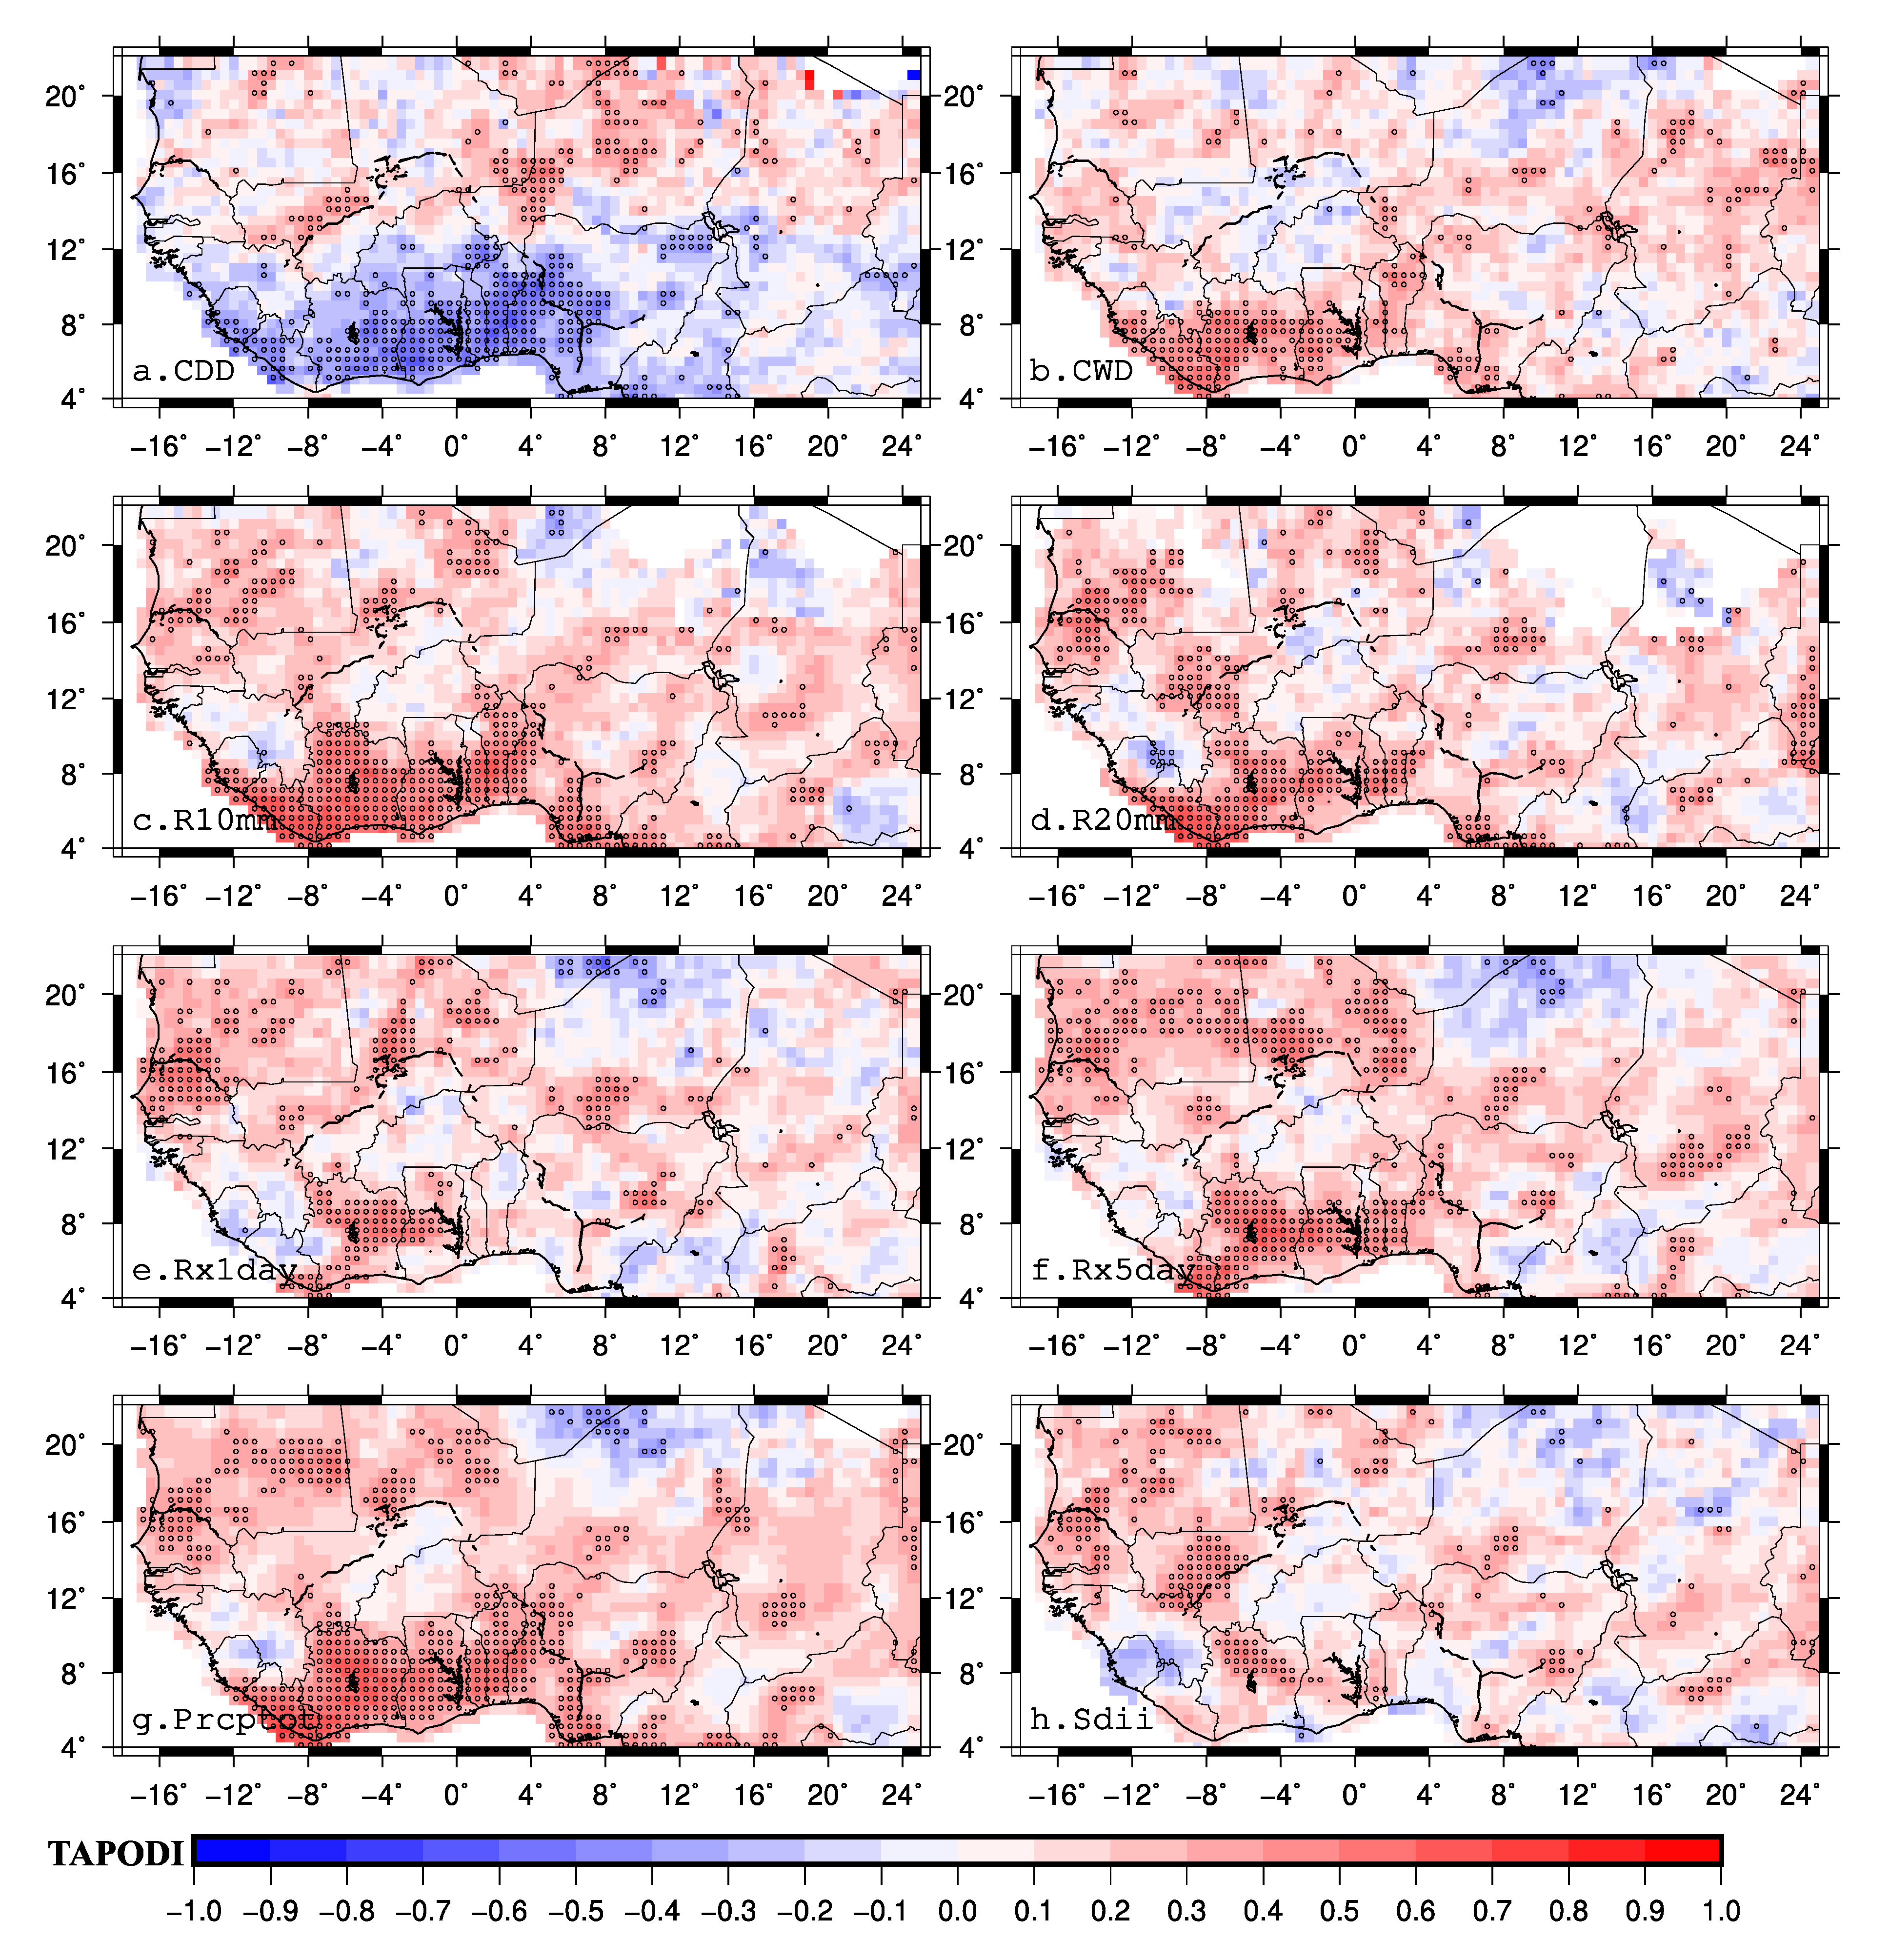
3.3. Teleconnection between Extreme Precipitation Indices and Remote Indices

The relationship between extreme precipitation indices and previously cited remote indices has been analyzed. The remote indices consist of various climate, ocean, or both state signals. To remove the influence of trend, the time series of extreme precipitation indices have been detrended and for maintaining the data consistency no processing of trend for the remote indices has been done. Figure 4 shows the correlation between each remote index and the extreme precipitation indices averaged over West Africa and West African subregions (Figure 4a). It’s seen from Figure 4b that MJO08 and NINO.3.4 have a negative and significant influence on extreme precipitation in West Africa, whereas ATL3, EMS, SAODI, TAPODI, and to lesser extent TSA do show positive and significant linkage to extreme precipitation. By considering the West African subregions individually, it comes that the EMS is the main driven teleconnection index for extreme precipitation in the Sahel (Figure 4c–e), besides, MJO08 and NINO.3.4 also show negative correlation respectively in West Sahel and Central Sahel with at least four extreme precipitation indices as shown in Figure 4c,d. Extreme precipitation indices averaged over western Guinean coast regions (Figure 4f) are influenced by several teleconnection indices (ATL3, NINO.3.4, NCTI, SAODI, TAPODI, and TSA), and the most relevant is the ATL3 index with high significant correlation. The other teleconnection indices also exhibit a very good relationship with extreme precipitation indices except with SDII and RX1day indices. NINO.3.4 (NCTI, SAODI, TAPODI, TSA) shows negative (positive) correlations except for CDD which presents a positive (negative) signal. Figure 4g highlights the previous association in the east Guinean coast, and only three remote indices do show significant association with extreme precipitation. The AMM and EMS are positively and significantly associated with at least five extreme precipitation indices, whereas NINO.3.4 presents negative and significant signals with the SDII, the PRCPTOT, the R10MM, and the R20MM.
In a second step, the spatial role of different teleconnection indices on the West African extreme precipitation has been evaluated and presented in the following sub-sections. However, a distinction is made between remote teleconnection indices that have been computed using areal averaged SSTs and those that indicate oscillation variability modes.

3.3.1. Extreme Precipitation, Oceanic Modes, Atmospheric Modes and Coupled Ocean-Atmosphere Modes

The correlation between oceanic, atmospheric, or coupled ocean-atmosphere modes and extreme precipitation is first investigated. Figure 5 illustrates the spatial correlation between AMM and extreme precipitation indices from 1982 to 2016. It appears that AMM does negatively impact the CDD index in West Africa that is more pronounced in the north-western and the south-eastern Sahel, however, the correlation is not significant and in some isolated areas the correlation is positive (Figure 5a). In opposite, AMM seems to be significantly and positively correlated to CWD only in the Western Sahel over Senegal and in the eastern-south Sahel (south of chad) as seen in Figure 5b. A similar pattern is observed with the other extreme precipitation indices (Figure 5c–g), the correlation is significant only in the previously cited areas and is more intense with the PRCPTOT index. These results are similar to [21] who suggest a closer physical relationship between AMM and rainfall in the western Sahel. We should note that the correlation between sdii index and AMM shows very sparse, low, and no significant values (Figure 5h). The Atlantic Multidecadal Oscillation (AMO) does show similar patterns that AMM, but the correlation values are not significant (not shown, see Figure S1 in Supplements Materials) excepted in ivory coast for R10mm, R20mm et PRCPTOT indices. These results suggest that the impacts of AMO on extreme precipitation variability are not well established as the significance test failed in this region. Ref. [24] without insisting on the significance test, have found a positive correlation between AMO and the annual wet-day rainfall total, whereas Ref. [21] found that AMO shows a positive linear correlation to Sahel rainfall that stems from periods longer than 8 years.
The NAO is a prominent mode of variability and is associated with change in wind strength and direction, heat and moisture transport, and strength of storms (namely in mid-latitude). Therefore, its influence on extreme precipitation in West Africa has been tested. The results show that the NAO index has no significant influence on extreme precipitation in West Africa (not shown, Figure S2).
The correlation behavior between the Madden Julian Oscillation phase 8 (MJO8) and extreme precipitation indices shows different patterns from an index to another. Figure 6 shows the spatial distribution of the correlation between MJO8 and extreme precipitation indices. MJO8 exhibits a positive relationship with the CDD index (Figure 6a) in most parts of West Sahel and especially in the southern Sahel but the correlation is sparse and not significant (except in southern chad). However, with the CWD the correlation is negative and significant in the southern Sahelian band, namely in western and central Sahel as observed in Figure 6b. The MJO8 is also negatively correlated with some wet indices (R10mm, R20mm) but the correlation test is only significant in southern West Africa and western Sahel (Figure 6c,d,g), and for occurrence indices like Rx1day and Rx5day, the significance of the correlation is located in the northern West Africa (Figure 6e,f). The PRCPTOT index seems to be closely linked to the MJO8 with a significant negative correlation in all West Africa except in the central Sahel as presented in Figure 6g. The sample daily intensity index (sdii) reveals a positive association with the MJO8 in the all Sahel that is no significance, and negative association in the Guinean coast area with significance signal around Ghana and southern Nigeria. On average, it is observed that the MJO8 has a more pronounced and direct negative significant link with the wet indices in western and southern West Africa. In the Sahel, the MJO is well negatively linked to the CWD index and failed to influence the other indices.

3.3.2. Correlation between SSTs Teleconnections and Extreme Precipitation

We now investigate connections between SSTs based indices and extreme precipitation variability, is included also ENSO signal. Figure 7 describes the correlation pattern between ATL3 and extreme precipitation indices variability. The wet-indices are positively well linked with ATL3 in the western-north Sahel and Guinean coast with a more distributed significance in the Guinean coast (Figure 7b–h). As expected, the cdd index is negatively and significantly correlated with ATL3 in the Guinean coast only (Figure 7a). These results are consistent with [21] findings and comforted by [23], that the ATL3 is in phase with the Guinean coast rainfall and the western Sahel in recent years. The extreme precipitation in the central Sahel does show a sparse and sometimes negative correlation with the ATL3 that is not significant. A similar pattern is observed with the TSA index, which is not a surprise as the ATL3 is partly located in the TSA delimitation region and frames the so-called cold tongue which is the key feature of the tropical Atlantic variability (not shown, Figure S3 in Supplements Materials). The TNA oceanic mode has been also evaluated unfortunately, it does show some signal with extreme precipitation in the western Sahel and very low and sparse correlation. However, these correlations are not significant, except in Senegal where some indices show little significance positive signal (not shown, Figure S4 in Supplements Materials). This finding is in opposition to [22] conclusions, they argue the role of TNA on the enhancement of the occurrence or moderate daily rainfall events in the Sahel. The index of SST intraseasonal oscillation on the northern front of the cold tongue called NCTI ([38]) has been associated with extreme precipitation indices in West Africa as shown in Figure 8. From the analysis, it appears that the NCTI is significantly and negatively (positively) linked to dry-index (wet-indices) as displayed in Figure 8a (Figure 8b–g) in the Guinean coast region and more specifically, areas directly or very close to the coast are more linked to NCTI influences. However, the sdii index seems to be indifferent to the NCTI impact. In the other regions of West Africa, the correlation is not significant with a negative and sparse signal in almost the Sahelian region.
The role of SST mode in the eastern Mediterranean on the extreme precipitation variability in West Africa is also evaluated. The correlation between the EMS and the extreme precipitation indices is displayed in Figure 9. The EMS shows strong, positive, and significant correlations with wet-indices in all the Sahel band, but these correlations are more pronounced in central and eastern Sahel as shown in Figure 9c–g. These results support the findings by [56] in the entire Sahel region, furthermore, Ref. [21] show evidence of a strong, positive, and significant correlation between EMS and rainfall in the central Sahel that stems on the interannual time scale. A similar conclusion is highlighted by [22] who suggest the influence of SST in the particular Mediterranean Sea on the enhancement of occurrence of moderate, heavy, and extreme daily rainfall events in the Sahel.
Figure 10 shows the association between low (high) wet-indices and warm (cold) NINO.3.4 over West Africa, but also low dry-index and cold NINO.3.4 However, these correlations show various behavior, for example, the cdd index gives a positive relationship with the NINO.3.4 in Guinean coast with a significance level in areas close to the coast. In the Sahelian region, it’s sparse and not significant with a positive value in the western Sahel and negative eastern Sahel around the west of Niger (Figure 10a). The wet-indices present negative association in the Guinean coast, in the western Sahel and in some areas in the northern Sahel as shown in Figure 10b–h. The strongest influence of ENSO on wet-indices is located over the Guinean coast except for the sdii which is more pronounced and significant in the western Sahel. These findings seem to be in agreement with [24], and with previous studies by [21] and earlier by [57]. Ref. [58] attribute the negative correlation of ENSO in the Guinean coast by the positive pacific SSTs coinciding with subsidence over the tropics. Similar results have been highlighted previously by [59], they suggested that over West Africa, El Niño events tend to result in enhanced northeasterlies/reduced monsoon flow, coupled to weakened upper easterlies, and hence dry conditions over West Africa in July–September.
The influence of remote teleconnection on extreme precipitation indices could be linked to well-known influence of tropical/Atlantic sea surface temperature anomalies on West African rainfall. Positive SST anomalies in the eastern equatorial pacific are found to coincide with negative rainfall anomalies over West Africa ([58]). A similar influence pattern on extreme precipitation is observed with NINO.3.4 By contrast, Ref. [58] showed also that positive SST anomalies in the eastern equatorial Atlantic are accompanied with negative rainfall anomalies in the Sahel and positive rainfall anomalies in the Guinean region. The analyses of the influence of ATL3, NINO.3.4 and EMS on West African extreme precipitation, show a complementarity. EMS is strongly linked to extreme wet-indices in Sahelian region, Ref. [56] has stated that warmer than average SSTs in Mediterranean Sea are often associated with wetter conditions over the Sahel, whereas cooler than average SSTs tend to favor drier conditions. Ref. [56] concluded to an atmospheric response to thermal Mediterranean forcing, a warmer SST leads to an increasing evaporation that enhance moisture content in the lower troposphere that is advected southwards into the Sahel by low-level mean flow and vice-versa.

3.3.3. SSTs Dipole-Like Indices and Extreme Precipitation

In this section, we highlight the impact of SSTs dipole-like indices on extreme precipitation variability. Figure 11 represents the correlation patterns between the Atlantic-pacific dipole index called TAPODI [32] and extreme precipitations indices. The positive (negative) phase of the TAPODI is characterized by warm (cool) sea surface temperature anomalies (SSTAs) in the tropical Atlantic and cool (warm) SSTAs in the tropical eastern Pacific Ocean. An opposite pattern of NINO.3.4 correlation to extreme precipitation is observed in West Africa; with negative (positive) and significant association between cdd index and TAPODI in Guinean coast (central Sahel) as shown in Figure 11a. For the wet-indices, the association with TAPODI is positive and significant both in the Guinean coast and in the western Sahel except with cwd where the significance of the relationship is only observed in the Guinean coast (Figure 11b–h). The strength of the correlation is more felt with absolute indices as annual total wet-day precipitation. Ref. [32] argue that the positive TAPODI composites are characterized by strong moisture convergence to the Guinean coast and the Sahel, and suggest the strengthening of westerly anomalies as earlier suggested by [60]. Further, they hypothesized the westerly origin over the equatorial eastern pacific as due to the temperature gradient between the Atlantic and the pacific. A quasi-similar correlation structure is observed when using the SAODI proposed by [40] which characterizes a dipole-like SST in the southern Atlantic Ocean (not shown, see Figure S5 in Supplements Materials), however the correlation coefficients the significance areas are stronger with the TAPODI signal. In a recent study, Ref. [23] without testing the impact of TAPODI, have observed a positive correlation between the SAODI and the Guinean coast rainfall index, but also tends to create a dipole pattern in West Africa with a band of positive correlation in Guinean coast and negative values in the Sahel. This result is well highlighted by our findings (see Figure S5 in Supplements Materials).
We should note that the coupling influence of eastern equatorial Pacific and Atlantic oceans seem to have also a key influence on precipitation as revealed by [60], who suggest that a zonal atmospheric coupling associated with differences of SST anomalies between the eastern Pacific and the Atlantic could enhance impacts on West African monsoon dynamics.

4. Conclusions

Using satellite rainfall data from CHIRPS spanning from 1982 to 2016, the spatial variability and trends of 8 extreme precipitation indices and their relationships with several climate/ocean patterns over West Africa during summer, have been analyzed. The spatial variability of CDD over West Africa ranges from more than 70 days in northern Sahel and Sahara band to 20 days in the central Sahel and less than 5 days in most parts of southern Sahel. The highest values of CWD are observed around high altitude regions, whereas the southern Sahel exhibit better the CWD distribution with 10 days in mean compared to other West African regions. A similar spatial pattern to CWD is observed with the R10mm and R20mm indices, however, the decreasing shift of the signal to southern West Africa is more pronounced with the R20mm than the R10mm. The spatial patterns of the Rx1day and Rx5day exhibit a decreasing rainfall from the Sahel to Guinean coast that is stronger in the Rx1day than the Rx5day. The absolute index (PRCTOT) and the mean precipitation amount on wet days related index (SDII) do follow the same spatial variability as previously indicated, with a respective range of 75 mm to 200 mm and 5 mm/day to more than 15 mm/days (out of the orographic regions). The trend analysis reveals that the CDD decreases in Sahel and Sahara (highest) and increases in the Guinean coast with a significant trend. As for the CWD, it increases a little bit in Western Sahel over Senegal and decreases with a low rate but significant in the eastern Guinean coast. The R10mm and R20mm give a positive trend in the Sahel region which is more observed with the R10mm index, an opposite pattern is observed in the Guinean coast region. The two absolute indices (RX1day and RX5day) do show a double dipole-like pattern when moving from the Sahel to the coast, with a positive trend in central and northern Sahel, a negative trend in Guinean coast and again a positive trend in areas directly to the coast in the Guinean coast region. A statistically significant and positive trend has been detected for the PRCTOT in all the Sahel band, however, some constant trend is observed in the western Sahel, a similar trend is exhibited by the SDII with a significant behavior located in the central Sahel. Ref. [6] have highlighted a statistically significant increase in the number of wet days and a decrease in the number of dry days over the Sahel.
From correlation analysis, extreme precipitation of all Sahel is strongly teleconnected to the EMS, whereas western and western-north Sahel is associated with both AMM, MJO8, NINO.3.4, and TAPODI but with different characteristics or directions. Guinean coast extreme precipitation is highly associated with ATL3, NCTI, TAPODI but also with an opposite sign with NINO.3.4 and in somewhat with the MJO8. The influence of the teleconnection patterns in West Africa do not act in isolation and their interaction could more affect the precipitation variability as highlighted by [18] or [19]. Further analyses are still needed to assess the climate and ocean large scale influence on extreme precipitation variability. Highlighting the contribution of each identified remote indices in influencing the extreme precipitation will an added value for extreme events forecasts. Indeed, statistical regression technique for seasonal precipitation including extreme precipitation forecasting in West Africa must consider different teleconnection indices for which the influence of the predictors may change. The combined influence of multiple teleconnection affects the accurate seasonal forecasting of (extreme) precipitations and contributes to increase social vulnerability in West Africa. Therefore, it is crucial for West African policy makers to consider implementing adaptation strategies and mitigation measures.

Supplementary Materials

The following are available online at https://www.mdpi.com/2073-4433/11/9/999/s1, Table S1: Remote indices downloaded online, Figure S1: Correlation patterns between AMO and extreme precipitation indices. Tipping points represent significant correlation areas using effective degree of freedom. Figure S2: as for Figure S1 but for NAO. Figure S3: as for Figure S1 but for TSA. Figure S4: as for Figure S1 but for TNA. Figure S5: as for Figure S1 but for TAPODI.

Author Contributions

Conceptualization, S.D.; Data curation, S.D., C.W.D.; methodology, S.D., S.S.; formal analysis, S.D., C.W.D., D.M.D. and S.S., and writing—original draft preparation, S.D., S.S.; writing—review and editing, S.D.; visualization, S.D., C.W.D., S.M.D.; supervision, S.D., S.S. All authors have read and agreed to the published version of the manuscript.

Funding

This research received no external funding.

Acknowledgments

The authors acknowledge support by the Assane Seck University of Ziguinchor. The authors thank the two anonymous reviewers for their fruitful comments that helped to greatly improve the manuscript.

Conflicts of Interest

The authors declare no conflict of interest.

References

  1. Easterling, D.R.; Evans, J.L.; Groisman, P.Y.; Karl, T.R.; Kunkel, K.E.; Ambenje, P. Observed variability and trends in extreme climate events: A brief review. Bull. Am. Meteor Soc. 2000, 81, 417–425. [Google Scholar] [CrossRef] [Green Version]
  2. Tebaldi, C.; Hayhoe, K.; Arblaster, J.M.; Meehl, G.A. Going to the extremes: An intercomparison of model-simulated historical and future changes in extreme events. Clim. Chang. 2006, 79, 185–211. [Google Scholar] [CrossRef]
  3. Seneviratne, S.I.; Nicholls, N.; Easterling, D. Changes in climate extremes and their impacts on the natural physical environment in managing the risks of extreme events and disasters to advance climate change adaptation. In A Special Report of Working Group I and II of the Intergouvernmental Panel on Climate Change; Fielb, C.B., Barros, V., Stocker, T.F., Eds.; IPCC: Cambridge, UK, 2012; pp. 109–230. [Google Scholar]
  4. Ly, M.; Traore, S.B.; Alhassane, A.; Sarr, B. Evolution of some observed climate extremes in the West African Sahel. Weather Clim. Ext. 2013, 1, 19–25. [Google Scholar] [CrossRef] [Green Version]
  5. Taylor, C.M.; Belušić, D.; Guichard, F.; Parker, D.J.; Vischel, T.; Bock, O.; Harris, P.P.; Janicot, S.; Klein, C.; Panthou, G. Frequency of extreme Sahelian storms tripled since 1982 in satellite observations. Nature 2017, 544, 475–478. [Google Scholar] [CrossRef] [Green Version]
  6. Odoulami, R.C.; Akinsanola, A.A. Recent assessment of West African summer monsoon daily rainfall trends. Weather 2017, 73, 283–287. [Google Scholar] [CrossRef]
  7. Panthou, G.; Lebel, T.; Vischel, T.; Quantin, G. Rainfall intensification in tropical semi-arid regions: The Sahelian case. Environ. Res. Lett. 2018, 13, 064013. [Google Scholar] [CrossRef]
  8. Salack, S.; Saley, I.A.; Lawson, N.Z.; Zabré, I.; Daku, E.K. Scales for rating heavy rainfall events in the West African Sahel. Weather Clim. Extrem. 2018, 21, 36–42. [Google Scholar] [CrossRef]
  9. Rowell, D.P.; Folland, C.K.; Maskell, K.; Ward, N.M. Variability of summer rainfall over tropical north Africa (1906–92): Observations and modelling. Q. J. R. Meteorol. Soc. 1995, 121, 669–704. [Google Scholar] [CrossRef]
  10. Janicot, S. Spatiotemporal variability of West African rainfall. Part II: Associated surface and airmass characteristics. J. Clim. 1992, 5, 499–511. [Google Scholar] [CrossRef] [Green Version]
  11. Zeng, N.; Neelin, J.D.; Lau, K.M.; Tucker, C.J. Enhancement of inter- decadal climate variability in the Sahel by Vegetation interaction. Science 1999, 286, 1537–1540. [Google Scholar] [CrossRef] [Green Version]
  12. Giannini, A.; Saravanan, R.; Chang, P. Oceanic forcing of Sahel rainfall on interannual to interdecadal time scales. Science 2003, 302, 1027–1030. [Google Scholar] [CrossRef] [PubMed] [Green Version]
  13. Biasutti, M.; Held, I.M.; Sobel, A.H.; Giannini, A. SST forcings and Sahel rainfall variability in simulations of the twentieth and twenty-first centuries. J. Clim. 2008, 21, 3471–3486. [Google Scholar] [CrossRef] [Green Version]
  14. Hoerling, M.; Hurrell, J.; Eischeid, J.; Phillips, A. Detection and attribution of twentieth-century northern and southern African rainfall change. J. Clim. 2006, 19, 3989–4008. [Google Scholar] [CrossRef]
  15. Losada, T.; Rodríguez-Fonseca, B.; Janicot, S.; Gervois, S.; Chauvin, F.; Ruti, P. A multi-model approach to the Atlantic equatorial mode: Impact on the West African monsoon. Clim. Dyn. 2010, 35, 29–43. [Google Scholar] [CrossRef]
  16. Losada, T.; Rodriguez-Fonseca, B.; Mohino, E.; Bader, J.; Janicot, S.; Mechoso, C.R. Tropical SST and Sahel rainfall: A non-stationary relationship. Geophys. Res. Lett. 2012, 39, 12705. [Google Scholar] [CrossRef] [Green Version]
  17. Rodríguez-Fonseca, B.; Polo, I.; García-Serrano, J.; Losada, T.; Mohino, E.; Mechoso, C.R.; Kucharski, F. Are Atlantic Niños enhancing Pacific ENSO events in recent decades? Geophys. Res. Lett. 2009, 36, 20705. [Google Scholar] [CrossRef]
  18. Janicot, S.; Trzaska, S.; Poccard, I. Summer Sahel-ENSO teleconnection and decal time scale SST variation. Clim. Dyn. 2001, 18, 303–320. [Google Scholar] [CrossRef]
  19. Rowell, P.D. Teleconnections between the tropical Pacific and the Sahel. Q. J. R. Meteorol. Soc. 2001, 127, 1683–1706. [Google Scholar] [CrossRef]
  20. Ndehedehe, C.E.; Agutu, N.O.; Ferreira, V.G.; Getirana, A. Evolutionary drought patterns over the Sahel and their teleconnection with low frequency climate oscillations. Atmos. Res. 2020, 233, 104700. [Google Scholar] [CrossRef] [Green Version]
  21. Diatta, S.; Fink, A.H. Statistical relationship between remote climate indices and West African monsoon variability. Int. J. Climatol. 2014, 34, 3348–3367. [Google Scholar] [CrossRef]
  22. Diakhaté, M.; Rodríguez-Fonseca, B.; Gómara, I.; Mohino, E.; Dieng, A.L.; Gaye, A.T. Oceanic forcing on interannual variability of Sahel heavy and moderate daily rainfall. J. Hydrometeorol. 2019, 20, 397–410. [Google Scholar] [CrossRef]
  23. Worou, K.; Goosse, H.; Fichefet, T.; Guichard, F.; Diakhate, M. Interannual variability of rainfall in the Guinean Coast region and its links with sea surface temperature changes over the twentieth century for the different seasons. Clim Dyn. 2020, 1–22. [Google Scholar] [CrossRef]
  24. Atiah, W.A.; Tsidu, G.M.; Amekudzi, L.K.; Yorke, C. Trends and interannual variability of extreme rainfall indices over Ghana, West Africa. Theor. Appl. Climatol. 2020, 140, 1393–1407. [Google Scholar] [CrossRef]
  25. Akinsanola, A.A.; Zhou, W. Projections of West African summer monsoon rainfall extremes from two CORDEX models. Clim. Dyn. 2018, 52, 2017–2028. [Google Scholar] [CrossRef]
  26. Funk, C.; Peterson, P.; Landsfeld, M.; Pedreros, D.; Verdin, J.; Shukla, S.; Husak, G.; Rowland, J.; Harrison, L.; Hoell, A.; et al. The climate hazards infrared precipitation with stations—A new environmental record for monitoring extremes. Sci. Data 2015, 2, 150066. [Google Scholar] [CrossRef] [Green Version]
  27. Maidment, R.I.; Allan, R.P.; Black, E. Recent observed and simulated changes in precipitation over Africa. Geophys. Res. Lett. 2015, 42, 8155–8164. [Google Scholar] [CrossRef]
  28. Bichet, A.; Diedhiou, A. West African Sahel has become wetter during the last 30 years, but dry spells are shorter and more frequent. Clim. Res. 2018, 75, 155–162. [Google Scholar] [CrossRef] [Green Version]
  29. Bichet, A.; Diedhiou, A. Less frequent and more intense rainfall along the coast of the Gulf of Guinea in West and Central Africa (1981–2014). Clim. Res. 2018, 76, 191–201. [Google Scholar] [CrossRef] [Green Version]
  30. Kevin, E.T.; David, P. Stepaniak: Indices of El Niño evolution. J. Clim. 2001, 14, 1697–1701. [Google Scholar]
  31. Zebiak, S.E. Air-sea interaction in the equatorial Atlantic region. J. Clim. 1993, 6, 1567–1586. [Google Scholar] [CrossRef]
  32. Lin, Z.; Dike, V.N. Impact of Trans-Atlantic-Pacific Ocean Dipole–like pattern on summer precipitation variability over West Africa. Atmos. Ocean. Sci. Lett. 2018, 11, 509–517. [Google Scholar] [CrossRef] [Green Version]
  33. Barnston, A.G.; Livezey, R.E. Classifications, seasonality, and persistence of low-frequency atmospheric circulation patterns. Mon. Weather Rev. 1987, 115, 1083–1126. [Google Scholar] [CrossRef]
  34. Wilbur, Y.C.; Dool, H.V.d. Sensitivity of teleconnection patterns to the sign of their primary action center. Mon. Weather Rev. 2003, 131, 2885–2899. [Google Scholar]
  35. Higgins, R.W.; Schubert, S.D. Simulations of persistent North Pacific circulation anomalies and interhemispheric teleconnections. J. Atmos. Sci. 1996, 53, 188–207. [Google Scholar] [CrossRef] [Green Version]
  36. Chiang, J.C.H.; Vimont, D.J. Analogous Pacific and Atlantic Meridional modes of tropical atmosphere–ocean variability. J. Clim. 2004, 17, 4143–4158. [Google Scholar] [CrossRef]
  37. Enfield, D.B.; Mestas-Nuñez, A.M.; Trimble, P.J. The Atlantic multidecadal oscillation and its relation to rainfall and riverflows in the continental US. Geophys. Res. Lett. 2001, 28, 2077–2080. [Google Scholar] [CrossRef] [Green Version]
  38. Coëtlogon, G.D.; Janicot, S.; Lazar, A. Intraseasonal variability of the ocean–atmosphere coupling in the Gulf of Guinea during boreal spring and summer. Q. J. R. Meteorol. Soc. 2010, 136, 426–441. [Google Scholar] [CrossRef]
  39. Enfield, D.B.; Mestas, A.M.; Mayer, D.A.; Cid-Serrano, L. How ubiquitous is the dipole relationship in tropical Atlantic sea surface temperatures? J. Geophys. Res. 1999, 104, 7841–7848. [Google Scholar] [CrossRef]
  40. Nnamchi, H.C.; Li, J. Influence of the south Atlantic Ocean dipole on west african summer precipitation. J. Clim. 2011, 24, 1184–1197. [Google Scholar] [CrossRef]
  41. Frich, P.; Alexander, L.V.; Della-Marta, P.; Gleason, B.; Haylock, M.; Tank, A.M.G.K.; Peterson, T. Observed coherent changes in climatic extremes during the second half of the twentieth century. Clim. Res. 2002, 19, 193–212. [Google Scholar] [CrossRef] [Green Version]
  42. Zhang, X.; Alexander, L.; Hegerl, G.C.; Jones, P.; Tank, A.K.; Peterson, T.C.; Trewin, B.; Zwiers, F.W. Indices for monitoring changes in extremes based on daily temperature and precipitation data. Wiley Interdiscip. Rev. Clim. Chang. 2011, 2, 851–870. [Google Scholar] [CrossRef]
  43. Alexander, L.; Herold, N. ClimPACT2 Indices and Software; University of South Wales: Sidney, Australia, 2016; Available online: https://github.com/ARCCSS-extremes/climpact2/ (accessed on 1 August 2020).
  44. Mann, H.B. Nonparametric tests against trend. Econometrica 1945, 13, 245–259. [Google Scholar] [CrossRef]
  45. Kendall, M.G. Rank Correlation Methods; Charles Griffin: London, UK, 1975; p. 1955. [Google Scholar]
  46. Sen, P.K. Estimates of the regression coefficient based on Kendall’s Tau. J. Amer. Stat. Assoc. 1968, 63, 1379–1389. [Google Scholar] [CrossRef]
  47. Song, X.; Song, S.; Sun, W.; Mu, X.; Wang, S.; Li, J.; Li, Y. Recent changes in extreme precipitation and drought over the Songhua River Basin, China, during 1960–2013. Atmos. Res. 2015, 157, 137–152. [Google Scholar] [CrossRef]
  48. Tsidu, G.M. Secular spring rainfall variability at local scale over Ethiopia: Trend and associated dynamics. Theorem Appl. Climatol. 2017, 130, 91–106. [Google Scholar] [CrossRef]
  49. Manzanas, R.; Amekudzi, L.; Preko, K.; Herrera, S.; Gutiérrez, J. Precipitation variability and trends in Ghana: An intercomparison of observational and reanalysis products. Clim Chan. 2014, 124, 805–819. [Google Scholar] [CrossRef] [Green Version]
  50. Frazier, A.G.; Giambelluca, T.W. Spatial trend analysis of Hawaiian rainfall from 1920 to 2012. Int. J. Climatol. 2016, 37, 2522–2531. [Google Scholar] [CrossRef]
  51. Pedron, I.T.; Silva, D.M.A.; Dias, S.d.P.; Carvalho, L.M.; Freitas, E.D. Trends and variability in extremes of precipitation in Curitiba–Southern Brazil. Int. J. Climatol. 2017, 37, 1250–1264. [Google Scholar] [CrossRef]
  52. Casanueva, A.; Rodríguez-Puebla, C.; Frías, M.D.; González-Reviriego, N. Variability of extreme precipitation over Europe and its relationships with teleconnection patterns. Hydrol. Earth Syst. Sci. 2014, 18, 709–725. [Google Scholar] [CrossRef] [Green Version]
  53. Taubenheim, J. Statistische Auswertung Geophysikalischer Und Meteorologischer Daten; Akadem Verlag: Leipzig, Germany, 1969. (In German) [Google Scholar]
  54. Fink, A.; Speth, P. Some potential forcing mechanisms of the year- to-year variability of the tropical convection and its intraseasonal (25–70-day) variability. Int. J. Climatol. 1997, 17, 1513–1534. [Google Scholar] [CrossRef]
  55. Sanogo, S.; Fink, A.H.; Omotosho, J.A.; Ba, A.; Red, R.; Ermert, V. Spatio-temporal characteristics of the recent rainfall recovery in West Africa. Int. J. Climatol. 2015, 35, 4589–4605. [Google Scholar] [CrossRef]
  56. Rowell, D.P. The impact of Mediterranean SSTs on the Sahelian rainfall season. J. Clim. 2003, 16, 849–862. [Google Scholar] [CrossRef]
  57. Clark, C.O.; Webster, P.J.; Cole, J.E. Interdecadal variability of the relationship between the Indian ocean zonal mode and east African coastal rainfall anomalies. J. Clim. 2003, 16, 548–554. [Google Scholar] [CrossRef] [Green Version]
  58. Janicot, S.; Harzallah, A.; Fontaine, B.; Moron, V. West African mon-soon dynamics and eastern equatorial Atlantic and pacific sst anomalies (1970–88). J. Clim. 1998, 11, 1874–1882. [Google Scholar] [CrossRef]
  59. Camberlin, P.; Janicot, S.; Poccard, I. Seasonality and atmospheric dynamics of the teleconnection between African rainfall and tropical sea-surface temperature: Atlantic vs. ENSO. Int. J. Climatol. 2001, 21, 973–1005. [Google Scholar] [CrossRef]
  60. Pu, B.; Cook, K.H. Role of the West African westerly jet in sahel rainfall variations. J. Clim. 2012, 25, 2880–2896. [Google Scholar] [CrossRef]
Figure 1. Mean seasonal variability of extreme precipitation indices over West Africa. (a) CDD, (b) CWD, (c) R10mm, (d) R20mm, (e) Rx1day, (f) Rx5day, (g) Prcptot and (h) Sdii.
Atmosphere 11 00999 g001
Figure 2. Seasonal (JJAS) Trends of extreme precipitation indices in West Africa from 1982 to 2016. Stripping points represent significant trend, black shaded indicates values lower than −1 and white shaded, values greater than 1. (a) CDD, (b) CWD, (c) R10mm, (d) R20mm, (e) Rx1day, (f) Rx5day, (g) Prcptot and (h) Sdii.
Atmosphere 11 00999 g002
Figure 3. Seasonal (JJAS) probability density function for extreme precipitation indices over Sahel from 1982 to 2015 for two periods: 1982–1998 and 1999–2015. (a) CDD (days), (b) CWD (days), (c) R10mm (days), (d) R20mm (days), (e) Rx1day (mm), (f) Rx5day (mm), (g) Prcptot (mm) and (h) Sdii (mm/day).
Atmosphere 11 00999 g003
Figure 4. Correlation matrix between West Africa sub-regions extreme precipitation indices and remote climate indices. (a) West Africa subregions delimitation, (b) correlation between averaged extreme precipitation indices in West Africa and remote indices, (cg) correlation between averaged extreme precipitation indices in subregions and remote indices.
Atmosphere 11 00999 g004
Figure 5. Correlation patterns between AMM and extreme precipitation indices. Tipping points represent significant correlation areas using EDOF. (a) CDD, (b) CWD, (c) R10mm, (d) R20mm, (e) Rx1day, (f) Rx5day, (g) Prcptot and (h) Sdii.
Atmosphere 11 00999 g005
Figure 6. Correlation patterns between MJO8 and extreme precipitation indices. Tipping points represent significant correlation areas using EDOF. (a) CDD, (b) CWD, (c) R10mm, (d) R20mm, (e) Rx1day, (f) Rx5day, (g) Prcptot and (h) Sdii.
Atmosphere 11 00999 g006
Figure 7. Correlation patterns between ATL3 and extreme precipitation indices. Tipping points represent significant correlation areas using EDOF. (a) CDD, (b) CWD, (c) R10mm, (d) R20mm, (e) Rx1day, (f) Rx5day, (g) Prcptot and (h) Sdii.
Atmosphere 11 00999 g007
Figure 8. Correlation patterns between NCTI and extreme precipitation indices. Tipping points represent significant correlation areas using EDOF. (a) CDD, (b) CWD, (c) R10mm, (d) R20mm, (e) Rx1day, (f) Rx5day, (g) Prcptot and (h) Sdii.
Atmosphere 11 00999 g008
Figure 9. Correlation patterns between EMS and extreme precipitation indices. Tipping points represent significant correlation areas using EDOF. (a) CDD, (b) CWD, (c) R10mm, (d) R20mm, (e) Rx1day, (f) Rx5day, (g) Prcptot and (h) Sdii.
Atmosphere 11 00999 g009
Figure 10. Correlation patterns between NINO.3.4 and extreme precipitation indices. Tipping points represent significant correlation areas using EDOF. (a) CDD, (b) CWD, (c) R10mm, (d) R20mm, (e) Rx1day, (f) Rx5day, (g) Prcptot and (h) Sdii.
Atmosphere 11 00999 g010
Figure 11. Correlation patterns between TAPODI and extreme precipitation indices. Tipping points represent significant correlation areas using EDOF. (a) CDD, (b) CWD, (c) R10mm, (d) R20mm, (e) Rx1day, (f) Rx5day, (g) Prcptot and (h) Sdii.
Atmosphere 11 00999 g011
Table 1. List of tested remote or teleconnection indices in controlling extreme precipitation indices in West Africa. Indices in bold are calculated from the HadISST.
IndicesFull NameReference
NINO.3.4 (5° S–5° N; 120°–170° W)El Niño 3.4 index[30]
ATL3 (0°–20° W, 3° S–3° N)Atlantic Zone 3 SST anomaly[31]
TAPODI [(15° N–15° S, 75° W–10° E)–(15°–15° N, 80° W–120° W)]Trans-Atlantic-Pacific-Ocean dipole index[32]
NAO [(35–45 N, 70 W–10 W)–(55–70 N, 70W–10 W)]North Atlantic Oscillation Index[33,34]
MJOMadden Julian Oscillation-Phase 8[35]
AMMAtlantic Meridional Mode[36]
AMOAtlantic Multidecadal Oscillation[37]
EMS (15° E–36° E, 23° N–36° N)Eastern Mediterranean Sea SST anomalyUsed in [21]
NCTI (4° W–8° W, 0.5° S–1° N)Northern Cold Tongue Index[38]
TSA (0°–20 S and 10 E–30 W)Tropical Southern Atlantic Index[39]
TNA (5.5 N–23.5 N, 15 W–57.5 W)Tropical Northern Atlantic Index[39]
SAODI [(20° W–10° E, 0°–15° S)–(10–40° W, 25°–40° S)]Southern Atlantic Ocean Dipole Index[40]
Table 2. List of used extreme precipitation indices.
IndicesIndices NameDefinitionUnit
CDDConsecutive dry dayMaximum annual number of consecutive dry days (when PR < 1.0 mm)days
CWDConsecutive wet dayMaximum annual number of consecutive wet days (when PR > 1.0 mm)days
Rx1dayMax 1-day PRMaximum 1-day PR totalmm
Rx5dayMax 5-day PRMaximum 5-day PR totalmm
R20mmNumber of very heavy rain daysNumber of days when PR ≥ 20 mmdays
R10mmNumber of heavy rain daysNumber of days when PR ≥ 10 mmdays
SDIIDaily PR intensityDaily PR intensity Annual total PR divided by the number of wet days (when total PR ≥ 1.0 mm)mm/day
PRCTOTAnnual total wet-day precipitationPrecipitation from wet days (P ≥ 1 mm)mm

