Article

Analysis of Severe Elevated Thunderstorms over Frontal Surfaces Using DCIN and DCAPE

1
Atmospheric Science Program, School of Natural Resources, University of Missouri, Columbia, MO 65211, USA
2
Cooperative Institute for Mesoscale Meteorological Studies, University of Oklahoma, Norman, OK 73019, USA
*
Author to whom correspondence should be addressed.
Atmosphere 2019, 10(8), 449; https://doi.org/10.3390/atmos10080449
Submission received: 28 June 2019 / Revised: 31 July 2019 / Accepted: 2 August 2019 / Published: 5 August 2019
(This article belongs to the Special Issue 10th Anniversary of Atmosphere: Climatology and Meteorology)

Abstract

:
A 10-year study of elevated severe thunderstorms was performed using The National Centers for Environmental Information Storm Events Database. A total of 80 elevated thunderstorm cases were identified, verified, and divided into “Prolific” and “Marginal” classes. These severe cases occurred at least 80 km away from, and on the cold side of, a surface boundary. The downdraft convective available potential energy (DCAPE), downdraft convective inhibition (DCIN), and their ratio are tools to help estimate the potential for a downdraft to penetrate through the depth of a stable surface layer. The hypothesis is that as the DCIN/DCAPE ratio decreases, there exists enhanced possibility of severe surface winds. Using the initial fields from the Rapid Refresh numerical weather prediction model, datasets of DCIN, DCAPE, and their ratio were created. Mann-Whitney U tests on the Prolific versus Marginal case sets were undertaken to determine if the DCAPE and DCIN values come from different populations for the two different case sets. Results show that the Prolific cases have values of DCIN closer to zero, suggesting the downdraft is able to penetrate to the surface causing severe winds. Thus, comparing DCIN and DCAPE is a viable tool in determining if downdrafts will reach the surface from elevated thunderstorms.

1. Introduction

The generalized definition of elevated convection is “convection that originates from an atmospheric layer above the boundary layer.” [1] An early climatology of such thunderstorm events above a frontal surface by [2] showed that such storms typically occurred poleward of a surface boundary (often a warm front). While surface weather induced by elevated convection is most commonly associated with heavy rainfall [3,4,5,6], some studies have indicated that severe hail, winds, and even tornadoes have been observed with elevated thunderstorms [7,8,9]. Grant [7] found 11 cases of elevated convection producing severe weather over a two-year period, while [8] extended this study to five years. Of the 11 cases found in [7], most were hail. In comparison, [8] found 129 severe elevated cases in which 59% of the reports were hail, 37% were wind, and 4% were tornadoes. As can be seen with [8], severe winds did occur more often in their dataset, yet, they corroborated [7] and found that when elevated convection produced severe weather, it was most frequently hail.
A few studies have considered the idea that if a downdraft would have enough energy to penetrate through the surface stable layer, then severe winds will be observed at the surface [8,10]. Horgan et al. [8] went on to consider that some events may exhibit severe winds from gravity waves as a result of surface pressure gradients moving on the cold surface layer (e.g., [11,12]). Kuchera and Parker [13] also proposed models of “cold-sector” convection that did and did not produce winds that reached severe criteria. The modeling work of [14] highlighted the strong near-surface static stability needed to keep downdraft parcels from reaching the surface. Additional modeling work [15] focused on an elevated supercell and found that dynamic lifting within the near-surface layer, followed by descent due to strong negative buoyancy helped to induce winds of severe criteria in the modelled environment.
Market et al. [10] proposed and applied the downdraft convective inhibition (DCIN) parameter that could be used as a measurement of the depth and intensity of the cold, stable, sub-inversion layer. Much like its predecessor and companion, the downdraft convective available potential energy (DCAPE; [16]), the DCIN is limited to saturated parcels whose descent relies upon the sublimation/evaporation of hydrometeors. Both DCAPE and DCIN are based on the idea of a saturated parcel in descent, and they compare mathematically the temperature of the descending parcel to the environmental temperature. DCAPE (DCIN) exists, and suggests negative (positive) buoyancy, when the parcel temperature is less (greater) than the ambient temperature.
Kastman et al. [17] continued working with DCIN to help explain frontal motion, or lack thereof. This prior work on DCIN has also suggested noticeable differences between severe and non-severe elevated convection. In this study, that inquiry will be expanded while also examining hail-dominant cases and wind-dominant cases. This study will further establish a tool for predicting severe criterion winds by measuring the potential for a downdraft to penetrate through the depth of the stable surface layer by comparing DCAPE and DCIN. We will also focus on the ratio of the absolute value of the two: |DCIN|/|DCAPE|.
With suggestions that severe surface winds can occur with an elevated storm due to the ability of a storm’s downdraft to penetrate through the layer below the inversion, a predictive tool is developed to help determine when this process may occur. The hypothesis is that a progressively decreasing |DCIN|/|DCAPE| ratio (tending to zero) will indicate a strong potential for severe surface winds, while a |DCIN|/|DCAPE| ratio that exceeds 1.0 will virtually eliminate the possibility for significant convective winds at the surface. Such a result is implied in the work of [14]. Their “1kmC” experimental sounding is the sounding where the static stability near the surface is the strongest, and the DCIN (−150 J kg−1; calculated using data interpolated from their published sounding) easily exceeds the DCAPE value (101 J kg−1; similar to their 105 J kg−1) for a parcel lowered from 2.3 km above ground level.
In Section 2, we detail the data and methods, the establishment of cases, and how they were analyzed. In Section 3, we analyze DCIN and the |DCIN|/|DCAPE| ratio to determine their utility in identifying elevated thunderstorms capable of producing severe criterion winds. In Section 4, we compare these results to the soundings of other recent work and offer concluding remarks.

2. Data and Methods

2.1. The Database

A search of the National Centers for Environmental Information (NCEI) Storm Events Database for reports of severe elevated thunderstorms was performed for the years 2004 to 2013. The phrases “elevated” and “severe elevated” were used in the keyword searches. This approach very likely eliminates many elevated thunderstorms that were never termed as such. However, the time and effort needed to consider all storms in the Storm Events Database would have been prohibitively high. Mindful of these potential biases, information on the date, location, number of severe reports, and the type of severe reports were collected from the Database.
If an episode narrative described a thunderstorm as being elevated, then it was investigated further using surface and upper-air analyses to determine if the event was indeed elevated. This 10-year study does not yield a true climatology [8], as many elevated events may have not been labeled as such. The goal was to establish a dataset of elevated convection cases that included severe criteria weather at some point in their life cycles. It is possible that biases may exist in this dataset, due to changing human population patterns, the evolving use/understanding of the term “elevated convection” (e.g., [18]), and other factors. Another key meteorological factor that is not addressed here is the convective storm mode. Even so, the intent was to identify a sizeable collection of elevated convection events with severe weather, not create a climatology.

2.2. Model Initial Fields

Initial fields from the Rapid Update Cycle (RUC) and Rapid Refresh (RAP) models were used to facilitate plan view and sounding analyses of DCAPE and DCIN. Although there were changes to their architectures over the years, both models had a data assimilation cycle that ingested observations every hour to provide a better short-term forecast. The RUC in use at the start of our dataset period (2004) had a 20-km horizontal grid spacing and 50 vertical levels; in 2005 the RUC was enhanced with a 13-km horizontal grid spacing [19]. In 2012, the RAP replaced the RUC analysis and forecast system. The RAP was introduced as the necessity increased for situational awareness in short-term forecasts for rapidly changing weather conditions [20]. For this study, initial fields were preferred to minimize the kinds of errors in convective timing, placement, and intensity often associated with model forecasts of convection (e.g., [21]).
All of our cases employed the RUC/RAP output on a grid characterized by 20-km horizontal grid spacing. Despite the relatively coarse grid spacing, the hourly frequency of analysis allows for the creation of a skew-T diagram for any hour that a severe report occurred, and for this study the focus was on the hour prior to the first severe storm report. The pre-hour is used to thermodynamically assess the environment before convection met one of the severe criteria. For example, if the first severe weather report was recorded at 0053 UTC and a second at 0300 UTC, then a sounding analysis of the location and pre-hour of the first severe weather report (0053 UTC) was used to construct a sounding at 0000 UTC. Past studies (i.e., [2,7,8]) used observed proximity soundings that implemented a broader spatial and temporal constraint in analyzing their cases, but others have used similar RUC output [22,23].

2.3. Case Selection Criteria

A 10-year study has been constructed using the NCEI Storm Events Database. 80 separate cases of elevated convection producing severe thunderstorms were identified. Within the 80 cases, there were a total of 1040 total reports of severe weather. Of the total severe weather reports, 765 (73.5%) reports were severe hail, 261 (25.1%) reports were severe wind, and 16 (1.5%) reports were tornadoes. Almost all of the events occurred in the central Midwest, corroborating well with prior climatology studies [7,8] of elevated convection. However, there are inconsistencies between their work and this study.
To assess the likelihood of elevated convection, reports were used from the NCEI Storm Events Database, and various surface and upper-air analyses were examined. With surface data, cases were sought where an analyzed frontal boundary was identified. Among the upper-air analyses examined, RUC/RAP soundings were analyzed for the location of the first severe report in a case to identify a near-surface inversion layer. Finally, the potential cases were examined to determine if they fit the criteria for thunderstorms over a frontal boundary, as defined by Colman [2], namely:
(1)
The event occurred on the cold side of an analyzed frontal boundary with clear contrasts in temperature, dew point, and winds,
(2)
Temperature, dew point, and wind near the event site must have been qualitatively similar to the immediately surrounding values, and
(3)
Surface air on the warm side of the analyzed front must have had a higher equivalent potential temperature than the air on the cold side of the front.
Such cases were selected for further analysis. These criteria were employed to ensure that the thunderstorm occurred on the cold side of an analyzed boundary with clear cross-frontal contrasts in temperature, dew-point temperature, and wind. Additionally, each case must have been observed to have severe weather associated with it. In order to compare more directly with previous findings, Grant’s [7] criteria were used, where a severe report must reside at least 80 km (50 statute miles) into the cold air from an associated surface boundary. Distinguishing one elevated severe thunderstorm event from another was also an issue. Market et al. [24] found similar problems in distinguishing one thundersnow event from another. They justified separating thundersnow events based on temporal and spatial constraints. They made an assumption that most events respond to the same mesoscale forcing and if the reports were within 6 h and within 1100 km (within meso-α temporal and spatial scales), then the cases could be responding to the same forcing and would be treated as one. Furthermore, they explain that these criteria will “put adequate distance between the flows that may exhibit simultaneous” events [24]. These criteria were adopted for this study and, as this study deals with more transient warm season convection, each case needed only to satisfy one of these criteria to be considered as two separate events. Even so, these criteria were rarely invoked.
Once all cases of elevated thunderstorms with severe weather were gathered, every report was recorded within the cold sector. Furthermore, each report location and severe type (i.e., hail, wind, and/or tornado) was recorded. A report was considered to be severe using the National Weather Service (NWS) pre-2010 criteria for weather of 1.9 cm (0.75 inch) or greater of hail, wind speed of 25 m s−1 (50 knots) or greater, or tornadoes. It is noteworthy that all but four of the 80 cases had 2.5 cm (1 inch) hail or greater (meeting also the post-2010 NWS criterion for severe hail).
All elevated thunderstorms that produced at least one report of severe weather were recorded. However, in keeping with previous papers [7,8], an elevated severe event with five or more severe weather reports deserved additional recognition and was labeled as a “Prolific” elevated severe thunderstorm case. Other cases that had less than five severe reports were labeled as “Marginal” cases. Additionally, for each case the number of reports of hail, wind, and tornadoes was recorded to further categorize these cases. For example, if a case had three severe wind and two severe hail reports, then the event would be identified as a “Wind-Dominant” elevated severe thunderstorm case; cases with more hail than wind reports were classified as “Hail-Dominant.” A simple majority drove the classification.

2.4. Calculating DCAPE and DCIN

Calculating the DCAPE and DCIN followed Gilmore and Wicker [16] and Market et al. [10], respectively. Using the RUC and RAP output, the commercial RAOBTM software was used to establish the pre-hour vertical environmental profile with quantified thermodynamic variables (including DCAPE and DCIN) of the first severe weather report’s location, obtained from the NCEI Storm Events Database. The algorithm in the RAOBTM software that calculated DCAPE and DCIN used the coldest wet-bulb temperature in the lowest 6-km above ground level as the default level from which the parcel begins to descend (although testing is included below to explore the sensitivity to the DCAPE and DCIN to the initial parcel level). These values were recorded to establish a pattern in the data collected between the type of severe reports observed.
There has been some question surrounding the level from which the descending parcel originates (J. Schaumann, 2018, personal communication). Multiple alternate parcel origin levels were tested to determine if significant differences exist amongst resulting DCAPE and DCIN values. These comparisons will be made in Section 3.2.
In order to proceed with sounding analysis, the location of the first severe weather report in each case was used. This practice effectively limits the number of soundings to 80, with the sounding diagram for the location of the first severe report representing the entire case. Doing so makes the single sounding for the time and location of the first severe weather report the representative location for each case.

3. Results

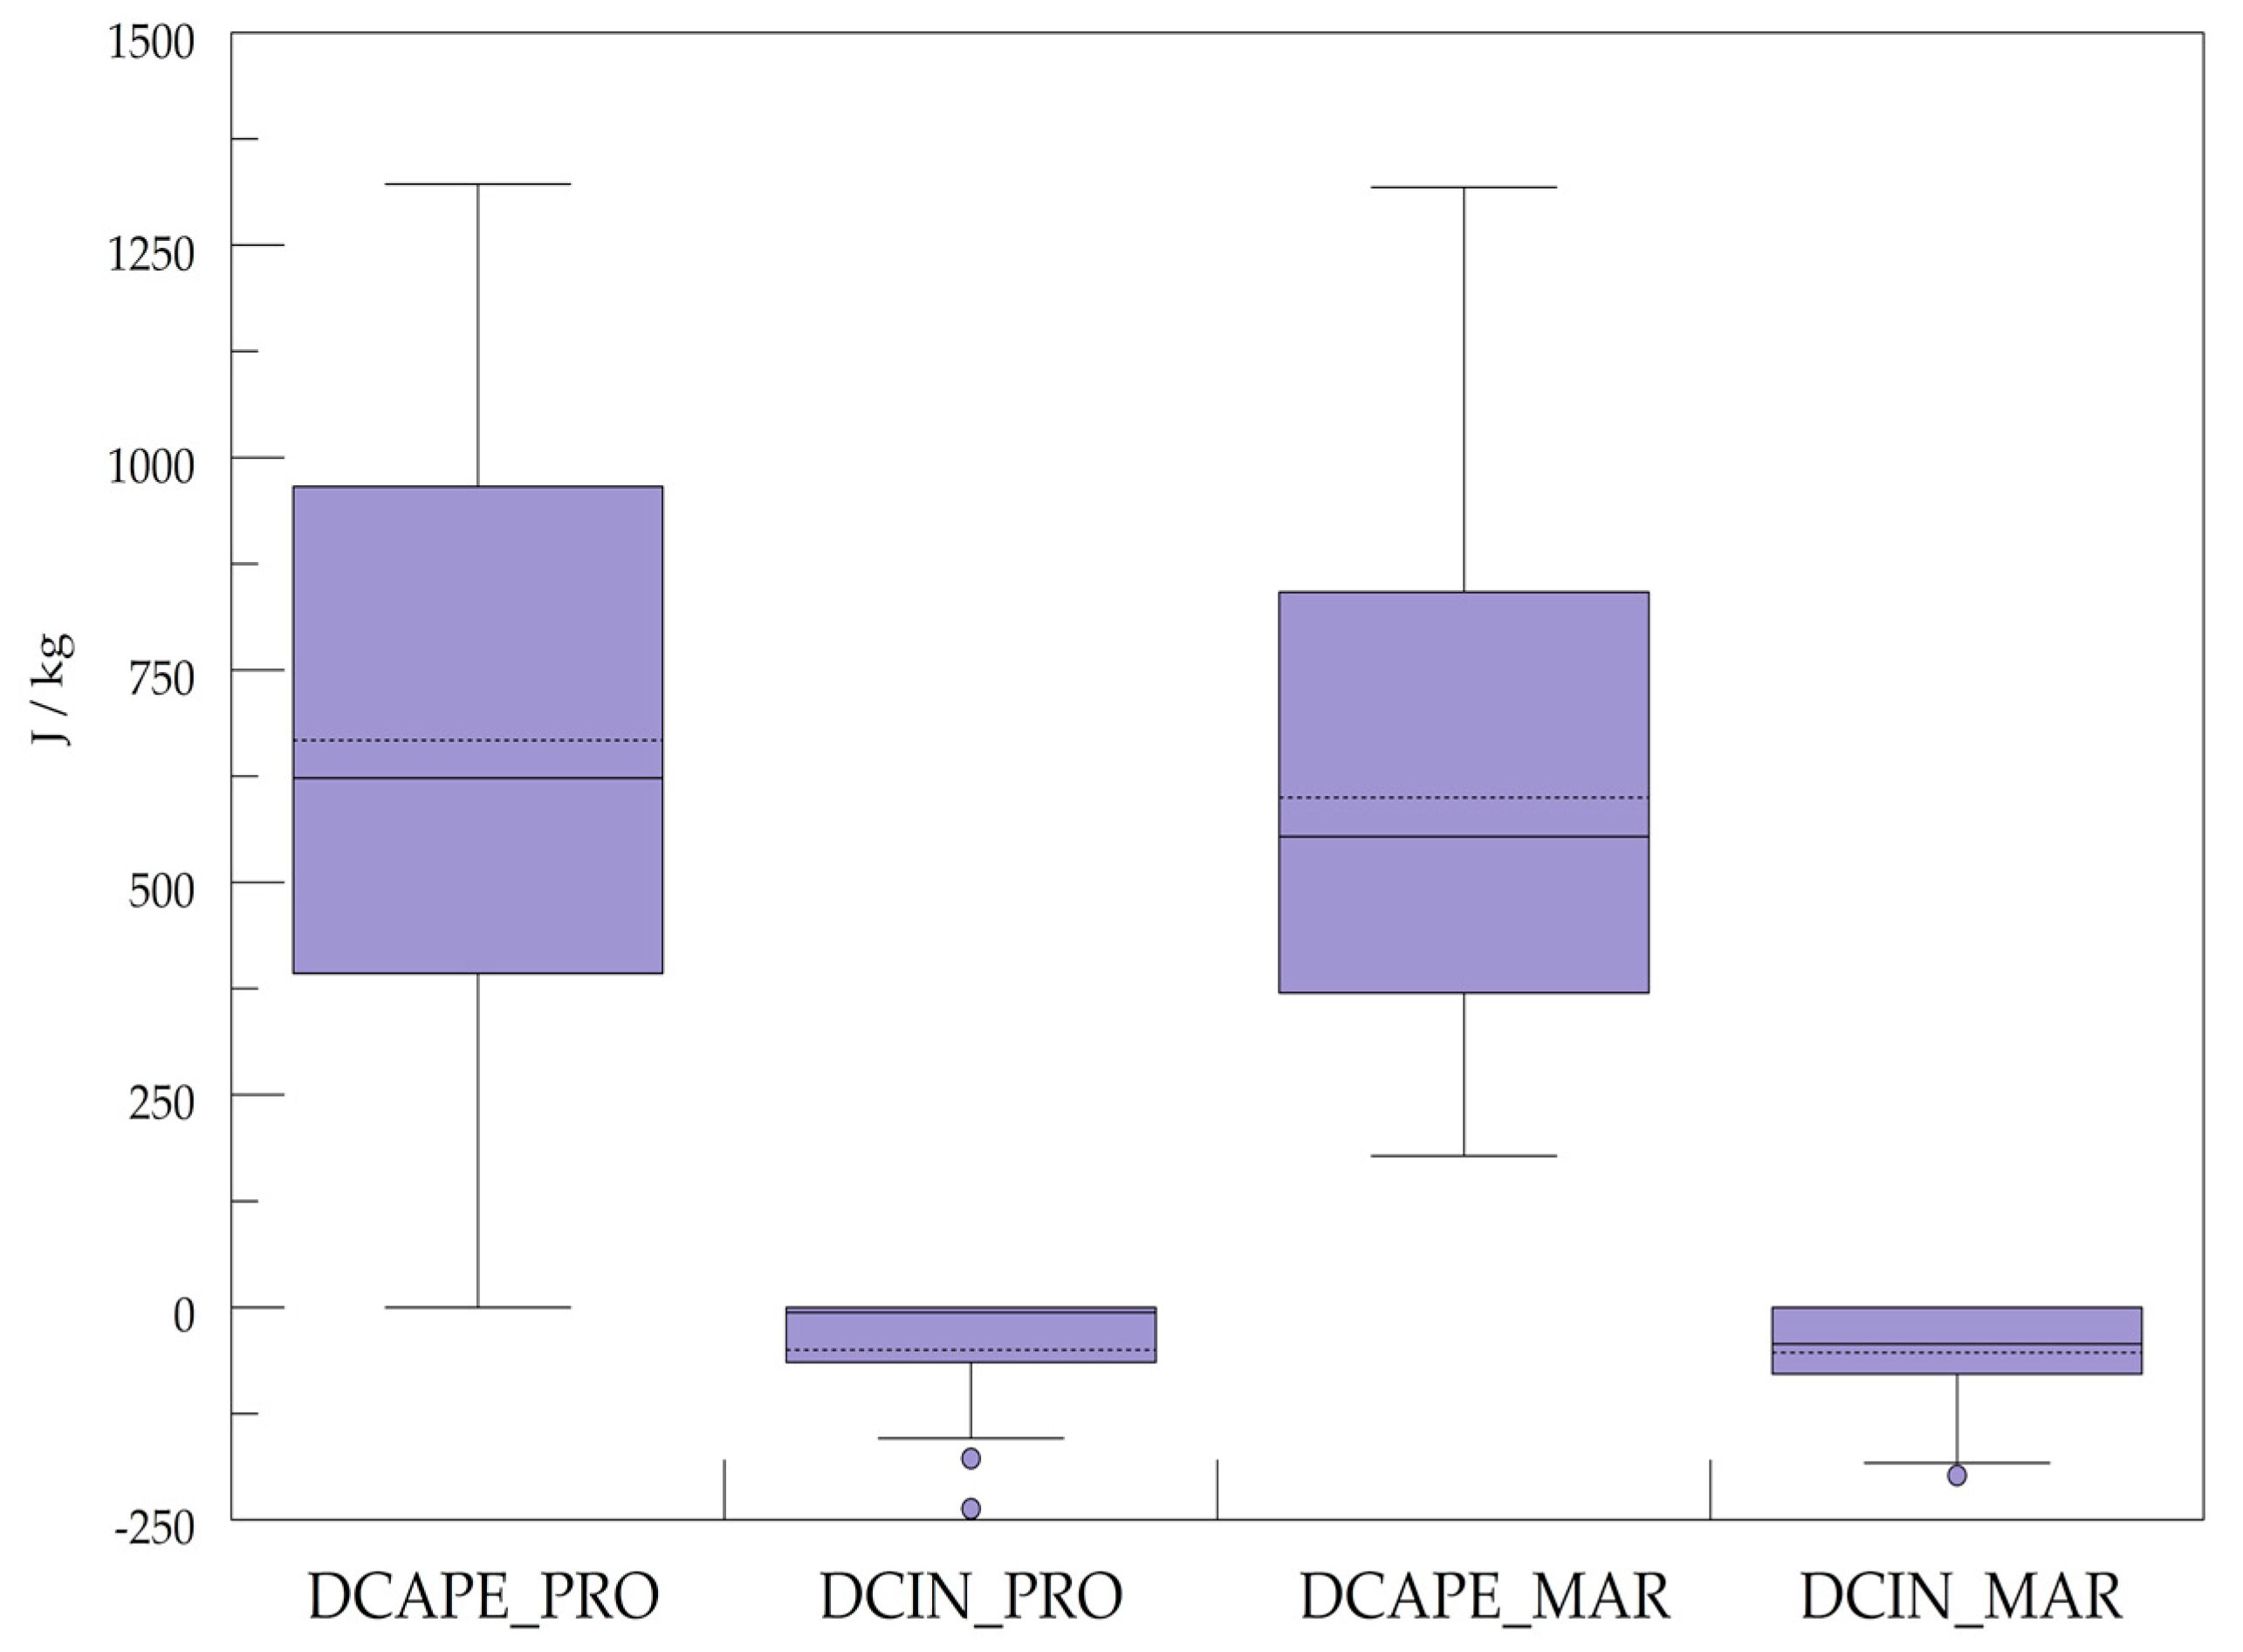
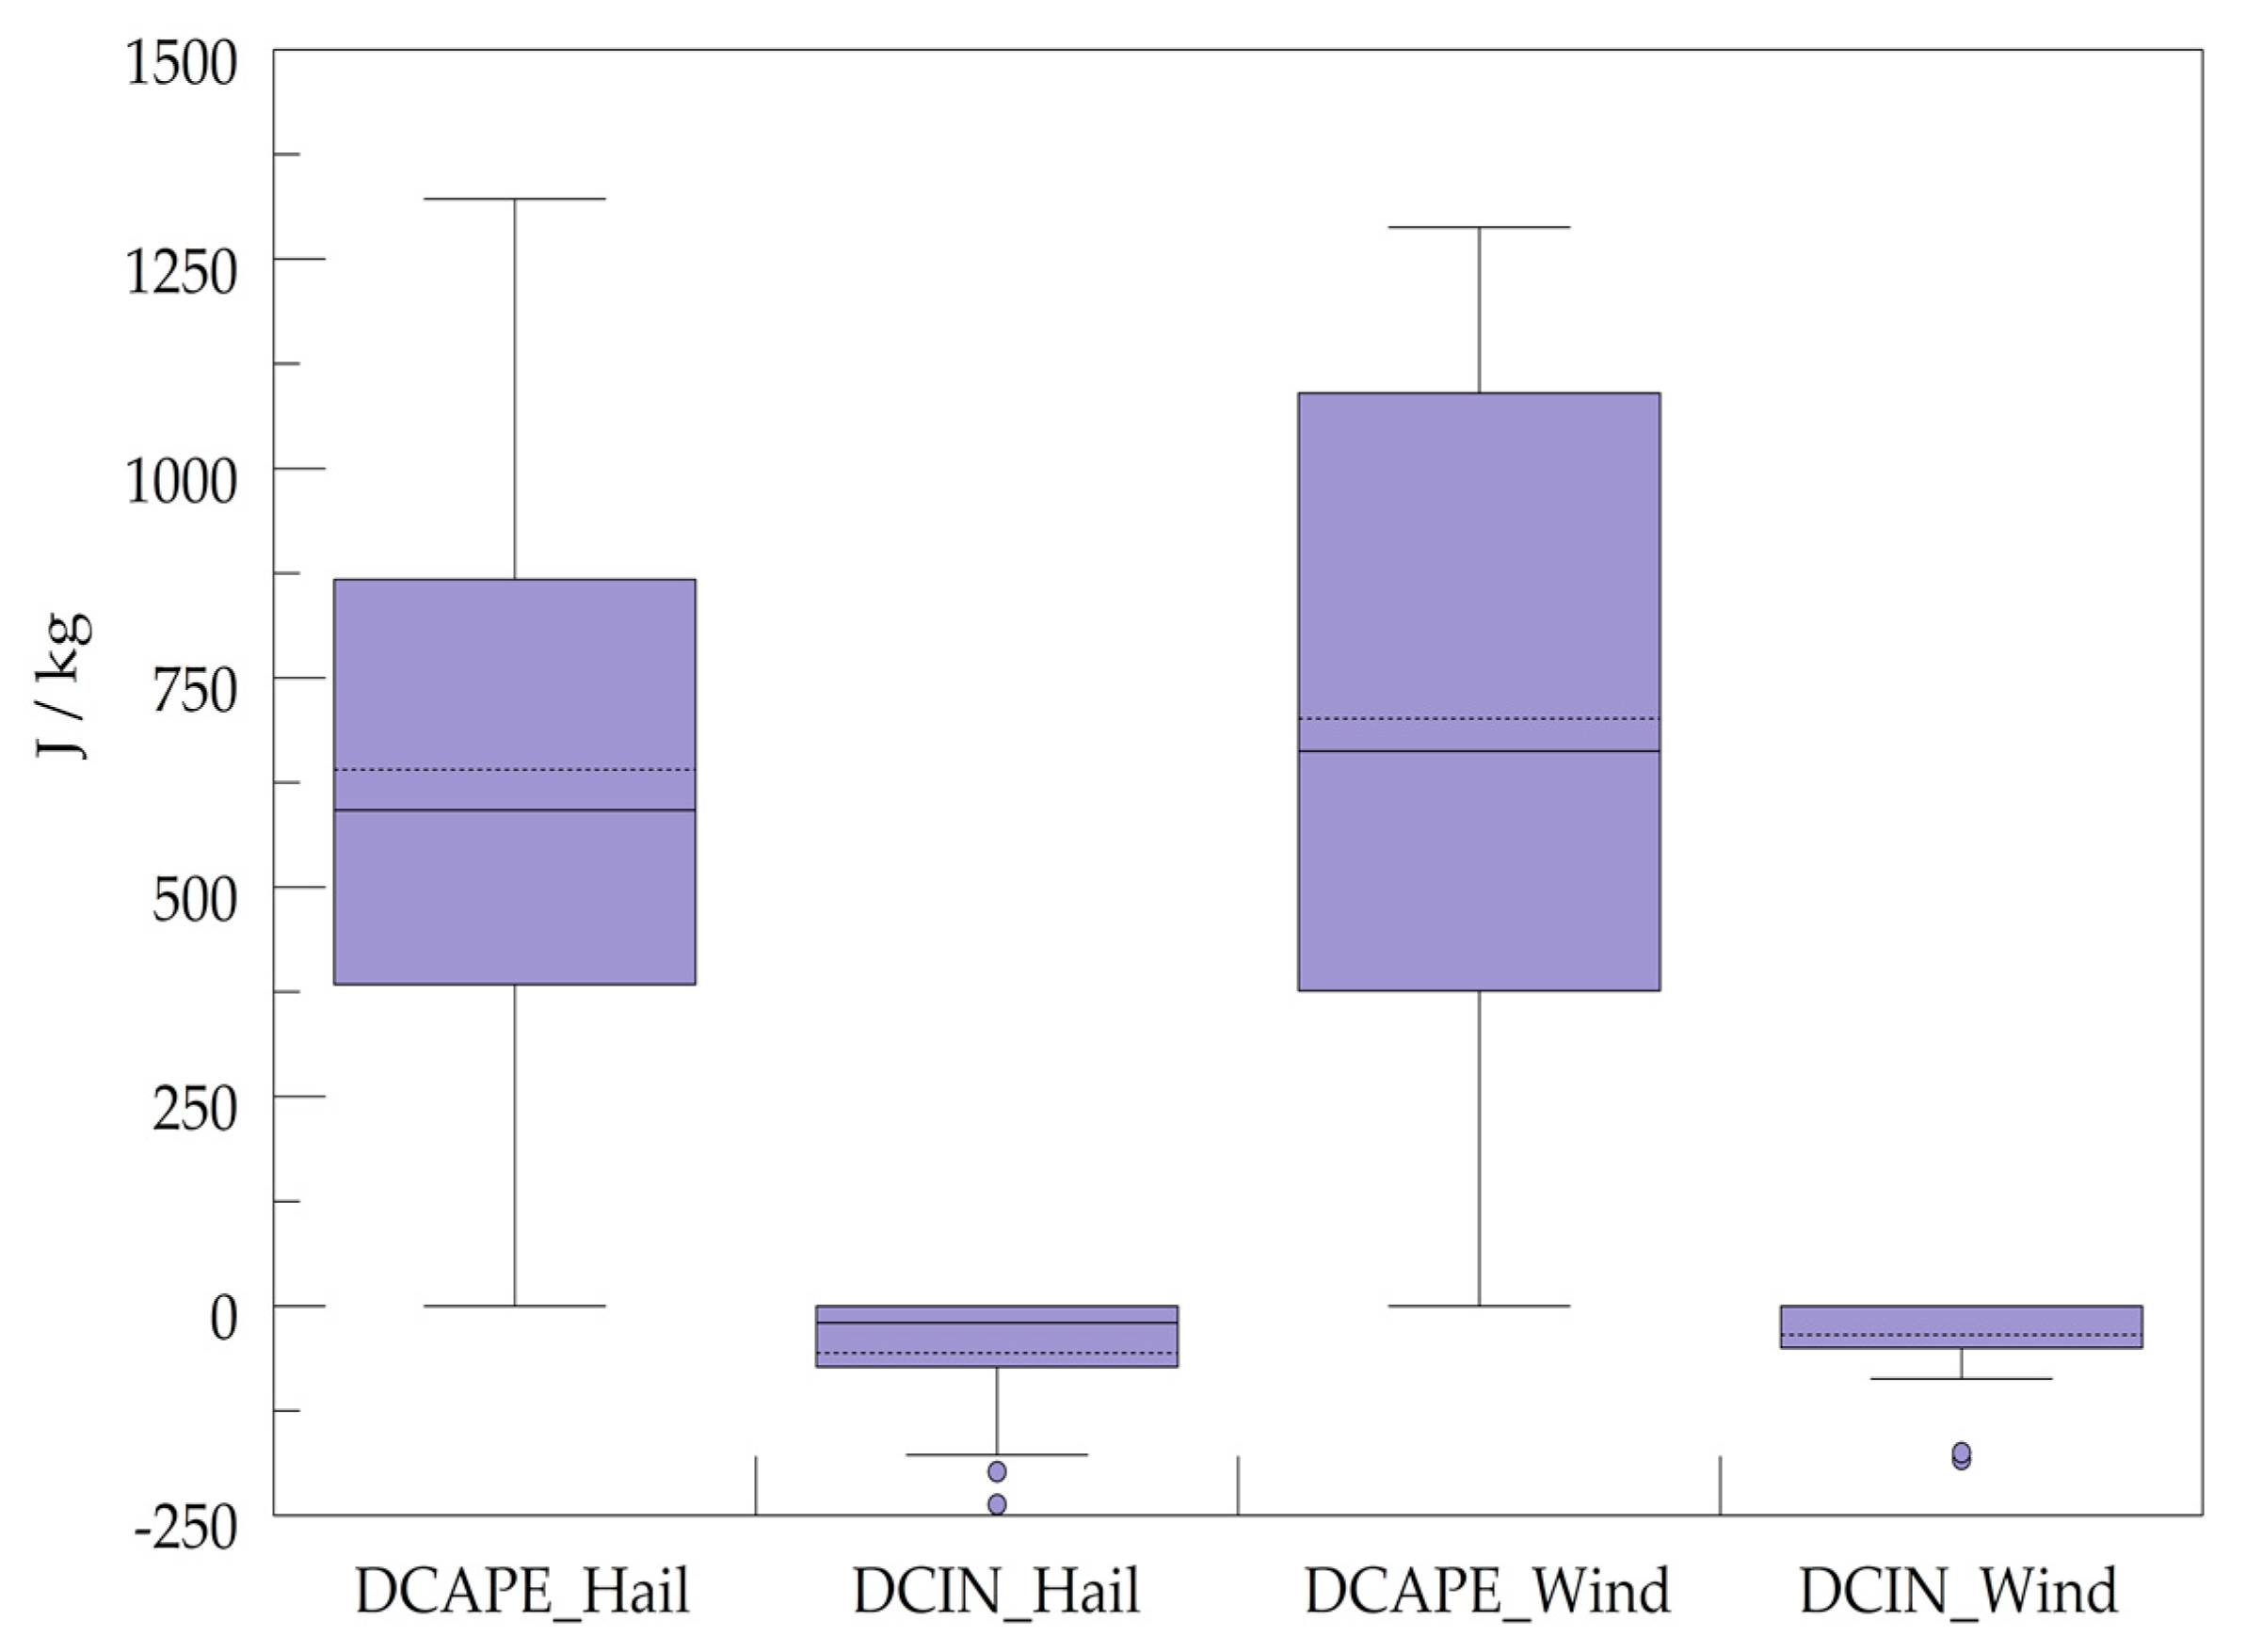
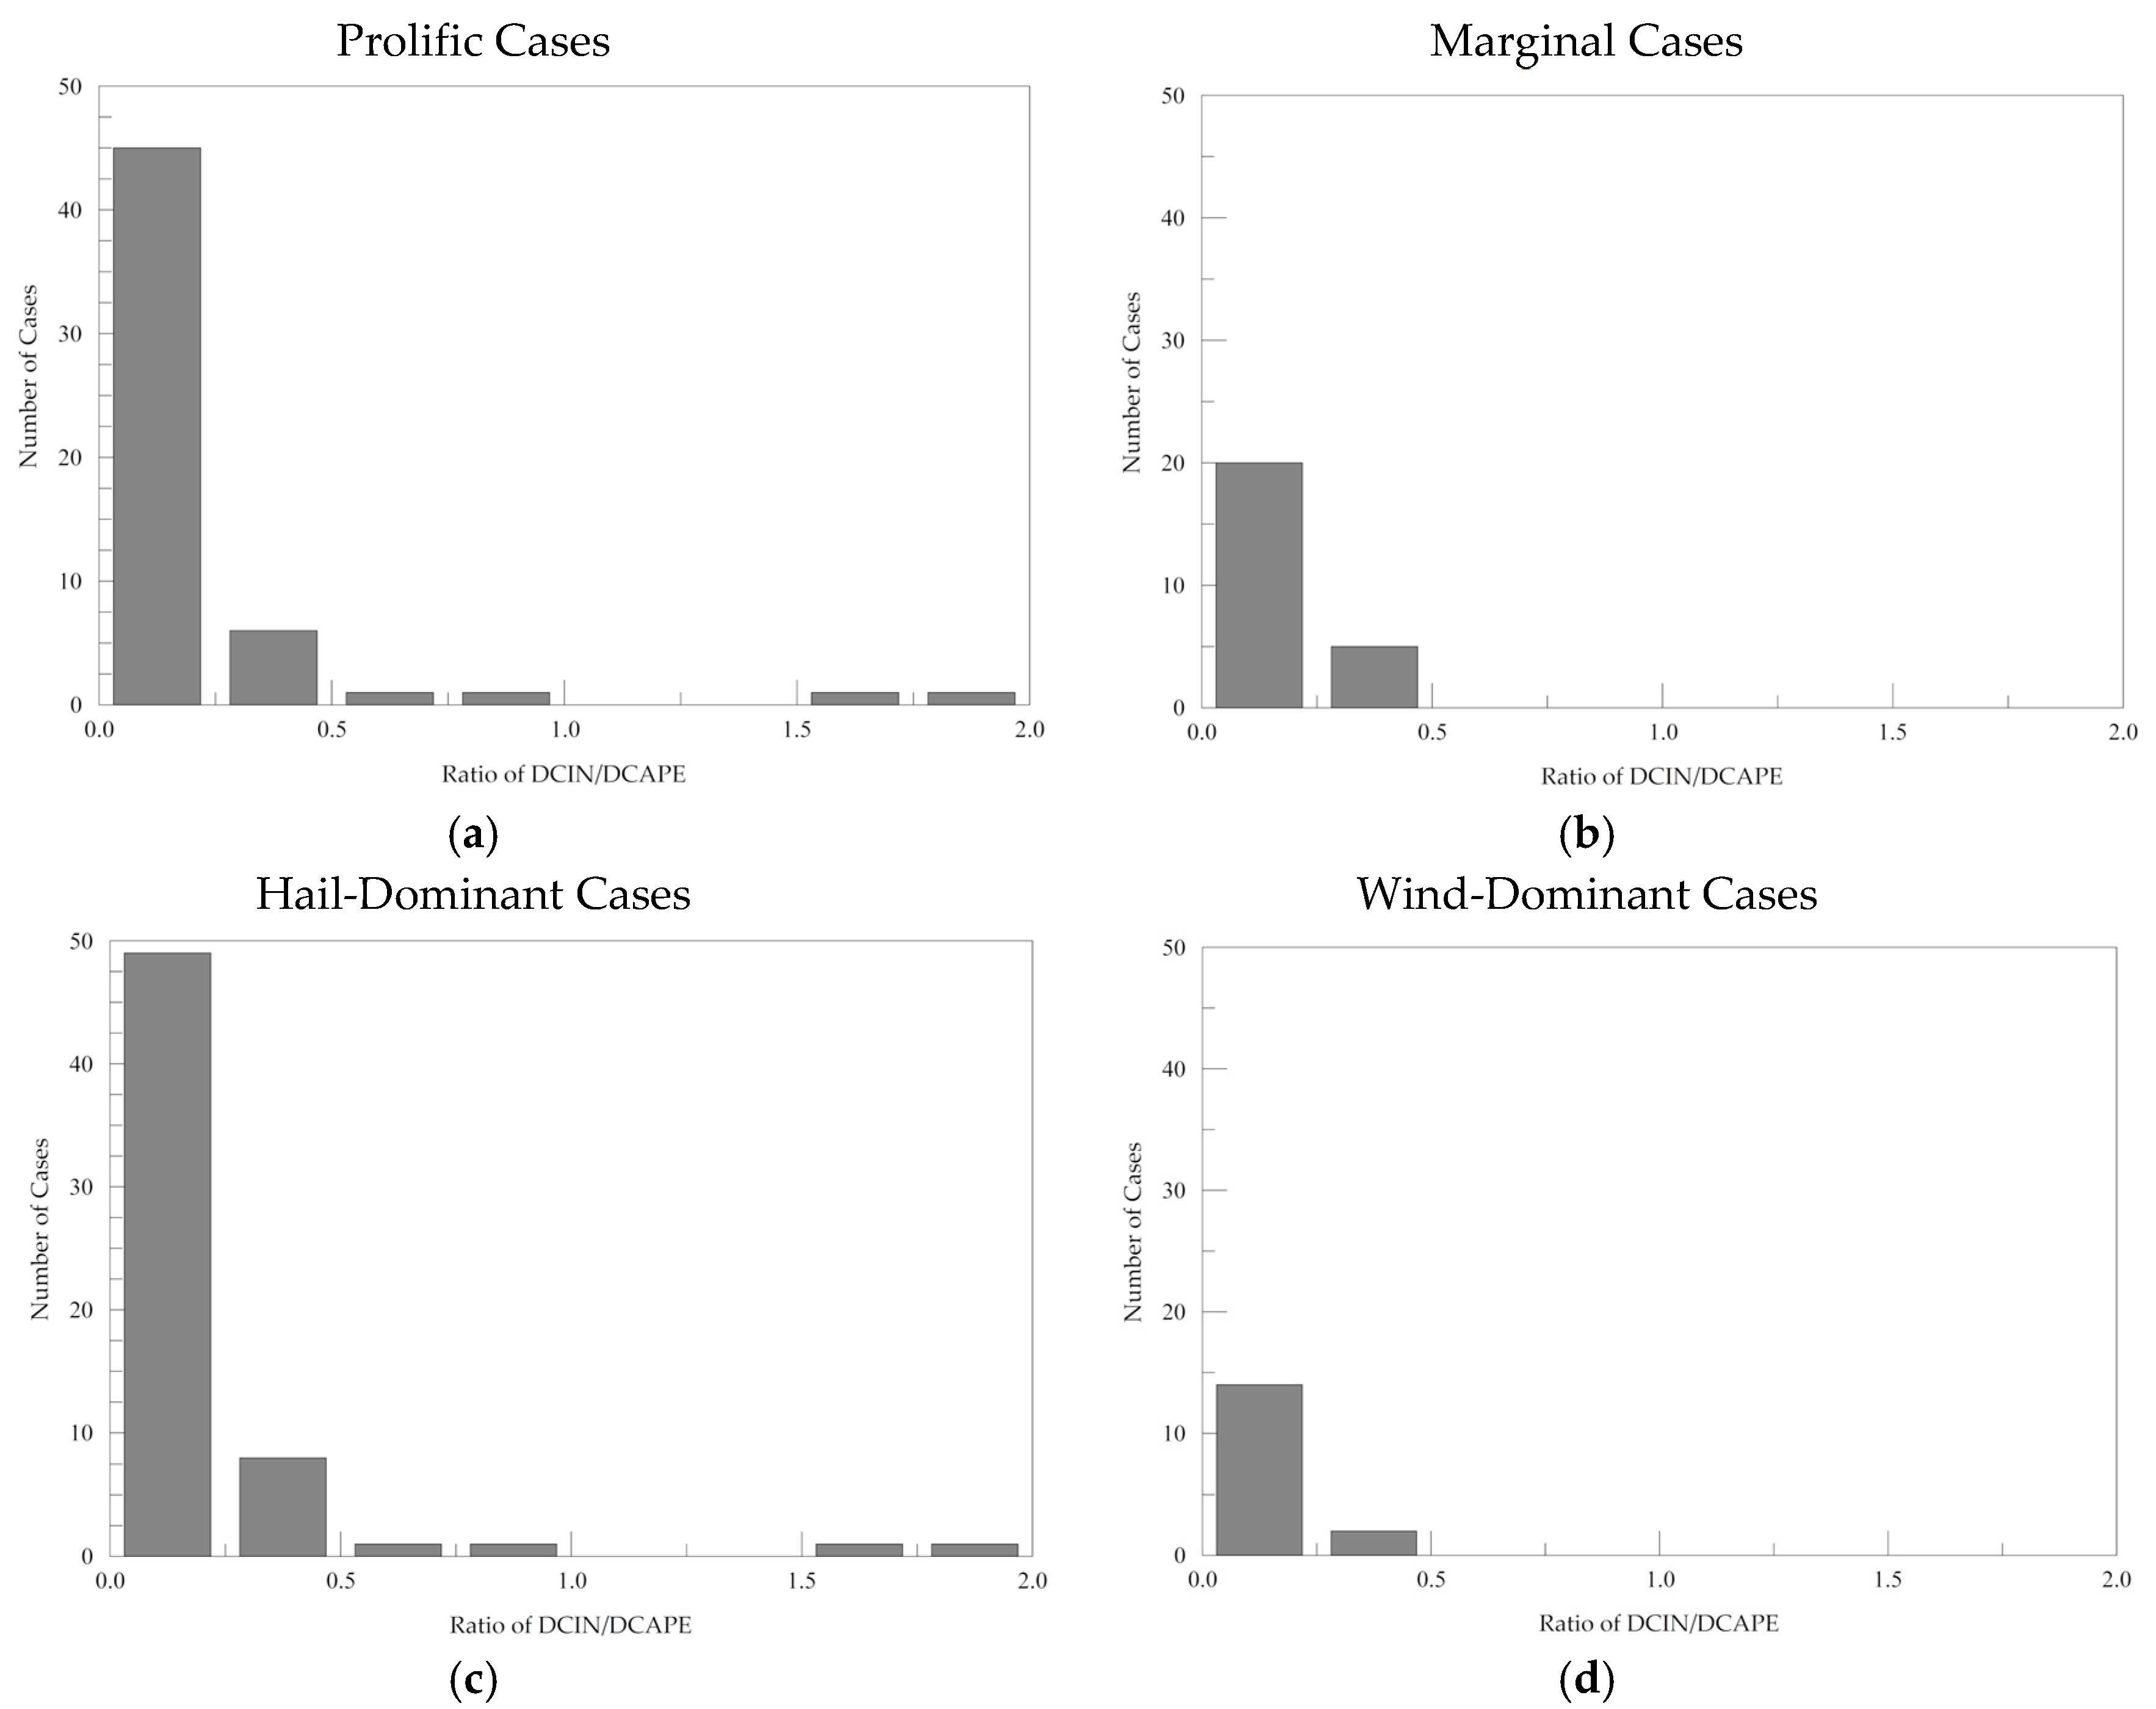
3.1. Aggregate Results

Analysis of all 80 cases of severe elevated thunderstorms allowed characterization of each as Marginal or Prolific. Cases were also classified as Hail-Dominant, or Wind-Dominant. Three cases had an equal number of wind and hail reports and were excluded from further examination. In Figure 1, a comparison of DCAPE and DCIN are represented in a box-and-whisker graphic where only minor differences between variables in the Prolific (N = 55) versus Marginal (N = 25) case classes can be seen. The DCAPE and DCIN plots for both case classes look quite similar. Clearly, it is difficult to visualize any significant difference between case groups. We note that the variables studied here (Figure 1) are representative of a dataset with a small sample size and few have even an approximate Gaussian distribution. As such, more substantive statistical comparisons between the Prolific and Marginal Case classes were carried out using the non-parametric Mann-Whitney U test. This test allows us to determine samples have statistically similar or different distributions. The DCAPE comes closest to a Gaussian distribution, and two-tailed results are shown in Table 1.
After testing, the samples of DCIN from the Prolific and Marginal case sets can be argued to come from different distributions (Table 1). In this instance, the Z value allows us to reject the null hypothesis that there is no difference between the DCIN in Prolific versus Marginal cases. Also, the one-tail p value allows us to infer that the DCIN is less negative in Prolific cases. A closer inspection reveals mean (median) values of DCIN are −53 J kg−1 (−43 J kg−1) for Marginal cases as opposed to −50 J kg−1 (−6 J kg−1) for Prolific cases. The skew of the median closer to zero than the mean is a testament to the non-Gaussian distribution of DCIN in both samples. There are outliers that can be quite negative, an outcome typically correlated to the distance of the sounding from the location of the surface frontal zone. However, the less negative values for the Prolific cases are consistent with the expectation that downdrafts will be able to penetrate to the surface more easily.
After completion of the statistical analysis for Marginal and Prolific case sets, the sets can be distinguished by dominant severe type. For this dataset the three cases with equal numbers of storm type reports (hail and wind) were eliminated from the analysis. Only minor differences exist between variables in the Hail-Dominant (N = 61) versus Wind-Dominant (N = 16) case classes (Figure 2). Mann-Whitney U tests were carried out again to determine any significant signal that was not obvious from the box-and-whisker plots. The DCIN values from the Hail-Dominant and Wind-Dominant case sets can be argued as before, via the Mann Whitney U test, to come from different populations.
Using the Mann-Whitney U test again (Table 1) when comparing |DCIN|/|DCAPE| ratios of Prolific cases (N = 55) versus Marginal cases (N = 25) showed a Z-value of 1.719 with a one-tail probability of p = 0.043. Of the Prolific cases (Figure 3a), there were 45 hail cases, 8 wind cases, and 2 cases where there was an equal number of hail and wind reports. Of the Marginal cases (Figure 3b), there were 16 hail cases, 8 wind cases, and 1 case where there was an equal number of hail and wind reports. This |DCIN|/|DCAPE| ratio comparison shows that if the ratio is near zero, then it is more likely to be a Prolific case. Furthermore, all Wind-Dominant cases were identified as having a |DCIN|/|DCAPE| ratio < 0.5. Shown in Figure 3c is the |DCIN|/|DCAPE| ratio for the initial report for Hail-Dominant cases, while Figure 3d is for Wind-Dominant cases. Again, a Mann-Whitney U test was conducted yielding a Z value of 2.191 and a one-tail probability value of 0.013 of ratios when comparing hail cases to wind. This shows that as the |DCIN|/|DCAPE| grows (approaching 1.0), the elevated thunderstorm will be less likely to be wind dominated.
We take a moment to acknowledge that the more robust results come from the comparison of Prolific (N = 55) versus Marginal (N = 25) case classes. The Hail-Dominant case class (N = 61) is also suitably large for the Mann-Whitney U approach, but the Wind-Dominant case class (N = 16) is well below the ideal minimum sample size of 30. As such, we urge caution in over-interpreting the Hail-Dominant versus Wind-Dominant results.
Yet, these results do beg the question of whether an event is “truly” elevated if the DCIN and the |DCIN|/|DCAPE| ratio become zero. Figure 4a represents both a Prolific and Wind-Dominant case, with 25 individual severe wind reports across Arkansas. The most unstable rising parcel originates nearly a full kilometer above ground level, from the top of a surface-based inversion. Figure 4b represents a Marginal and Wind-Dominant case, with only three individual severe wind reports across Kansas. The most unstable rising parcel originates 1.2 km above ground level, from the top of a surface-based inversion. Since the usual terrestrial atmospheric convective cycle begins with an updraft, it seems logical to think of convection, such as that suggested here, as being elevated, at least initially. The magnitude of the DCAPE, however, and the lack of DCIN suggest that a saturated parcel should be able to make it to the surface unimpeded as part of the ensuing downdraft. The idea that the initially “elevated” storm may have an influence all the way down to the surface, and perhaps incorporate parcels from beneath the level of the inversion, is one point of the DCIN research.

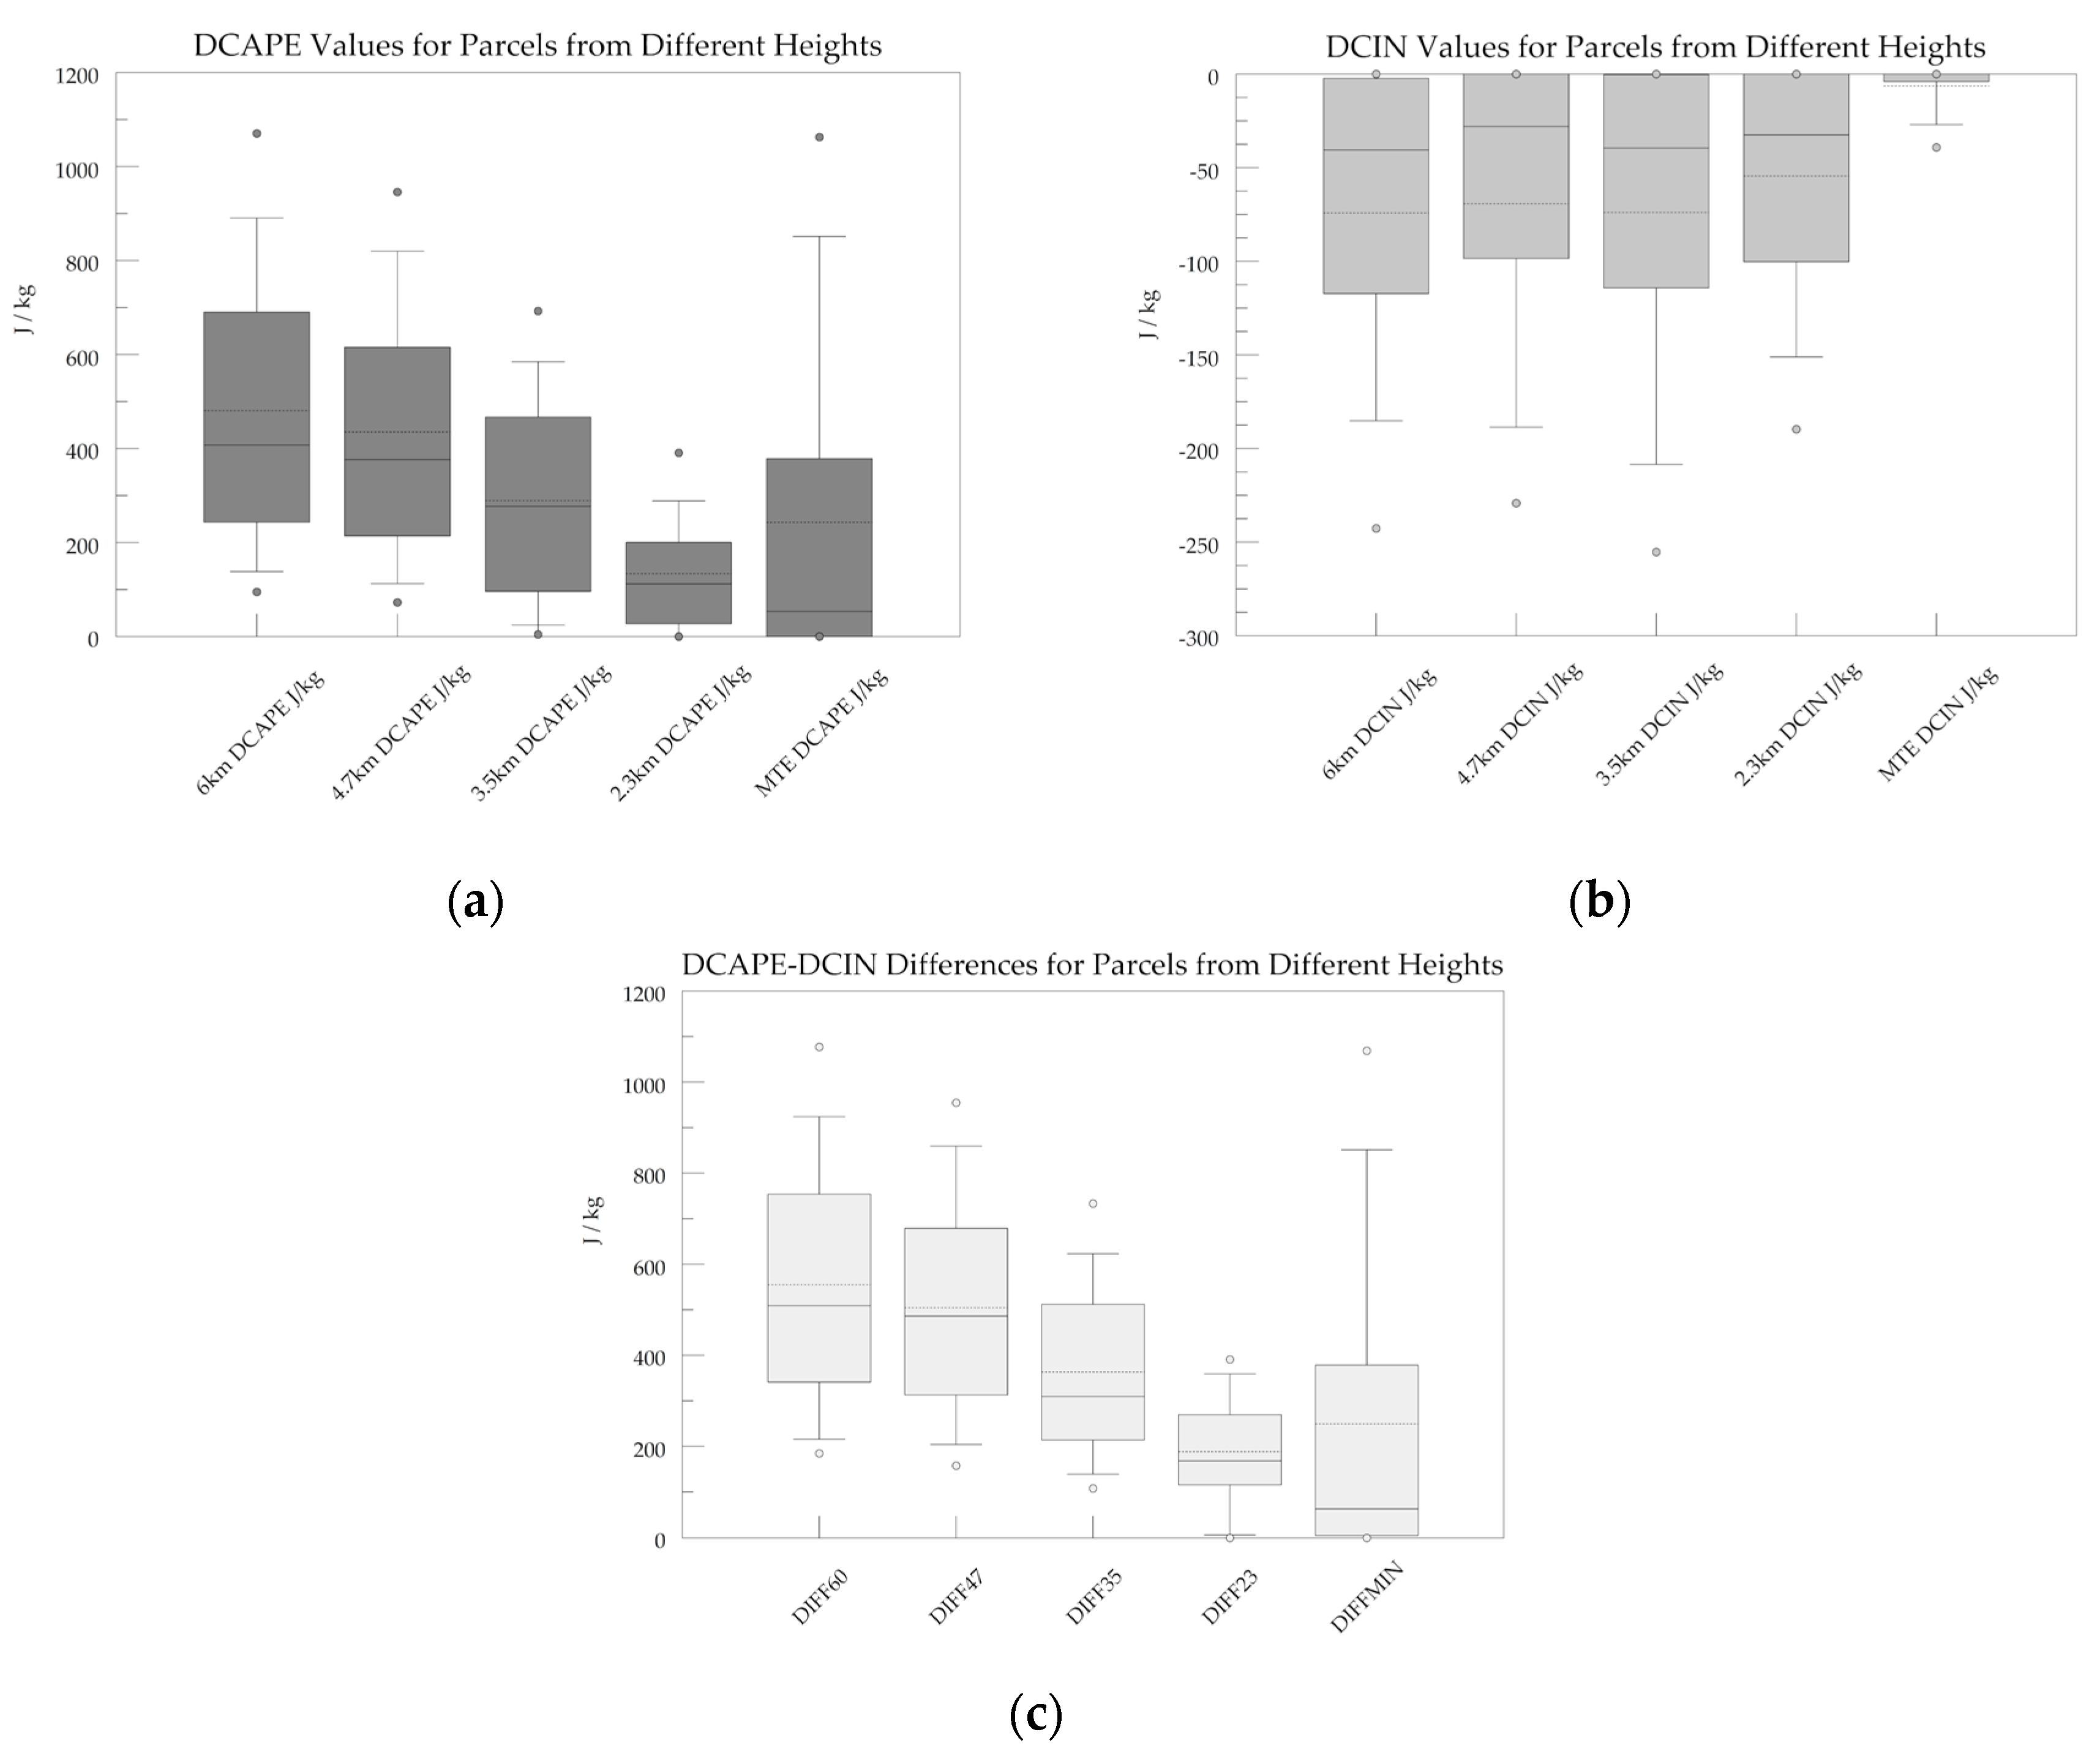
3.2. Effects of Different Source Levels on DCAPE and DCIN

In order to assess the impact that varying the height of the descending parcel’s origin had on DCAPE and DCIN, the values of these parameters were calculated for several different starting heights. Figure 5a shows the DCAPE values decreasing as parcels originate from decreasing heights above ground level, while Figure 5b shows no appreciable trend in DCIN. These behaviors lead us to two generic findings: (1) DCAPE decreases as the origin level above ground level decreases, increasingly limiting the magnitude of DCAPE, and (2) the largely unchanging DCIN suggests that, regardless of parcel origin, roughly the same moist adiabat is identified in many of the parcel origin levels tested.
The right side of both box and whisker collections (Figure 5a,b) are the DCAPE and DCIN, respectively, for parcels originating from the level of minimum equivalent potential temperature (θe), which can vary greatly in terms of height above ground level. This approach is invoked to assess the “coldest” level in the storm environment, which is the most likely parcel level to arrive at the surface given a maximized DCAPE and a minimized DCIN. The implication here is that, with this method, a severe wind will be more likely, since these parcels can reach the surface more easily. When this approach is employed, the likely DCAPE values (25th to 75th percentile) grow dramatically, while the same DCIN range shrinks dramatically. This minimum equivalent potential temperature approach suggests that DCAPE >>DCIN in most cases, yet only 16 of the 77 cases (~21%) classified according to severe weather type dominance were Wind-Dominant.

4. Discussion

Previous studies have shown that elevated severe thunderstorms happen more often (meeting severe criteria for hail, winds, and/or tornadoes) than previously thought [7,8]. The same studies also show that if elevated convection produces severe weather, it will most likely be hail. Horgan et al. [8], along with the results of this study, corroborate that severe hail reports are recorded nearly twice as often as severe winds during elevated convective events.
Statistical testing strongly suggests that the DCIN is smaller (closer to zero) in Prolific cases as opposed to Marginal cases. Also, similar testing reveals that the DCIN is again smaller (closer to zero) in Wind-Dominant as opposed to Hail-Dominant cases. Furthermore, the same Mann-Whitney approach showed that as the DCIN/DCAPE ratio approaches zero, then it is more likely to be a Prolific case. Lastly, all Prolific and Wind-Dominant cases were identified as having a DCIN/DCAPE ratio equal to zero.
This last result compares favorably to a number of previous studies. The four soundings analyzed by [22] had either no DCIN (their Figure 2b in [22]), or DCIN << DCAPE; winds of up to 40 m s−1 (78 kt) resulted. Thompson et al. [23] also provided two different soundings associated with elevated supercells that had no DCIN (their Figure 6), or where DCIN was zero or nearly so, depending upon the level from which descending parcels were initiated (their Figure 3). Similar DCIN values of zero or nearly so are found [25] in the dropsonde data (their Figure 7) and radiosonde data (their Figure 4), the [15] pre-warm-frontal radiosonde data (their Figure 3a), and the [21] radiosonde data (their Figure 4). In fairness, each of the soundings in the aforementioned papers possessed weak and/or shallow near-surface inversions, and those with a surface boundary were in relatively close proximity to that boundary. Sounding profiles such as “1kmC” from [14] and Figure 4b in this work are most often found in association with a well-defined thermal boundary and placed deep into the cold air side. Thus, this sounding profile signature, with deep DCIN equal to or exceeding the DCAPE, effectively curtails the threat of severe winds at the surface.
The sounding approach to evaluating the severe wind threat [10] is useful but can be limiting. This point approach of evaluating soundings is easily expanded to two dimensions. Indeed, an example of such plan view fields of the DCAPE, DCIN, and their ratio leading up to a recent elevated severe wind event are shown in Figure 6. At present, the DCIN, and the |DCIN|/|DCAPE| ratio of 1.0 provide a theoretical northern boundary on the occurrence of severe winds (Figure 7), such as in the proposed cold sector cases of [13]. Further studies are currently underway to test this hypothesis.

5. Conclusions

This study explored the idea that the likelihood of severe surface winds from an elevated thunderstorm was a function of the ratio of the DCIN to the DCAPE. Statistical testing supports the assertion that as |DCIN|/|DCAPE| approaches zero, severe winds at the surface are, indeed, an increased risk. These statistically-derived conclusions provided a firm rationale for severe wind assessment from thunderstorms over a frontal inversion, beyond merely comparing the negative (DCAPE) and positive (DCIN) areas for a downdraft on a skew-T log p diagram.
Two-dimensional, plan-view analyses of the |DCIN|/|DCAPE| ratio can further help to define the region that may be at risk from severe winds. When used in the vicinity of a frontal zone, the location of that boundary is often approximated by the DCIN = 0 J kg−1. The ratio of |DCIN/|DCAPE| should then also define the limit of the threat area on the cold side, as the |DCIN| and |DCAPE| become perfectly balanced at 1.0.
These studies could be expanded by using larger time frames, different observational datasets, and differing methodologies (including calculating DCAPE in multiple ways). Also, one could examine the skew-T analyses of all reports for each case. This approach would allow a more robust analysis of environments of wind reports versus hail reports. Additionally, a comparison of non-severe versus severe elevated convective environments should be studied. Moreover, the DCIN and the |DCIN|/|DCAPE| ratio are easily calculable.

Author Contributions

Individual contributions included: conceptualization, P.M.; methodology, P.M. and K.G.; software, all authors; formal analysis, P.M., K.G., and P.S.; writing—original draft preparation, P.M. and K.G., and C.H.; writing—review and editing, P.M., K.G., and P.S.

Funding

This research received no external funding.

Acknowledgments

The authors would like to thank Sam Ritter for some early analysis work, and Scott Rochette for reading drafts of the manuscript. We are also grateful to the anonymous reviewers for their time and efforts in helping to improve our paper.

Conflicts of Interest

The authors declare no conflict of interest.

References

  1. American Meteorological Society. Glossary of Meteorology. Boston, MA, USA. Available online: http://glossary.ametsoc.org/wiki/Main_Page (accessed on 2 July 2019).
  2. Colman, B.R. Thunderstorms above frontal surfaces in environments without positive CAPE: Part I: A climatology. Mon. Weather Rev. 1990, 118, 1103–1121. [Google Scholar] [CrossRef]
  3. Rochette, S.M.; Moore, J.T. Initiation of an elevated mesoscale convective system associated with heavy rainfall. Weather Forecast. 1996, 11, 443–457. [Google Scholar] [CrossRef]
  4. Moore, J.T.; Czarnetzki, A.C.; Market, P.S. Heavy precipitation associated with elevated thunderstorms formed in a convectively unstable layer aloft. Meteorol. Appl. 1998, 5, 373–384. [Google Scholar] [CrossRef]
  5. Moore, J.T.; Glass, F.H.; Graves, C.E.; Rochette, S.M.; Singer, M.J. The environment of warm-season elevated thunderstorms associated with heavy rainfall over the central United States. Weather Forecast. 2003, 18, 861–878. [Google Scholar] [CrossRef]
  6. McCoy, L.P.; Market, P.M.; Gravelle, C.M.; Graves, C.E.; Fox, N.I.; Rochette, S.M.; Kastman, J.; Svoma, B.M. Composites of heavy rain producing elevated thunderstorms in the MO-KS-OK region of the United States. Adv. Meteorol. 2017, 6932798. [Google Scholar] [CrossRef]
  7. Grant, B.N. Elevated cold-sector severe thunderstorms: A Preliminary study. Natl. Weather Dig. 1995, 19, 25–31. [Google Scholar]
  8. Horgan, K.L.; Schultz, D.M.; Hales, J.E.; Corfidi, S.F.; Johns, R.H. A five year climatology of elevated severe convective storms in the United States east of the Rocky Mountains. Weather Forecast. 2007, 22, 1031–1044. [Google Scholar] [CrossRef]
  9. Colby, F.P., Jr.; Walker, B.E. Tornadoes from elevated convection. In Proceedings of the 22nd Conference on Weather Analysis and Forecasting/18th Conference on Numerical Weather Prediction, Park City, UT, USA, 25–29 June 2007. [Google Scholar]
  10. Market, P.S.; Rochette, S.M.; Shewchuk, J.; Difani, R.; Kastman, J.S.; Henson, C.B.; Fox, N.I. Evaluating elevated convection with the downdraft convection inhibition. Atmos. Sci. Lett. 2017, 18, 76–81. [Google Scholar] [CrossRef]
  11. Bosart, L.R.; Seimon, A. A case study of an unusually intense atmospheric gravity wave. Mon. Weather Rev. 1988, 116, 1857–1886. [Google Scholar] [CrossRef]
  12. Fritsch, J.M.; Forbes, G.S. Mesoscale Convective Systems. In Severe Convective Storms; Meteor. Monogr. No. 50; American Meteorological Society: Boston, MA, USA, 2001; Volume 28, pp. 323–357. [Google Scholar]
  13. Kuchera, E.L.; Parker, M.D. Severe convective wind environments. Weather Forecast. 2006, 21, 595–612. [Google Scholar] [CrossRef]
  14. Nowotarski, C.J.; Markowski, P.M.; Richardson, Y.P. The characteristics of numerically simulated supercell storms situated over statically stable boundary layers. Mon. Weather Rev. 2011, 139, 3139–3162. [Google Scholar] [CrossRef]
  15. MacIntosh, C.W.; Parker, M.D. The 6 May 2010 Elevated Supercell during VORTEX2. Mon. Weather Rev. 2017, 145, 2635–2657. [Google Scholar] [CrossRef]
  16. Gilmore, M.S.; Wicker, L.J. The influence of midtropospheric dryness on supercell morphology and evolution. Mon. Weather Rev. 1998, 126, 943–958. [Google Scholar] [CrossRef]
  17. Kastman, J.; Market, P.S.; Fox, N.I. Dynamic ensemble analysis of frontal placement impacts in the presence of elevated thunderstorms during PRECIP Events. Atmosphere 2018, 9, 339. [Google Scholar] [CrossRef]
  18. Corfidi, S.F.; Corfidi, S.J.; Schultz, D.M. Elevated convection and castellanus: Ambiguities, significance, and questions. Weather Forecast. 2008, 23, 1280–1303. [Google Scholar] [CrossRef]
  19. Benjamin, S.G.; Dévényi, D.; Weygandt, S.S.; Brundage, K.J.; Brown, J.M.; Grell, G.A.; Manikin, G.S. An hourly assimilation forecast cycle: The RUC. Mon. Weather Rev. 2004, 132, 495–518. [Google Scholar] [CrossRef]
  20. Benjamin, S.G.; Weygandt, S.S.; Brown, J.M.; Hu, M.; Alexander, C.R.; Smirnova, T.G.; Lin, H. A North American hourly assimilation and model forecast cycle: The Rapid Refresh. Mon. Weather Rev. 2016, 144, 1669–1694. [Google Scholar] [CrossRef]
  21. Peters, J.M.; Nielsen, E.R.; Parker, M.D.; Hitchcock, S.M.; Schumacher, R.S. The impact of low-level moisture errors on model forecasts of an MCS observed during PECAN. Mon. Weather Rev. 2017, 145, 3599–3624. [Google Scholar] [CrossRef]
  22. Goss, S.M.; Thompson, R.L.; Bookbinder, E. An elevated supercell with damaging wind from the morning of 12 March 2006. In Proceedings of the 23rd Conference on Severe Local Storms, St. Louis, MO, USA, 5–11 November 2006. [Google Scholar]
  23. Thompson, R.L.; Mead, C.M.; Edwards, R. Effective storm-relative helicity and bulk shear in supercell thunderstorm environments. Weather Forecast. 2007, 22, 102–115. [Google Scholar] [CrossRef]
  24. Market, P.S.; Halcomb, C.E.; Ebert, R.L. A climatology of thundersnow events over the contiguous United States. Weather Forecast. 2002, 17, 1290–1295. [Google Scholar] [CrossRef]
  25. Billings, J.M.; Parker, M.D. Evolution and maintenance of the 22–23 June 2003 nocturnal convection during BAMEX. Weather Forecast. 2012, 27, 279–300. [Google Scholar] [CrossRef]
Figure 1. Box-and-whisker plots of thermodynamic variables (DCAPE, and DCIN; J kg−1) of elevated thunderstorms for the Prolific (≥5 severe reports) case set on the left, ending in “_PRO”, compared to the Marginal (<5 severe reports) case set on the right, ending in “_MAR”. Top (bottom) of each box represents the 75th (25th) percentile, with whiskers at 95% and 5%. Outliers are plotted as dots. Dashed (solid) lines within the box represent the mean (median).
Atmosphere 10 00449 g001
Figure 2. As in Figure 1, but comparing the Hail-Dominant case set on the left (ending in “_Hail”) to the Wind-Dominant case group on the right (ending in “_Wind”).
Atmosphere 10 00449 g002
Figure 3. Histograms of |DCIN|/|DCAPE| ratio based on initial report of severe weather: (a) Prolific cases (b) Marginal Cases, (c) Hail-Dominant cases, (d) Wind-Dominant cases.
Atmosphere 10 00449 g003
Figure 4. Examples of typical sounding plots for (a) a Prolific and Wind-Dominant case, and (b) a Marginal and Wind-Dominant case. CAPE (CIN) is shaded in red (cyan); and calculated with the virtual temperature correction. Downdraft convective available potential energy (DCAPE) is shaded as dark purple in both (a) and (b), whereas the downdraft convective inhibition (DCIN) is shaded as a light purple near the surface only in (b).
Atmosphere 10 00449 g004
Figure 5. Box-and-whisker plots as in Figure 1, but of the (a) DCAPE, (b) DCIN, and (c) their difference (all in J kg−1) for the 6.0 km, 4.7 km, 3.5 km, 2.3 km AGL levels, along with the values for the minimum θe (MTE) on the far right of each box-and-whisker collection.
Atmosphere 10 00449 g005
Figure 6. Example of a plan-view analysis of DCIN (J kg−1; black-solid lines), DCAPE (J kg−1; red-dashed lines), and the |DCIN|/|DCAPE| ratio equal to 1.0 in purple dotted lines. Taken from http://weather.missouri.edu/dcin.
Atmosphere 10 00449 g006
Figure 7. An example of the potential severe wind threat area from elevated thunderstorms (shaded). This shaded area is bounded by the dashed black contour (DCIN = 0 J kg−1) on the warm side and the green dash-dot contour (|DCIN|/|DCAPE| = 1.0) on the cold side. Warm front (standard symbology) is often approximated by the DCIN = 0 J kg−1 contour.
Atmosphere 10 00449 g007
Table 1. Mann-Whitney U test results on thermodynamic variables DCAPE, DCIN, and the ratio |DCIN|/|DCAPE| (RA) for the Prolific case set (ending in “_P”) to the Marginal case set (ending in “_M”), and the Hail-Dominant case set (ending in _H”) to the Wind-Dominant case set (ending in “_W”). Tests with one-tailed (p1) and two-tailed (p2) probability of p < 0.05 are reported in bold italics.
StatisticDCAPE_P to DCAPE_ MDCIN_P to DCIN_ MDCAPE_H to DCAPE_WDCIN_H to DCIN_WRA_P to RA_MRA_H to RA_W
Z−0.737−1.677−0.603−2.203−1.719−2.218
p10.0470.0140.0430.013
p20.4610.547

