Article

Does the IOD Independently Influence Seasonal Monsoon Patterns in Northern Ethiopia?

by
Daniel Gebregiorgis
1,*,
David Rayner
2 and
Hans W. Linderholm
2
1
Department of Geosciences, Georgia State University, Atlanta, GA 30303, USA
2
Regional Climate Group, Department of Earth Sciences, University of Gothenburg, 41320 Gothenburg, Sweden
*
Author to whom correspondence should be addressed.
Atmosphere 2019, 10(8), 432; https://doi.org/10.3390/atmos10080432
Submission received: 25 June 2019 / Revised: 18 July 2019 / Accepted: 23 July 2019 / Published: 26 July 2019
(This article belongs to the Special Issue 10th Anniversary of Atmosphere: Climatology and Meteorology)

Abstract

:
The dominant large-scale interannual modes in the tropical Pacific and Indian Oceans—El Niño southern oscillation (ENSO) and the Indian Ocean Dipole (IOD)—dominate seasonal rainfall patterns in Ethiopia. However, there is a clear interaction between ENSO and the IOD, and it is unclear whether the IOD has an independent influence on seasonal monsoon patterns in Northern Ethiopia. We use monthly rainfall records from 15 stations from two drought–prone regions in Northern Ethiopia (Afar and Amhara) for the period 1966–2006 to explore relationships between rainfall and circulation patterns and sea surface temperature (SST) anomalies over the tropical Indo-Pacific region. Our analysis confirms that regional summer monsoon (Kiremt) rainfalls in these regions are predominantly modulated by ENSO. Warm and cold ENSO episodes (El Niño/La Nina) are associated with below and above average summer monsoon rainfall, respectively. Lagged relationship between the IOD and Kiremt rainfall shows that positive/negative phases of the IOD are generally conducive to Kiremt rainfall increases/decreases over large parts of Ethiopia. Regression models based on the large-scale circulation indices NINO3.4 and a Dipole Mode Index (DMI)NO-ENSO representing the “ENSO-free IOD” also highlight the role of ENSO. However, the relative-weights for the models with DMINO-ENSO, calculated using Akaike Information Criteria (AIC), were 1.5 and 1.1 times the weights for the ENSO only models for the Afar and Amhara regions, respectively. This suggests that the IOD has an independent regional influence. This is in line with the conception of the IOD as a unique coupled-mode in the tropics, and may have important implications in boosting seasonal forecasting skills in the regions. No statistically significant trends were found in the regional and modeled rainfall time-series.

1. Introduction

The East African monsoon system is predominantly linked to changes in sea surface temperatures (SSTs) in the Indian and Pacific Oceans [1,2,3,4,5,6,7] and, to a much lesser extent, the North Atlantic Ocean [8]. Northern Ethiopia lies within the core moisture-sink region of the East African monsoon system, and rainfall changes over the region are associated with the El Niño southern oscillation (ENSO) and the Indian Ocean Dipole (IOD) [9,10]. Above/below average monsoon rainfall over large parts of Ethiopia mostly coincides with strong cold/warm phases of ENSO and positive/negative IOD years; for example, [3,11]. However, ENSO and the IOD are interrelated phenomena, and the extent to which the IOD is considered as a distinct oscillation of the climate system is still widely debated; for example, [12,13,14,15,16]. It is therefore unclear whether the IOD exerts influence on seasonal monsoon patterns in Northern Ethiopia, independent of ENSO.
Significant progress has been made over the years towards better understanding of the large-scale influences on Ethiopian rainfall; for example, [1,3,4,5,17,18]. ENSO-related climate variability, in particular, has been a subject of intense research over the last three decades, to the extent that sea surface temperature (SST) anomalies in the tropical Pacific are primarily used as main predictors of the Ethiopian monsoon in the operational forecasts of the National Meteorology Agency (NMA) [5]. The operational forecasts rely on lead and lag relationships between observed and predicted SSTs and seasonal rainfall patterns, because current dynamical models show little skill [19,20]. A better understanding of the independent influence of the IOD on seasonal monsoon patterns is, therefore, crucial for improving seasonal forecasting models for the region.
Here, we build composite records for two drought-prone regions in Northern Ethiopia for the period 1966–2006 using monthly rainfall records from 15 stations, and we assess the contribution and impact of the “independent” component of the IOD on seasonal rainfall patterns. To this end, we develop an empirical forecast model for the monsoon rains in Northern Ethiopia, also locally known as Kiremt (July–September) using regression with two sets of large-scale indices, after removing the direct and lagged ENSO signal from the IOD [21]. Long-term trends in regional rainfall and station records are also examined.

2. Data and Methods

2.1. Rainfall Data

The National Metrological Services Agency (NMSA) of Ethiopia provided rainfall data for 17 stations (Table 1). The study area (Figure 1) lies within the Afar and Amhara regional states, and stations were selected based on lengths of the precipitation records and the geographical distribution. Data were missing or limited for some stations for a few months and/or years, but this did not impact the composite records (Table 1). The rainfall records extend from the mid-1960s to the mid-2000s. Station histories are unknown, and it is likely that there have been station relocations and changes in instrumentation. Consequently, all records were examined for inhomogeneity using a standard normal homogeneity test (SNHT) [22]. The rainfall stations were then divided into two groups based on topography and geographical proximity, while also taking account of the inter-station correlation (1981–2006) between Kiremt rainfall series as a function of inter-station distance. Given the influence of topography on the spatial variation in rainfall patterns and the strong relationship between rainfall and elevation in both regions, grouping the stations according to topography offers better representation of the station records. To ensure that regional rainfall trends were not dominated by unrepresentative observations from a single station, they were compared with seasonal trends at all individual gauge stations using the nonparametric Mann-Kendall (MK) test [23]. Confidence levels of 95% and 99% were set as thresholds to classify the significance of positive or negative trends, while trends at significance below the 95% confidence level were classified as showing no-trend. Trend magnitude in all time series was determined using Sen’s estimator method [24].

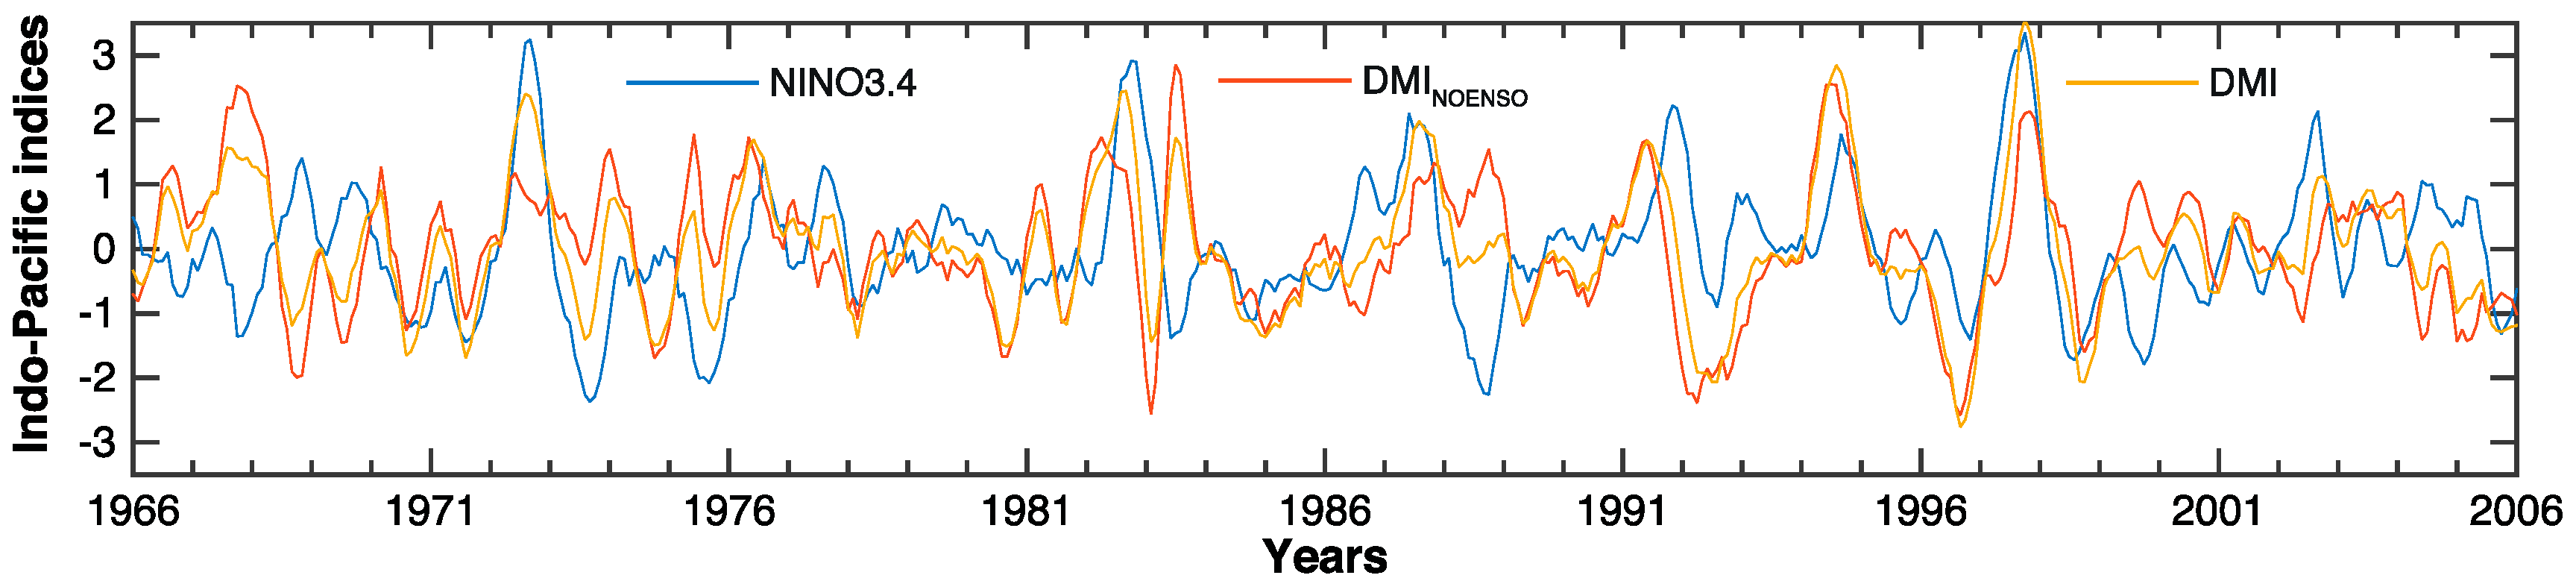
2.2. Large–Scale Circulation Indices

Different atmospheric and oceanic indices are used as a measure of ENSO. The oceanic component of ENSO is measured by the Niño3, Niño3.4, and Niño4 SST indices over the eastern (5° N–5° S, 90°–150° W), east central (5° N–5° S, 120°–170° W), and central (5° N–5° S, 160° E–150° W) tropical Pacific correspondingly. Monthly values of the Niño 3.4 index for the period 1966–2006 were obtained from the National Oceanic and Atmospheric Administration (NOAA) Climate Prediction Center (CPC) database [25].
The IOD is a coupled ocean–atmosphere mode in the tropical Indian Ocean [26]. The Dipole Mode Index (DMI) is an indicator of the east-west temperature gradient of the sea surface temperature anomaly (SSTA) across the tropical Indian Ocean, and is defined as the difference between the western box (50° E–70° E, 10° S–10° N) and eastern box (90° E–110° E, 10° S–eq). Monthly values of DMI (1966–2006) were downloaded from the Japan Agency for Marine-Earth Science and Technology (JAMSTEC) [27].
The set of large-scale drivers measured by the indices is not entirely independent. In particular, ENSO appears to exert influence on the IOD, and vice versa. Following on Werner, et al. [21], lagged regression between monthly Niño 3.4 SST and DMI was used to remove the ENSO effect and extract the ENSO-free IOD (Figure 2). The ENSO-free IOD is a better variable to use to evaluate the IOD contribution to rainfall variability and examine its hindcast skill. This method takes account of statistically significant lead/lag correlations (at p < 0.05 and p < 0.01) between ENSO and IOD to remove the ENSO influence from the variable. By regressing the monthly DMI over NINO3.4 time series at ENSO lead/lags up to eight months, and subtracting the sum of these contributions, it was possible to remove the ENSO signal from the IOD index with no significant correlations evident between the new ENSO-free IOD index (DMINOENSO) and the other ENSO indices (e.g., SOI, NINO3, NINO4) for leads/lags of up to 12 months, while the original DMI time series and DMINOENSO are significantly correlated (p < 0.01 level), with a correlation coefficient of r = 0.89. The ENSO-free DMI is given as:
DMI NOENSO ( t ) =   DMI ( t )   k b k NINO 3.4 ( t k )
where t is the month in the full time series, k is the regression number of the corresponding monthly lag, and bk is the regression coefficient on the kth NINO3.4 predictor. To avoid ambiguous effects due to long-term trends, all indices and regional rainfalls were de-trended prior to regression and correlation analysis.

2.3. Identification of Rainfall Predictors

The relationships between the standard indices during the pre-monsoon and monsoon seasons, and correlations between regional rainfalls and large-scale ocean–atmospheric variables, were examined. This approach of correlation-analysis using ocean–atmospheric circulation variables as predictors provides insights into large-scale controls on Ethiopian rainfall, and is used to enhance Ethiopia’s seasonal forecasting capabilities [5]. Seasonal relationships between regional rainfall, SSTs, and vector wind fields are further explored using composite analysis of global SST and vector wind fields during unusually wet and dry years. Interannual departures expressed as Rainfall Anomaly Indices (RAI) were calculated by dividing the regional rainfall anomaly with respect to the mean by the standard deviation of regional Kiremt rainfall over the period of observation, and is used to define the driest and wettest years. Zonal and meridional wind components at 300 and 850 hPa have been extracted from the NCEP/NCAR reanalysis data set and are used to describe the changes in circulation and Kiremt rainfall based on GPCC data [28].
We performed a multiple-linear regression analysis of regional Kiremt rainfall based on the predictor indices. We regressed regional Kiremt and predictor indices using data for 1966–2006, and used two sets of predictor indices to develop regional models. Correlation analysis of regional Kiremt rainfalls vs. each potential predictor did not suggest any non-linear relations. Thus, the following linear relation was assumed and employed in the first models:
Modeled Kiremt = β0 + βs × xs + et
where xs is the variable vectors of predictor index NINO3.4, β represents model coefficient, and et is the additive error term.
To assess the influence of IOD, we used a model with the form:
Modeled Kiremt = β0 + βs × xs + βi × xi + et
where xs and xi are variable vectors corresponding to predictor indices NINO3.4 and DMINOENSO.
We characterized the best model using Akaike Information Criterion (AIC) [29] after sample size adjustment using residual sum of squares (RSS) [30]. The AIC measures the relative quality of models, and combines a measure of goodness-of-fit with a penalty term that increases with the number of free parameters. The AIC can be computed as:
AIC = n × ln(RSS/n) + 2 × k + (2 × k* × k + 1))/(n − k − 1)
where k is the number of free parameters in the model, and n is the sample size. Models are usually compared by normalizing the relative likelihood exp((AICmin − AICi)/2) to calculate Akaike weights (wi), analogous to weights in a weighted average. Higher AIC weights indicate better models.

3. Results and Discussions

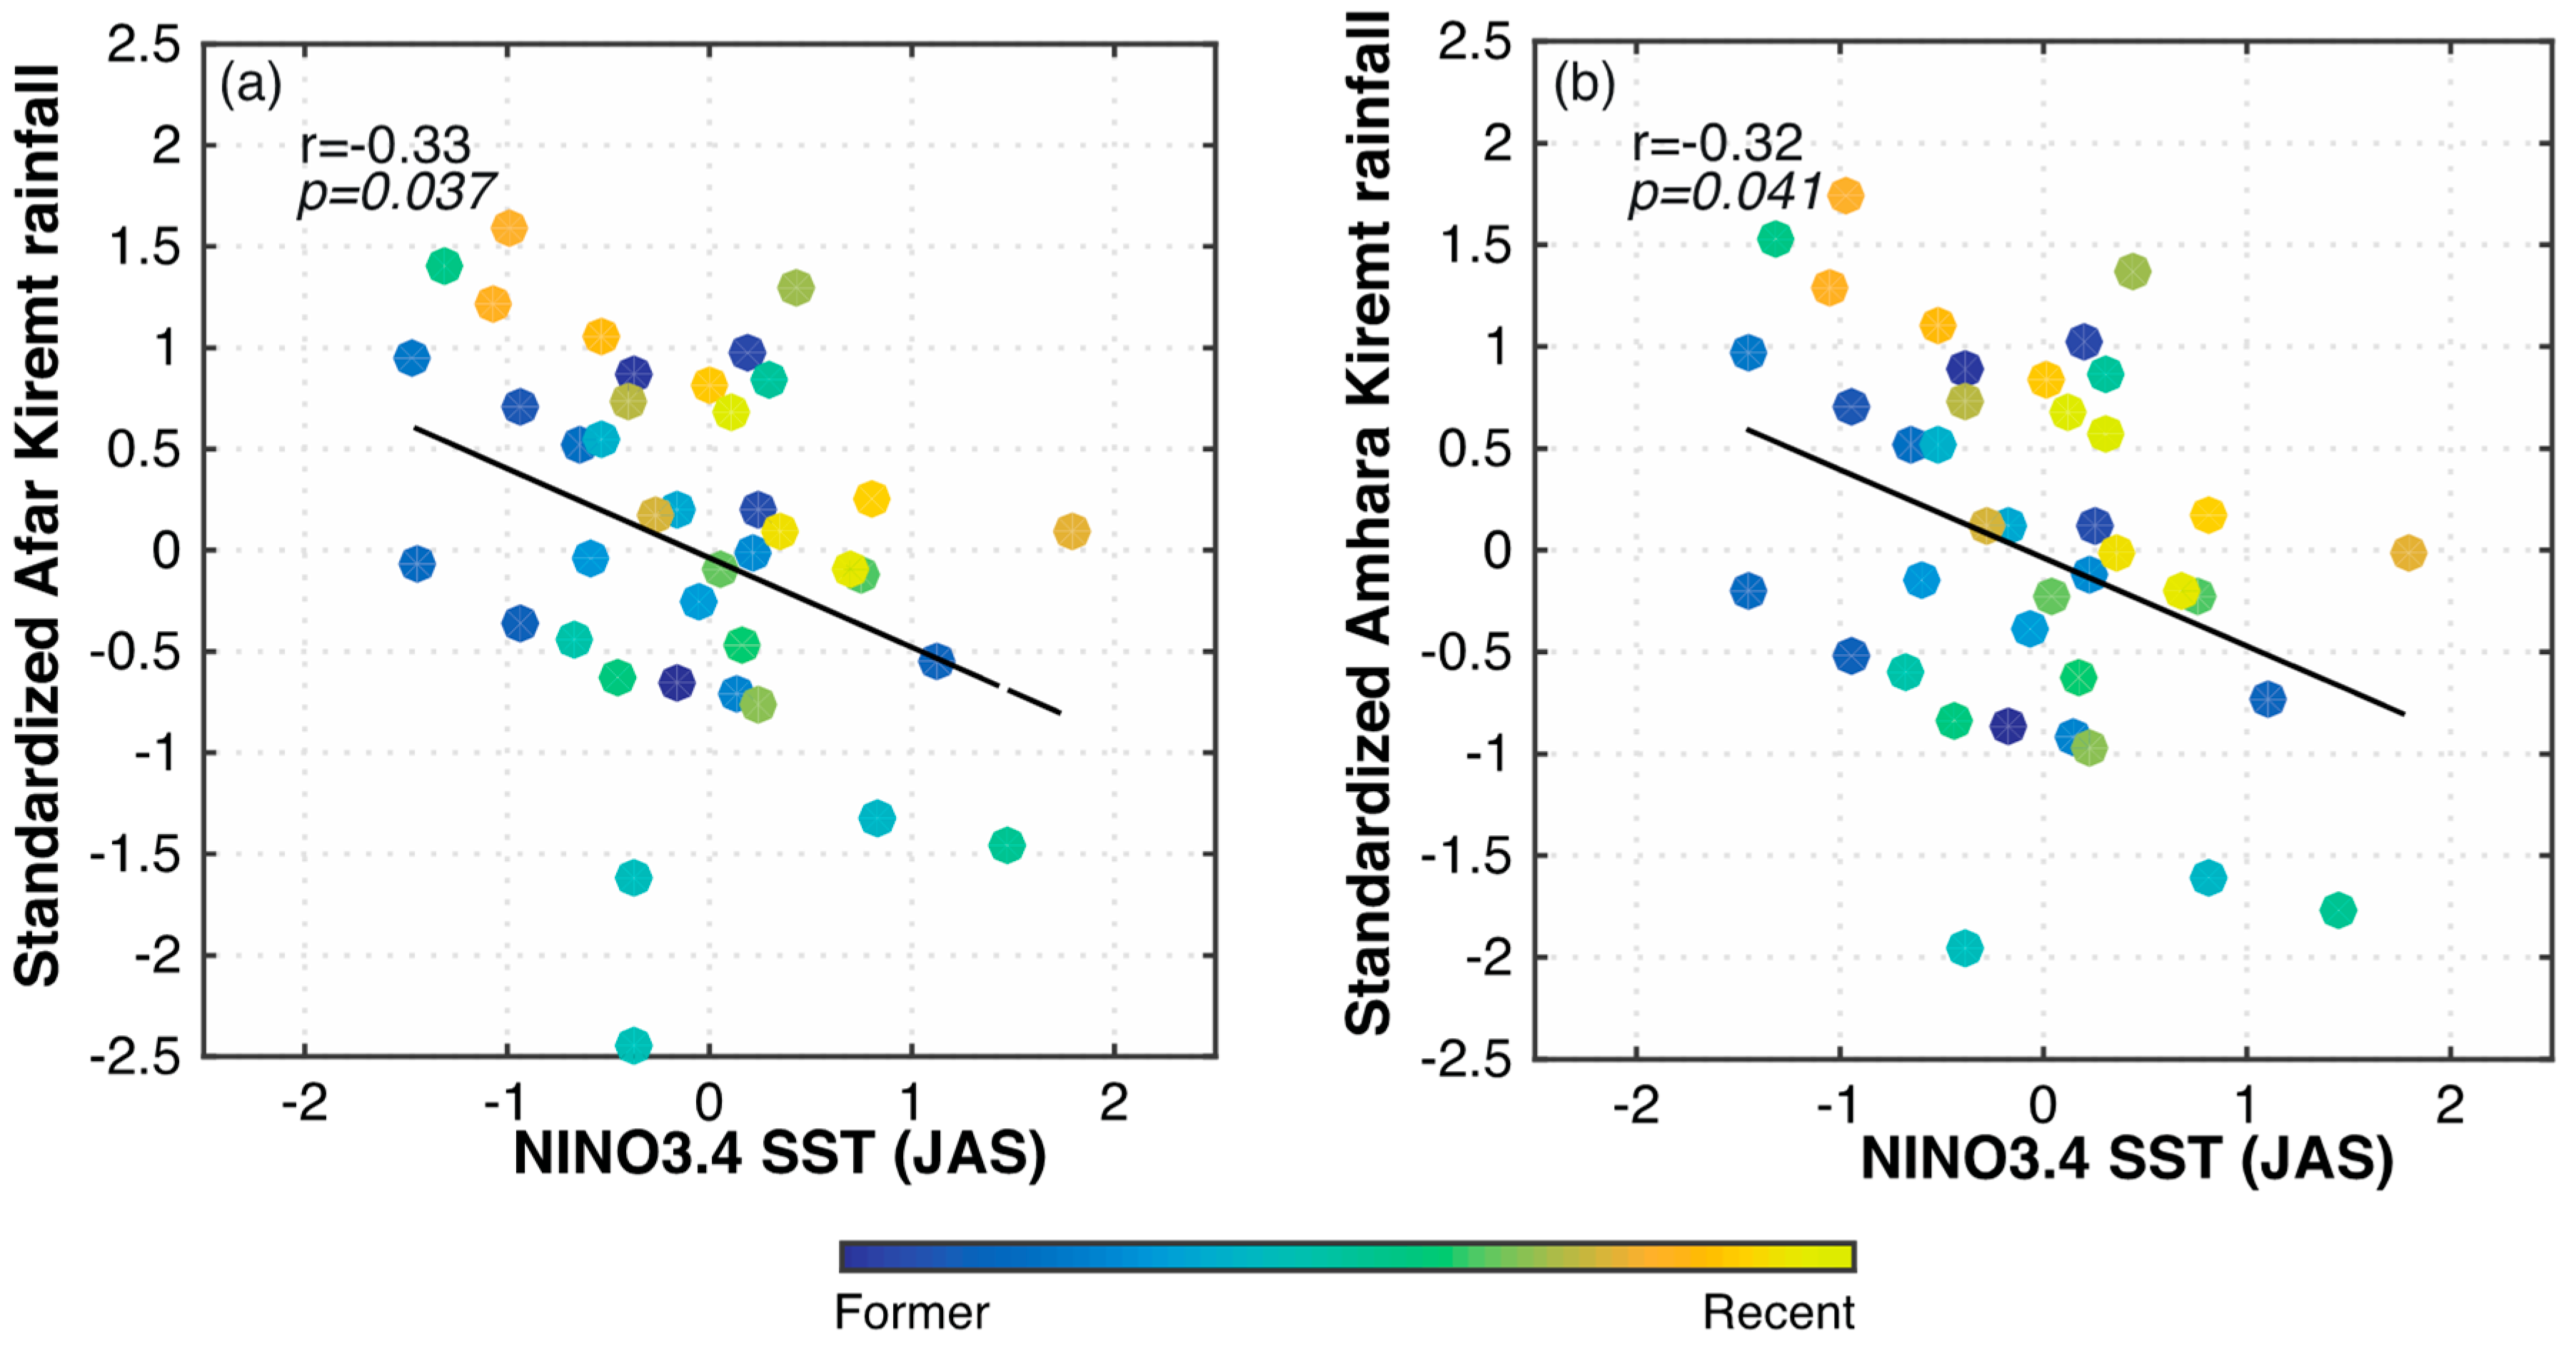
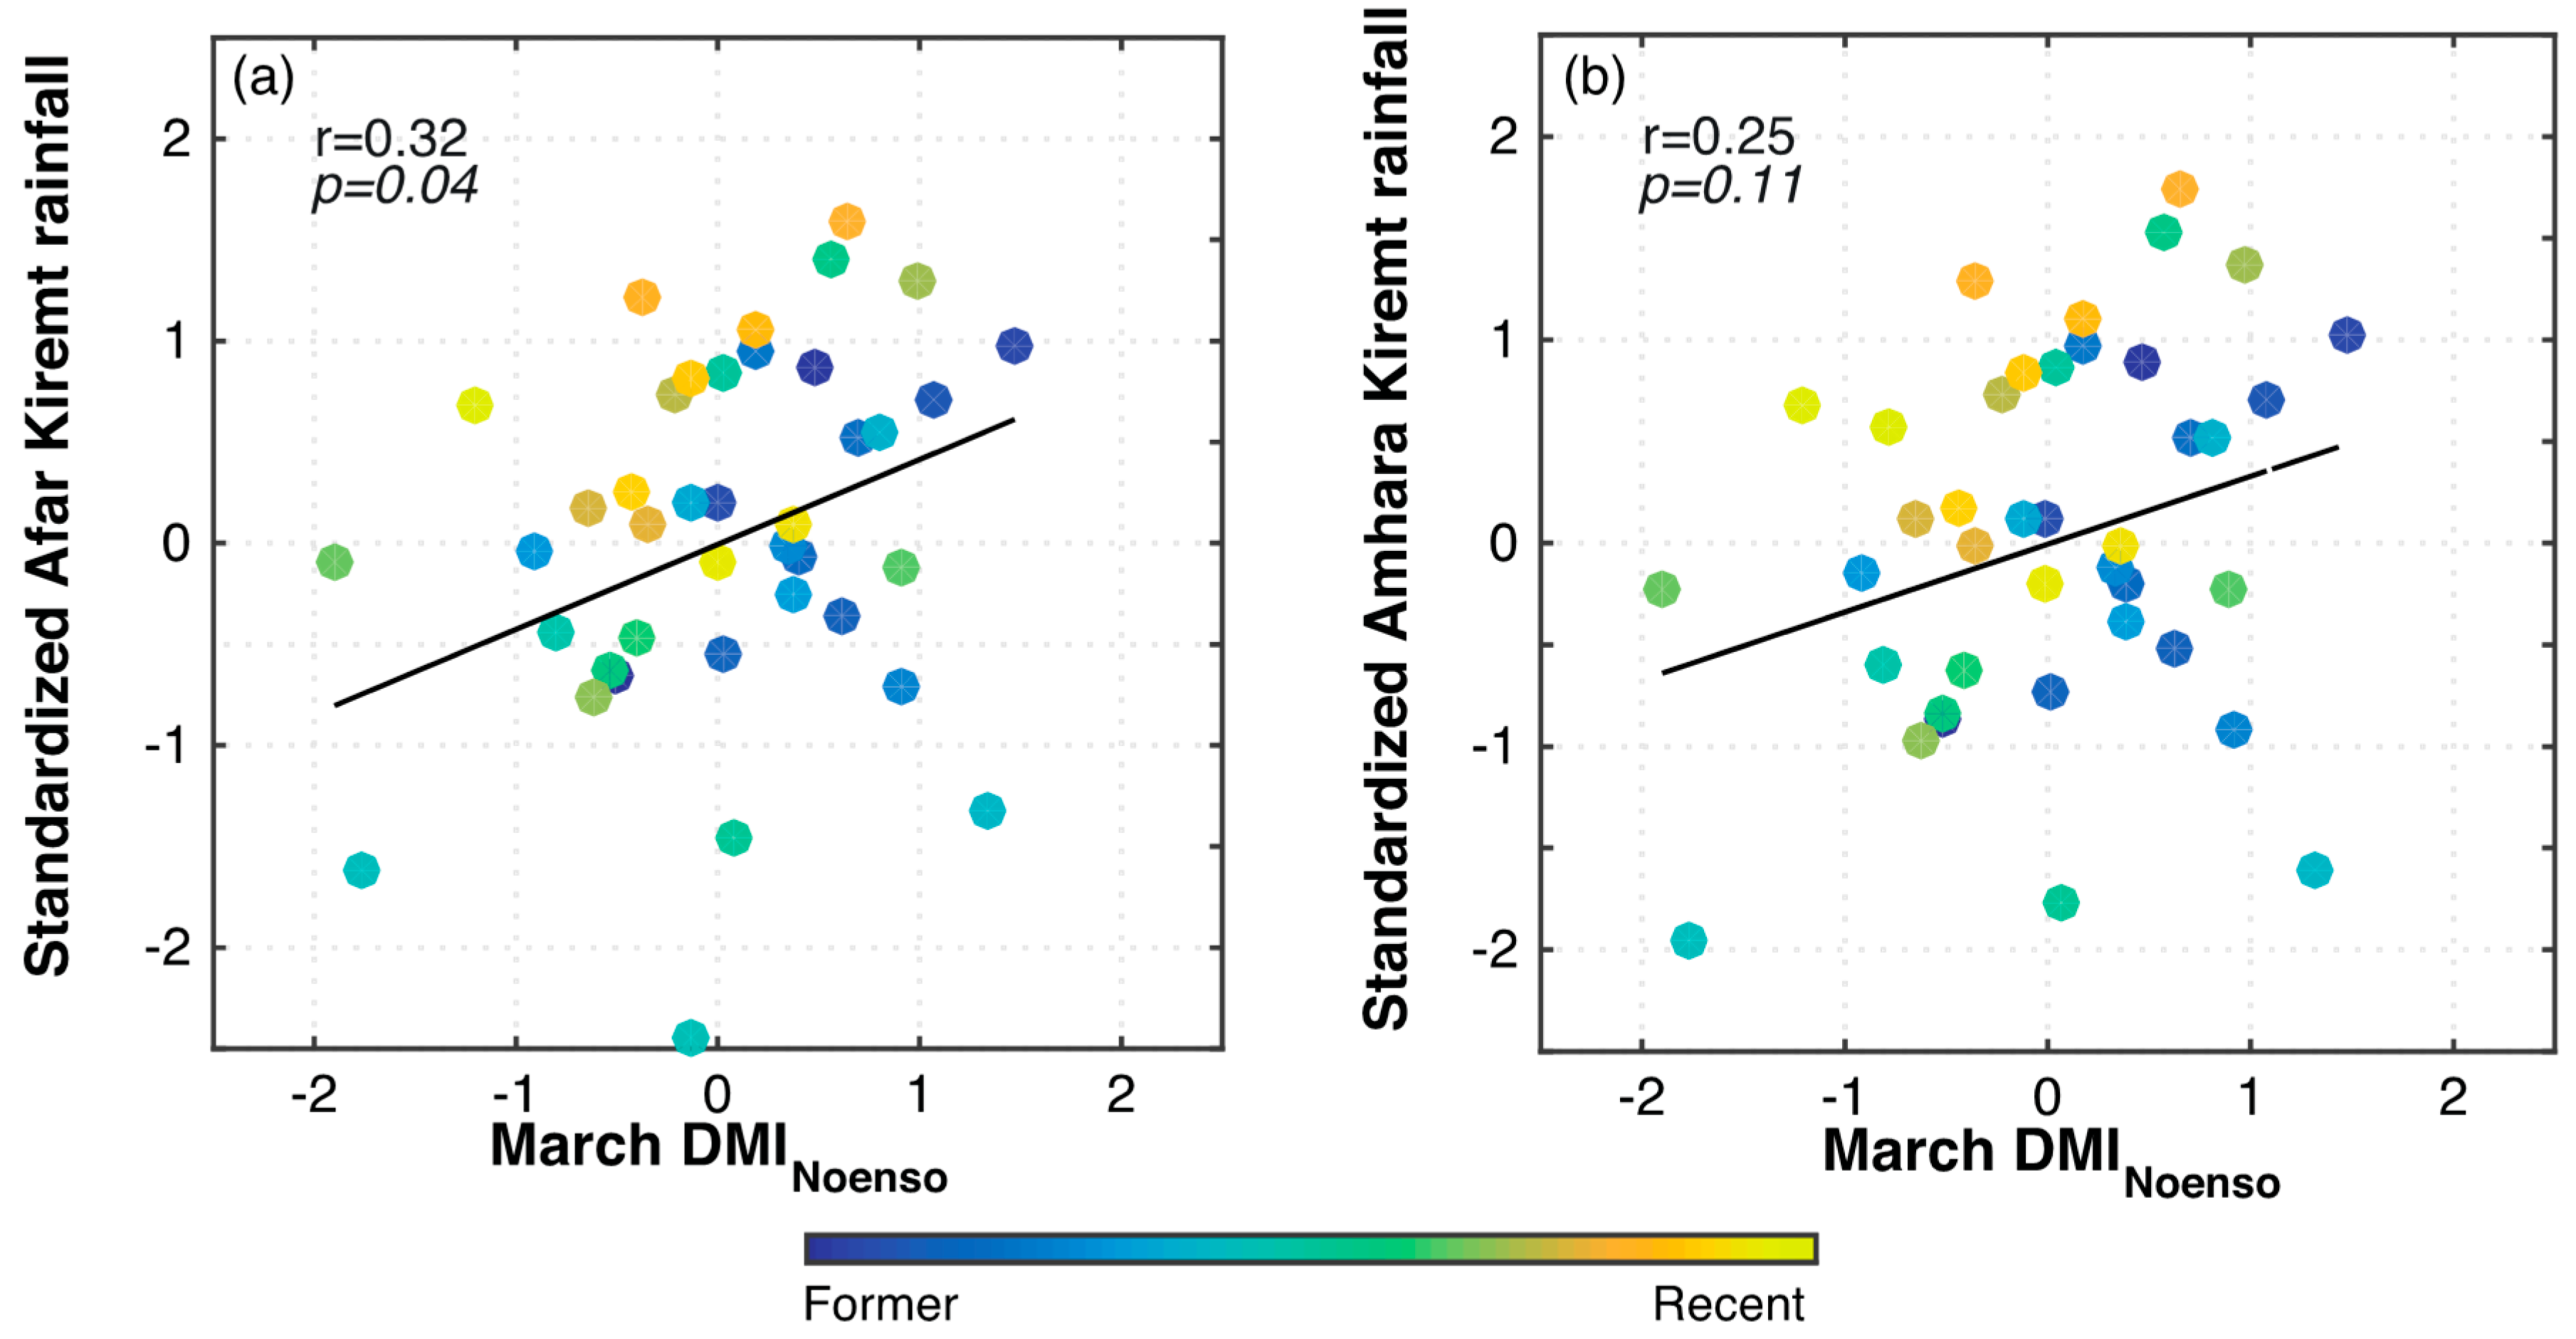
3.1. Trends in Regional Rainfall and Correlations with Large-Scale Circulation Indices

Temporal trends in regional and individual rainfall data series were investigated in detail. Trend analysis of regional and station rainfall data series showed no statistically significant long–term trends. Amhara Kiremt rainfalls showed slightly increasing trends, while Kiremt in Afar showed a slightly decreasing trend during the same period (none statistically significant). Weak positive trends in Kiremt at Logia and Dubti in Afar were not statistically significant. Similarly, trends in Kiremt rainfalls were insignificant for all stations in Amhara, although Dessie and Mersa stations showed weak positive trends with negative trends at Karakore (none statistically significant). A number of other studies have also concluded that there is no evidence of any long-term trend or change in rainfall for different parts of the country, including Afar and Amhara [31,32,33,34]. Neither modeled rainfall time-series (see Section 3.2), nor the predictor indices, showed any statistically significant trends, although trends in modeled Afar rainfall show a weak positive trend in contrast to weak negative regional trends. Likewise, the distribution of residuals against predicted values (1966–2006) of Kiremt rainfall showed no trend for either Afar or Amhara, and no changes in rainfall caused by other factors were detected.
Seasonal and interannual correlations between regional rainfalls and circulation indices suggest that positive/negative Kiremt anomalies are strongly linked to ENSO (Figure 3). The same is also reflected in the composite maps of seasonal SST anomalies during the months of June to July for the driest and wettest years in Afar and Amhara (Figure 4). The driest years in Afar and Amhara coincide with warm anomalies in the equatorial Pacific corresponding to El Niño conditions, while the opposite is true for the wettest years. During the driest years in Afar and Amhara, maximum upper-level easterly anomalies are found over Northern Ethiopia and the Arabian Peninsula (Figure 5), implying the tropical westerlies in the upper troposphere are significantly weakened with zonal wind anomalies become increasingly easterly across much of eastern Africa during the driest years in Afar and Amhara. Meanwhile, during the wettest years in Amhara and Afar, there is an increase in the counterclockwise circulation anomaly over the northern Indian Ocean.
While ENSO is found to have the strongest relationships with Kiremt rainfall in both Amhara and Afar, statistically significant correlations were also evident between Kiremt rainfall in Afar and DMINOENSO during the preceding month of March (Figure 6), with weaker correlations in Amhara. The correlation between DMINOENSO and regional rainfall is slightly weaker than with the original DMI index. Note, however, that if we exclude the weaker IOD years from the analysis (i.e., <+0.5 standard score for positive IOD years and >−0.5 standard score for negative IOD years), DMINOENSO has a stronger correlation with regional Kiremt rainfall (R = 0.41 for Afar and R = 0.35 for Amhara). A strong positive relationship between summer rainfall and the IOD during the boreal spring suggests strengthening of the regional monsoon after the peaking phase (i.e., between September and November) of the IOD with a lead-time of ~8 months. In the next sections, we turn to the main focus of this study: Whether the IOD has an influence on the seasonal monsoon patterns in Northern Ethiopia that is independent of ENSO.

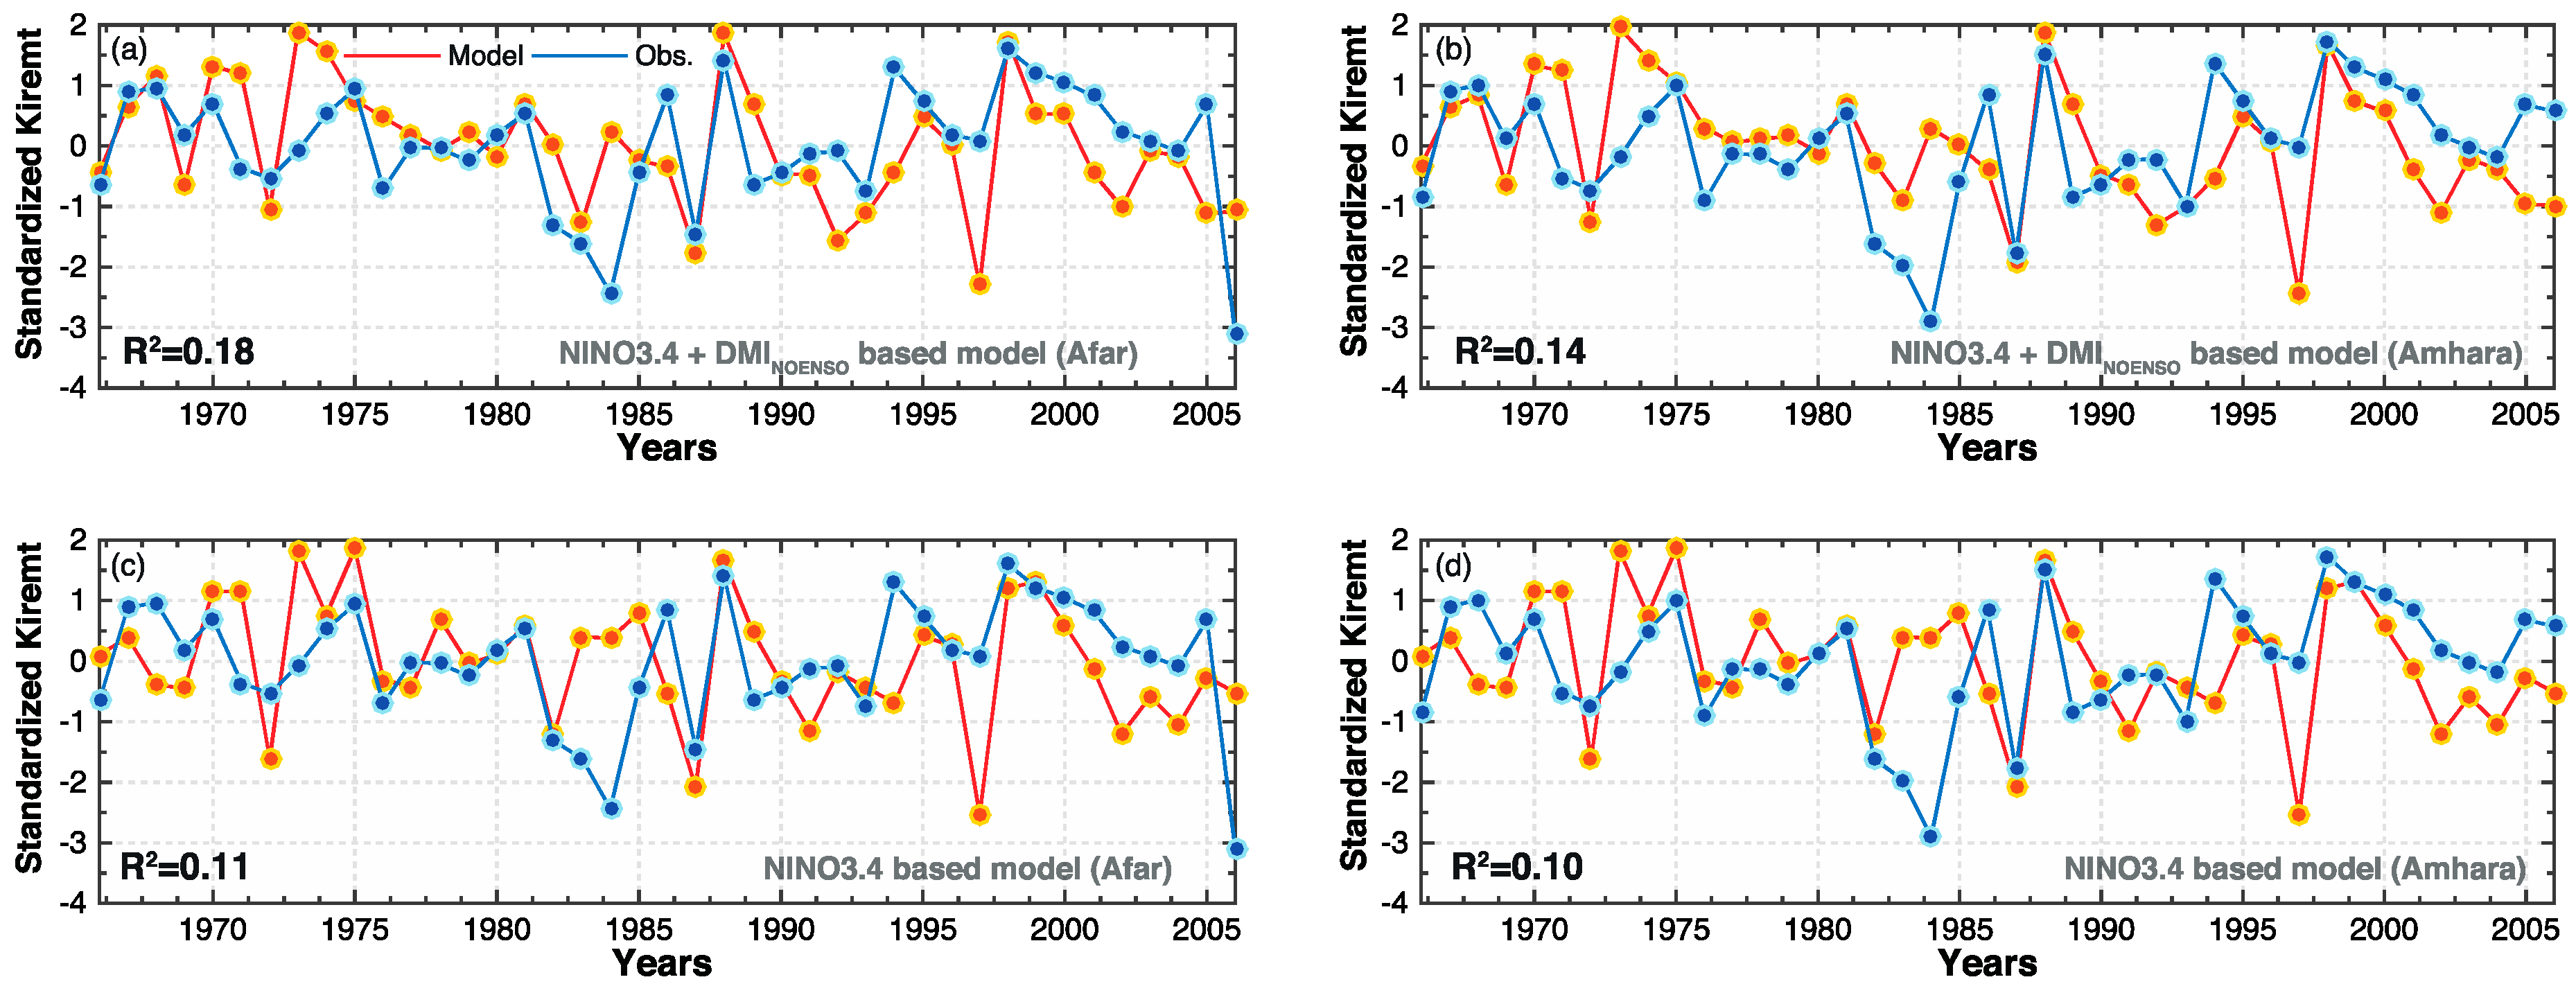
3.2. New Statistical Models for Regional Kiremt Rainfall

We developed multi-linear regression models for predicting regional Kiremt rainfalls in Afar and Amhara, and evaluated the contribution of the large-scale circulation indices after removing the direct and lagged ENSO signal from the IOD. The regression coefficients for predicting normalized regional Kiremt rainfalls from normalized predictor indices (NINO3.4) for July–September and DMINOENSO for March–April are shown in Table 2. Correlation between Kiremt rainfall and NINO3.4 and DMINOENSO were calculated. The NINO3.4 is the most influential predictor of Kiremt rainfalls in Afar and Amhara. The highest correlations between Kiremt rainfall and NINO3.4 are obtained at zero months lag, and there is no further significant relationship after 3 months lag; whereas the highest correlations between Kiremt rainfall and DMINOENSO were obtained for March–April. Input predictors were constructed based on these observations as potential predictor sets for Kiremt rainfall. The predictors were admitted in to the model after employing stepwise selection procedure. The regression equations were fitted to all data and cross-validated over the 1966–2006 period. There is no significant serial correlation in the residuals for either region.
Figure 7a,b show modeled and observed regional rainfall for the period 1966–2006 using the new predictor set (NINO3.4 + DMINOENSO). The same is shown using the NINO3.4 as the only predictor for Kiremt rainfall in Figure 7c,d. The new model using the predictor set (NINO3.4 + DMINOENSO) has a higher correlation (r2 = 0.18 and r2 = 0.14 for Afar and Amhara, respectively), with a higher predictor weight for DMINOENSO in the Amhara region. The models were then compared using Akaike information criteria (Table 3). The results clearly suggest that the predictor indices (NINO3.4 + DMINOENSO) are preferred for the Afar region. These results provide empirical evidence that the predictor set (NINO3.4 + DMINOENSO) is a significantly better model of regional rainfall; that is, while ENSO predominantly controls regional Kiremt rainfall, the IOD also substantially modulates regional rainfall. Both models underestimated Kiremt rainfall for the year 1997, where the exceptionally strong El Niño year of 1997 did not result in a significant reduction of Kiremt rainfall in Afar and Amhara, as generally predicted for El Niño years.

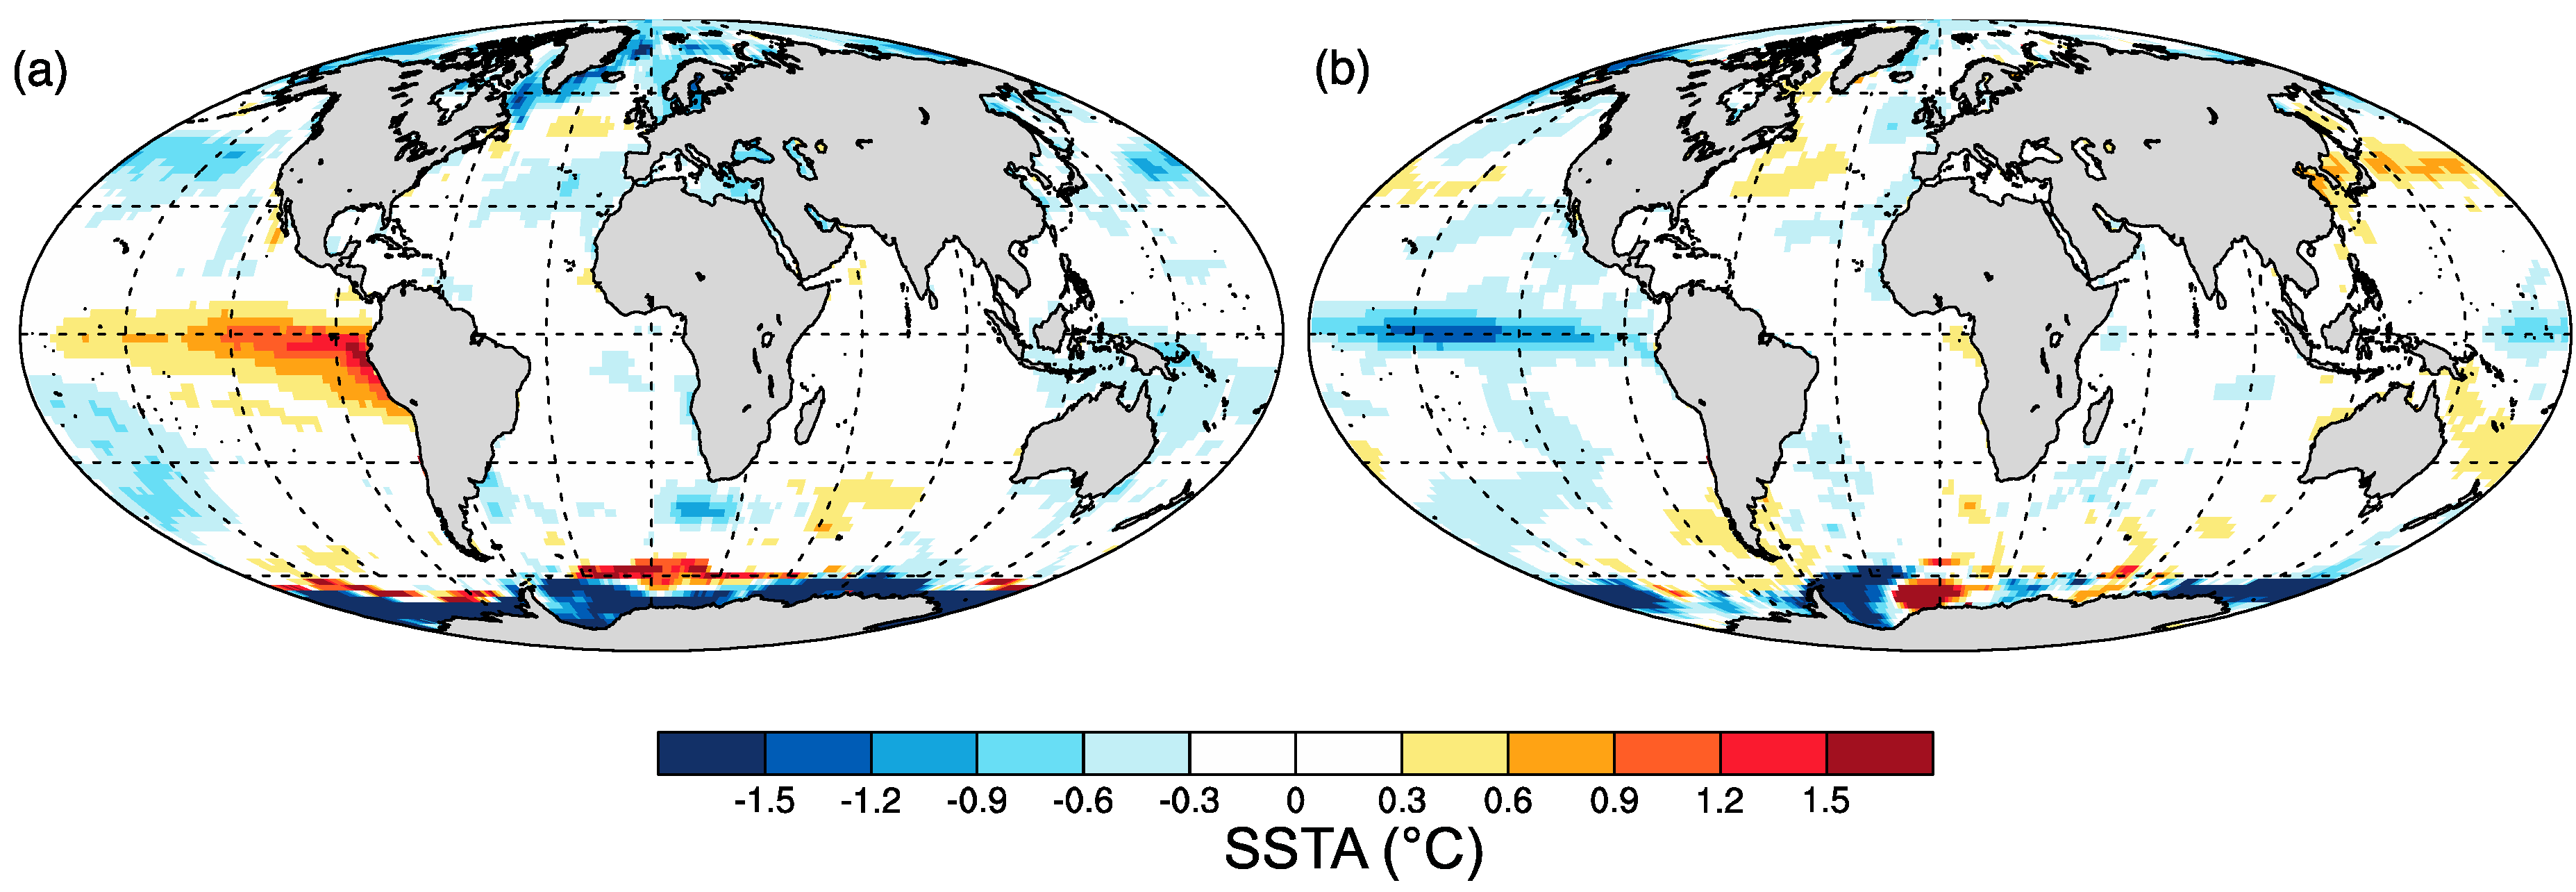
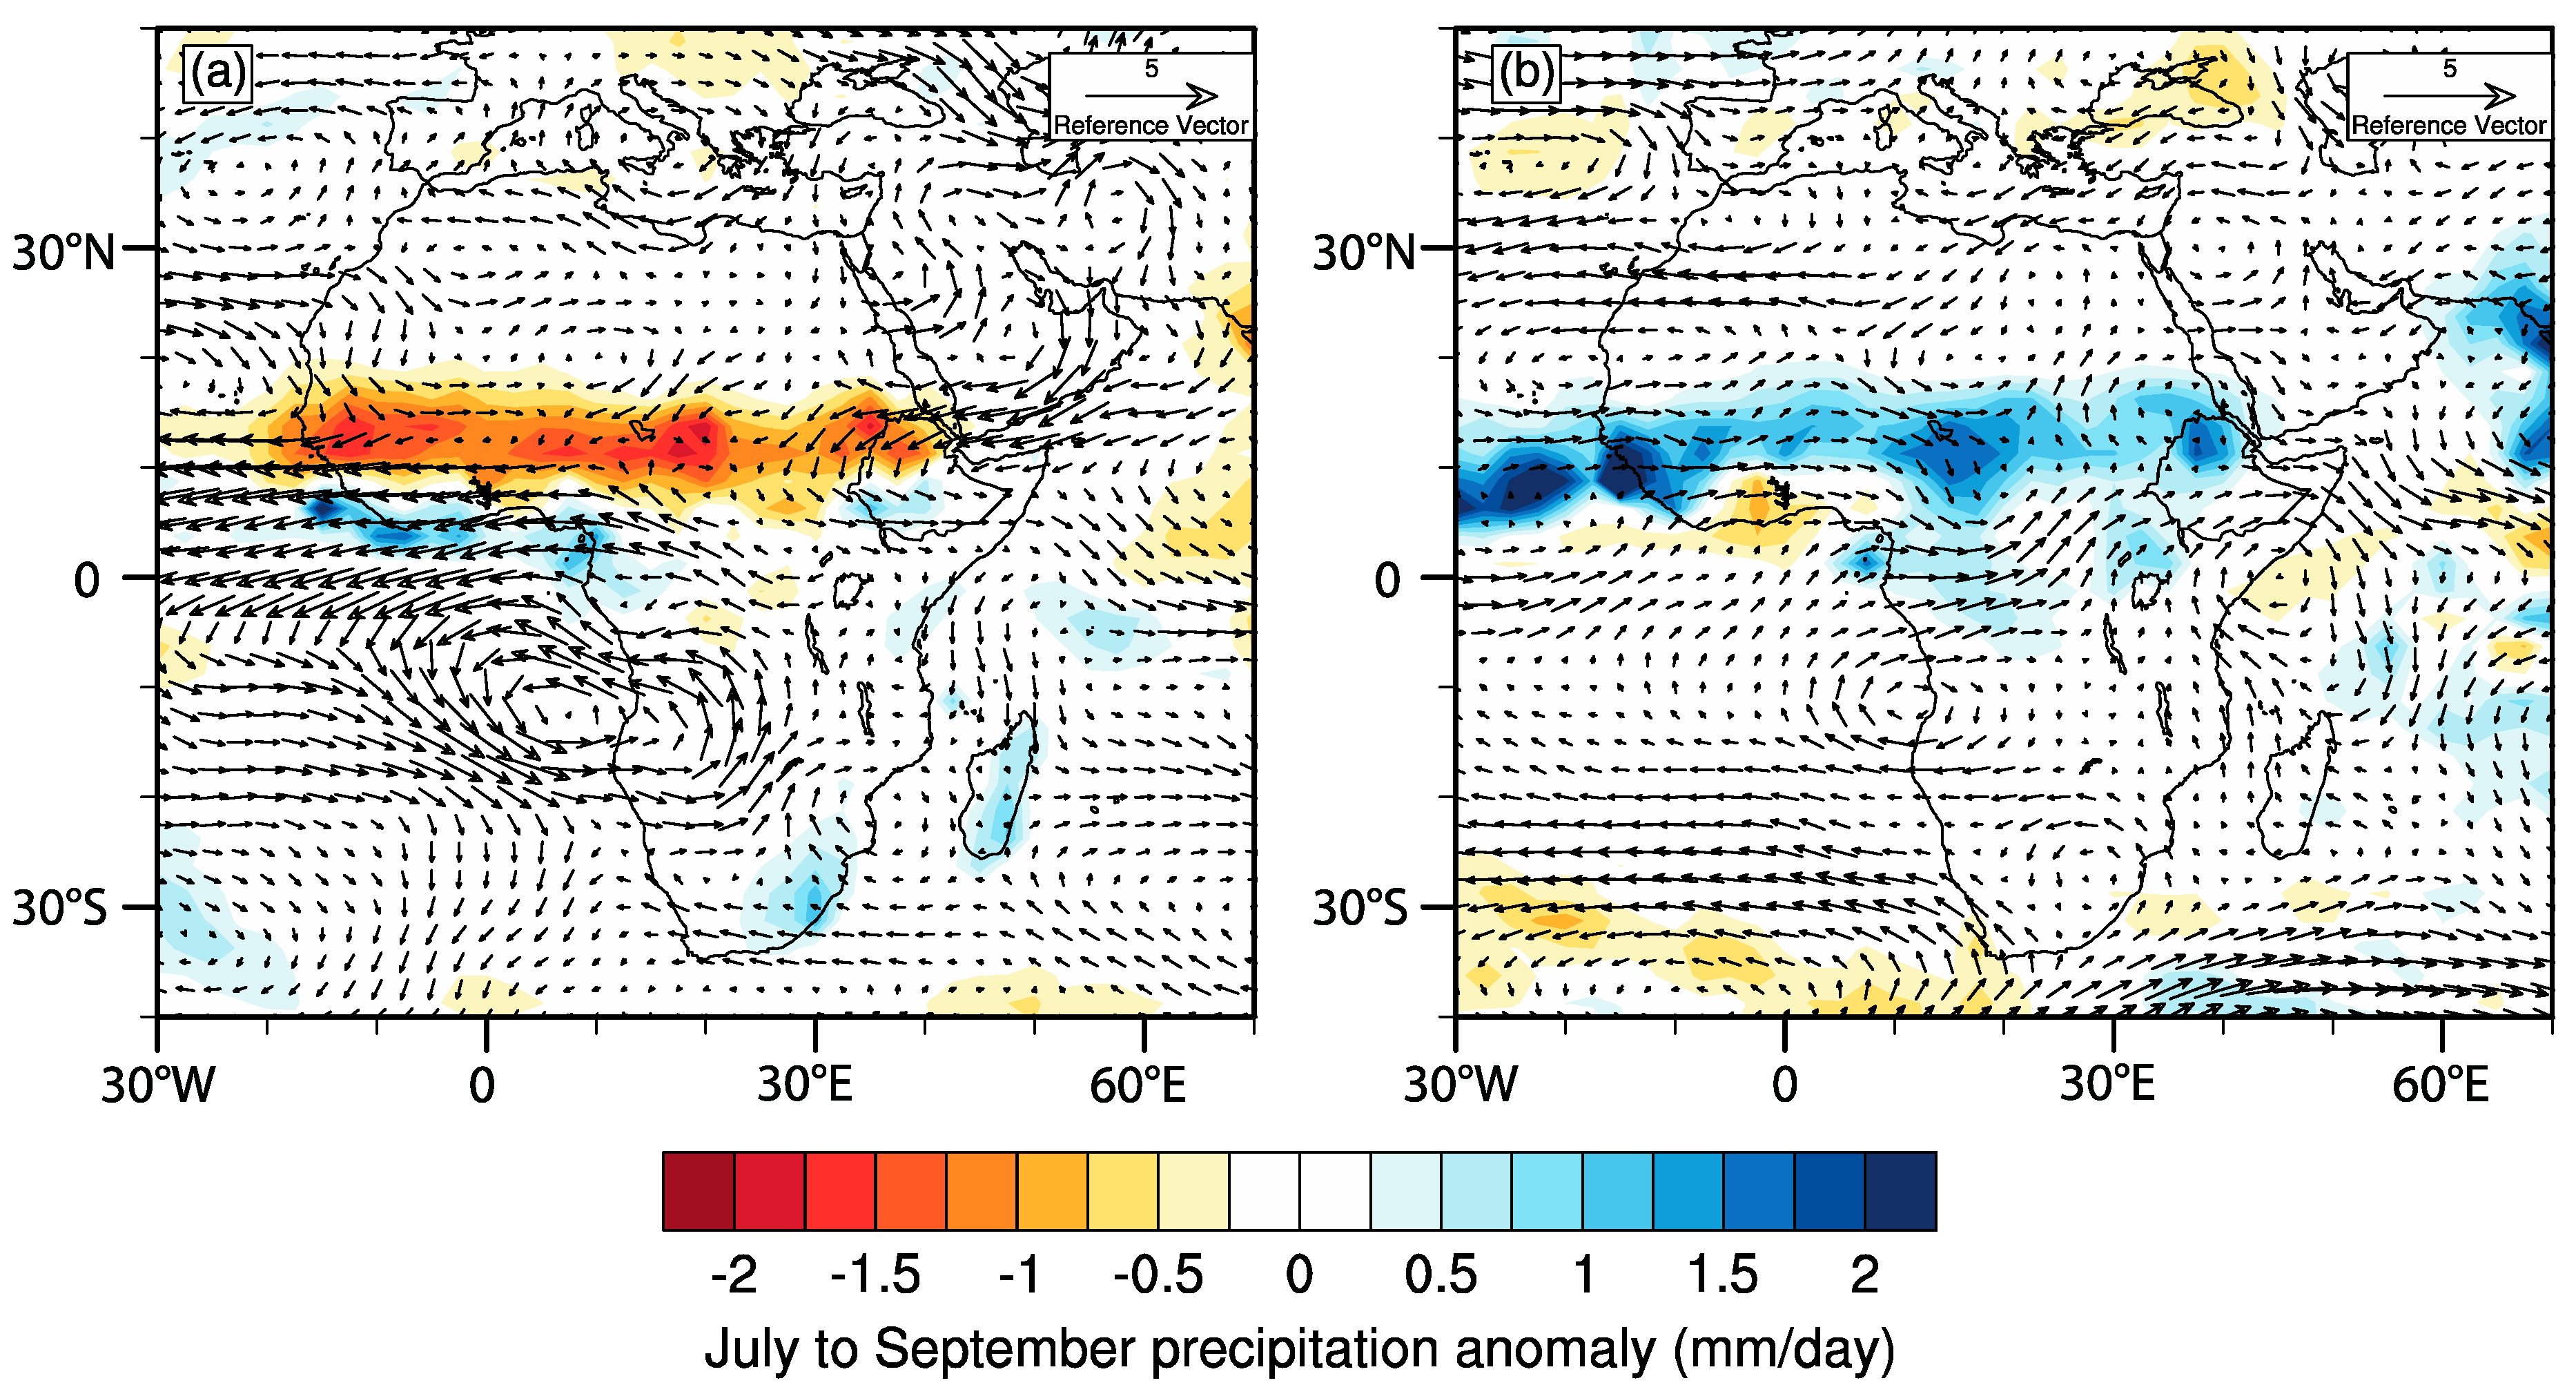
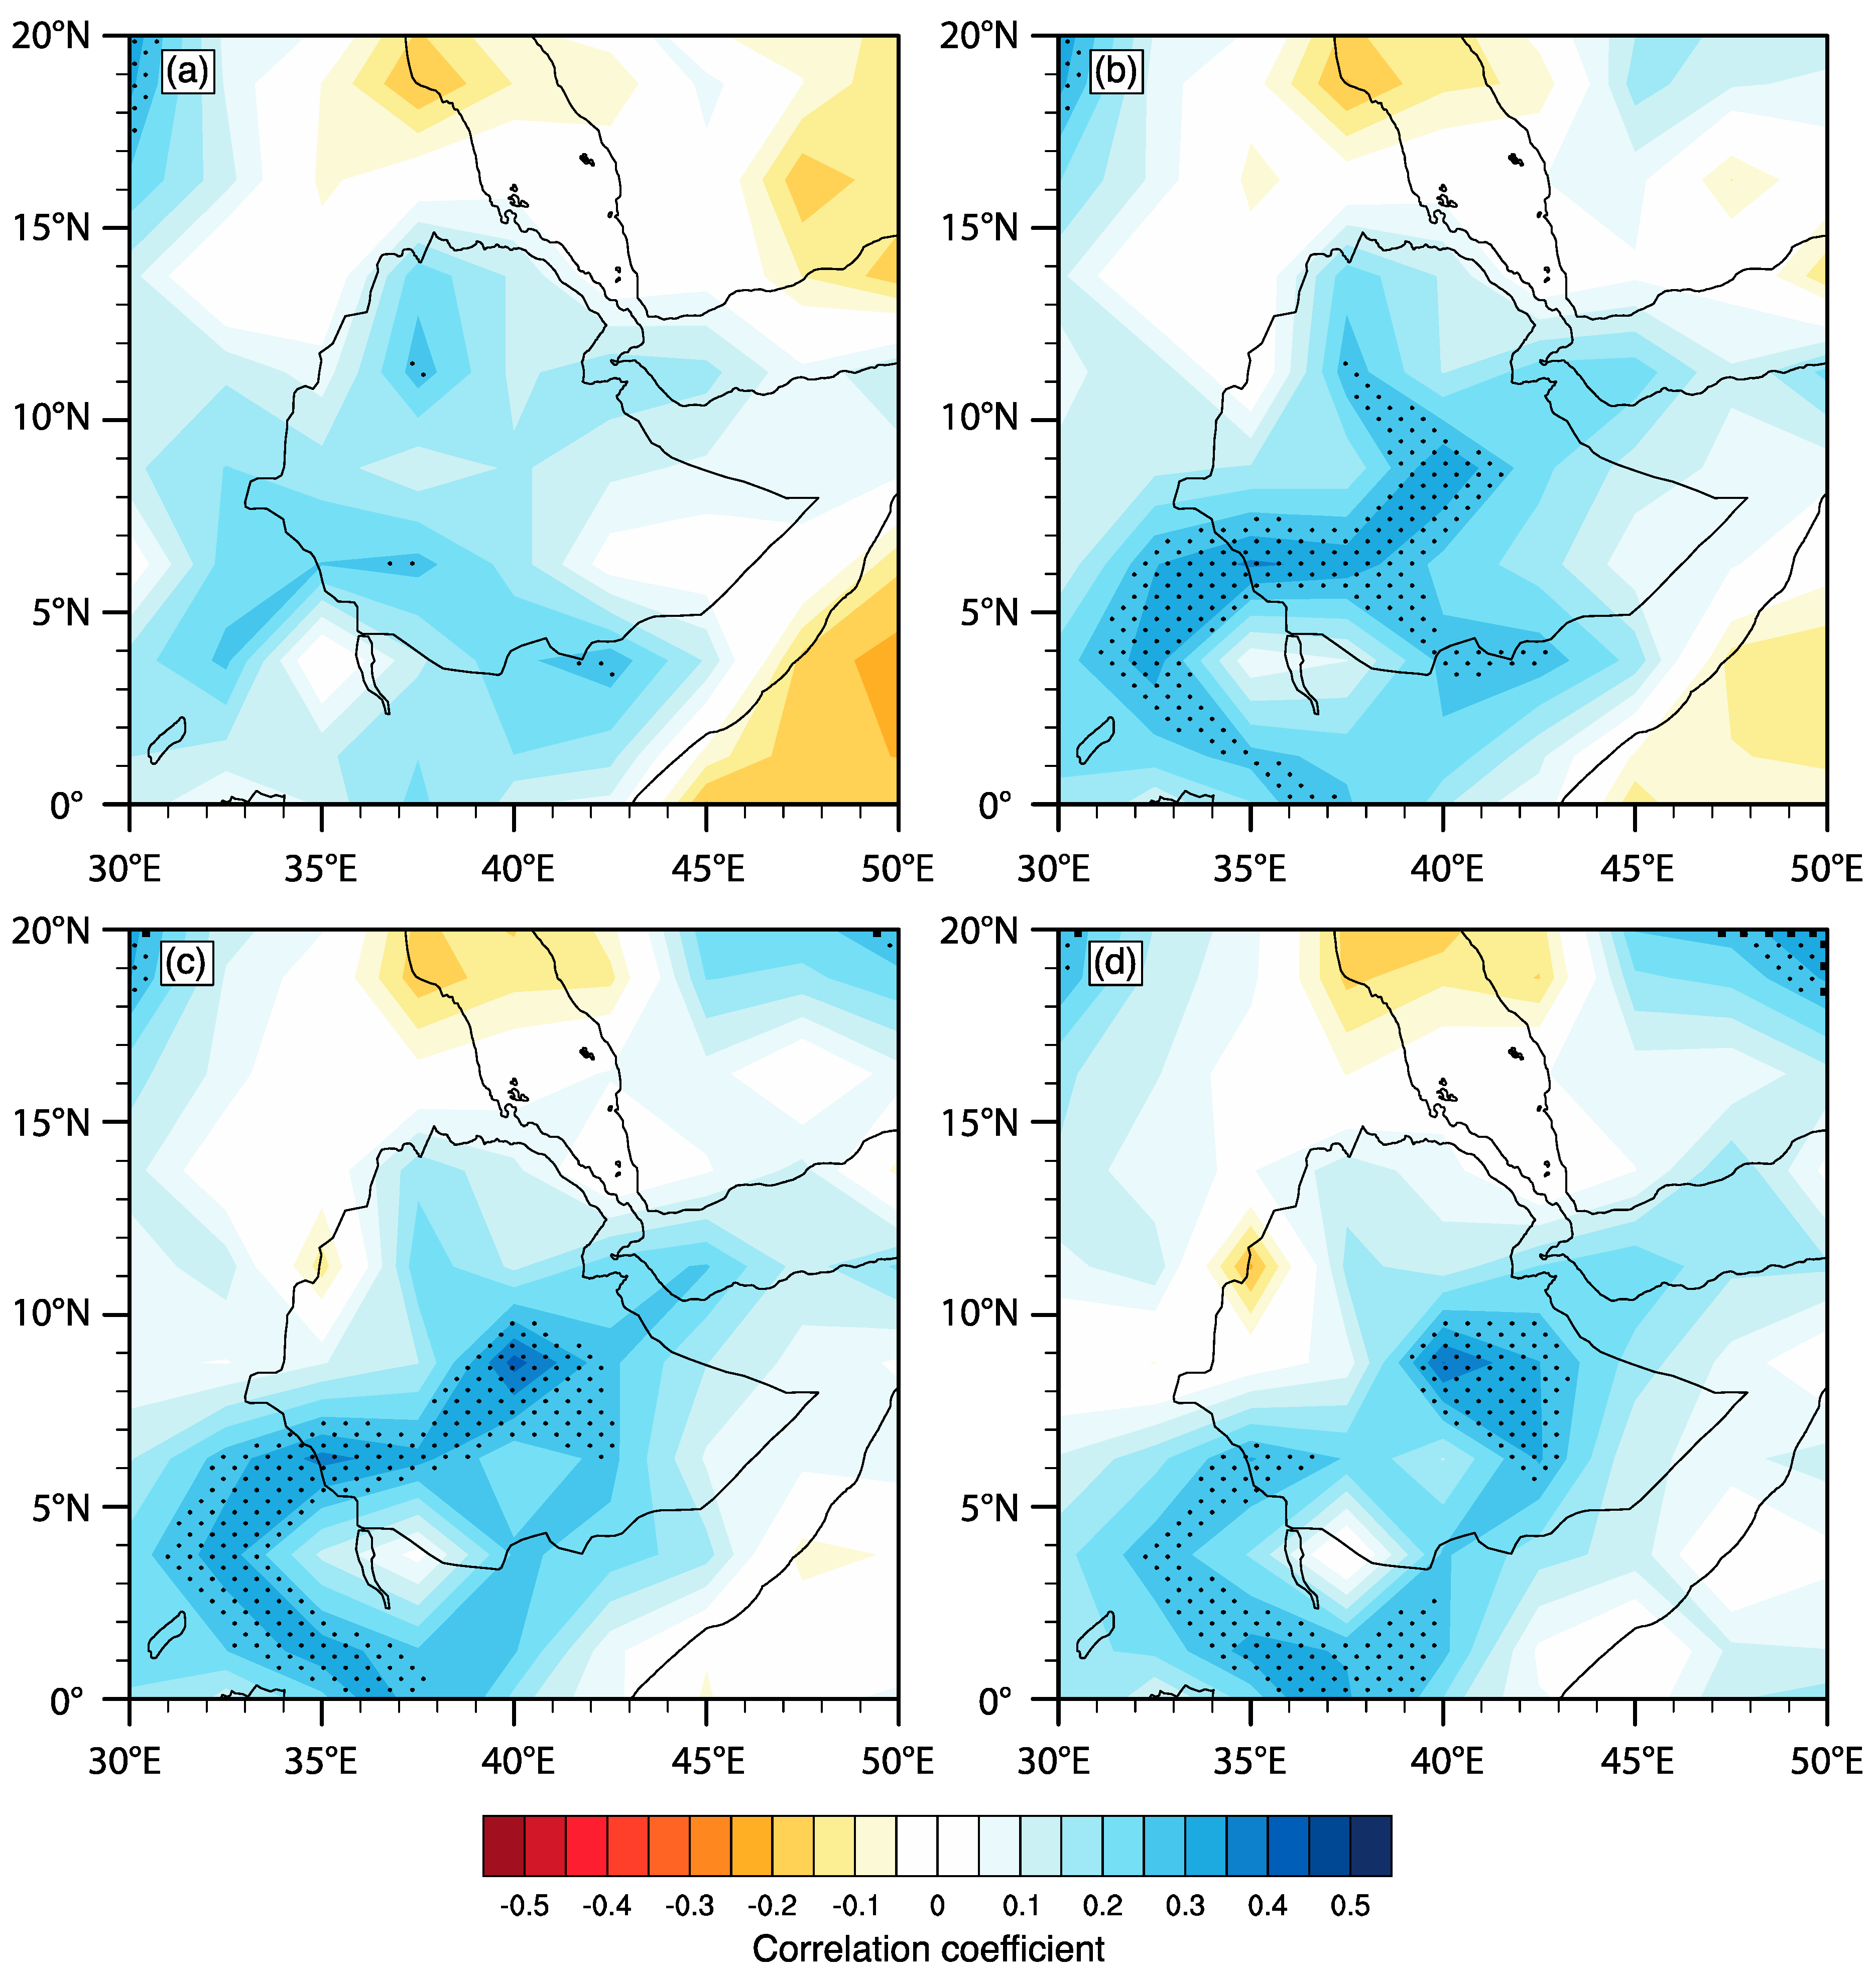
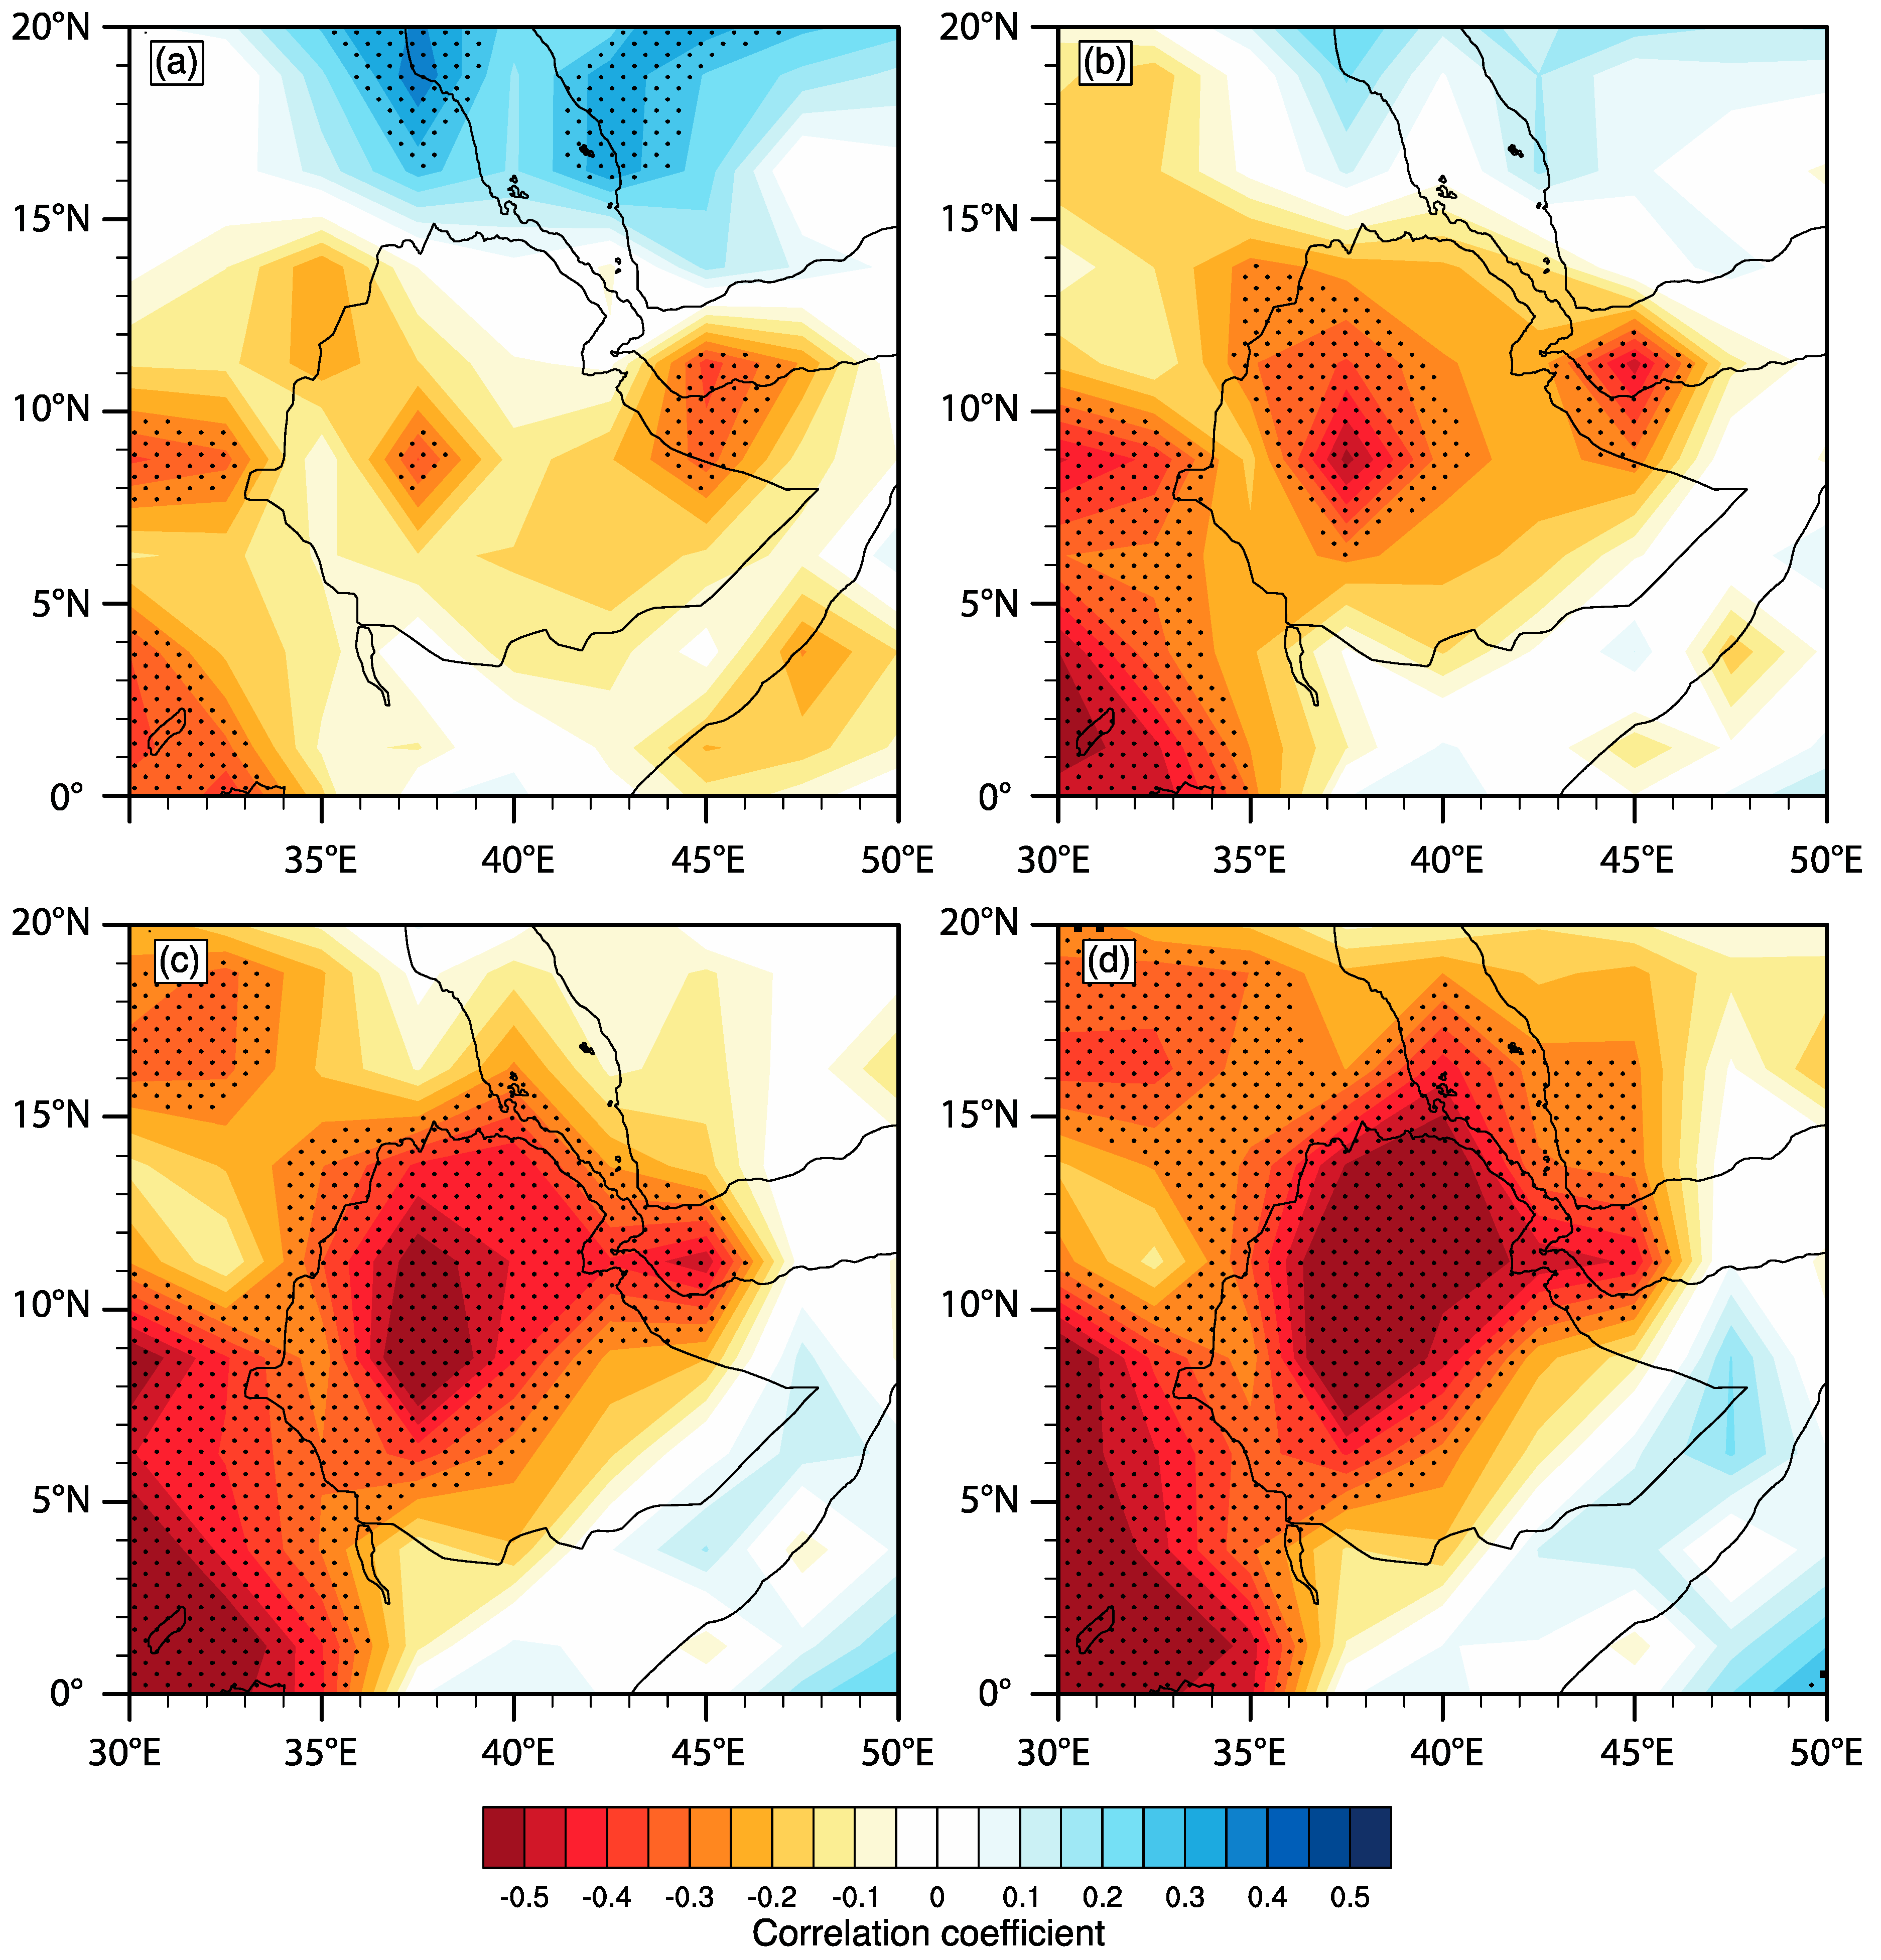
3.3. The Role of the IOD in Eastern African Rainfall

Previous studies have identified a variety of drivers of seasonal rainfall in Ethiopia. Large scale interannual modes in the tropical Pacific and Indian Oceans, the ENSO and IOD respectively, have been shown to dominate the climate and rainfall patterns in East Africa over the last centuries [35], while little is known in regards to the influence of the IOD (i.e., independent of the ENSO). The IOD is a coupled mode of SST variability in the tropical Indian Ocean, and is correlated with interannual variability of precipitation from East Africa to Australia to India [36,37,38,39,40,41,42]. Although, the impact of the IOD on eastern African rainfall is thought to be strongest from September to November [41], it has also been shown that extreme positive IOD events are associated with above-average precipitation over southern East Africa during the monsoon season [36]. However, there is little evidence as to whether IOD has an influence independent of ENSO.
The IOD is a coupled mode of SST variability in the tropical Indian Ocean and is often considered as a direct extension of the ENSO. In order to assess the contribution and impact of the “independent” IOD on seasonal rainfall patterns and quantify the statistical relation between the IOD and Kiremt rainfall, correlation analysis was conducted using the new DMINOENSO index and Ethiopian rainfall based on the GPCC dataset. A recent study [43] shows that the GPCC dataset is in good agreement with seasonal observations and spatiotemporal patterns over longer periods over the region. Correlations between Kiremt rainfall and DMINOENSO suggest that the IOD has significant positive lag-impact on Kiremt rainfall over large areas of Ethiopia (Figure 8). The lagged relationship between the IOD and Kiremt rainfall is relatively weaker within three-months lead-time compared to the ENSO (Figure 9). Nonetheless, the link between Kiremt rainfall and the IOD is statistically significant over large parts of Ethiopia, and suggests positive phases of the IOD are linked to strengthening of Kiremt over large parts of Ethiopia. As the IOD peaks in boreal fall, it has a strong influence on the contemporaneous rainfall variations over the next rainy season, with a lead-time of up to three months, while the ENSO has a much shorter lead-time (Figure 9). A strong positive relationship between Kiremt and NINO3.4 suggests that the anomalous response of Kiremt rainfall over Northern Ethiopia is dominantly controlled by the ENSO, while a matured IOD phase can also serve as a potential predictor for Kiremt rainfall. Statistically, Kiremt over Northern Ethiopia can be predicted at six months lead-time if IOD is used as a precursor, particularly following positive phases of the IOD (Figure 10).
To further examine the IOD’s influence on Kiremt rainfall, we have selected the strongest positive IOD (>+1 standard score) and negative IOD years (<−1 standard score) based on the new DMINOENSO index for the months between September–November. Accordingly, the years of 1988, 1994, and 1997 constitute the positive phases of the IOD, while 1980, 1992, and 1996 constitute the negative phases of the IOD. All negative IOD years occur during weak El Niño/La Niña years, while 1988 and 1997 coincide with strong La Niña and El Niño years, respectively. Note that El Niño and La Niña years are strongly linked to above/below average Kiremt rainfall over large parts of Ethiopia [3,11]. The fact that the exceptionally strong El Niño year of 1997 did not result in a significant reduction of Kiremt rainfall (Figure 7) as generally predicted for El Niño years highlights the important role the IOD may play in modulating seasonal monsoon patterns across the region. The rainfall anomaly composites for the following Kiremt seasons are shown in Figure 10. As the IOD typically peaks, it has a strong influence on the contemporaneous rainfall variations over the next rainy season (Figure 8). During positive phases of the IOD, cool SST anomalies are observed over the eastern equatorial Indian Ocean, while relatively warmer SST anomalies dominate the western equatorial Indian Ocean [15]. This zonal SST gradient reinforces the south westerly monsoon winds bringing heavy rains to the East African continent, while leading to droughts over the Indonesian region; for example, [37]. The rainfall anomaly composites during the years following the strongest positive IOD years also show that rainfall over large parts of the summer monsoon over Northern Ethiopia was significantly strengthened (Figure 10). Above average Kiremt rainfall occurred in most parts of central and southern Ethiopia during the same years (Figure 10). This is likely a response to the weakening of low-level easterlies and warming of the western Indian Ocean associated with the positive phase of the IOD [15,16], which leads to a convergence over East Africa [42]. During negative phases of the IOD, these anomalous oscillations seesaw to the opposite phase and Northern Ethiopia experiences a reversal of the dipole pattern, and drier summer conditions prevail over the region (Figure 10). However, there appears to be an asymmetry between the two opposite phases of the IOD, with regional rainfall increasing during positive phases of the IOD, while the impact of the IOD on regional rainfall during the negative phases is not as pronounced. This is likely driven by the asymmetry in the teleconnection pathways of ENSO and the IOD [38]. Overall, these results confirm that the IOD exerts a significant independent regional influence on regional Kiremt rainfalls in Afar and Amhara that is consistent with the conception of the IOD as a unique coupled mode in the tropics.

4. Conclusions

Investigation of the relationship between regional Kiremt rainfalls and large-scale circulation indices show that ENSO has strong and widespread influences on seasonal monsoon patterns in Northern Ethiopia. In that, El Niño/La Niña events are associated with below/above average Kiremt rainfall (often used as the main proxy defining drought and wet years in the regions). Our analysis confirms that regional Kiremt rainfalls in Afar and Amhara are predominantly modulated by the ENSO, but also show that the IOD exerts a significant independent regional influence. This is consistent with the conception of the IOD as a unique coupled mode in the tropics, and may have important implications in boosting seasonal forecasting skills in these regions, where seasonal monsoon rainfall variability is mainly controlled by combined effects of various large-scale coupled Ocean Atmosphere oscillations.

Author Contributions

Conceptualization, D.G., D.R., and H.W.L.; Methodology, D.G., D.R., and H.W.L; Formal analysis, D.G.; Investigation, D.G.; Writing, D.G. with contribution from D.R. and H.W.L.

Funding

This research received no external funding.

Acknowledgments

We are grateful to the Ethiopian National Metrological Services Agency for providing rainfall data. We thank three anonymous reviewers for their careful reading of the manuscript and helpful comments.

Conflicts of Interest

The authors declare no conflict of interest.

References

  1. Gissila, T.; Black, E.; Grimes, D.I.F.; Slingo, J.M. Seasonal forecasting of the Ethiopian summer rains. Int. J. Climatol. 2004, 24, 1345–1358. [Google Scholar] [CrossRef]
  2. Indeje, M.; Semazzi, F.H.; Ogallo, L.J. ENSO signals in East African rainfall seasons. Int. J. Climatol. 2000, 20, 19–46. [Google Scholar] [CrossRef]
  3. Korecha, D.; Barnston, A.G. Predictability of June–September Rainfall in Ethiopia. Mon. Weather Rev. 2007, 135, 628–650. [Google Scholar] [CrossRef]
  4. Segele, Z.T.; Lamb, P.J.; Leslie, L.M. Large-scale atmospheric circulation and global sea surface temperature associations with Horn of Africa June–September rainfall. Int. J. Climatol. 2009, 29, 1075–1100. [Google Scholar] [CrossRef]
  5. Diro, G.T.; Black, E.; Grimes, D.I.F. Seasonal forecasting of Ethiopian spring rains. Meteorol. Appl. 2008, 1, 73–83. [Google Scholar] [CrossRef]
  6. Diro, G.T.; Grimes, D.I.F.; Black, E. Teleconnections between Ethiopian summer rainfall and sea surface temperature: Part II. Seasonal forecasting. Clim. Dyn. 2011, 37, 121–131. [Google Scholar] [CrossRef]
  7. Endris, H.S.; Lennard, C.; Hewitson, B.; Dosio, A.; Nikulin, G.; Panitz, H.J. Teleconnection responses in multi-GCM driven CORDEX RCMs over Eastern Africa. Clim. Dyn. 2016, 46, 2821–2846. [Google Scholar] [CrossRef]
  8. Nicholson, S.E. The spatial coherence of African rainfall anomalies: Interhemispheric teleconnections. J. Appl. Meteorol. Climatol. 1986, 25, 1365–1381. [Google Scholar] [CrossRef]
  9. Marchant, R.; Mumbi, C.; Behera, S.; Yamagata, T. The Indian Ocean dipole–the unsung driver of climatic variability in East Africa. Afr. J. Ecol. 2007, 45, 4–16. [Google Scholar] [CrossRef]
  10. Black, E. The relationship between Indian Ocean sea–surface temperature and East African rainfall. Philos. Trans. A. Math. Phys. Eng. Sci. 2005, 363, 43–47. [Google Scholar] [CrossRef]
  11. Degefu, M.A.; Rowell, D.P.; Bewket, W. Teleconnections between Ethiopian rainfall variability and global SSTs: Observations and methods for model evaluation. Meteorol. Atmos. Phys. 2017, 129, 173–186. [Google Scholar] [CrossRef]
  12. Ashok, K.; Guan, Z.; Yamagata, T. A look at the relationship between the ENSO and the Indian Ocean dipole. J. Meteorol. Soc. Jpn. 2003, 81, 41–56. [Google Scholar] [CrossRef]
  13. Stuecker, M.F.; Timmermann, A.; Jin, F.F.; Chikamoto, Y.; Zhang, W.; Wittenberg, A.T.; Widiasih, E.; Zhao, S. Revisiting ENSO/Indian Ocean dipole phase relationships. Geophys. Res. Lett. 2017, 44, 2481–2492. [Google Scholar] [CrossRef]
  14. Allan, R.; Chambers, D.; Drosdowsky, W.; Hendon, H.; Latif, M.; Nicholls, N.; Smith, I.; Stone, R.; Tourre, Y. Is there an Indian Ocean dipole and is it independent of the El Niño-Southern Oscillation. CLIVAR Exch. 2001, 21, 18–22. [Google Scholar]
  15. Saji, N.; Goswami, B.N.; Vinayachandran, P.; Yamagata, T. A dipole mode in the tropical Indian Ocean. Nature 1999, 401, 360–363. [Google Scholar] [CrossRef] [PubMed]
  16. Webster, P.J.; Moore, A.M.; Loschnigg, J.P.; Leben, R.R. Coupled ocean–atmosphere dynamics in the Indian Ocean during 1997–98. Nature 1999, 401, 356–360. [Google Scholar] [CrossRef] [PubMed]
  17. Shanko, D.; Camberlin, P. The effects of the Southwest Indian Ocean tropical cyclones on Ethiopian drought. Int. J. Climatol. 1998, 18, 1373–1388. [Google Scholar] [CrossRef]
  18. Degefu, W. Some Aspects of Meteorological Drought in Ethiopia; Cambridge University Press: Cambridge, UK, 1987. [Google Scholar]
  19. Diro, G.T.; Tompkins, A.M.; Bi, X. Dynamical downscaling of ECMWF Ensemble seasonal forecasts over East Africa with RegCM3. J. Geophys. Res. Atmos. 2012, 117, D16103. [Google Scholar] [CrossRef]
  20. Gleixner, S.; Keenlyside, N.S.; Demissie, T.D.; Counillon, F.; Wang, Y.; Viste, E. Seasonal predictability of Kiremt rainfall in coupled general circulation models. Environ. Res. Lett. 2017, 12, 114016. [Google Scholar] [CrossRef] [Green Version]
  21. Werner, A.; Maharaj, A.M.; Holbrook, N.J. A new method for extracting the ENSO-independent Indian Ocean Dipole: Application to Australian region tropical cyclone counts. Clim. Dyn. 2012, 38, 2503–2511. [Google Scholar] [CrossRef]
  22. Alexandersson, H. A homogeneity test applied to precipitation data. Int. J. Climatol. 1986, 6, 661–675. [Google Scholar] [CrossRef]
  23. Helsel, D.R.; Hirsch, R.M. Statistical Methods in Water Resources; Elsevier: Amsterdam, The Netherlands, 1992. [Google Scholar]
  24. Sen, P.K. Estimates of the regression coefficient based on Kendall’s tau. J. Am. Stat. Assoc. 1968, 63, 1379–1389. [Google Scholar] [CrossRef]
  25. Niño 3.4 Index. Available online: http://www.cpc.ncep.noaa.gov/data/indices/ (accessed on 4 January 2013).
  26. Yamagata, T.; Behera, S.K.; Rao, S.A.; Guan, Z.; Ashok, K.; Saji, H.N. Comments on “Dipoles, Temperature Gradients, and Tropical Climate Anomalies”. Bull. Am. Meteorol. Soc. 2003, 84, 1418–1422. [Google Scholar] [CrossRef]
  27. DMI Index. Available online: http://www.jamstec.go.jp/frcgc/research/d1/iod/ (accessed on 4 January 2013).
  28. NOAA PSD Vector Wind and Precipitation Data. Available online: https://www.esrl.noaa.gov/psd/ (accessed on 13 June 2018).
  29. Akaike, H. A new look at the statistical model identification. IEEE Trans. Automat. Control 1974, 19, 716–723. [Google Scholar] [CrossRef]
  30. Hurvich, C.M.; Tsai, C.-L. Regression and time series model selection in small samples. Biometrika 1989, 76, 297–307. [Google Scholar] [CrossRef]
  31. Seleshi, Y.; Zanke, U. Recent changes in rainfall and rainy days in Ethiopia. Int. J. Climatol. 2004, 24, 973–983. [Google Scholar] [CrossRef]
  32. Conway, D. The Climate and Hydrology of the Upper Blue Nile River. Geogr. J. 2000, 166, 49–62. [Google Scholar] [CrossRef] [Green Version]
  33. Conway, D.; Mould, C.; Bewket, W. Over one century of rainfall and temperature observations in Addis Ababa, Ethiopia. Int. J. Climatol. 2004, 24, 77–91. [Google Scholar] [CrossRef]
  34. Meze-Hausken, E. Contrasting climate variability and meteorological drought with perceived drought and climate change in northern Ethiopia. Clim. Res. 2004, 27, 19–31. [Google Scholar] [CrossRef] [Green Version]
  35. Wolff, C.; Haug, G.H.; Timmermann, A.; Damsté, J.S.S.; Brauer, A.; Sigman, D.M.; Cane, M.A.; Verschuren, D. Reduced Interannual Rainfall Variability in East Africa During the Last Ice Age. Science 2011, 333, 743–747. [Google Scholar] [CrossRef]
  36. Mutai, C.C.; Ward, M.N. East African rainfall and the tropical circulation/convection on intraseasonal to interannual timescales. J. Clim. 2000, 13, 3915–3939. [Google Scholar] [CrossRef]
  37. Ashok, K.; Guan, Z.; Yamagata, T. Impact of the Indian Ocean dipole on the relationship between the Indian monsoon rainfall and ENSO. Geophys. Res. Lett. 2001, 28, 4499–4502. [Google Scholar] [CrossRef] [Green Version]
  38. Cai, W.; Van Rensch, P.; Cowan, T.; Hendon, H.H. An asymmetry in the IOD and ENSO teleconnection pathway and its impact on Australian climate. J. Clim. 2012, 25, 6318–6329. [Google Scholar] [CrossRef]
  39. England, M.H.; Ummenhofer, C.C.; Santoso, A. Interannual rainfall extremes over southwest Western Australia linked to Indian Ocean climate variability. J. Clim. 2006, 19, 1948–1969. [Google Scholar] [CrossRef]
  40. Ummenhofer, C.C.; England, M.H.; McIntosh, P.C.; Meyers, G.A.; Pook, M.J.; Risbey, J.S.; Gupta, A.S.; Taschetto, A.S. What causes southeast Australia’s worst droughts? Geophys. Res. Lett. 2009, 36, 4. [Google Scholar] [CrossRef]
  41. Conway, D.; Hanson, C.E.; Doherty, R.; Persechino, A. GCM simulations of the Indian Ocean dipole influence on East African rainfall: Present and future. Geophys. Res. Lett. 2007, 34, 3. [Google Scholar] [CrossRef]
  42. Ummenhofer, C.C.; Sen Gupta, A.; England, M.H.; Reason, C.J. Contributions of Indian Ocean sea surface temperatures to enhanced East African rainfall. J. Clim. 2009, 22, 993–1013. [Google Scholar] [CrossRef]
  43. Tsidu, G.M. High-resolution monthly rainfall database for Ethiopia: Homogenization, reconstruction, and gridding. J. Clim. 2012, 25, 8422–8443. [Google Scholar] [CrossRef]
Figure 1. (a) Mean summer monsoon precipitation (Kiremt) and anomalous vector wind at 850 hPa, based on HadGEM3 downscaled ERA-Interim (mm/day) data for 1990–2008 and on Global Precipitation Climatology Center (GPCC) data, respectively. (b) Topographic map of Ethiopia (elevation data interpolated from GTOPO30). Yellow and red circles in (a) and (b) show the locations of the rainfall stations in Afar and Amhara, respectively. Black arrows in (a) indicate the atmospheric surface circulation pattern during the Kiremt monsoon season. Reference arrow given in ms−1.
Atmosphere 10 00432 g001
Figure 2. Normalized monthly time series of NINO3.4 sea surface temperature anomaly (SSTA), the original Dipole Mode Index (DMI), and the new El Niño southern oscillation (ENSO)-independent DMI (DMINOENSO) for the period 1966–2006.
Atmosphere 10 00432 g002
Figure 3. Correlations between regional Kiremt rainfall and July–September NINO3.4 sea surface temperatures (SSTs) averages for (a) Amhara and (b) Afar. Color shades represent individual years between 1966 and 2006.
Atmosphere 10 00432 g003
Figure 4. June to July global SSTA during (a) driest years in Amhara and Afar (RAI ≤ −1.0; Years 1982, 1983, 1984, 1987), and (b) wettest years in Afar and Amhara (RAI ≥ 1.0; Years 1975, 1988, 1994, 1998).
Atmosphere 10 00432 g004
Figure 5. Composite maps of summer (July–September) anomalous vector wind at 850 hPa (reference vector given in m/s) and precipitation anomalies during the (a) driest and (b) wettest years in Afar and Amhara.
Atmosphere 10 00432 g005
Figure 6. Monthly correlations between regional Kiremt rainfall and DMINOENSO during the preceding month of March for (a) Amhara and (b) Afar. Color shades represent individual years between 1966 and 2006.
Atmosphere 10 00432 g006
Figure 7. Standardized modeled Kiremt rainfall (NINO3.4 + DMINOENSO) and observed regional rainfall for the same period for (a) Amhara and (b) Afar regions. NINO3.4-based modeled rainfall with observed regional rainfall for 1966–2006 for (c) Amhara and (d) Afar regions.
Atmosphere 10 00432 g007
Figure 8. Comparisons of the lagged correlation between Kiremt rainfall and the new DMINOENSO index during (a) March–May (MAM), (b) April–May (AMJ), (c) May–July (MJJ), and (d) June–August (JJA). Dotted points indicate statistically significant grid points at the 95% confidence level (one-tailed test).
Atmosphere 10 00432 g008
Figure 9. Comparisons of the lagged correlation between Kiremt rainfall and NINO3.4 index during (a) March–May (MAM), (b) April–May (AMJ), (c) May–July (MJJ), and (d) June–August (JJA). Dotted points indicate statistically significant grid points at the 95% confidence level (one-tailed test).
Atmosphere 10 00432 g009
Figure 10. Composite maps of summer (June–September) anomalous vector wind at 850 hPa (reference vector given in m/s) and precipitation anomalies during the years following (a) positive (1988, 1994, and 1997) and (b) negative IOD years (1980, 1992, and 1996) determined based on the new DMINOENSO index.
Atmosphere 10 00432 g010
Table 1. Details of the 15 rainfall stations used in the study. Note that two other stations (Awara Melka and Awash 7 kilo) were excluded from the analysis because of concerns with data integrity (see text).
Station NameAltitude (m)ObservationMissing (years)Cluster
Assayita4301966–20067Afar
Bati15011987–20050Amhara
Bokokesa16731975–20059Amhara
Dessie24021971–20062Amhara
Dubti3771981–20065Afar
Hayq20301966–20061Amhara
Karakore16961966–20031Amhara
Kombolcha19161966–20060Amhara
Logia4001980–20063Afar
Mersa23001981–20063Amhara
Mille5171966–20063Afar
Serdo4451981–20057Afar
Srinka20801981–20064Amhara
Werebabo16501981–20062Amhara
Woldia20101966–20066Amhara
Table 2. Regression coefficients for prediction of normalized regional Kiremt rainfall from normalized predictor indices, and the relative weights of each predictor index on the regional Kiremt rainfall model estimates.
IndicesRegression CoefficientsPredictor Weights
AfarAmharaAfarAmhara
NINO3.40.290.3161%53%
DMINOENSO0.180.2739%47%
Table 3. Model comparison based on Akaike Information Criterion (AIC) and weights (wi) with K number of free parameters. Lower AIC/higher weights indicate preferred models.
ModelKRSSAICΔi (AICi − min AIC)wi
AfarNINO3.4 + DMINOENSO429−4.45−4.45 + 4.45 = 0.000.60
NINO3.4332−3.02−3.05 + 4.45 = 1.300.40
AmharaNINO3.4 + DMINOENSO430−2.97−2.97 + 2.97 = 0.000.51
NINO3.4332−2.82−2.82 + 2.97 = 0.150.49

