Article

Heterochromatin Is Not the Only Place for satDNAs: The High Diversity of satDNAs in the Euchromatin of the Beetle Chrysolina americana (Coleoptera, Chrysomelidae)

by
José M. Rico-Porras
1,†,
Pablo Mora
1,†,
Teresa Palomeque
1,
Eugenia E. Montiel
2,3,
Diogo C. Cabral-de-Mello
4 and
Pedro Lorite
1,*
1
Department of Experimental Biology, Genetics Area, University of Jaén, Paraje las Lagunillas s/n, 23071 Jaén, Spain
2
Department of Biology, Genetics, Faculty of Sciences, Autonomous University of Madrid, 28049 Madrid, Spain
3
Center for Research in Biodiversity and Global Change, Autonomous University of Madrid, 28049 Madrid, Spain
4
Department of General and Applied Biology, Institute of Biosciences/IB, UNESP—São Paulo State University, Rio Claro 13506-900, SP, Brazil
*
Author to whom correspondence should be addressed.
These authors contributed equally to this work.
Genes 2024, 15(4), 395; https://doi.org/10.3390/genes15040395
Submission received: 20 February 2024 / Revised: 16 March 2024 / Accepted: 21 March 2024 / Published: 22 March 2024
(This article belongs to the Special Issue Commemorating the Launch of the Section "Cytogenomics")

Abstract

:
The satellitome of the beetle Chrysolina americana Linneo, 1758 has been characterized through chromosomal analysis, genomic sequencing, and bioinformatics tools. C-banding reveals the presence of constitutive heterochromatin blocks enriched in A+T content, primarily located in pericentromeric regions. Furthermore, a comprehensive satellitome analysis unveils the extensive diversity of satellite DNA families within the genome of C. americana. Using fluorescence in situ hybridization techniques and the innovative CHRISMAPP approach, we precisely map the localization of satDNA families on assembled chromosomes, providing insights into their organization and distribution patterns. Among the 165 identified satDNA families, only three of them exhibit a remarkable amplification and accumulation, forming large blocks predominantly in pericentromeric regions. In contrast, the remaining, less abundant satDNA families are dispersed throughout euchromatic regions, challenging the traditional association of satDNA with heterochromatin. Overall, our findings underscore the complexity of repetitive DNA elements in the genome of C. americana and emphasize the need for further exploration to elucidate their functional significance and evolutionary implications.

1. Introduction

The Chrysomelidae family, known as leaf beetles, belongs to the Polyphaga suborder and is considered one of the most diverse beetle (Coleoptera) families [1]. Chrysomelids are phytophagous (both in the larval and adult phases), most of which are monophagous or oligophagous. The genus Chrysolina comprises more than 400 species, grouped into 65 subgenera, distributed throughout the world, except for in South America, Australia, and Antarctica [2]. C. americana feeds on the leaves of plants from the Lamiaceae family, such as rosemary, lavender, or thyme, among others. It is considered native to the Mediterranean, present in several European countries, and in North Africa [3,4]. However, it has currently spread to Northern Europe, becoming an invasive species in some of these countries, as well as in Israel and Cyprus [5,6].
A large percentage of the genome in most eukaryotic species is composed of sequences repeated hundreds or thousands of times [7]. The quantity, types, and distribution of these repetitive DNAs influence the structure, size, and diversity of genomes [8]. Repetitive DNA consists of the following two main types of repeats: dispersed repeats and tandem repeats. Dispersed repeats are known as transposable elements (TEs), while tandem repeats are mainly referred to as satellite DNA (satDNA). Satellite DNA has long been considered as ‘junk’ DNA, because it does not encode proteins and, thus, it seemed to lack biological function [9]. However, data obtained in recent decades have challenged this view. It has evidenced satDNAs as a significant contributor to chromosome architecture, function, and evolution [10,11,12,13]. In general, centromeres are composed of satDNA sequences, which contribute to the assembly processes of centromeric chromatin [14,15]. Satellite DNA plays a role in chromosome segregation during mitosis, meiosis, and segregation distortion and its evolution can trigger reproductive isolation and ultimately speciation [16,17,18,19]. Additionally, pericentromeric satDNA contributes to a higher level of nuclear organization and the maintenance of genome integrity [20]. Beyond its structural role in the genome, satDNA transcription has a functional importance, such as in the formation and maintenance of heterochromatin, defining the centromere identity, and preserving genome stability (reviewed in [21,22]). Misregulation of satDNA expression can adversely affect genomic architecture, chromosome segregation, and gametogenesis. Changes in satDNA copy number and transcription rates may be associated with stress, environmental adaptations, and pathological states such as oncogenic transformation [10,23,24,25,26,27]. Among insects, the transcription of satDNA has been described in several orders (see [28] and references therein).
Currently, the study of satDNA in insects has advanced due to the affordability of next-generation sequencing (NGS) techniques. Massive sequencing combined with subsequent bioinformatics analysis is now commonly used for satDNA investigation [29,30]. The bioinformatics analysis of satDNA from NGS data has been made possible by the development of specialized pipelines that can identify repeated sequences in the genome, without the need for assembly or a reference genome, using the programs RepeatExplorer [31,32], along with the TAndem REpeat ANalyzer (TAREAN) [33] (https://repeatexplorer-elixir.cerit-sc.cz, accessed on 4 December 2023). This methodology for satDNA analysis has allowed the identification of a plentiful amount of satDNAs that are termed ‘satellitome’, which refers to the whole catalogue of satDNA families in a given species [34]. Among insects, these tools have been successfully applied for satDNA analysis in various species; but, within the Coleoptera order, this methodology has only been applied to the following five species: Hippodamia variegata Goeze, 1777 (Coccinellidae) [35]; Rynchophorus ferrugineus Olivier, 1790 (Curculionidae) [28]; Rhyzopertha dominica Fabricius, 1792 (Bostrichidae) [36]; Tribolium castaneum Herbst, 1797 (Tenebrionidae) [37]; and Tenebrio molitor Linnaeus, 1758 (Tenebrionidae) [38].
Among chrysomelid beetles, there is no description of satellitomes, although the group is an interesting source for study, as the karyotypes are highly variable in the family, along with the variation of heterochromatin [39,40]. In Polyphaga beetles, the three highest rates of karyotype evolution were observed in the Chrysomelidae family, mainly in the genera Cyrtonus, Chrysolina, and Timarcha [40,41]. Studies on satDNA in Chrysomelidae are limited, since only four species have been analyzed, as follows: Leptinotarsa decemlineata Say, 1824; Xanthogaleruca luteola Müller, 1766; Chrysolina carnifex Fabricius, 1792; and C. americana [42,43,44,45]. In these species, classical techniques such as restriction enzyme digestion have been used to isolate satDNA, enabling the characterization of only one or two satDNA families per species. Fluorescent in situ hybridization (FISH) of these families evidenced these sequences as a component of the pericentromeric regions of the chromosomes [42,43,44,45]. In order to advance on the understanding of satDNAs in beetles, in this work, we applied genome sequencing along with bioinformatic and chromosomal analysis to characterize the satellitome of the chrysomelid beetle C. americana. We utilized a chromosome-scale genome assembly of C. americana to map all satDNA families. We have termed this procedure CHRISMAPP (CHRomosome In Silico MAPPing), thereby emphasizing the significance of chromosome mapping as the aim of this technique. Besides the detailed characterization of satDNAs in the species, our study reveals that a high diversity of satDNA families could be placed on euchromatin, being the heterochromatic region composed only of a few families of highly amplified satDNA. These data add important information on the general ideas about satDNA organization and evolution.

2. Material and Methods

2.1. Insects, Preparation of Chromosome Spreads, and C-Banding

Male specimens of the species C. americana were collected at the campus of the University of Jaén (Spain). As C. americana is not an endangered species, no special permission was required. Males were dissected under a binocular microscope to extract their testes. The extracted testes were then immersed in distilled water for 45 min to induce an osmotic shock. Subsequently, the distilled water was removed and a Carnoy fixative solution of ethanol and glacial acetic acid (3:1) was added. The samples were stored in the freezer at −20 °C until use. For slide preparation, a testicular lobe was taken in 25 µL of 50% acetic acid and disaggregated using a micropipette. The resulting material was deposited as 4 or 6 drops onto a preheated slide on a heating plate set at 42 °C and was stained with Giemsa. The C-banding technique used for chromosome preparations is based on the method described by Sumner [46], with small modifications. The chromosome preparations were initially treated with a 0.2 N hydrochloric acid solution for 1 min at room temperature. Subsequently, they were incubated in a 5% barium hydroxide solution at 60 °C for 1 min and 30 s. The preparations were then washed with water, followed by a brief rinse in the first hydrochloric acid solution and a final wash in 2× SSC at 60 °C for 2 min. The preparations were stained with Giemsa or with 4′-6-diamino-2-phenylindole (DAPI) (Roche, Applied Science, Basel, Switzerland), at a concentration of 0.75 µg/mL.

2.2. DNA Extraction, Genome Sequencing, and Bioinformatic Analysis

Genomic DNA (gDNA) extraction was carried out from one adult male using the NucleoSpin Tissue kit (Macherey-Nagel GmbH & Co., Düren, Germany), following the provider’s instructions. Three micrograms of genomic DNA were submitted to the company Novogene for sequencing on the Illumina HiSeq 2000 platform (San Diego, CA, USA). A 350 bp fragment library and 101 bp paired-end sequencing reads were obtained, providing a total of 2 Gb of sequencing data. The quality of the raw reads was assessed using the FastQC program [47]. Reads with a quality score below 20 and those containing adapters were filtered out using Trimmomatic v0.39 [48]. After filtering, a file was generated containing 12 million randomly selected reads (6 million paired-end reads). This file was then uploaded to the Galaxy platform (https://galaxy-elixir.cerit-sc.cz/, accessed on 4 December 2023) and processed using RepeatExplorer2 v2.3.7 [31] for the analysis and characterization of repetitive DNA sequences. Default options were chosen, except for the threshold of the genome percentage used to define a ‘top cluster’, which was set to 0.001%. In order to identify the specific clusters that contain satDNA sequences, and to determine the size of the repeat unit (or monomer), as well as the consensus sequence for each family, Geneious v4.8.5 [49] was utilized. The satDNA families were named following a nomenclature similar to that proposed by Ruiz-Ruano et al. [34]. The naming convention includes the first letter of the genus name; the first three letters of the species name, followed by ‘Sat’; a number indicating the families in order of abundance; and a number representing the monomer size for each satDNA family. The quantification and divergence values of each satDNA family were calculated using RepeatMasker v4.1.4. This involved aligning a file containing 5 million randomly selected reads with the complete library of satDNA dimers (for families with a repeat unit length greater than 100 bp) or a concatenation of monomers comprising of at least 200 bp for families with a repeat unit length less than 100 bp.

2.3. Fluorescence In Situ Hybridization (FISH) and Chromosome In Silico Mapping (CHRISMAPP)

For the chromosomal localization of the most abundant satDNA families, specific oligonucleotides were designed based on the most conserved regions of the repeat unit sequences (Table 1). These oligonucleotides were directly labeled with either biotin-16-dUTP (Roche) or digoxigenin-11-dUTP (Roche) using terminal transferase (Roche) and following the instructions provided by the supplier.
A double-stranded telomeric TTAGG probe was generated through PCR, using the primers (TTAGG)6 and (TAACC)6 without template, following a similar procedure as described by Ijdo et al. [50]. The PCR product (1 µg) was labeled with biotin-16-dUTP using the Biotin-Nick Translation Mix (Roche).
Fluorescence in situ hybridization (FISH) was performed following the protocol of Cabral-de-Mello and Marec [51], with some modifications. In total, 20 μL of the hybridization solution (50% deionized formamide (v/v), 10% dextran sulfate (v/v), and 2× SSC), containing 3 pmol/µL of the satDNA oligonucleotide probe or 10 ng/µL of the telomere probe, was administered per slide. For two-color FISH experiments, 40 μL of the hybridization solution with 3 pmol/µL for each probe was used, one labeled with biotin-16-dUTP and the other with digoxigenin-11-dUTP. The slides were subjected to incubation on a heated surface at a temperature of 70 °C for a duration of 2 min and 30 s, transferred to a humid chamber, and subjected to overnight incubation (16–18 h) at a temperature of 37 °C. Immunological detection was performed using either streptavidin conjugated with Alexa Fluor™ 488 (Thermo Fisher Scientific, Waltham, MA, USA) at a concentration of 10 μg/mL or anti-digoxigenin-rhodamine (Roche) at a concentration of 1 μg/mL, depending on whether the probes were labeled with biotin-16-dUTP or digoxigenin-11-dUTP, respectively.
The preparations were mounted with VECTASHIELD with DAPI (Vector Labs, Burlingame, CA, USA). The mounted preparations were observed under an Olympus BX51 fluorescence microscope (Olympus, Hamburg, Germany) equipped with an Olympus DP70 camera and appropriate filters. Image acquisition and processing were carried out using DP Manager software v1.1.1.71 and Adobe Photoshop CS4 software (Adobe Systems, San Jose, CA, USA).
For the amplification of hybridization signals from the CameSat004-10 and CameSat005-322 satDNA families, which did not show visible hybridization signals with the initial protocol, the avidin-FITC/antiavidin-biotin system [52] was utilized, with one or two rounds of amplification. Before the immunological detection, slides were incubated in the washing blocking buffer (WBB) (4× SSC, 0.1% v/v Tween 20, and 1% w/v skimmed milk) for 30 min. Chromosome preparations were then incubated with avidin-FITC (Vector Labs) (5 µg/mL in WBB) for 30 min, followed by three washes of 5 min with WBB. Subsequently, preparations were incubated for 30 min with the biotinylated anti-avidin solution (5 µg/mL in WBB), followed by three washes of 5 min with WBB. This process was repeated with another incubation with avidin-FITC, followed by three washes for 5 min with WBB, before being air-dried and mounted with VECTASHIELD with DAPI (Vector Labs).
We used the chromosome-scale genome assembly of C. americana (https://www.ncbi.nlm.nih.gov/datasets/genome/GCA_958502065.1/, accessed on 2 February 2024) to map the satDNA families through a new simplified approach based in the pipeline of Tunjić-Cvitanić et al. [53], which we have designated as CHRISMAPP (CHRromosome In Silico MAPPing). Initially, the consensus sequence of each satDNA family was annotated in the chromosome-scale genome assembly utilizing Geneious 2023.2.1 [49], employing a similarity threshold of 70%. Subsequently, the resultant .gff file, containing comprehensive annotations, underwent processing in Rstudio [54], using the ggplot2 package [55]. A bespoke script was implemented to visualize the previously acquired annotations. This script is included in the Supplementary Materials.

3. Results and Discussion

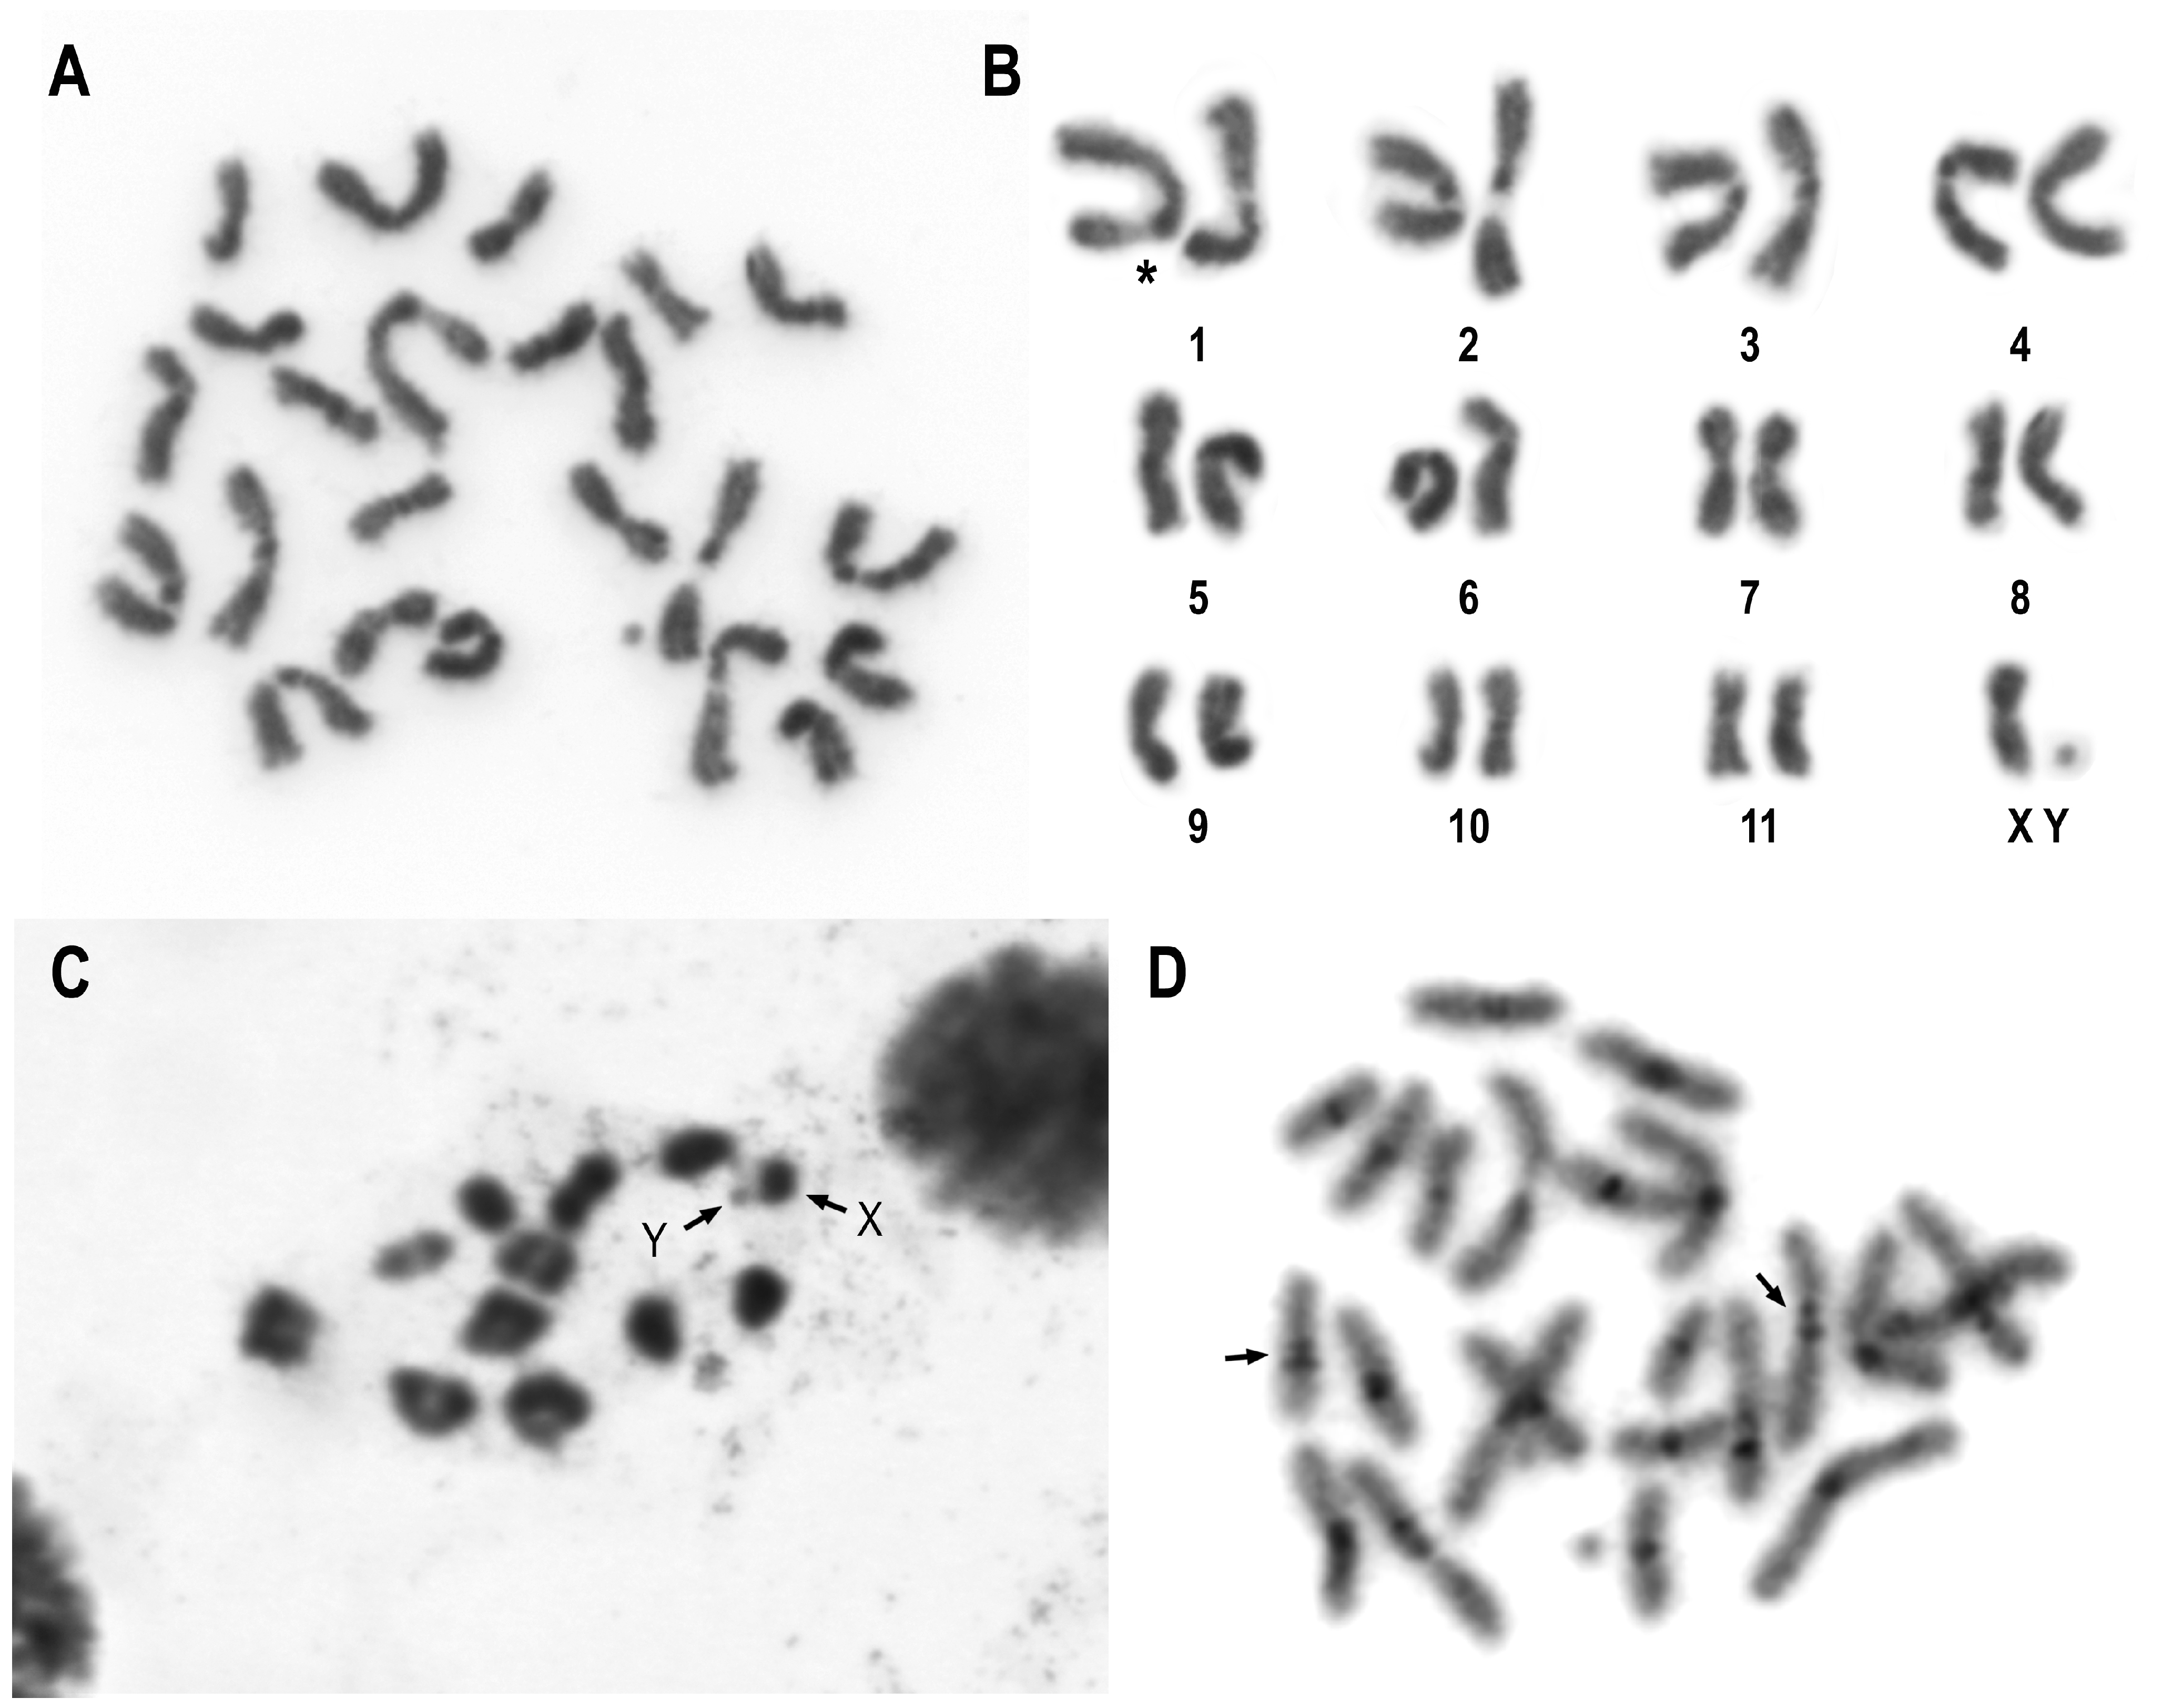
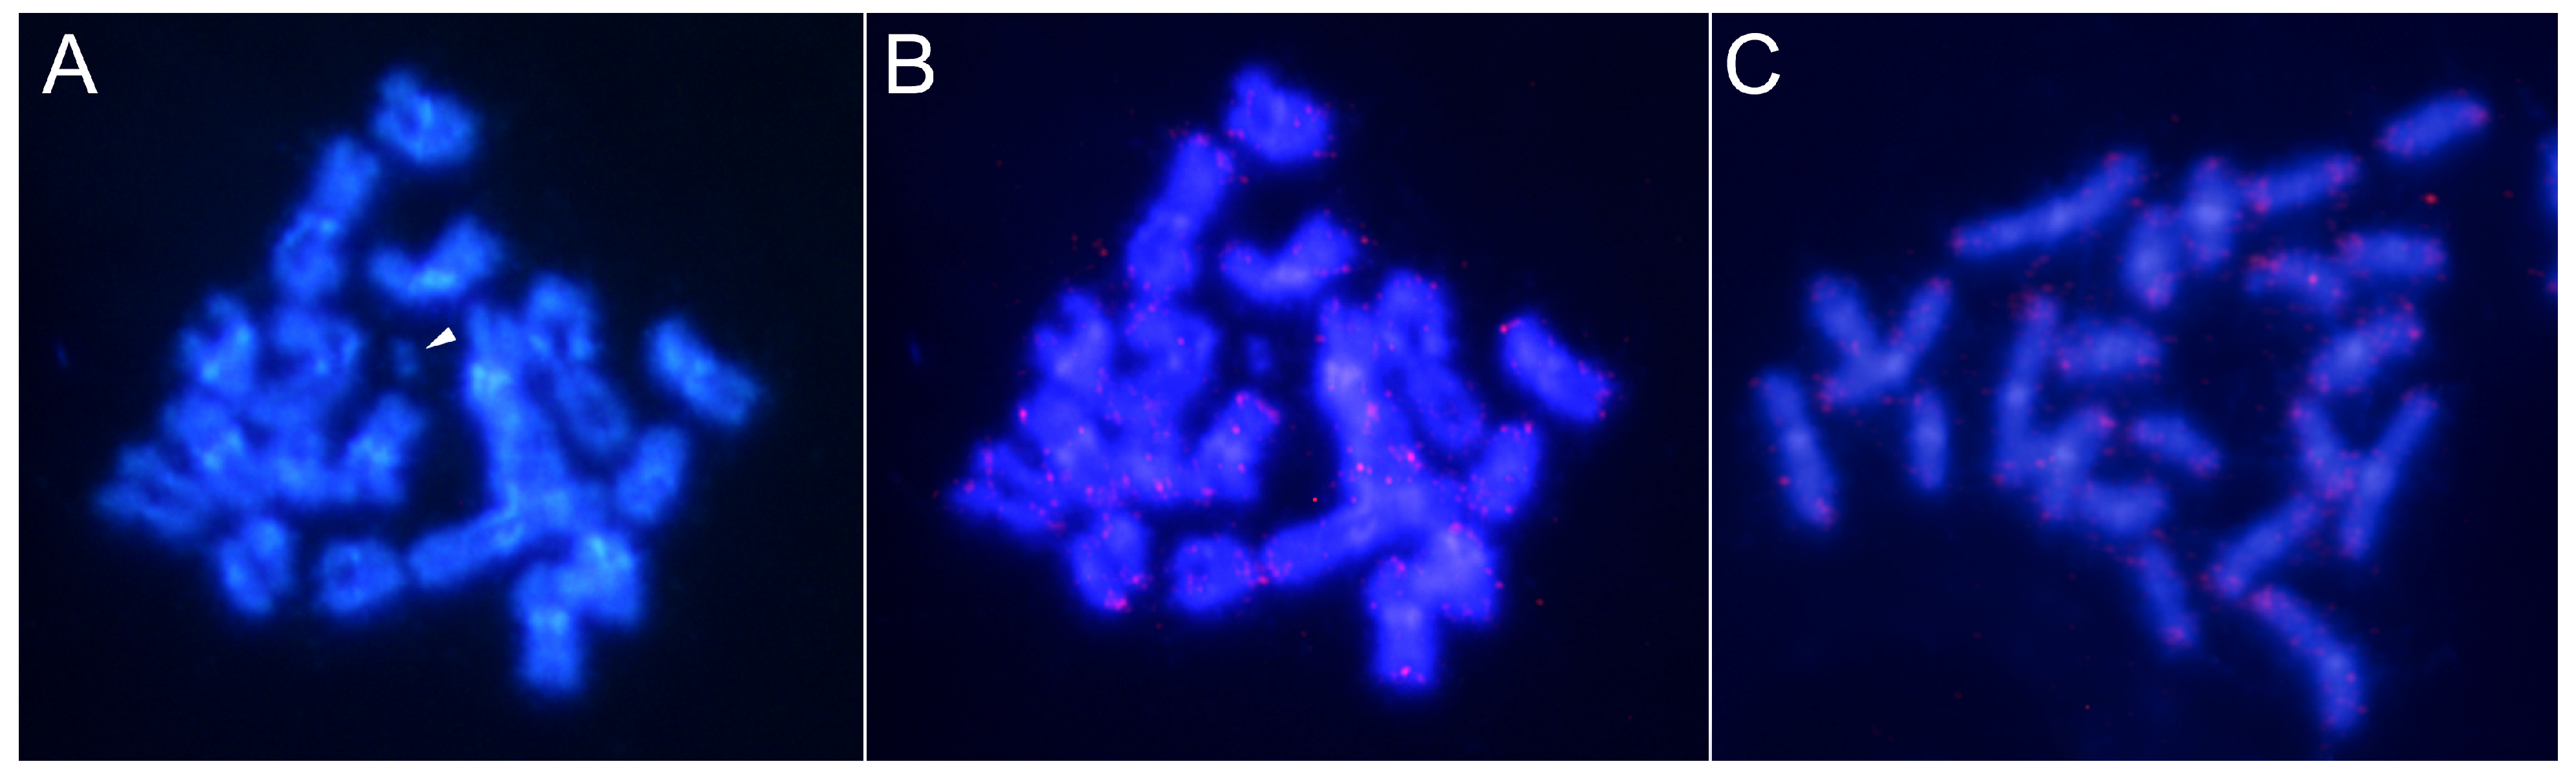
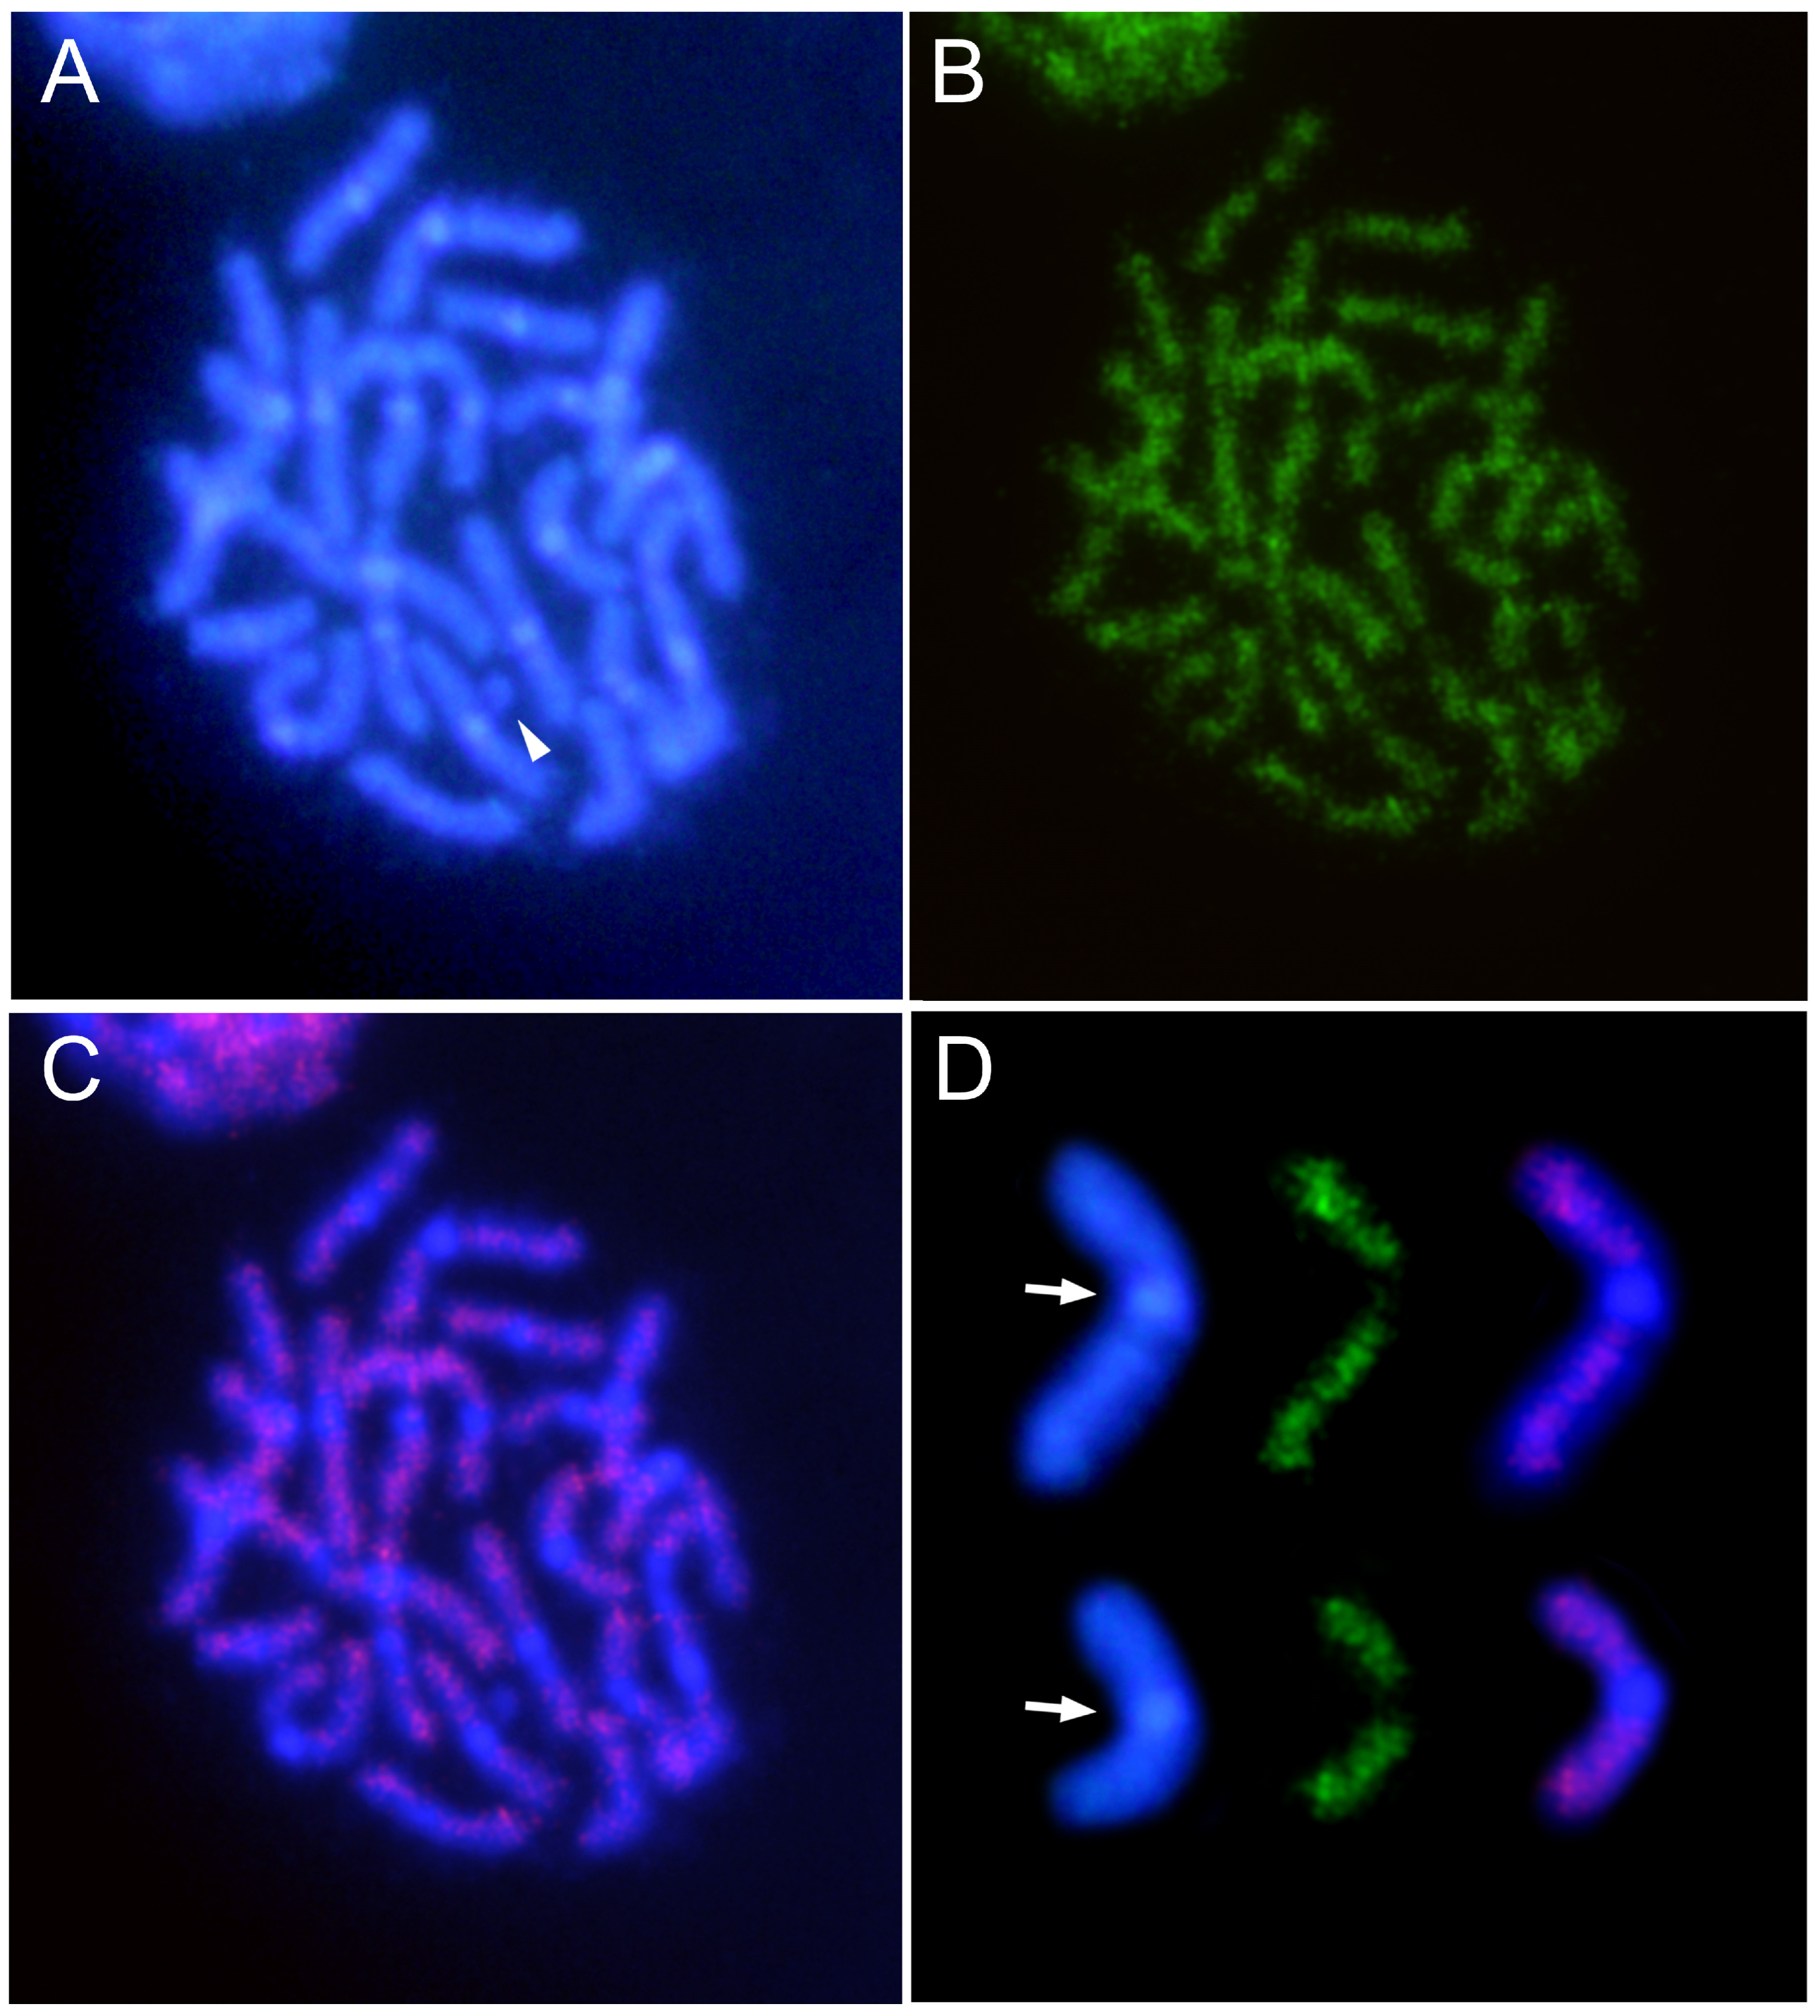
3.1. General Features of Chromosomes of C. americana

C. americana shows a karyotype of 2n = 22 + XX in females and 2n = 22 + Xyp in males (Figure 1A,B). The karyotype observed in this study aligns with the karyotype described by Petitpierre [56]. All autosomes display a metacentric morphology, except for one pair that is submetacentric. According to Petitpierre [56], the submetacentric chromosomes correspond to the fifth largest pair of autosomes. In our study, we have numbered the submetacentric pair as pair number 6 based on the results of the FISH, as will be discussed later. The X chromosome also appears to be metacentric. The Y chromosome, due to its diminutive size, cannot be morphologically characterized. Various autosomal pairs exhibit secondary constrictions. The largest pair of autosomes shows a pronounced heteromorphism due to a secondary constriction in its long arm. Species within the Chrysomelidae family possess varying chromosomal numbers, ranging from 2n = 8 to 2n = 72, with 2n = 24 being the most prevalent [40,57]. During metaphase I, the sex chromosomes are observed to form the typical “parachute” structure (Xyp) (Figure 1C), which is a common feature and considered an ancestral character in beetles [58]. This chromosomal system of sex determination is the most frequent among Chrysomelidae beetles (reviewed in [40]).
The C-banding technique demonstrates the presence of constitutive heterochromatin blocks located in the pericentromeric regions of all chromosomes, except for the Y chromosome, which has no C-heterochromatic positive blocks (Figure 2D). Some autosomes contain two adjacent blocks of heterochromatin in the pericentromeric regions. DAPI staining revealed that the heterochromatic regions are rich in A+T content [42], in a similar manner to that commonly observed on other Coleoptera [59]. Although the number of chrysomelid species analyzed using C-banding is limited, it appears that a shared characteristic among the family is the presence of small pericentromeric blocks of heterochromatin in most autosomes and varying quantities of intercalary heterochromatin on the sex chromosomes [60]. However, in C. americana ([42], this study) and in other Chrysomelidae species, substantial amounts of pericentromeric heterochromatin were observed [43,44]. Heterochromatin was particularly abundant in the species C. carnifex, where C-banding revealed the existence of large blocks of heterochromatin in all autosomes and both sex chromosomes [45].

3.2. Satellitome Analysis of C. americana Genome Reveals Extensive Diversity of satDNAs with Amplification of Few Families

In order to gain insights about the repeat composition of the genomes of beetles, a detailed analysis of the satDNA composition of C. americana was performed. The general analysis of 34 million reads of 101 bp revealed enrichment of the genome in A+T content, i.e., 64.17%. Among insects, the genome percentage of A+T content varies from 54.46% in Buathra laborator Thunberg, 1822 to 74.26% in Bombylius discolor Mikan, 1796 (see [61] for a review) and also in eukaryotes; as a whole, the A+T percentage in genomes has been found to be higher than the C+G percentage [61]. In the same direction, the identified satDNAs were rich in A+T base pairs, also a common feature for beetles and other insect genomes [59]. After the analysis using RepeatExplorer2, we gathered more details about the genome structure of C. americana, evidencing the clustering of 3,426,864 reads into 337,707 clusters (Supplementary Figure S1) that collectively constitute approximately 73% of the C. americana genome. This analysis provided insights into the number of repetitive sequences present in the genome of this species, evidencing occurrence of satDNAs with distinct abundances, as well as uncharacterized sequences with extremely low levels of repetition. Out of the total number of clusters obtained, 1705 clusters (accounting for 43% of the genome) represent more than 0.001% and are the main genome components, as they present a higher degree of repetition.
Among the 43% of the most abundant genome sequences, a significant supercluster was identified, constituting nearly 9% of the genome. This supercluster corresponds to the most abundant satellite DNA (satDNA) family found in C. americana. Additionally, two other superclusters were identified, representing the second and third most abundant satDNA families, which account for approximately 2.5% and 1% of the genome, respectively. For a better characterization of the nearly complete set of satDNAs in the genome (satellitome) of C. americana, in addition to the clusters identified by RepeatExplorer as satDNA, other clusters displaying graph patterns with regions of high density, a characteristic feature of satDNA [31], were manually investigated. Through this analysis, the existence of 165 distinct satDNA families was evidenced (Table 2). The abundance of these 165 satDNA families was estimated through RepeatMasker, evidencing that, collectively, the satDNAs account for 17.97% of the C. americana genome. On other Coleoptera, the abundance of satDNAs is in a similar place to that observed in C. americana and ranges from 11.4% in R. ferrugineus, from United Arab Emirates population [28], to 28.2% in T. molitor [38].
The three most abundant satDNA families in the genome of C. americana, CameSat001-141, CameSat002-187, and CameSat003-10, collectively corresponded to 12.649% abundance. The remaining satDNA families appear with percentages of less than 1% and, altogether, they represented solely about 5.27% of the genome. Among these, some were in really small amounts, representing less than 0.001% of the genome, with CameSat165-105 being the the least abundant, with a genome percentage of 0.0002%. Among the satDNAs identified, the satDNA CameSat002-187 that has considerable abundance (2.41% of abundance) corresponds to the CAMA satDNA family, which was previously described in C. americana using isolation through the digestion of genomic DNA with the AluI endonuclease [42] (Supplementary Figure S2). The CameSat035-5-tel family represents the repetitive occurrence of the TTAGG sequence, which is the most prevalent telomeric sequence found in insects [62,63]. FISH demonstrates the terminal location of the TTAGG repeats in the C. americana chromosomes (Supplementary Figure S3), as was observed previously [64].
Among Coleoptera species, the satellitomes were better characterized into five species, belonging to three families, with no Chrysomelidae [28,35,36,37,38], revealing a distinct number of satDNA families, from 10 in R. dominica [36] to 112 in R. ferrugineus [28]. The data from C. americana adds information about the huge variation in the number of families of satDNAs on Coleoptera, with this species having the highest number of satDNA families characterized so far, i.e., 165 families. This is also the highest number of satDNA families identified in an insect genome, as there are more than the 160 identified in Triatoma delpontei Romaña and Abalos, 1947 [65]. Concerning the abundance of the distinct satDNA families, as observed here in C. americana, it is also common for beetles to demonstrate one more abundant satDNA family, as is the case of CameSat001-141 with about 9% abundance. In the other beetle species, the major satDNA represents 26.5% of the genome of T. molitor [38], 17% of the genome of T. castaneum [37], 9.37% of the genome of H. variegata [35], and from 8.43 to 20.45% of the genome of R. ferrugineus, depending on the population [28].
Two other characteristics of the satellitome characterized here are the monomer size and divergence of the satDNAs. The repeat unit size of the C. americana satDNA families ranged from 5 bp (CameSat035-5-tel) to 3664 bp (CameSat120-3664), with the most common monomer sizes ranging between 101 and 200 bp (Supplementary Figure S4). For a long time, the identification of short or extremely long satDNAs was hampered by the methodology used for satDNA prospection, the restriction enzyme digestion technique. This challenge was overcome by the application of sequencing techniques and bioinformatic tools in the search for satellite DNA families. In this way, the identification of long satDNA, over 1000 bp, has been more common, ranging up to 4228 [66]. Although, in most cases, the satDNAs are shorter, ranging from 100 to 200 bp, as observed here for the majority of the satDNAs in C. americana.
The satDNA divergence values for each family, calculated using RepeatMasker and visually represented in Supplementary Figure S5 using Rstudio, vary across the different families, ranging from 1.77% in CameSat074-1625 to 26.18% in CameSat031-281. The average divergence of all satDNA families in C. americana is determined to be 9.91%. Satellite DNA divergence is directly influenced by mutation processes and is inversely influenced by amplification and homogenization processes [59,67]. From the analysis of the satDNAs landscape (satDNA abundance versus divergence), it is evident the occurrence of a peak of abundance in K2P divergence of about 5–7% for CameSat001-141 and CameSat002-187, suggesting a more recent amplification or homogenization of these repeats, in comparison to most of the satDNAs identified in the C. americana genome. Despite this, the great difference in abundance between CameSat001-141 and CameSat002-187 has peaks in similar K2P divergence that could suggest similar patterns of homogenization. As expected, the homogenization could be a result of the amplification process that is very common for sequences in the pericentromeric region (see [68] for a review).

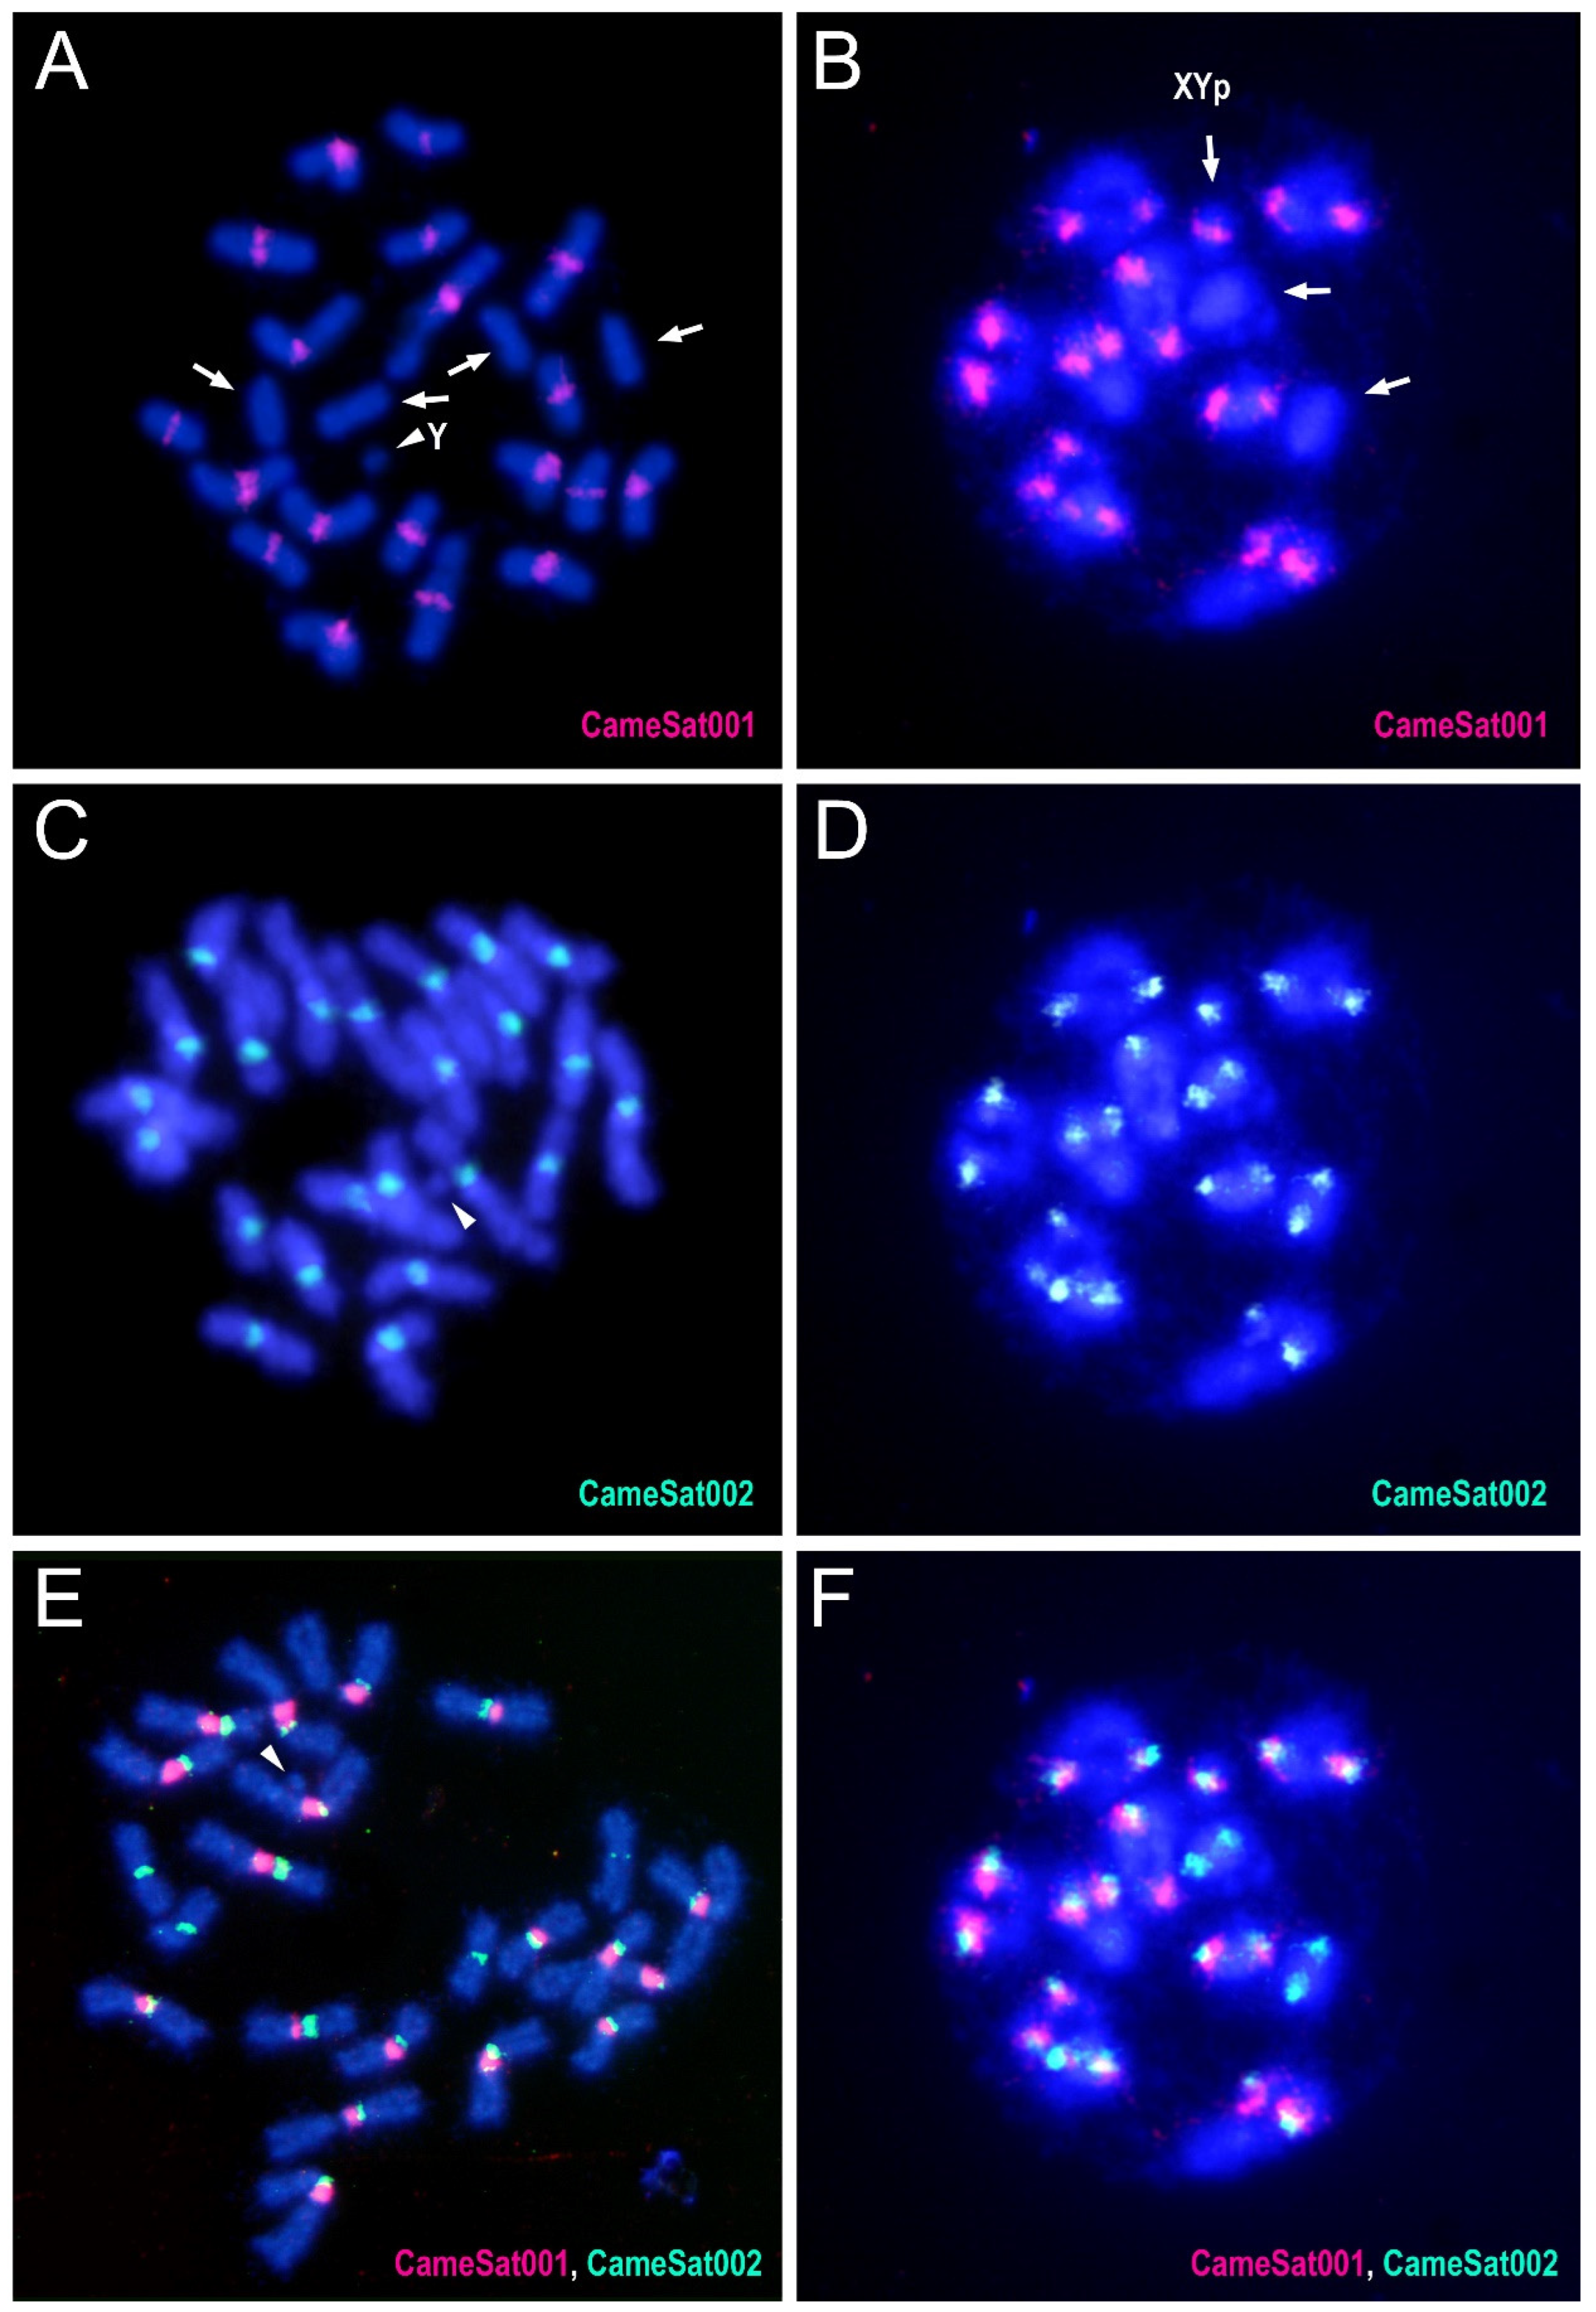
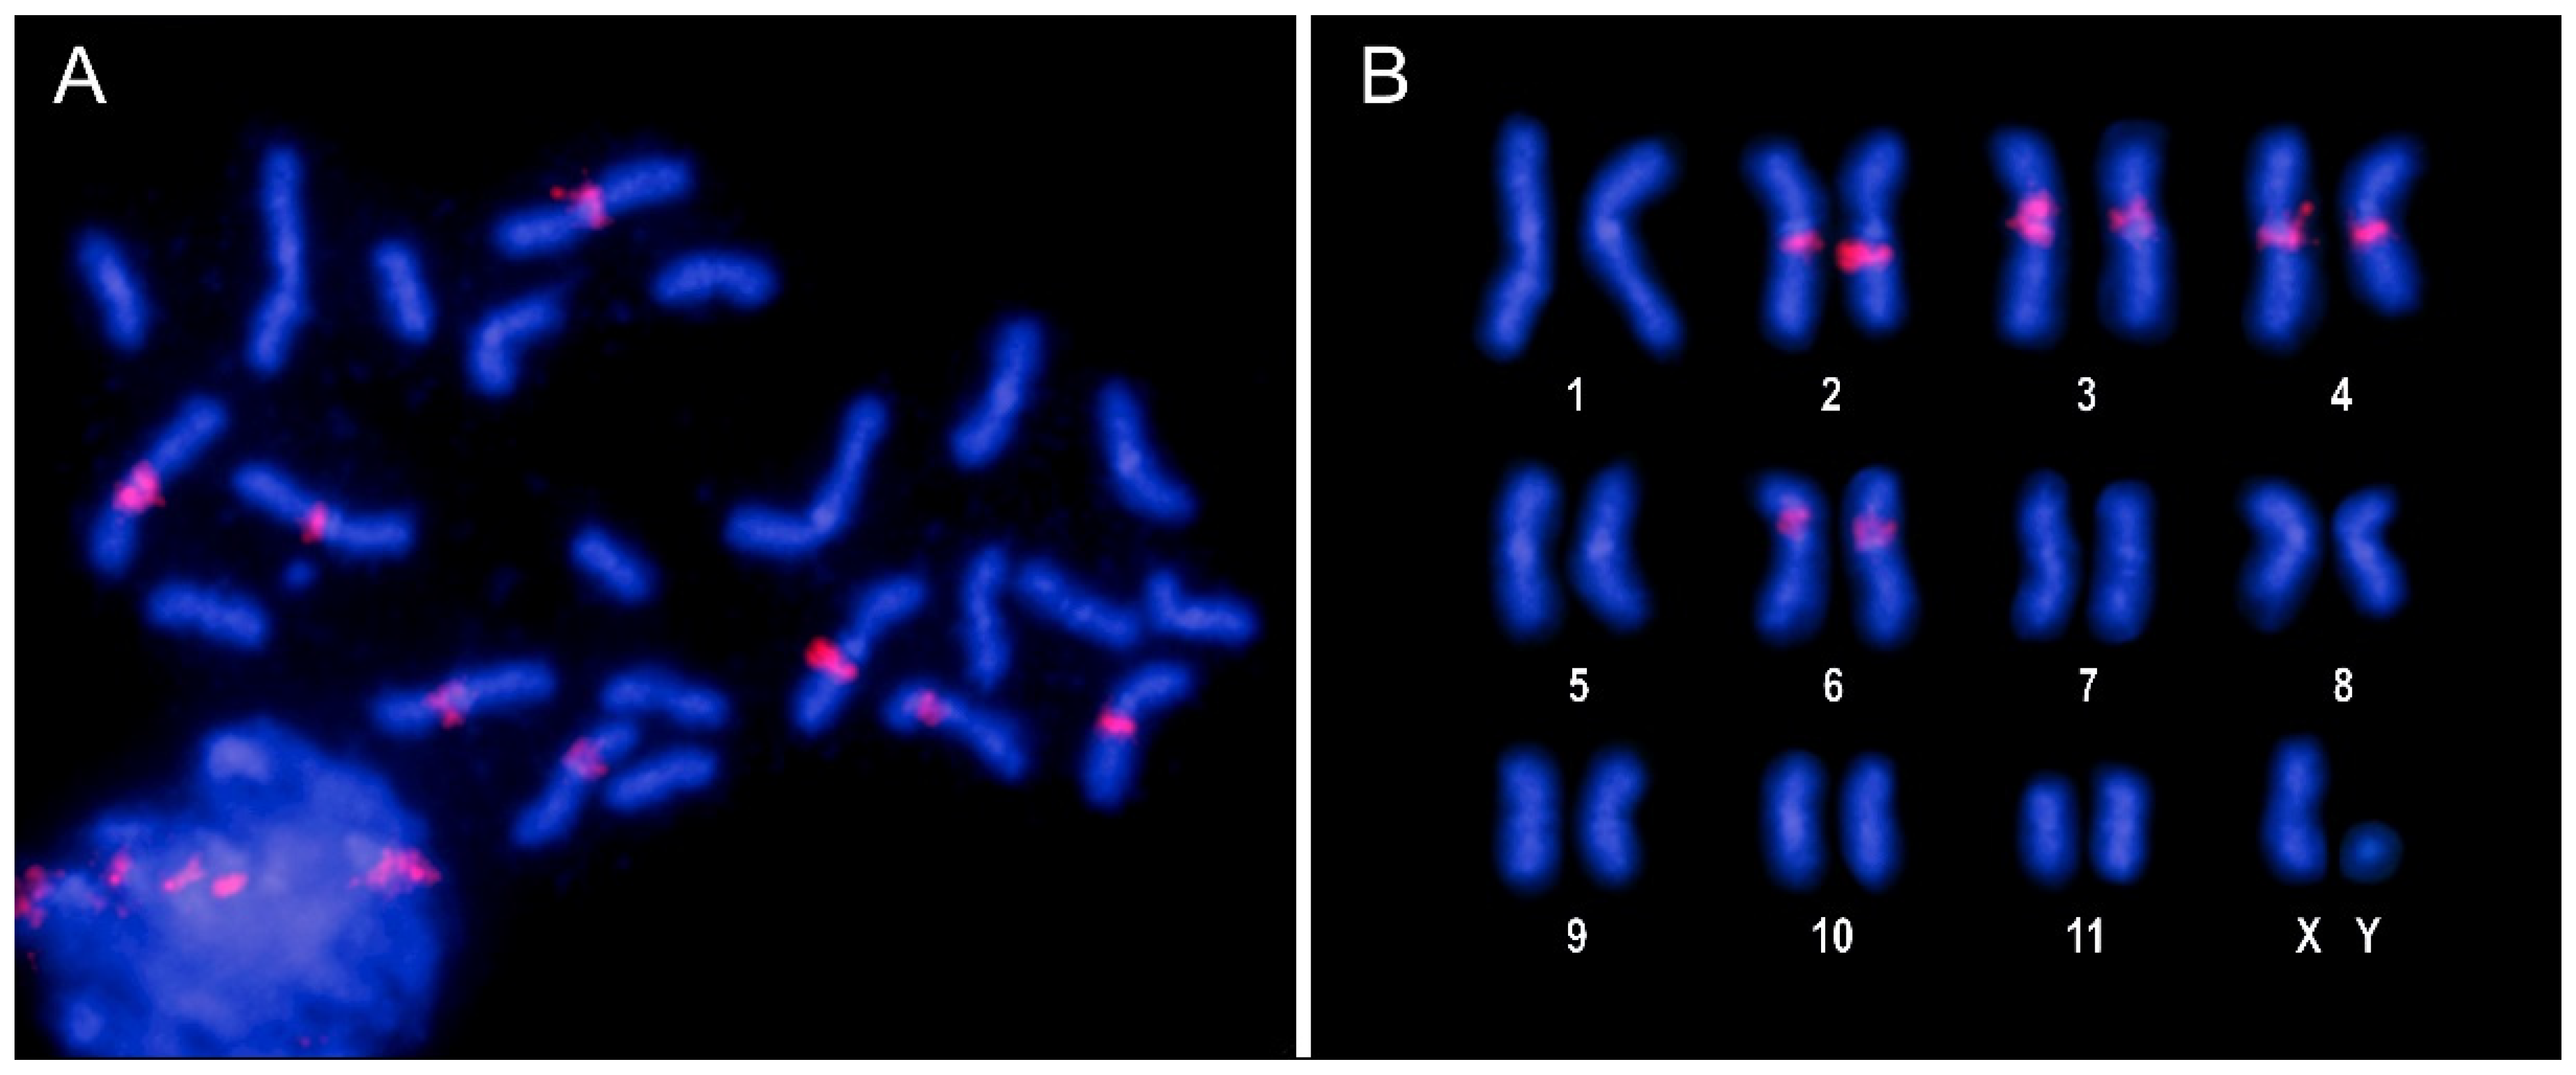
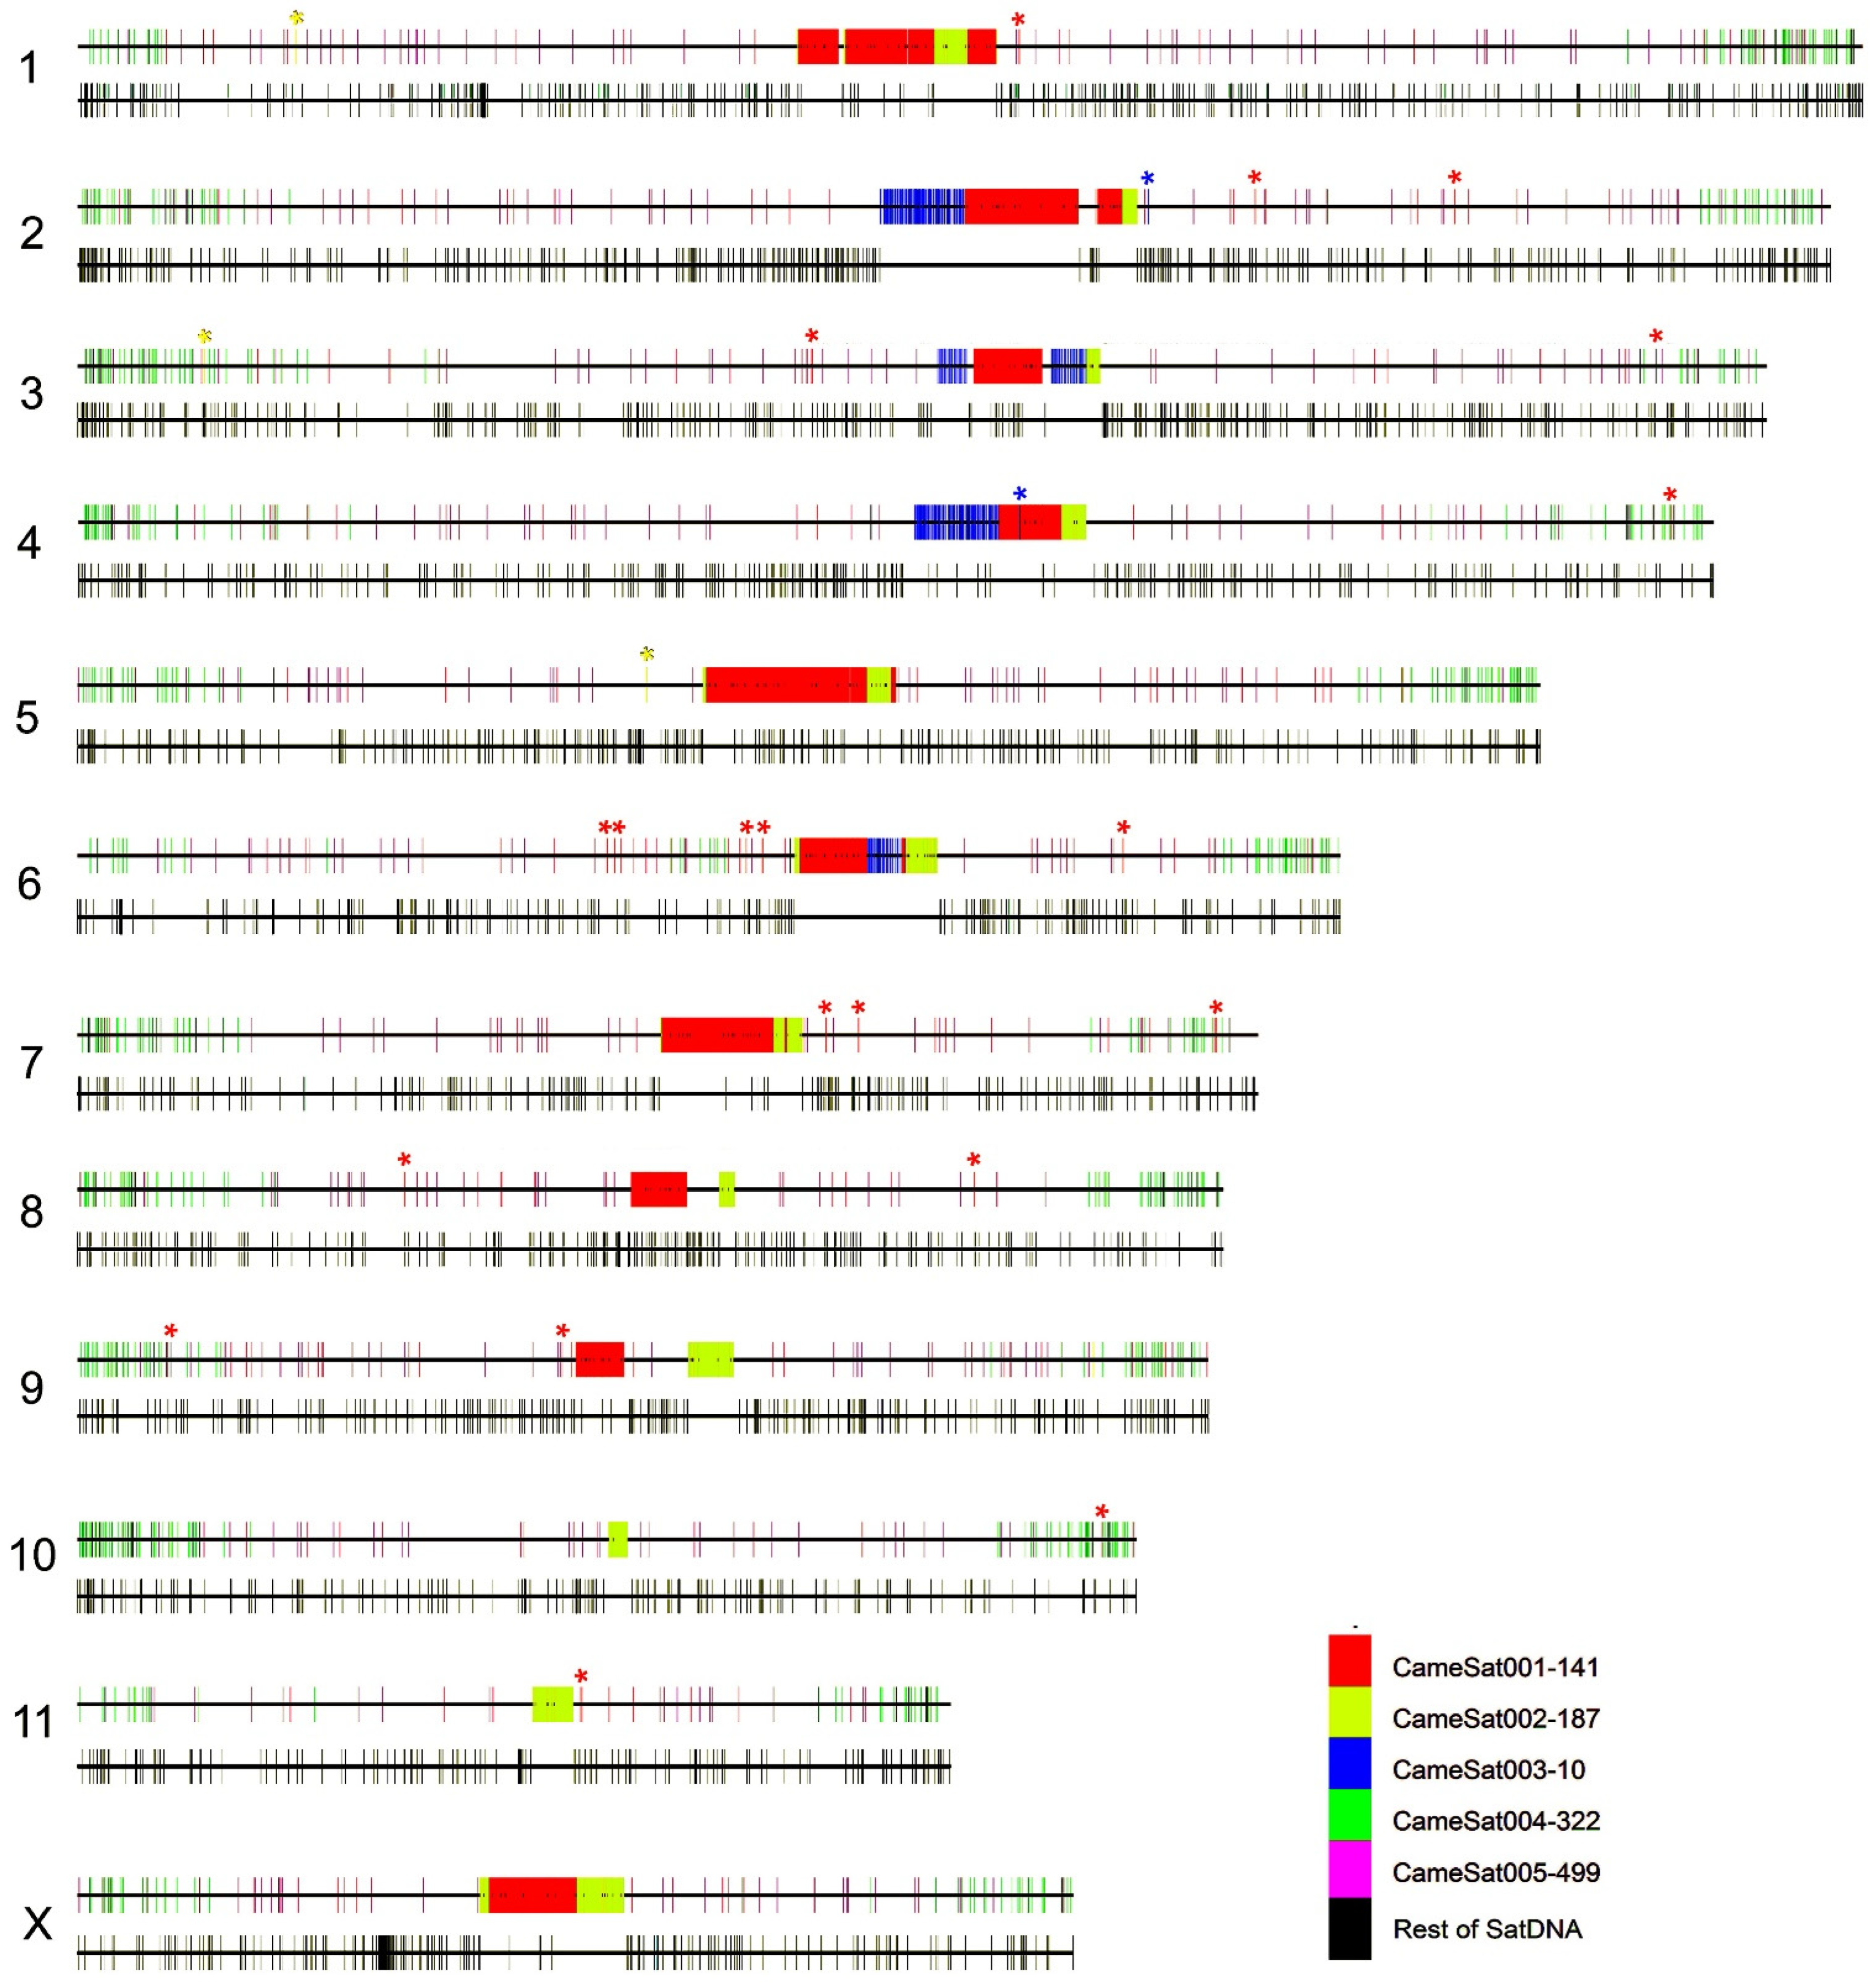
3.3. Characterization and Chromosomal Localization of the Main Families of Satellite DNA Shows an Unpreceded High Number of satDNAs in Euchromatin

As mentioned in the previous section, there are three satellite DNA families that make up more than 1% of the C. americana genome. For the two most abundant satDNAs, CameSat001-141 and CameSat002-187, FISH mapping revealed the presence of these satDNAs in the pericentromeric regions of multiple chromosomes. For CameSat001-141, the hybridization signals are located on the pericentromeric regions of all chromosomes, except in the two smaller pairs of autosomes and the Y chromosome (Figure 2A,B). CameSat002-187 was also located in the pericentromeric regions of all chromosomes, except for in the Y chromosome (Figure 2C,D). Notably, both families were found on the X chromosome, but not on the Y chromosome. The satDNA family CameSat002-187 displays a hybridization pattern similar to that described previously for the CAMA satDNA family [41], except regarding the Y chromosome, which shows positive hybridization only for the CAMA satDNA family. The material used in both studies comes from very different geographical locations; the material used by Lorite et al. [41] was collected in Mallorca (Balearic Islands, Spain), while that of this study was collected in the Iberian Peninsula, more specifically in Jaén (Spain). Satellite DNA, as a dynamic component of the genome, can exhibit interpopulation differences, as described in very different species. For example, variation in the chromosomal distribution of satDNA among populations has been described in grasshoppers [69,70]. Variations in satellite DNA among populations have also been described in the fish Cyprinodon variegatus Lacepède, 1803 [71] or the beetle T. castaneum [72]. More recently, large variations in the chromosomal distribution of the satDNA of the X chromosome have been described in mole species [73]. Interpopulation differences for the amount of satDNA have also been observed from genome sequencing data [28]. Similarly, using genome sequencing data, rapid changes in the quantity and type of repetitive DNAs on the Y chromosome both within and between species of malaria mosquitoes, specifically within the Anopheles gambiae Giles, 1902 complex, have been described [74].
Hybridization analysis for the CameSat003-10 family, which is the third most abundant satellite DNA, reveals a positive hybridization signal exclusively in the pericentromeric regions of four pairs of autosomes (Figure 3). No hybridization signals were observed for the following satDNA families unless signal amplification was performed. The absence of clear hybridization signals may be due to their low abundance in the genome and/or their lack of accumulation in specific regions.
The assembled genome of C. americana is currently available at the chromosome level, except for the small Y chromosome (GenBank GCA_958502065.1). All satDNA families have been mapped using the sequence of assembled chromosomes via the CHRISMAPP (CHRomosome In Silico MAPPing) approach (Figure 4). To achieve this, satDNA sequences were located within the assembled chromosome sequence and, subsequently, graphically represented. The results obtained with this procedure coincide with those obtained with FISH for the three main families of satellite DNA. This could constitute an alternative method to FISH when material for cytogenetic studies is not available or the sequences are present in a very low amount or do not form long arrays that could hamper the FISH signal visualization. Moreover, it could give more details about the organization of satDNA, like the interspersion of satDNA families and the placement of satDNAs with low abundance in euchromatin.
Following CHRISMAPP, we confirm that the CameSat001-141 satDNA family forms large blocks in the pericentromeric region of most autosomes and the X chromosome but cannot be detected in smaller autosomes (pairs 10 and 11). The CameSat002-197 satDNA family also forms large blocks in the pericentromeric regions, present in all autosomes and the X chromosome. CHRISMAPP results indicate that both satellites do not overlap. FISH, using probes of the two most abundant satellites, demonstrated that although both are located in pericentromeric regions, they appear to form homogeneous blocks and both satellite DNAs are not mixed (Figure 2E,F), as is observed with CHRISMAPP. As observed using FISH, the CHRISMAPP approach shows that the CameSat003-10 satDNA family is present in only four pairs of chromosomes (pairs 2, 3, 4, and 6). On chromosome 3, this satDNA is organized into two different blocks, which is also visible using FISH. As previously indicated, only one of the autosome pairs is submetacentric, the others are metacentric. This chromosome was designated as pair 5 by Petitpierre [56]. FISH with CameSat003-10 shows that the pair of submetacentric chromosomes carries this satDNA. According to the genome assembly of C. americana, it corresponds to the sixth largest chromosome, as is presented in the karyotype here (Figure 1); these submetacentric chromosomes have been designated as pair 6. Although most copies of the three main satDNA families are accumulated in blocks in the pericentromeric regions, the CHRISMAPP approach has shown that there are short arrays dispersed throughout the euchromatic regions of the chromosome arms.
The following two more abundant satDNA families (CameSat004-322 and CameSat005-499) appear to be distributed along the chromosome arms, although their distribution patterns are different (Figure 4, Supplementary Figure S6). CameSat005-499 is organized into short arrays that are distributed virtually uniformly along the chromosome arms in all chromosomes, while CameSat004-322 seems to accumulate in the terminal regions of the chromosomes (Figure 4, Supplementary Figure S6). To locate these satDNAs on the chromosomes, FISH was performed using signal amplification. Once again, the results obtained coincide with the results of the CHRISMAPP approach. Using CameSat004-322 satDNA as a probe, hybridization signals were observed dispersed throughout all chromosomes, although they are concentrated in the terminal regions of the chromosome arms (Figure 5). The hybridization pattern obtained with CameSat005-499 is more uniform, with hybridization signals appearing throughout the euchromatin of all chromosomes, while the heterochromatin remained free of hybridization (Figure 6). The Y chromosome shows no hybridization signals with either of these two satDNAs.
Using the CHRISMAPP approach, we have located the remaining 150 families of satDNA (from CameSat006-2670 to CameSat165-105, excluding the family CameSat035-5-tel, which represents telomeric DNA). Together, all these satDNAs form short arrays distributed throughout the genome. In some chromosomes, some of these short arrays are found in pericentromeric regions, interspersed with sequences of the three main satDNAs. However, in some chromosomes, such as pairs 2, 6, and 11, the less abundant satDNAs are mostly located in the euchromatic regions of the chromosome arms.
In summary, the obtained results show that the genome of Ch. americana presents a large number of different satDNA families, 165 in total. Of these, only the three most abundant ones are amplified and accumulated in the form of large blocks in pericentromeric heterochromatic regions, while most copies of the remaining satDNA families are dispersed throughout the euchromatic regions. Traditionally, satellite DNA has been predominantly associated with its presence in heterochromatin regions. However, it is now recognized that tandem repeat DNAs, including microsatellites, minisatellites, and satDNAs, can also be found in euchromatin. Recent studies involving the characterization of satellitome and in situ hybridization with low-abundance satDNA families have revealed that many of these satellite DNA sequences are indeed located in euchromatin (see [68,75] for a review). These findings challenge the traditional view and highlight the presence and distribution of satellite DNA in both heterochromatic and euchromatic regions.

Supplementary Materials

The following are available online at https://www.mdpi.com/article/10.3390/genes15040395/s1, Figure S1: Graphical summary of the clustering results obtained with RepeatExplorer2, displaying the total number of reads used and the repetitive DNA clusters; Figure S2: Alignment between the consensus sequence of the CameSat002-187 satDNA family and the consensus sequence of the CAMA satDNA family, as described by [42]; Figure S3: FISH with (TTAGG)n telomeric probe (red signals) on mitotic chromosomes (counterstained with DAPI in blue) of C. americana; Figure S4: Distribution of satellite DNA families in C. americana based on the size of their repeat unit; Figure S5: Satellite DNA landscapes for all satDNA families found in C. americana; and Figure S6: C. americana pseudochromosomes showing the distribution of the main satDNA families obtained through the CHRISMAPP approach; CHRISMAPP script.

Author Contributions

Conceptualization, J.M.R.-P., P.M., D.C.C.-d.-M. and P.L.; formal analysis, J.M.R.-P., P.M., D.C.C.-d.-M. and P.L.; investigation, J.M.R.-P., P.M., T.P., E.E.M., D.C.C.-d.-M. and P.L.; writing—original draft preparation, J.M.R.-P., P.M. and P.L.; writing—review and editing, J.M.R.-P., P.M., T.P., E.E.M., D.C.C.-d.-M. and P.L.; funding acquisition, T.P. and P.L. All authors have read and agreed to the published version of the manuscript.

Funding

This work was supported by Universidad de Jaén (through the program “Plan de Apoyo a la Investigación 2021–2022, Acción 1”).

Institutional Review Board Statement

No special permits were required to retrieve and process the samples because the study did not involve any live vertebrates nor regulated invertebrates.

Informed Consent Statement

Not applicable.

Data Availability Statement

The data presented in the study are available in the article. The CHRISMAPP script is also available in the GitHub repository (https://github.com/LoriteLab/CHRISMAPP, accessed on 20 February 2024).

Conflicts of Interest

The authors declare no conflicts of interest.

References

  1. Bouchard, P.; Bousquet, Y.; Davies, A.E.; Alonso–Zarazaga, M.A.; Lawrence, J.F.; Lyal, C.H.C.; Newton, A.F.; Reid, C.A.M.; Schmitt, M.; Ślipiński, S.A.; et al. Family–group names in Coleoptera (Insecta). Zookeys 2011, 88, 1–972. [Google Scholar] [CrossRef] [PubMed]
  2. Daccordi, M. Notes on the distribution of the Chrysomelinae and their possible origin. In Chrysomelidae Biology Vol. 1: The Classification. Phylogeny and Genetics; Jolivet, P., Cox, M.L., Eds.; SPB Academy Publishing: Amsterdam, The Netherlands, 1996; pp. 399–412. [Google Scholar]
  3. Beenen, R.; Roques, A. Leaf and seed beetles (Coleoptera, Chrysomelidae). Chapter 8.3. BioRisk 2010, 4, 267–292. [Google Scholar] [CrossRef]
  4. Kippenberg, H. Chrysomelinae. In Chrysomeloidea; Löbl, I., Smetana, A., Eds.; Catalogue of Palaearctic Coleoptera (vol. 6); Brill: Stenstrup, Denmark, 2010; pp. 390–443. [Google Scholar]
  5. Bieńkowski, A.O.; Orlova–Bienkowskaja, M.J. Alien leaf beetles (Coleoptera, Chrysomelidae) of European Russia and some general tendencies of leaf beetle invasions. PLoS ONE 2018, 13, e0203561. [Google Scholar] [CrossRef] [PubMed]
  6. Hadjiconstantis, M.; Zoumides, C. First records of the pest leaf beetle Chrysolina (Chrysolinopsis) americana (Linnaeus, 1758) (Coleoptera, Chrysomelidae) in Cyprus—A study initiated from social media. Biodivers. Data J. 2021, 9, e61349. [Google Scholar] [CrossRef] [PubMed]
  7. John, B.; Miklos, G.L. Functional aspects of satellite DNA and heterochromatin. Int. Rev. Cytol. 1979, 58, 1–114. [Google Scholar] [CrossRef] [PubMed]
  8. López–Flores, I.; Garrido–Ramos, M.A. The repetitive DNA content of eukaryotic genomes. Genome Dyn. 2012, 7, 1–28. [Google Scholar] [CrossRef] [PubMed]
  9. Ohno, S. So much “junk” DNA in our genome. Brookhaven Sysp. Biol. 1972, 23, 366–370. [Google Scholar]
  10. Louzada, S.; Lopes, M.; Ferreira, D.; Adega, F.; Escudeiro, A.; Gama–Carvalho, M.; Chaves, R. Decoding the role of Satellite DNA in genome architecture and plasticity–An evolutionary and clinical affair. Genes 2020, 11, 72. [Google Scholar] [CrossRef]
  11. Thakur, J.; Packiaraj, J.; Henikoff, S. Sequence, chromatin and evolution of satellite DNA. Int. J. Mol. Sci. 2021, 22, 4309. [Google Scholar] [CrossRef]
  12. Adega, F.; Guedes-Pinto, H.; Chaves, R. Satellite DNA in the karyotype evolution of domestic animals—Clinical considerations. Cytogenet. Genome Res. 2009, 126, 12–20. [Google Scholar] [CrossRef]
  13. Shatskikh, A.S.; Kotov, A.A.; Adashev, V.E.; Bazylev, S.S.; Olenina, L.V. Functional significance of satellite DNAs: Insights from Drosophila. Front. Cell Dev. Biol. 2020, 8, 312. [Google Scholar] [CrossRef]
  14. Talbert, P.B.; Henikoff, S. The genetics and epigenetics of satellite centromeres. Genome Res. 2022, 32, 608–615. [Google Scholar] [CrossRef]
  15. Plohl, M.; Meštrović, N.; Mravinac, B. Centromere identity from the DNA point of view. Chromosoma 2014, 123, 313–325. [Google Scholar] [CrossRef]
  16. Henikoff, S.; Ahmad, K.; Malik, H.S. The centromere paradox: Stable inheritance with rapidly evolving DNA. Science 2001, 293, 1098–1102. [Google Scholar] [CrossRef]
  17. Larracuente, A.M. The organization and evolution of the Responder satellite in species of the Drosophila melanogaster group: Dynamic evolution of a target of meiotic drive. BMC Evol. Biol. 2014, 14, 233. [Google Scholar] [CrossRef]
  18. Ferree, P.M.; Barbash, D.A. Species–specific heterochromatin prevents mitotic chromosome segregation to cause hybrid lethality in Drosophila. PLoS Biol. 2009, 7, e1000234. [Google Scholar] [CrossRef] [PubMed]
  19. Sharma, A.; Kinney, N.A.; Timoshevskiy, V.A.; Sharakhova, M.V.; Sharakhov, I.V. Structural variation of the X chromosome heterochromatin in the Anopheles gambiae complex. Genes 2020, 11, 327. [Google Scholar] [CrossRef] [PubMed]
  20. Podgornaya, O.I. Nuclear organization by satellite DNA, SAF–A/hnRNPU and matrix attachment regions. Semin. Cell Dev. Biol. 2022, 128, 61–68. [Google Scholar] [CrossRef] [PubMed]
  21. Ahmad, S.F.; Singchat, W.; Jehangir, M.; Suntronpong, A.; Panthum, T.; Malaivijitnond, S.; Srikulnath, K. Dark matter of primate genomes: Satellite DNA repeats and their evolutionary dynamics. Cells 2020, 9, 2714. [Google Scholar] [CrossRef] [PubMed]
  22. Biscotti, M.A.; Canapa, A.; Forconi, M.; Olmo, E.; Barucca, M. Transcription of tandemly repetitive DNA: Functional roles. Chromosome Res. 2015, 23, 463–477. [Google Scholar] [CrossRef] [PubMed]
  23. Feliciello, I.; Akrap, I.; Ugarković, Đ. Satellite DNA modulates gene expression in the beetle Tribolium castaneum after heat stress. PLoS Genet. 2015, 11, e1005466. [Google Scholar] [CrossRef]
  24. Ferreira, D.; Meles, S.; Escudeiro, A.; Mendes–da–Silva, A.; Adega, F.; Chaves, R. Satellite non–coding RNAs: The emerging players in cells, cellular pathways and cancer. Chromosome Res. 2015, 23, 479–493. [Google Scholar] [CrossRef] [PubMed]
  25. Porokhovnik, L.N.; Veiko, N.N.; Ershova, E.S.; Kostyuk, S.V. The role of human satellite III (1q12) copy number variation in the adaptive response during aging, stress, and pathology: A pendulum model. Genes 2021, 12, 1524. [Google Scholar] [CrossRef] [PubMed]
  26. Ugarković, Đ.; Sermek, A.; Ljubić, S.; Feliciello, I. Satellite DNAs in health and disease. Genes 2022, 13, 1154. [Google Scholar] [CrossRef] [PubMed]
  27. Lopes, M.; Louzada, S.; Ferreira, D.; Veríssimo, G.; Eleutério, D.; Gama–Carvalho, M.; Chaves, R. Human satellite 1A analysis provides evidence of pericentromeric transcription. BMC Biol. 2023, 21, 28. [Google Scholar] [CrossRef] [PubMed]
  28. Montiel, E.E.; Mora, P.; Rico–Porras, J.M.; Palomeque, T.; Lorite, P. Satellitome of the red palm weevil, Rhynchophorus ferrugineus (Coleoptera: Curculionidae), the most diverse among insects. Front. Ecol. Evol. 2022, 10, 826808. [Google Scholar] [CrossRef]
  29. Lower, S.S.; McGurk, M.P.; Clark, A.G.; Barbash, D.A. Satellite DNA evolution: Old ideas, new approaches. Curr. Opin. Genet. Dev. 2018, 48, 70–78. [Google Scholar] [CrossRef]
  30. Šatović, E. Tools and databases for solving problems in detection and identification of repetitive DNA sequences. Period. Biol. 2020, 121, 7–14. [Google Scholar] [CrossRef]
  31. Novák, P.; Neumann, P.; Macas, J. Graph–based clustering and characterization of repetitive sequences in next–generation sequencing data. BMC Bioinform. 2010, 11, 378. [Google Scholar] [CrossRef]
  32. Novák, P.; Neumann, P.; Pech, J.; Steinhaisl, J.; Macas, J. RepeatExplorer: A Galaxy–based web server for genome–wide characterization of eukaryotic repetitive elements from next–generation sequence reads. Bioinformatics 2013, 29, 792–793. [Google Scholar] [CrossRef]
  33. Novák, P.; Ávila Robledillo, L.; Koblížková, A.; Vrbová, I.; Neumann, P.; Macas, J. TAREAN: A computational tool for identification and characterization of satellite DNA from unassembled short reads. Nucleic Acids Res. 2017, 45, e111. [Google Scholar] [CrossRef] [PubMed]
  34. Ruiz–Ruano, F.J.; López–León, M.D.; Cabrero, J.; Camacho, J.P.M. High–throughput analysis of the satellitome illuminates satellite DNA evolution. Sci. Rep. 2016, 6, 28333. [Google Scholar] [CrossRef]
  35. Mora, P.; Vela, J.; Ruiz–Ruano, F.J.; Ruiz–Mena, A.; Montiel, E.E.; Palomeque, T.; Lorite, P. Satellitome analysis in the ladybird beetle Hippodamia variegata (Coleoptera, Coccinellidae). Genes 2020, 11, 783. [Google Scholar] [CrossRef]
  36. Oppert, B.; Muszewska, A.; Steczkiewicz, K.; Šatović-Vukšić, E.; Plohl, M.; Fabrick, J.A.; Vinokurov, K.S.; Koloniuk, I.; Johnston, J.S.; Smith, T.P.L.; et al. The genome of Rhyzopertha dominica (Fab.) (Coleoptera: Bostrichidae): Adaptation for success. Genes 2022, 13, 446. [Google Scholar] [CrossRef] [PubMed]
  37. Gržan, T.; Dombi, M.; Despot-Slade, E.; Veseljak, D.; Volarić, M.; Meštrović, N.; Plohl, M.; Mravinac, B. The low-copy-number satellite DNAs of the model beetle Tribolium castaneum. Genes 2023, 14, 999. [Google Scholar] [CrossRef]
  38. Oppert, B.; Dossey, A.T.; Chu, F.-C.; Šatović-Vukšić, E.; Plohl, M.; Smith, T.P.L.; Koren, S.; Olmstead, M.L.; Leierer, D.; Ragan, G.; et al. The genome of the yellow mealworm, Tenebrio molitor: It’s bigger than you think. Genes 2023, 14, 2209. [Google Scholar] [CrossRef]
  39. Petitpierre, E. Cytogenetics, cytotaxonomy and genetics of Chrysomelidae. In Biology of Chrysomelidae; Jolivet, P., Petitpierre, E., Hsiao, T.H., Eds.; Series Entomologica (Vol. 42); Kluwer Academic Publishers: Dordrecht, The Netherlands, 1988; pp. 131–159. [Google Scholar]
  40. Petitpierre, E. Karyological analysis of the subfamily Chrysomelinae (Coleoptera: Chrysomelidae). Cut. Edge Res. Biol. 2023, 5, 104–121. [Google Scholar] [CrossRef]
  41. Blackmon, H.; Jonika, M.M.; Alfieri, J.M.; Demuth, J.P. Drift drives the evolution of chromosome number I: The impact of trait transitions on genome evolution in Coleoptera. J. Hered. 2024, 115, esae001. [Google Scholar] [CrossRef]
  42. Lorite, P.; Palomeque, T.; Garnería, I.; Petitpierre, E. Characterization and chromosome location of satellite DNA in the leaf beetle Chrysolina americana (Coleoptera, Chrysomelidae). Genetica 2001, 110, 143–150. [Google Scholar] [CrossRef]
  43. Lorite, P.; Carrillo, J.A.; Garnería, I.; Petitpierre, E.; Palomeque, T. Satellite DNA in the elm leaf beetle, Xanthogaleruca luteola (Coleoptera, Chrysomelidae): Characterization, interpopulation analysis, and chromosome location. Cytogenet. Genome Res. 2002, 98, 302–307. [Google Scholar] [CrossRef]
  44. Lorite, P.; Torres, M.I.; Palomeque, T. Characterization of two unrelated satellite DNA families in the Colorado potato beetle Leptinotarsa decemlineata (Coleoptera, Chrysomelidae). Bull. Entomol. Res. 2013, 103, 538–546. [Google Scholar] [CrossRef]
  45. Palomeque, T.; Muñoz–López, M.; Carrillo, J.A.; Lorite, P. Characterization and evolutionary dynamics of a complex family of satellite DNA in the leaf beetle Chrysolina carnifex (Coleoptera, Chrysomelidae). Chromosome Res. 2005, 13, 795–807. [Google Scholar] [CrossRef]
  46. Sumner, A.T. A simple technique for demonstrating centromeric heterochromatin. Exp. Cell Res. 1972, 75, 304–306. [Google Scholar] [CrossRef]
  47. Andrews, S. FastQC: A Quality Control Tool for High throughput Sequence Data [Online]. 2010. Available online: http://www.bioinformatics.babraham.ac.uk/projects/fastqc/ (accessed on 1 December 2023).
  48. Bolger, A.M.; Lohse, M.; Usadel, B. Trimmomatic: A flexible trimmer for Illumina sequence data. Bioinformatics 2014, 30, 2114–2120. [Google Scholar] [CrossRef]
  49. Kearse, M.; Moir, R.; Wilson, A.; Stones–Havas, S.; Cheung, M.; Sturrock, S.; Buxton, S.; Cooper, A.; Markowitz, S.; Duran, C.; et al. Geneious Basic: An integrated and extendable desktop software platform for the organization and analysis of sequence data. Bioinformatics 2012, 28, 1647–1649. [Google Scholar] [CrossRef]
  50. Ijdo, J.W.; Wells, R.A.; Baldini, A.; Reeders, S.T. Improved telomere detection using a telomere repeat probe (TTAGGG)n generated by PCR. Nucleic Acids Res. 1991, 19, 4780. [Google Scholar] [CrossRef]
  51. Cabral-de-Mello, D.C.; Marec, F. Universal fluorescence in situ hybridization (FISH) protocol for mapping repetitive DNAs in insects and other arthropods. Mol. Genet. Genom. 2021, 296, 513–526. [Google Scholar] [CrossRef] [PubMed]
  52. Pinkel, D.; Straume, T.; Gray, J.M. Cytogenetic analysis using quantitative, high sensitivity fluorescence hybridization. Proc. Natl. Acad. Sci. USA 1986, 83, 2934–2938. [Google Scholar] [CrossRef] [PubMed]
  53. Tunjić-Cvitanić, M.; Pasantes, J.J.; García-Souto, D.; Cvitanić, T.; Plohl, M.; Šatović-Vukšić, E. Satellitome analysis of the Pacific oyster Crassostrea gigas reveals new pattern of satellite DNA organization, highly scattered across the genome. Int. J. Mol. Sci. 2021, 22, 6798. [Google Scholar] [CrossRef] [PubMed]
  54. R Core Team. R: A Language and Environment for Statistical Computing; R Foundation for Statistical Computing: Vienna, Austria, 2024; Available online: https://www.R-project.org (accessed on 10 February 2024).
  55. Wickham, H. Ggplot2: Elegant Graphics for Data Analysis, 2nd ed.; Springer International Publishing: Cham, Switzerland, 2016; Available online: https://ggplot2.tidyverse.org (accessed on 5 February 2024).
  56. Petitpierre, E. Karyometric differences among nine species of the genus Chrysolina Mots. (Coleoptera, Chrysomelidae). Can. J. Genet. Cytol. 1983, 25, 33–39. [Google Scholar] [CrossRef]
  57. Blackmon, H.; Demuth, J.P. Coleoptera Karyotype Database. Coleopterists Bull. 2015, 69, 174–175. [Google Scholar] [CrossRef]
  58. Smith, S.G.; Virkki, N. Coleoptera. In Animal Cytogenetics; John, B., Ed.; Insecta 5 (Vol. 3); Gebrüder Borntraeger: Berlin, Germany, 1978; p. 366. [Google Scholar]
  59. Palomeque, T.; Lorite, P. Satellite DNA in insects: A review. Heredity 2008, 100, 564–573. [Google Scholar] [CrossRef] [PubMed]
  60. Rozek, M.; Lachowska, D.; Petitpierre, E.; Holecova, M. C–bands on chromosomes of 32 beetle species (Coleoptera: Elateridae, Cantharidae, Oedemeridae, Cerambycidae, Anthicidae, Chrysomelidae, Attelabidae, and Curculionidae). Hereditas 2004, 140, 161–170. [Google Scholar] [CrossRef] [PubMed]
  61. Kyriacou, R.G.; Mulhair, P.O.; Holland, P.W.H. GC content across insect genomes: Phylogenetic patterns, causes and consequences. J. Mol. Evol. 2024. (advance online publications). [Google Scholar] [CrossRef]
  62. Kuznetsova, V.; Grozeva, S.; Gokhman, V. Telomere structure in insects: A review. J. Zool. Syst. Evol. Res. 2020, 58, 127–158. [Google Scholar] [CrossRef]
  63. Vítková, M.; Král, J.; Traut, W.; Zrzavý, J.; Marec, F. The evolutionary origin of insect telomeric repeats, (TTAGG)n. Chromosome Res. 2005, 13, 145–156. [Google Scholar] [CrossRef] [PubMed]
  64. Mravinac, B.; Meštrović, N.; Cavrak, V.V.; Plohl, M. TCAGG, an alternative telomeric sequence in insects. Chromosoma 2011, 120, 367–376. [Google Scholar] [CrossRef]
  65. Mora, P.; Pita, S.; Montiel, E.E.; Rico–Porras, J.M.; Palomeque, T.; Panzera, F.; Lorite, P. Making the genome huge: The case of Triatoma delpontei, a Triatominae species with more than 50% of its genome full of satellite DNA. Genes 2023, 14, 371. [Google Scholar] [CrossRef]
  66. Anjos, A.; Milani, D.; Bardella, V.B.; Paladini, A.; Cabral-de-Mello, D.C. Evolution of satDNAs on holocentric chromosomes: Insights from hemipteran insects of the genus Mahanarva. Chromosome Res. 2023, 31, 5. [Google Scholar] [CrossRef]
  67. Ruiz–Ruano, F.J.; Castillo–Martínez, J.; Cabrero, J.; Gómez, R.; Camacho, J.P.M.; López–León, M.D. High–throughput analysis of satellite DNA in the grasshopper Pyrgomorpha conica reveals abundance of homologous and heterologous higher–order repeats. Chromosoma 2018, 127, 323–340. [Google Scholar] [CrossRef]
  68. Šatović-Vukšić, E.; Plohl, M. Satellite DNAs—From localized to highly dispersed genome components. Genes 2023, 14, 742. [Google Scholar] [CrossRef] [PubMed]
  69. Cabrero, J.; Perfectti, F.; Gómez, R.; Camacho, J.P.; López-León, M.D. Population variation in the A chromosome distribution of satellite DNA and ribosomal DNA in the grasshopper Eyprepocnemis plorans. Chromosome Res. 2003, 11, 375–381. [Google Scholar] [CrossRef]
  70. Milani, D.; Ramos, É.; Loreto, V.; Martí, D.A.; Cardoso, A.L.; de Moraes, K.C.M.; Martins, C.; Cabral-de-Mello, D.C. The satellite DNA AflaSAT-1 in the A and B chromosomes of the grasshopper Abracris flavolineata. BMC Genet. 2017, 18, 81. [Google Scholar] [CrossRef] [PubMed]
  71. Elder, J.F., Jr.; Turner, B.J. Concerted evolution at the population level: Pupfish HindIII satellite DNA sequences. Proc. Natl. Acad. Sci. USA 1994, 91, 994–998. [Google Scholar] [CrossRef]
  72. Feliciello, I.; Akrap, I.; Brajković, J.; Zlatar, I.; Ugarković, Đ. Satellite DNA as a driver of population divergence in the red flour beetle Tribolium castaneum. Genome Biol. Evol. 2014, 7, 228–239. [Google Scholar] [CrossRef]
  73. Rovatsos, M.; Marchal, J.A.; Giagia-Athanasopoulou, E.; Sánchez, A. Molecular composition of heterochromatin and its contribution to chromosome variation in the Microtus thomasi/Microtus atticus species complex. Genes 2021, 12, 807. [Google Scholar] [CrossRef]
  74. Hall, A.B.; Papathanos, P.A.; Sharma, A.; Cheng, C.; Akbari, O.S.; Assour, L.; Bergman, N.H.; Cagnetti, A.; Crisanti, A.; Dottorini, T.; et al. Radical remodeling of the Y chromosome in a recent radiation of malaria mosquitoes. Proc. Natl. Acad. Sci. USA 2016, 113, E2114–E2123. [Google Scholar] [CrossRef] [PubMed]
  75. Cabral-de-Mello, D.C.; Mora, P.; Rico-Porras, J.M.; Ferretti, A.B.S.M.; Palomeque, T.; Lorite, P. The spread of satellite DNAs in euchromatin and insights into the multiple sex chromosome evolution in Hemiptera revealed by repeatome analysis of the bug Oxycarenus hyalinipennis. Insect Mol. Biol. 2023, 32, 725–737. [Google Scholar] [CrossRef] [PubMed]
Figure 1. (A) Male mitotic metaphase and (B) karyotype of C. americana. The karyotype consists of 11 pairs of autosomes and the sex pair, a metacentric X chromosome and a dot-shaped Y chromosome. Pair one exhibits significant heteromorphism due to the size of the secondary constriction located on the long arm (*). (C) Meiotic metaphase with 11 autosomal bivalents and the sex chromosomes in an Xyp “parachute” shape. (D) Mitotic metaphase after the C-banding technique and subsequent DAPI staining (inverted image). Heterochromatin blocks are observed in the pericentromeric regions of all chromosomes except for the Y chromosome. Arrows indicate some chromosomes displaying two heterochromatin blocks.
Genes 15 00395 g001
Figure 2. FISH using the CameSat001-141 satDNA (labeled in red) as a probe on both mitotic (A) and meiotic (B) chromosomes of C. americana. Similarly, FISH was conducted using the CameSat002-187 satellite DNA (labeled in green) on mitotic (C) and meiotic (D) chromosomes. Double FISH using both the probes on mitotic (E) and meiotic (F) chromosomes. Arrows indicate the chromosomes or the bivalents that did not display a hybridization signal with CameSat001. Arrowheads indicate the Y chromosome, which did not exhibit a hybridization signal with either of the two probes.
Genes 15 00395 g002
Figure 3. Male mitotic metaphase (A) and karyotype (B) of C. americana following FISH with the CameSat003-10 family, showing the presence of positive hybridization signals on the pericentromeric regions of four pairs of autosomes, including the submetacentric pair 6.
Genes 15 00395 g003
Figure 4. C. americana pseudochromosomes showing the distribution of different satDNA families obtained through the CHRISMAPP approach. For each chromosome, two schemes are displayed, the top one illustrates the distribution of the five most abundant satDNA families, while the bottom one shows the distribution of the remaining satDNA families (from CameSat006-2670 to CamaSat165-105). Asterisks indicate the presence of short arrays of the CameSat001-141, CameSat002-187, and CameSat003-10.
Genes 15 00395 g004
Figure 5. DAPI staining (A) and FISH on male mitotic chromosomes of C. americana using a probe specific to the CameSat004-322 family with one amplification round (B), revealing positive hybridization signals on all chromosomes mainly accumulated at the terminal region or the chromosome arms. (C) Hybridization using CameSat004-322 as a probe with two amplification rounds. Arrowhead shows the Y chromosome.
Genes 15 00395 g005
Figure 6. DAPI staining (A) and FISH (B) on male mitotic chromosomes of C. americana, using a specific probe for the CameSat005-499 satDNA family. (C) Merged image revealing positive hybridization signals in the euchromatin of all chromosomes. Arrowhead shows the Y chromosome. (D) Selected chromosomes after DAPI staining, FISH with the CameSat005-499 satDNA, and merged images. Arrows indicate the DAPI-positive heterochromatic regions that are free of hybridization signals.
Genes 15 00395 g006
Table 1. Oligonucleotides used for FISH analyses in the chromosomes of C. americana.
SatDNA FamilyOligonucleotideSequence
CameSat001-141Came_CL2-F
Came_CL2-R
ACCATGATGCGTGCCAAGTC
GTCAACAGAAATCATTGTCGGGTC
CameSat002-187Came_CL26-F
Came_CL26-R
ACAAGTCGAGACATACGAAGCAC
CCAAAATACAGAACAAGTCCAGCTG
CameSat003-10Came_CL1GACTTGTCCCGACTTGTCCC
CameSat004-322Came_CL4-F
Came_CL4-R
CGAACGCCAATCGATTCAGAATG
CAGAATTGCTCTATCTTCAACCGTTC
CameSat005-499Came_CL11-F
Came_CL11-R
ATGTCCGTCGTGGTATTAGCCAG
ACTCCCAAGCAGCACAGTCTC
Table 2. Satellite DNA families identified in C. americana, ordered from highest to lowest abundance in the genome. NCBI accession numbers PP502226-PP502390. The K2P (Kimura Two-Parameter model) divergence, the repeat unit length (RUL), and the percentage of A+T are indicated for each family.
satDNA Family% GenomeDivergence
(K2P)
RUL (bp)A+T (%)satDNA Family% GenomeDivergence
(K2P)
RUL (bp)A+T (%)
CameSat001-1418.95887.6814161.0CameSat084-1410.008811.6714167.4
CameSat002-1872.41437.1818758.8CameSat085-6250.00872.2862561.3
CameSat003-101.26589.601040.0CameSat086-1590.008712.1215966.0
CameSat004-3220.651217.8332267.4CameSat087-1710.00859.5817166.7
CameSat005-4990.383711.6249957.5CameSat088-1320.008112.7913256.1
CameSat006-26700.27482.59267056.1CameSat089-1510.008014.2615168.9
CameSat007-3130.260011.9731362.6CameSat090-2880.00796.6128863.2
CameSat008-4540.23108.3645460.4CameSat091-1430.00799.7714344.1
CameSat009-2060.16663.6320661.2CameSat092-1600.007813.1216068.8
CameSat010-36640.14013.63366465.9CameSat093-1820.007316.5718263.7
CameSat011-21860.13818.18218666.3CameSat094-1420.00717.6914262.7
CameSat012-3460.137210.0334654.0CameSat095-2310.006713.0723161.5
CameSat013-12230.128411.99122363.2CameSat096-1350.006617.4513563.0
CameSat014-1630.122716.3216358.3CameSat097-760.006611.957651.9
CameSat015-2880.122514.1028858.8CameSat098-11480.00652.57114861.1
CameSat016-4490.11326.4544957.5CameSat099-1460.006210.1214661.0
CameSat017-4790.11159.5047960.1CameSat100-1460.006210.3414671.2
CameSat018-2800.097810.5228067.1CameSat101-6490.00612.9964962.4
CameSat019-2280.096719.9122866.2CameSat102-1410.005911.2914166.0
CameSat020-3360.06656.2733659.2CameSat103-1720.005914.4917263.4
CameSat021-3120.066313.1331262.5CameSat104-1650.005816.4316564.8
CameSat022-3240.061217.5432466.7CameSat105-9520.00552.1395263.8
CameSat023-1460.05717.1214663.0CameSat106-3090.00557.0430958.3
CameSat024-3160.05444.7031654.4CameSat107-2120.00534.3921264.6
CameSat025-1500.05173.7515064.7CameSat108-4100.005218.0341065.4
CameSat026-650.05146.856580.0CameSat109-1480.005211.1114865.5
CameSat027-4690.04965.6946962.3CameSat110-1450.005213.3014571.0
CameSat028-1540.04937.7815466.2CameSat111-1600.004910.3816064.4
CameSat029-3250.046110.4732568.1CameSat112-1470.00492.9314763.9
CameSat030-1320.04527.2813263.6CameSat113-760.004811.487669.7
CameSat031-2810.044026.1828166.9CameSat114-1440.004515.5614462.5
CameSat032-1660.043416.0316635.5CameSat115-140.00456.701450.0
CameSat033-3510.042916.5535160.4CameSat116-290.00448.172951.7
CameSat034-1910.04164.6419160.7CameSat117-1490.00448.6414967.1
CameSat035-5-tel0.04140.83540.0CameSat118-1440.00427.0714466.0
CameSat036-1440.04094.6414466.0CameSat119-1400.00407.4214060.7
CameSat037-12780.04052.77127864.1CameSat120-2860.00405.9428660.1
CameSat038-500.040413.655066.0CameSat121-1620.003918.9516271.0
CameSat039-4000.03892.3940066.4CameSat122-1320.003814.7713258.3
CameSat040-670.037713.606764.2CameSat123-1610.003814.3116165.8
CameSat041-1420.03534.8114262.7CameSat124-1200.003715.5112059.2
CameSat042-2500.034218.2525066.8CameSat125-3090.003615.6630964.4
CameSat043-1510.03335.9315165.6CameSat126-5090.003617.2250969.7
CameSat044-28440.032211.06284473.6CameSat127-4100.003410.0841066.1
CameSat045-1430.03199.0114361.5CameSat128-1480.00346.0914857.4
CameSat046-230.03016.472356.5CameSat129-910.003419.479162.6
CameSat047-3890.029813.1038964.0CameSat130-1470.003311.0814761.2
CameSat048-2930.028617.0129358.4CameSat131-1490.003312.1114970.5
CameSat049-200.026513.402060.0CameSat132-4290.00303.4342963.4
CameSat050-1400.02589.0014067.9CameSat133-1420.00286.4114262.7
CameSat051-30510.02558.78305167.5CameSat134-1660.00285.6316669.3
CameSat052-1430.02386.6714366.4CameSat135-1480.00277.0114866.2
CameSat053-1530.02359.7915368.6CameSat136-2550.002712.4825565.9
CameSat054-1640.02118.2016467.1CameSat137-3600.00253.3536059.4
CameSat055-300.020113.583063.3CameSat138-1560.00257.1815657.7
CameSat056-420.019819.824269.0CameSat139-3690.002513.3836965.0
CameSat057-1470.01959.6114761.9CameSat140-840.002510.288457.1
CameSat058-2800.01896.3628057.1CameSat141-1630.001913.4716365.0
CameSat059-1280.018819.2912868.8CameSat142-4080.001710.7740867.9
CameSat060-1410.018814.6814159.6CameSat143-1840.00168.5518465.8
CameSat061-2300.01847.5623068.3CameSat144-2650.001513.2526563.8
CameSat062-1420.018312.1914260.6CameSat145-1680.00157.1616864.3
CameSat063-20480.01825.04204864.7CameSat146-1390.00158.3613974.1
CameSat064-1040.01822.7810451.0CameSat147-1540.001413.0815473.4
CameSat065-1480.017515.0514867.6CameSat148-4680.00144.0646859.2
CameSat066-1490.01756.9414966.4CameSat149-1410.001410.4814151.8
CameSat067-1680.015523.7116869.0CameSat150-1470.00134.4314770.1
CameSat068-1530.01478.3515358.8CameSat151-3000.00137.2630063.0
CameSat069-1420.014413.6314255.6CameSat152-2280.00125.4122859.6
CameSat070-130.014214.351353.8CameSat153-4980.00124.7549860.8
CameSat071-200.013717.802070.0CameSat154-590.00129.395972.9
CameSat072-1930.01328.7119365.3CameSat155-4960.00112.0949666.7
CameSat073-200.013022.312045.0CameSat156-2160.00112.8421660.2
CameSat074-16250.01161.77162563.1CameSat157-4760.00112.7647662.8
CameSat075-2750.01167.1327562.9CameSat158-1430.00119.0214365.0
CameSat076-2430.011412.6924361.3CameSat159-2720.00102.5127263.6
CameSat077-18170.01031.95181763.1CameSat160-360.000912.373663.9
CameSat078-1380.010214.1313867.4CameSat161-1270.00092.4212765.4
CameSat079-1430.01026.6014369.2CameSat162-1330.00084.6013370.7
CameSat080-1620.009816.9016267.9CameSat163-4160.00083.3741660.6
CameSat081-1250.009316.4812558.4CameSat164-1120.00068.9511267.9
CameSat082-2040.00914.9820457.8CameSat165-1050.00028.1810560.0
CameSat083-1000.009115.9810056.4
Disclaimer/Publisher’s Note: The statements, opinions and data contained in all publications are solely those of the individual author(s) and contributor(s) and not of MDPI and/or the editor(s). MDPI and/or the editor(s) disclaim responsibility for any injury to people or property resulting from any ideas, methods, instructions or products referred to in the content.

