
Identification of Candidate QTLs and Genes for Ear Diameter by Multi-Parent Population in Maize
Abstract
:1. Introduction
2. Materials and Methods
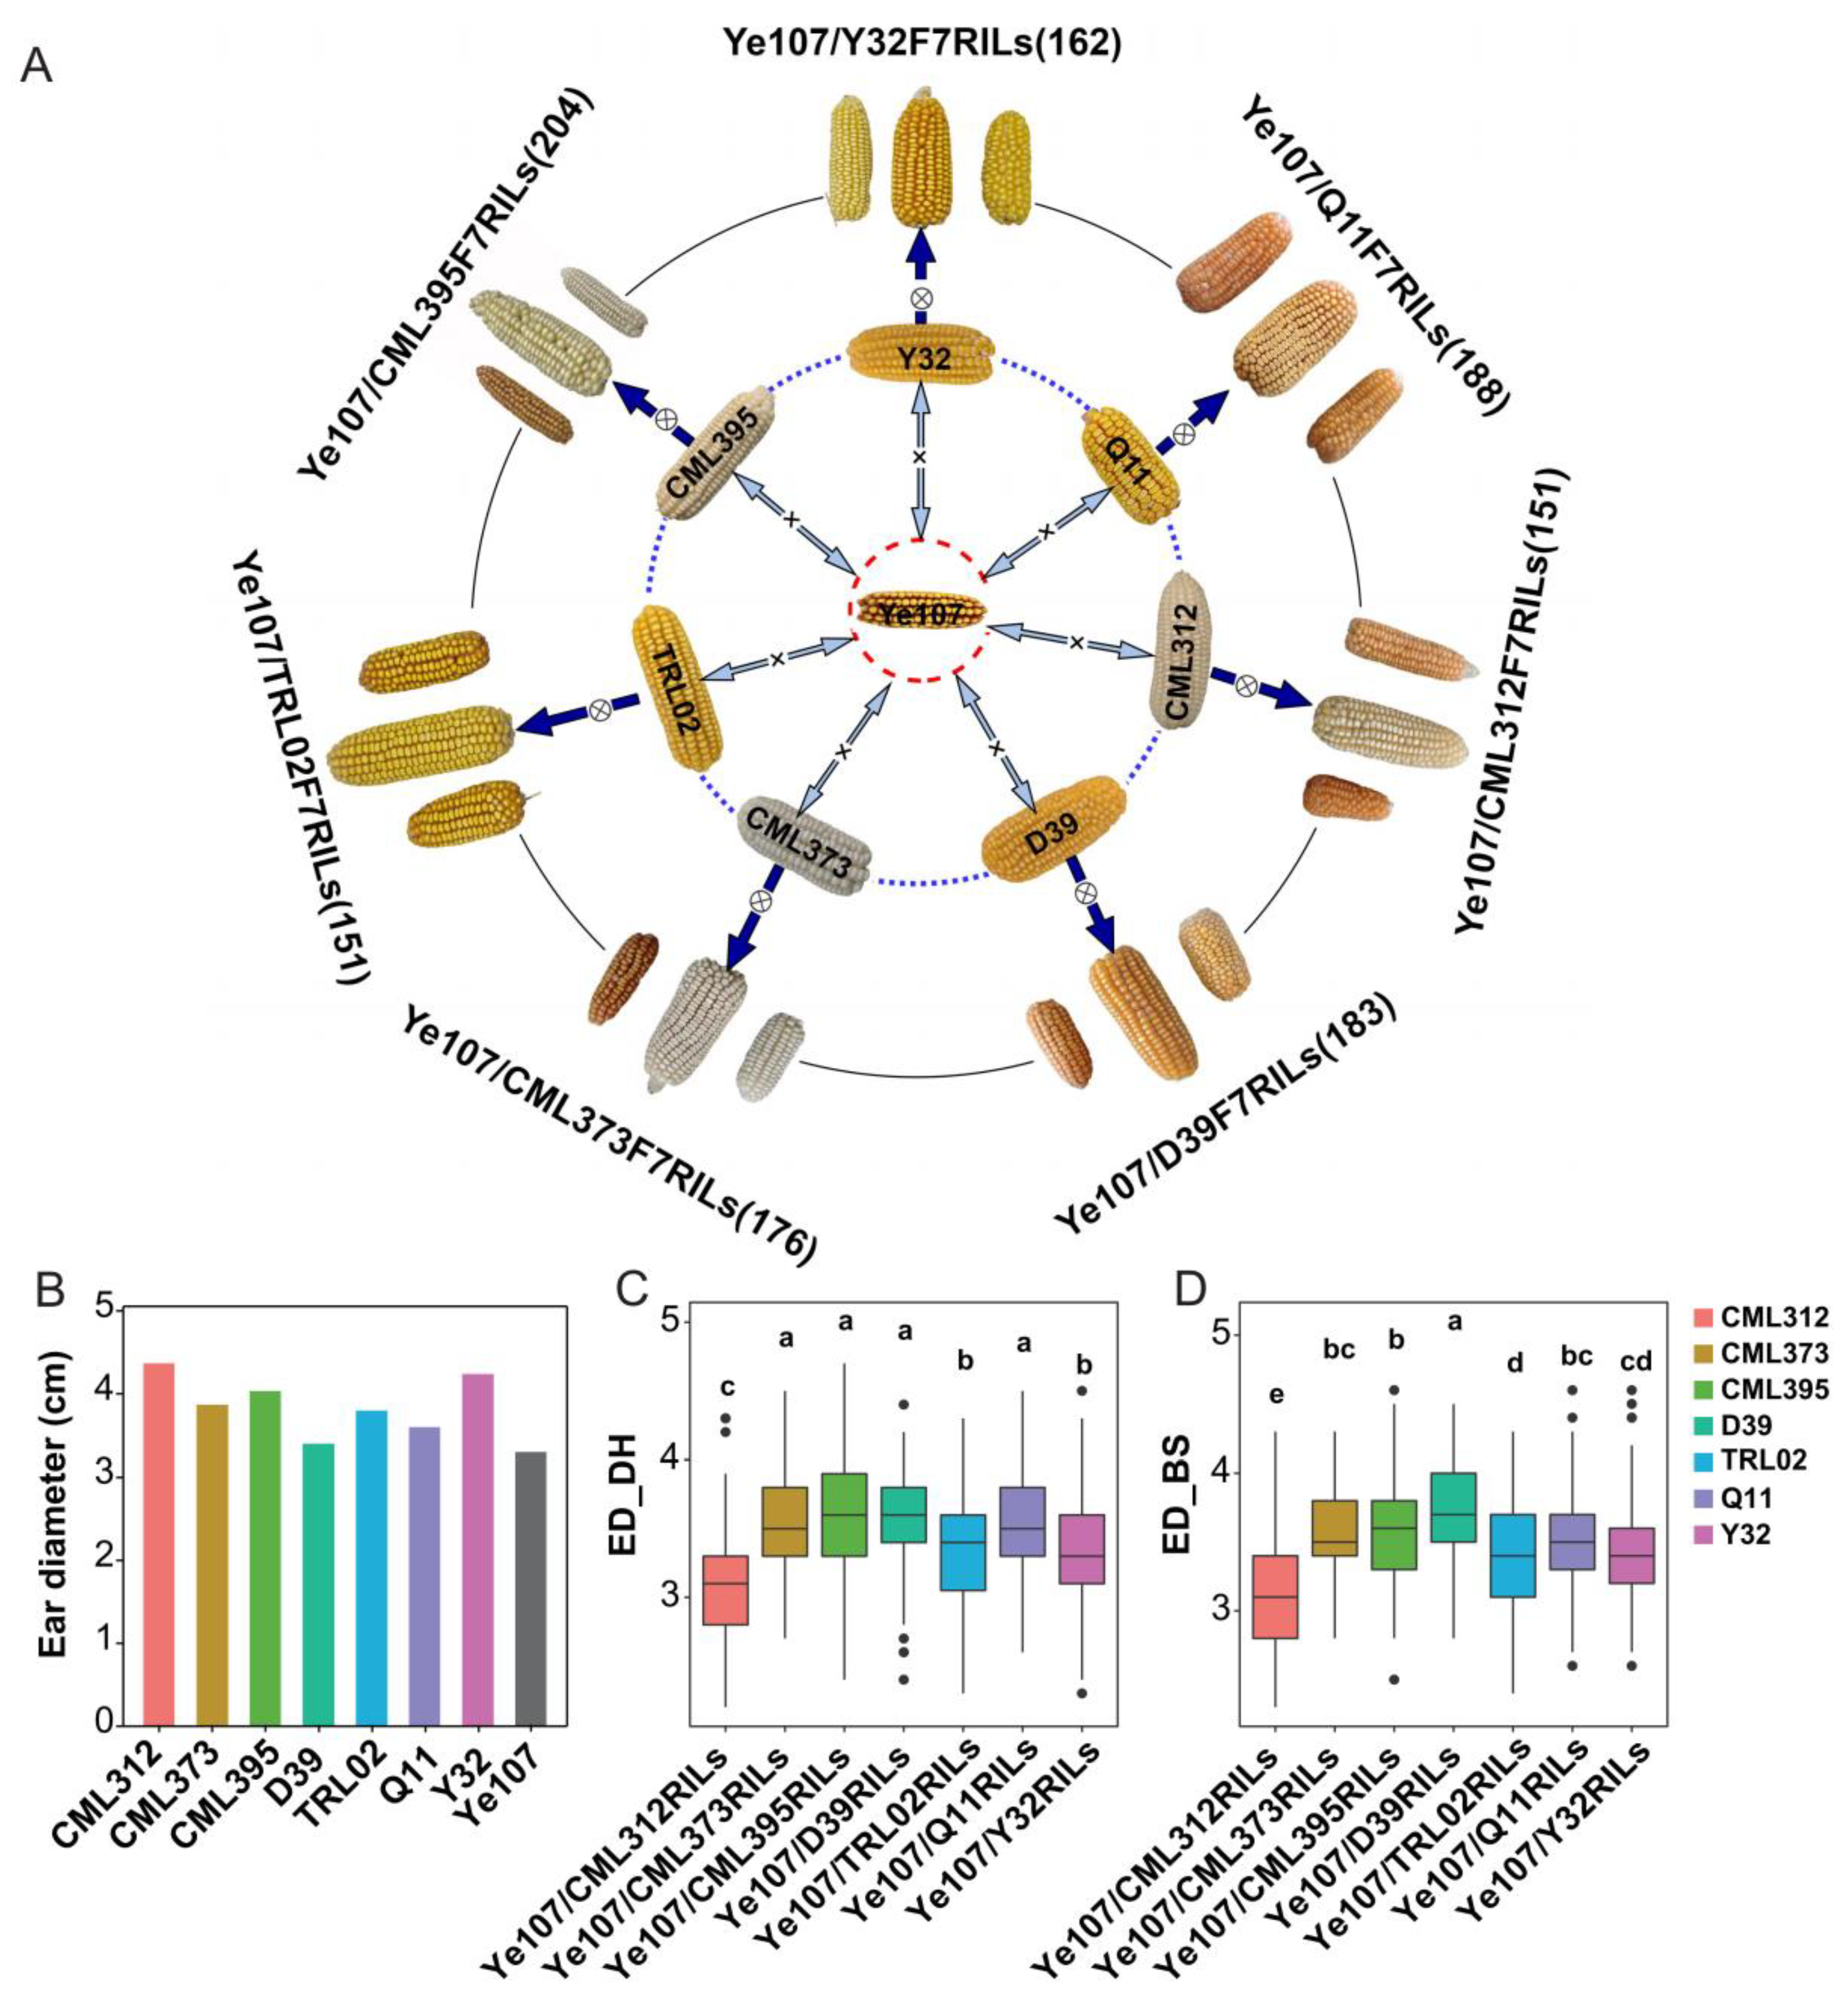
2.1. Selection of Parental Lines for Constructing the Multi-Parent Population
2.2. Field Experiment and Phenotypic Data Collection
2.3. Genotyping-by-Sequencing (GBS)
2.4. Genome-Wide Association Studies (GWAS)
2.5. Linkage Mapping and QTL Analysis
2.6. Analysis of Epistatic Effect of SNPs
3. Results
3.1. Phenotypic Evaluation for ED
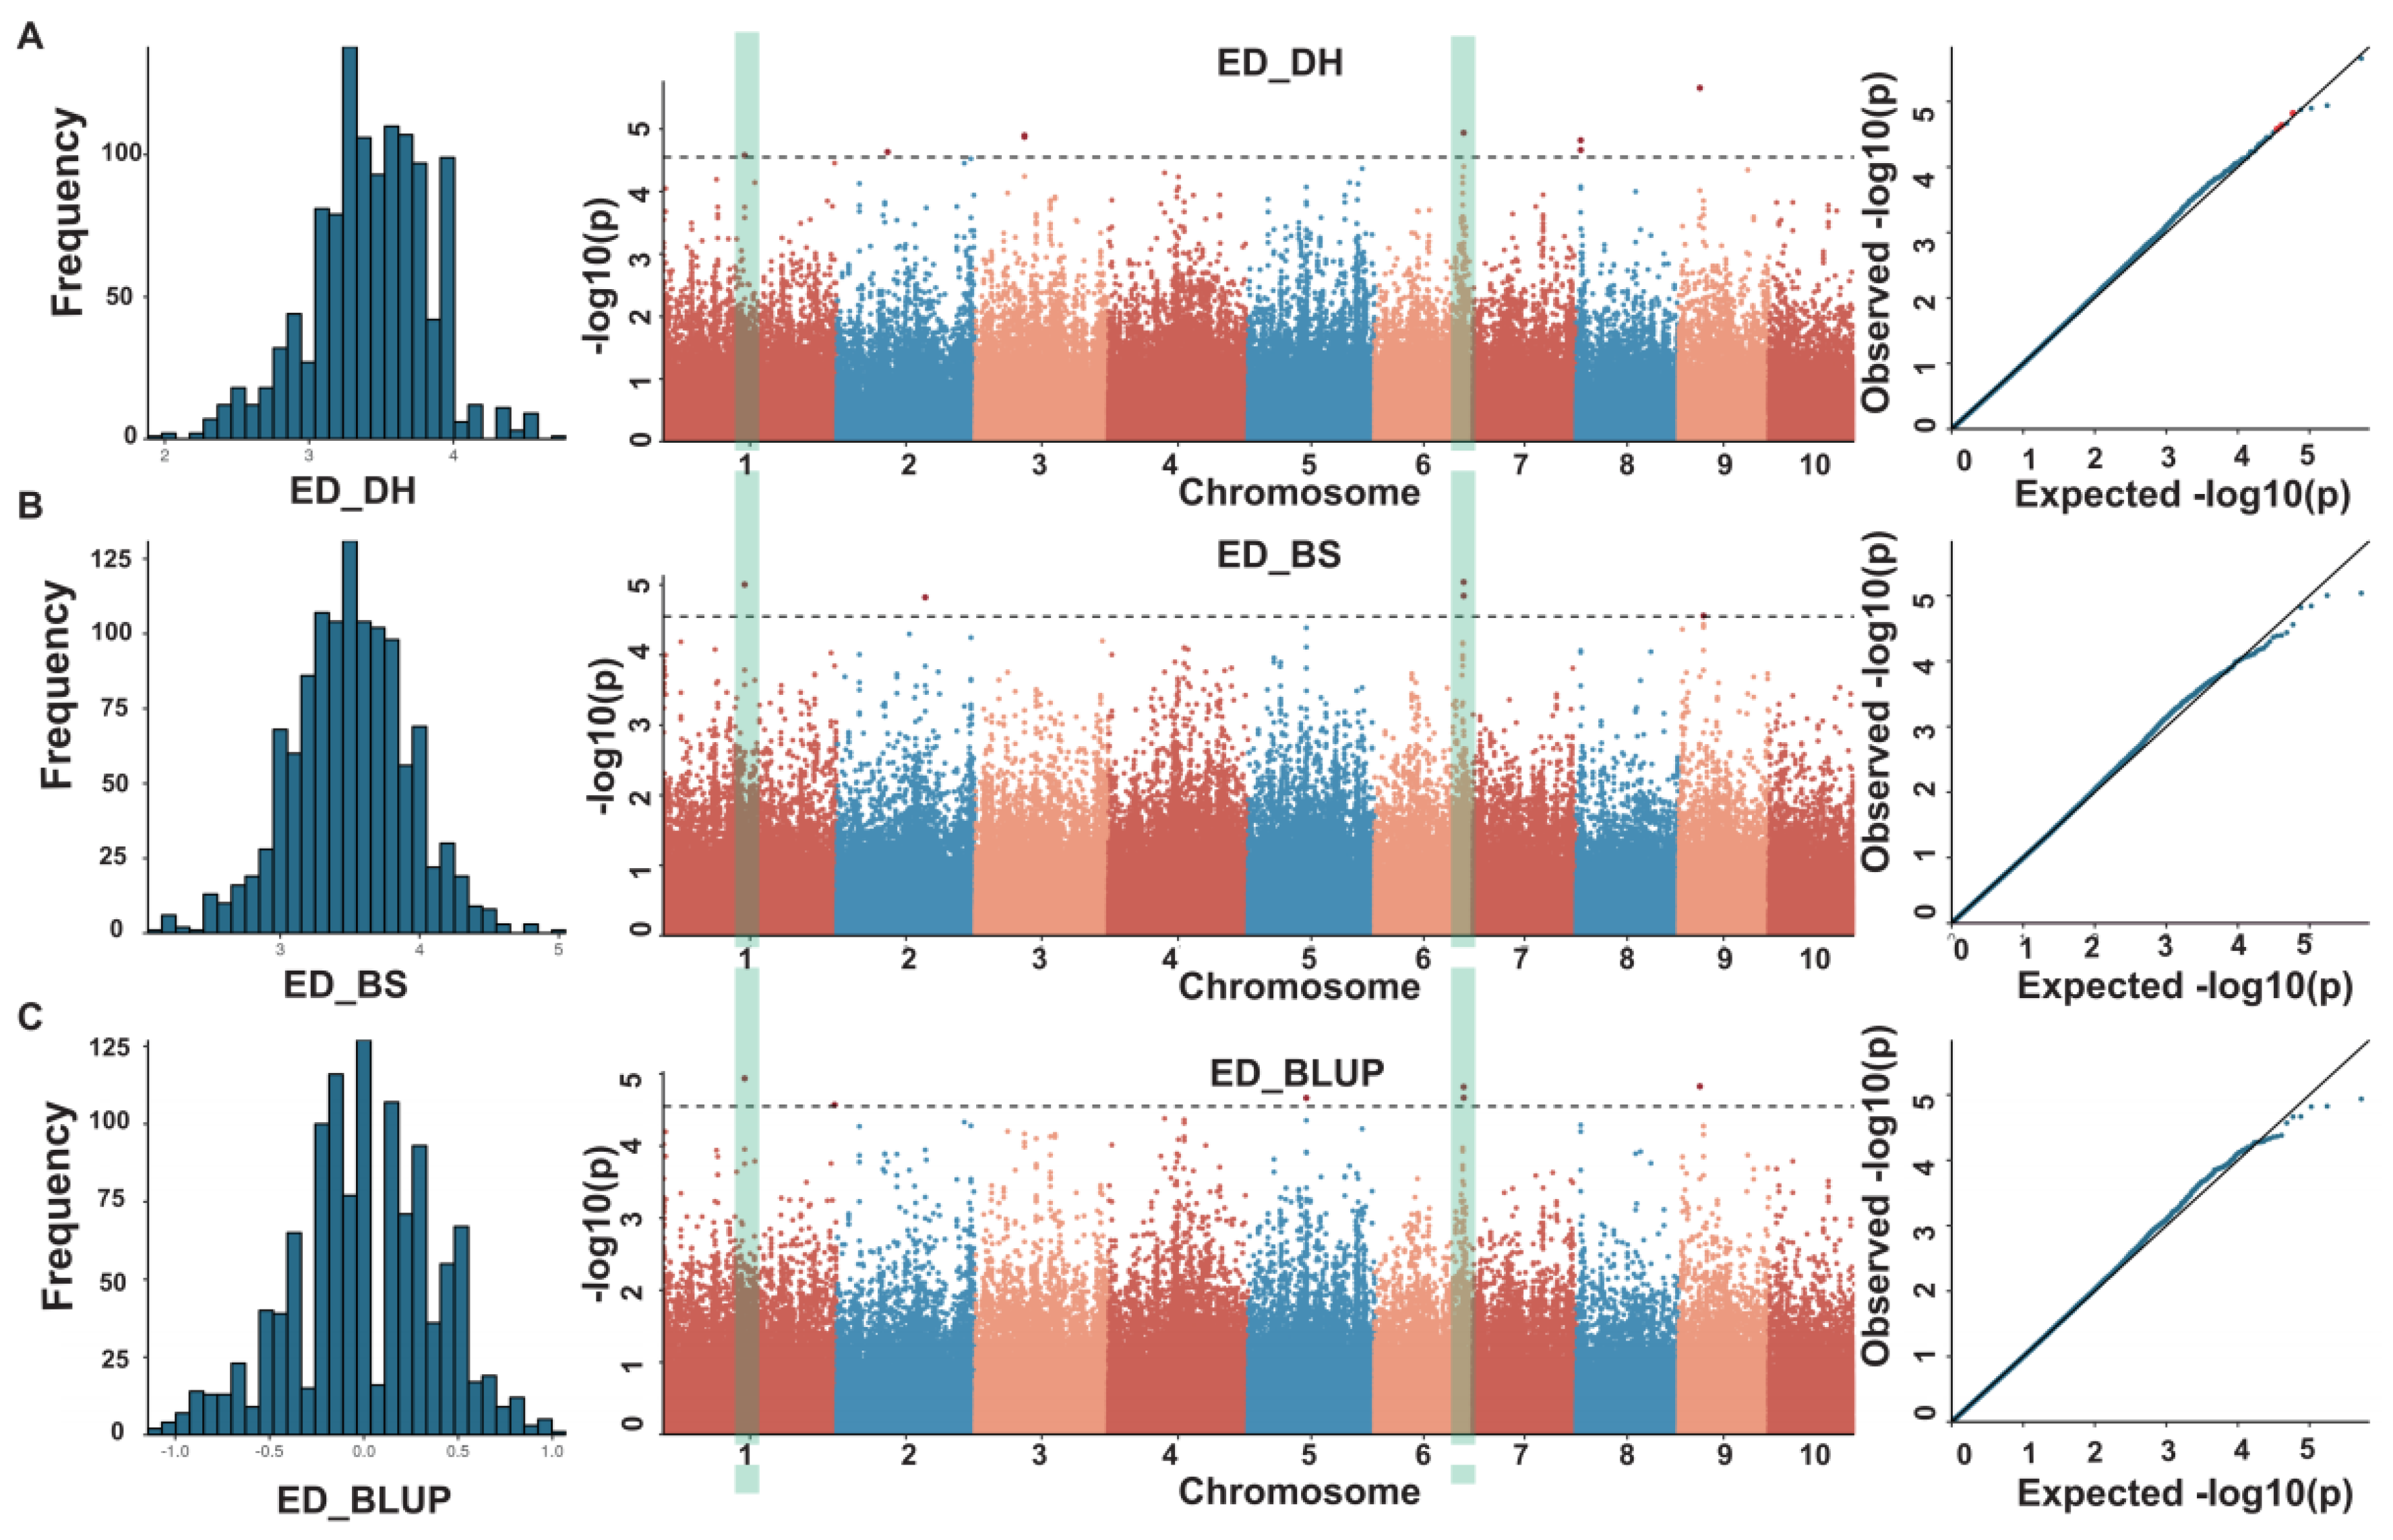
3.2. Genome-Wide Association Analysis for ED
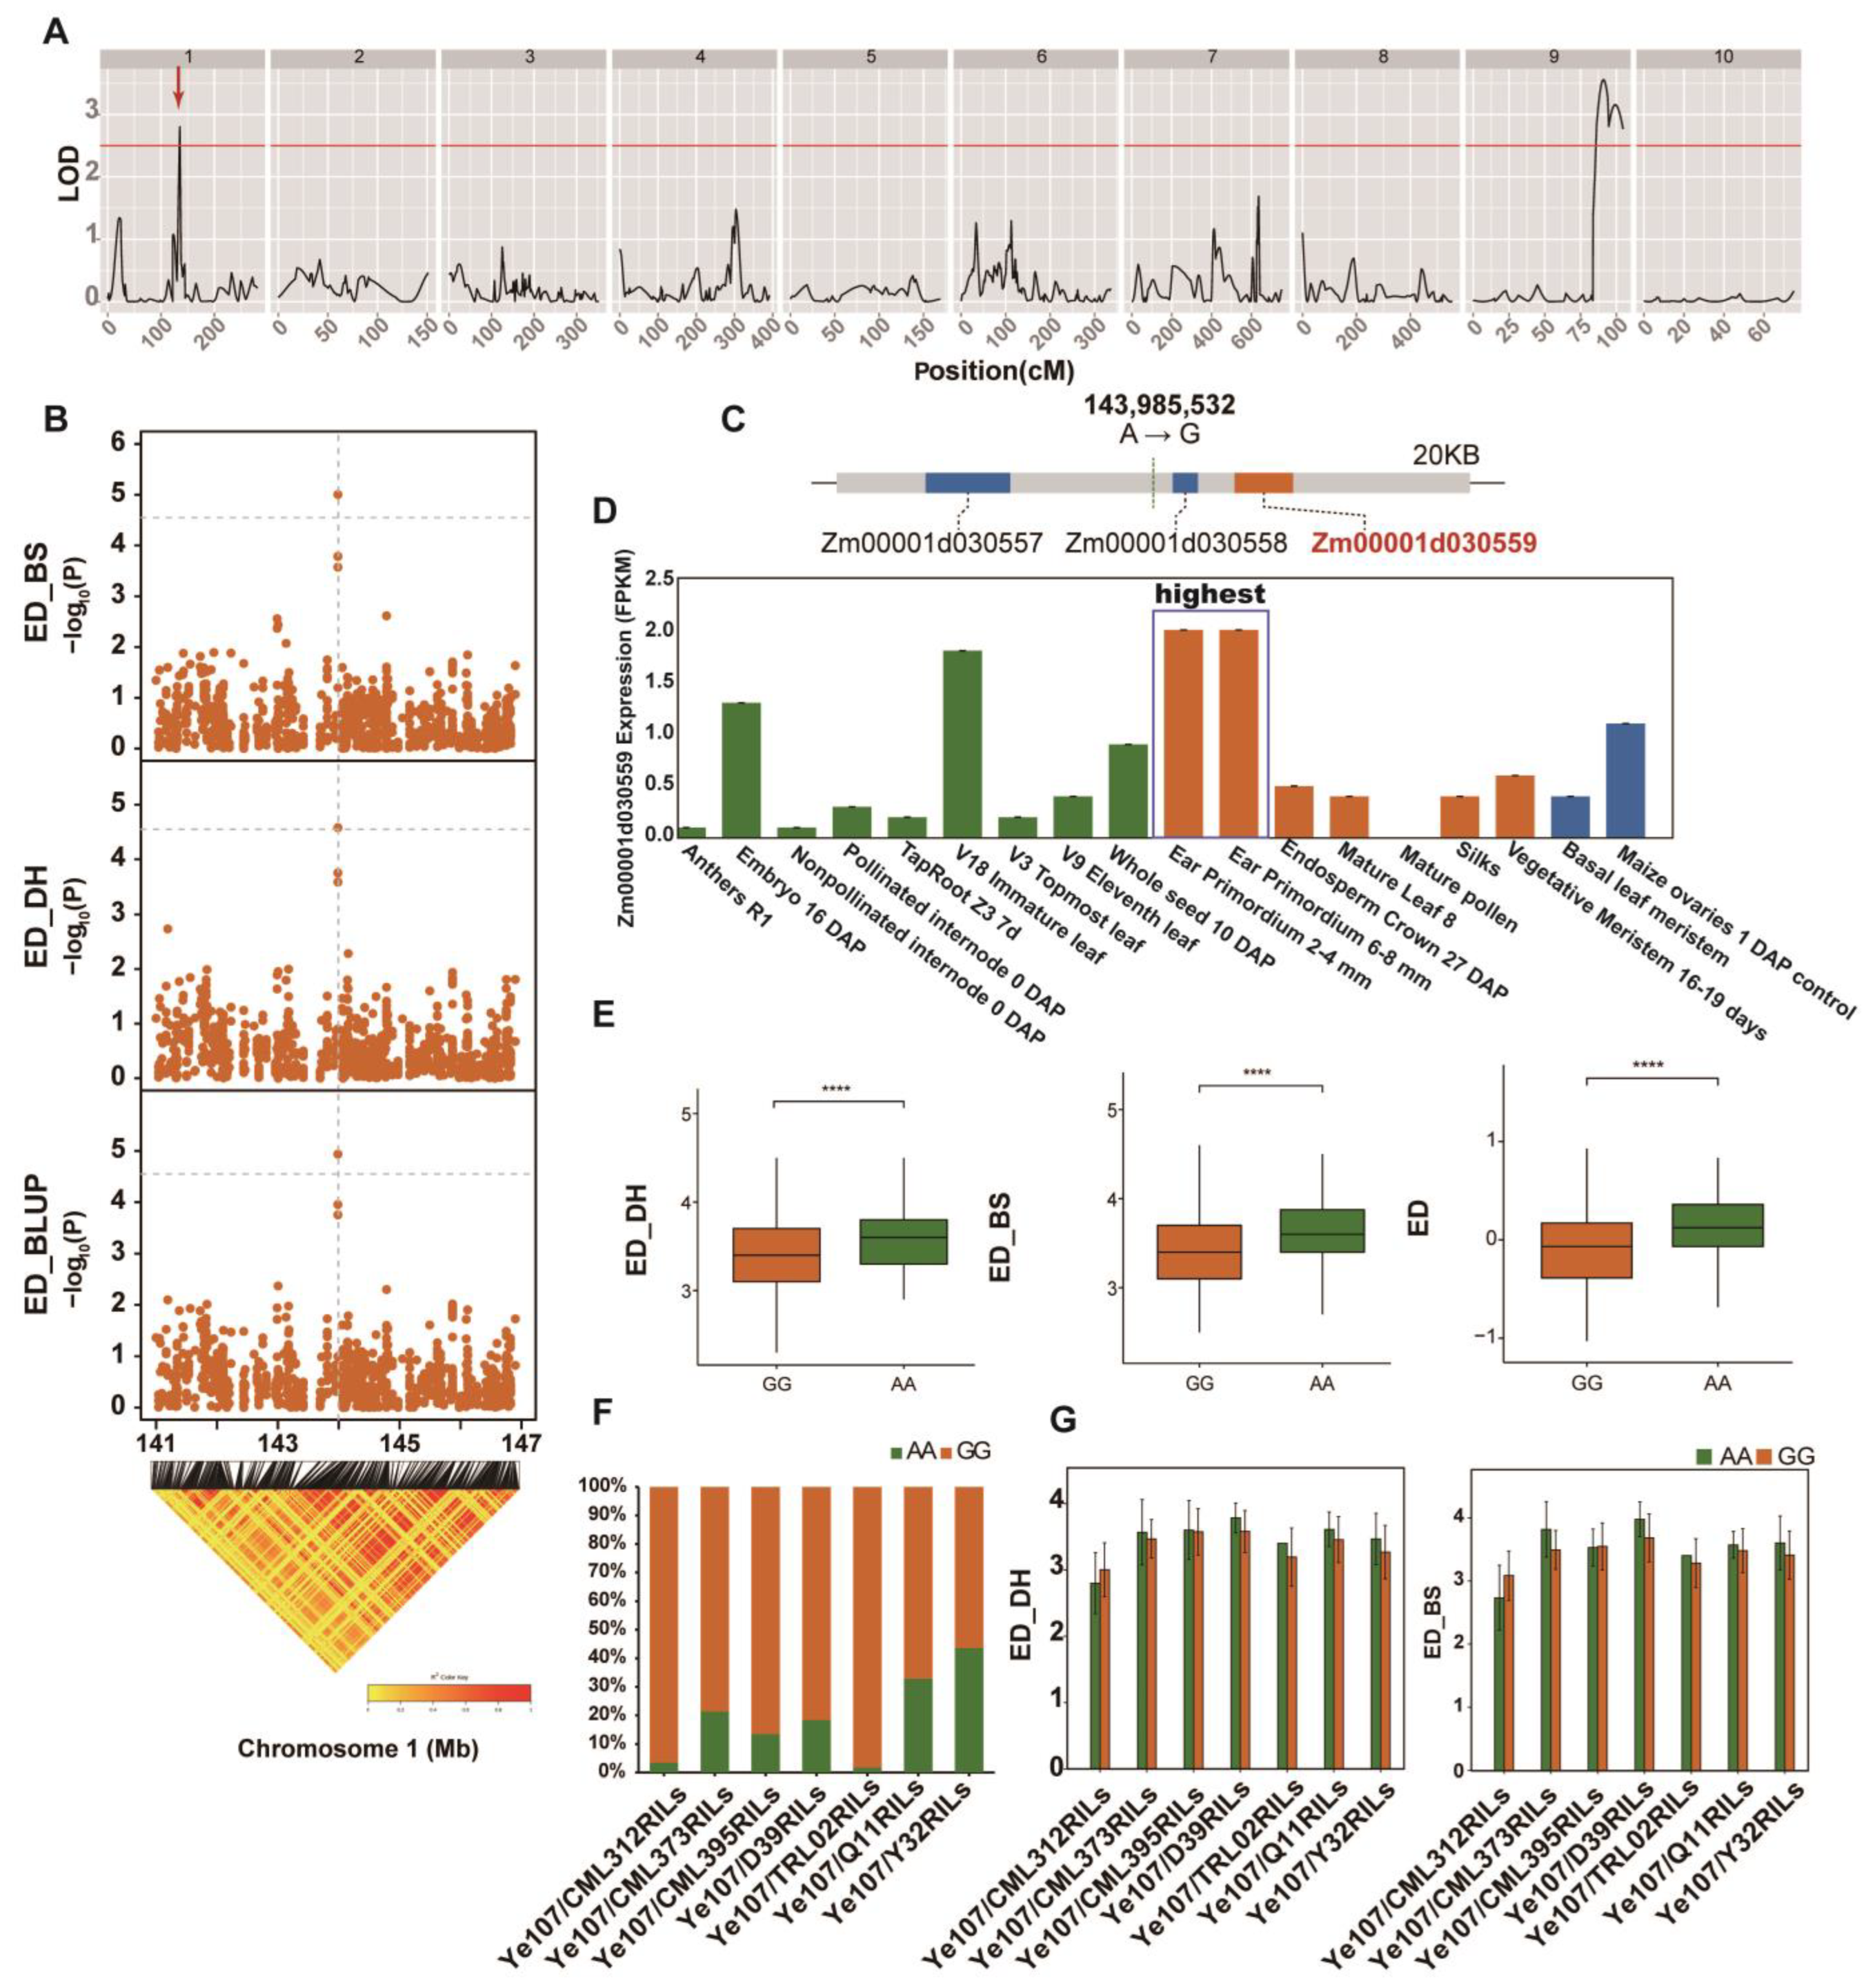
3.3. Linkage Analysis for ED and the Identification of ED-Related Genes
3.4. Analysis of Epistatic Effect of SNP
3.5. Validation of the Contribution of ED QTLs and Candidate Genes in Determining Grain Yield and Significance of the “Three Heterotic Group” Pattern
4. Discussion
4.1. Screening for ED in Maize and Identification of Candidate Genes
4.2. Genetic Effect of ED on “Three Heterotic Group” Pattern
Author Contributions
Funding
Institutional Review Board Statement
Informed Consent Statement
Data Availability Statement
Conflicts of Interest
Abbreviations
References
- Yan, J.; Warburton, M.; Crouch, J. Association Mapping for Enhancing Maize (Zea mays L.). Genet. Improv. Crop Sci. 2011, 51, 433–449. [Google Scholar]
- Xiao, Y.; Liu, H.; Wu, L.; Warburton, M.; Yan, J. Genome-wide Association Studies in Maize: Praise and Stargaze. Mol. Plant 2017, 10, 359–374. [Google Scholar] [CrossRef] [PubMed] [Green Version]
- Zhang, Z.; Liu, Z.; Hu, Y.; Li, W.; Fu, Z.; Ding, D.; Li, H.; Qiao, M.; Tang, J. QTL analysis of Kernel-related traits in maize using an immortalized F2 population. PLoS ONE 2014, 9, e89645. [Google Scholar] [CrossRef] [PubMed] [Green Version]
- Zhang, H.; Zheng, Z.; Liu, X.; Li, Z.; He, C.; Liu, D.; Luo, Y.; Zhang, G.; Tan, Z.; Li, R. QTL Mapping for Ear Length and Ear Diameter under Different Nitrogen Regimes in Maize. Afr. J. Agric. Res. 2010, 5, 626–630. [Google Scholar]
- Yu, Y.; Li, G.; Yang, Z.; Hu, J.; Zheng, J.; Qi, X. Identification of a major quantitative trait locus for ear size induced by space flight in sweet maize. Genet. Mol. Res. 2014, 13, 3069–3078. [Google Scholar] [CrossRef]
- Yang, C.; Liu, J.; Rong, T. Detection of quantitative trait loci for ear row number in F2 populations of maize. Genet. Mol. Res. 2015, 14, 14229–14238. [Google Scholar] [CrossRef]
- Mendes-Moreira, P.; Alves, M.; Satovic, Z.; Santos, J.; Souza, J.; Pêgo, S.; Hallauer, A.; Vaz Patto, M. Genetic Architecture of Ear Fasciation in Maize (Zea mays L.) under QTL Scrutiny. PLoS ONE 2015, 10, e0124543. [Google Scholar] [CrossRef]
- Su, C.; Wang, W.; Gong, S.; Zuo, J.; Li, S.; Xu, S. High Density Linkage Map Construction and Mapping of Yield Trait QTLs in Maize (Zea mays L.) Using the Genotyping-by-Sequencing (GBS) Technology. Front. Plant Sci. 2017, 8, 706. [Google Scholar] [CrossRef] [Green Version]
- Yang, N.; Lu, Y.; Yang, X.; Huang, J.; Zhou, Y.; Ali, F.; Wen, W.; Liu, J.; Li, J.; Yan, J. Genome wide association studies using a new nonparametric model reveal the genetic architecture of 17 agronomic traits in an enlarged maize association panel. PLoS Genet. 2014, 10, e1004573. [Google Scholar] [CrossRef] [Green Version]
- Liu, L.; Du, Y.; Huo, D.; Wang, M.; Shen, X.; Yue, B.; Qiu, F.; Zheng, Y.; Yan, J.; Zhang, Z. Genetic architecture of maize kernel row number and whole genome prediction. Appl. Genet. 2015, 128, 2243–2254. [Google Scholar] [CrossRef] [Green Version]
- Xue, S.; Bradbury, P.; Casstevens, T.; Holland, J. Genetic Architecture of Domestication-Related Traits in Maize. Genetics 2016, 204, 99–113. [Google Scholar] [CrossRef] [PubMed] [Green Version]
- Xiao, Y.; Tong, H.; Yang, X.; Xu, S.; Pan, Q.; Qiao, F.; Raihan, M.; Luo, Y.; Liu, H.; Zhang, X.; et al. Genome-wide dissection of the maize ear genetic architecture using multiple populations. New Phytol. 2016, 210, 1095–1106. [Google Scholar] [CrossRef] [Green Version]
- Dell’Acqua, M.; Gatti, D.; Pea, G.; Cattonaro, F.; Coppens, F.; Magris, G.; Hlaing, A.; Aung, H.; Nelissen, H.; Baute, J.; et al. Genetic properties of the MAGIC maize population: A new platform for high definition QTL mapping in Zea mays. Genom. Biol. 2015, 16, 167. [Google Scholar] [CrossRef] [PubMed] [Green Version]
- Eichler, E.; Flint, J.; Gibson, G.; Kong, A.; Leal, S.; Moore, J.; Nadeau, J. Missing heritability and strategies for finding the underlying causes of complex disease. Nat. Rev. Genet. 2010, 11, 446–450. [Google Scholar] [CrossRef] [PubMed] [Green Version]
- Manolio, T.; Collins, F.; Cox, N.; Goldstein, D.; Hindorff, L.; Hunter, D.; McCarthy, M.; Ramos, E.; Cardon, L.; Chakravarti, A.; et al. Finding the missing heritability of complex diseases. Nature 2009, 461, 747–753. [Google Scholar] [CrossRef] [Green Version]
- Yu, J.; Buckler, E. Genetic association mapping and genome organization of maize. Curr. Opin. Biotechnol. 2006, 17, 155–160. [Google Scholar] [CrossRef]
- Yu, J.; Holland, J.; McMullen, M.; Buckler, E. Genetic design and statistical power of nested association mapping in maize. Genetics 2008, 178, 539–551. [Google Scholar] [CrossRef] [Green Version]
- McMullen, M.; Kresovich, S.; Villeda, H.; Bradbury, P.; Li, H.; Sun, Q.; Flint-Garcia, S.; Thornsberry, J.; Acharya, C.; Bottoms, C.; et al. Genetic properties of the maize nested association mapping population. Science 2009, 325, 737–740. [Google Scholar] [CrossRef] [Green Version]
- Buckler, E.; Holland, J.; Bradbury, P.; Acharya, C.; Brown, P.; Browne, C.; Ersoz, E.; Flint-Garcia, S.; Garcia, A.; Glaubitz, J.; et al. The Genetic Architecture of Maize Flowering Time. Science 2009, 325, 714–718. [Google Scholar] [CrossRef] [Green Version]
- Tian, F.; Bradbury, P.; Brown, P.; Hung, H.; Sun, Q.; Flint-Garcia, S.; Rocheford, T.; McMullen, M.; Holland, J.; Buckler, E. Genome-wide association study of leaf architecture in the maize nested association mapping population. Nat. Genet. 2011, 43, 159–162. [Google Scholar] [CrossRef]
- Cook, J.; McMullen, M.; Holland, J.; Tian, F.; Bradbury, P.; Ross-Ibarra, J.; Buckler, E.; Flint-Garcia, S. Genetic Architecture of Maize Kernel Composition in the Nested Association Mapping and Inbred Association Panels. Plant Physiol. 2012, 158, 824–834. [Google Scholar] [CrossRef] [PubMed] [Green Version]
- Bauer, E.; Falque, M.; Walter, H.; Bauland, C.; Camisan, C.; Campo, L.; Meyer, N.; Ranc, N.; Rincent, R.; Schipprack, W.; et al. Intraspecific variation of recombination rate in maize. Genom. Biol. 2013, 14, R103. [Google Scholar] [CrossRef]
- Li, Y.; Li, C.; Bradbury, P.; Liu, X.; Lu, F.; Romay, C.; Glaubitz, J.; Wu, X.; Peng, B.; Shi, Y.; et al. Identification of genetic variants associated with maize flowering time using an extremely large multi-genetic background population. Plant J. 2016, 86, 391–402. [Google Scholar] [CrossRef]
- Fragoso, C.; Moreno, M.; Wang, Z.; Heffelfinger, C.; Arbelaez, L.; Aguirre, J.; Franco, N.; Romero, L.; Labadie, K.; Zhao, H.; et al. Genetic Architecture of a Rice Nested Association Mapping Population. G3 Genes Genom. Genet. 2017, 7, 1913–1926. [Google Scholar] [CrossRef] [PubMed] [Green Version]
- Maurer, A.; Draba, V.; Jiang, Y.; Schnaithmann, F.; Sharma, R.; Schumann, E.; Kilian, B.; Reif, J.; Pillen, K. Modelling the genetic architecture of flowering time control in barley through nested association mapping. BMC Genom. 2015, 16, 290. [Google Scholar] [CrossRef] [Green Version]
- Bajgain, P.; Rouse, M.; Tsilo, T.; Macharia, G.; Bhavani, S.; Jin, Y.; Anderson, J. Nested Association Mapping of Stem Rust Resistance in Wheat Using Genotyping by Sequencing. PLoS ONE 2016, 11, e0155760. [Google Scholar] [CrossRef] [PubMed] [Green Version]
- Ali, M.; Xing, G.; He, J.; Zhao, T.; Gai, J. Detecting the QTL-allele system controlling seed-flooding tolerance in a nested association mapping population of soybean. Crop J. 2020, 8, 781–792. [Google Scholar] [CrossRef]
- Gangurde, S.; Wang, H.; Yaduru, S.; Pandey, M.; Fountain, J.; Chu, Y.; Isleib, T.; Holbrook, C.; Xavier, A.; Culbreath, A.; et al. Multi-parent population-based genetic dissection uncovers candidate genes for seed and pod weights in peanut (Arachis hypogaea). Plant Biotechnol. J. 2020, 18, 1457–1471. [Google Scholar] [CrossRef] [Green Version]
- Song, J.; Guan, Z.; Hu, J.; Guo, C.; Yang, Z.; Wang, S.; Liu, D.; Wang, B.; Lu, S.; Zhou, R.; et al. Eight high-quality genomes reveal pan-genome architecture and ecotype differentiation of Brassica napus. Nat. Plants 2020, 6, 34–44. [Google Scholar] [CrossRef] [Green Version]
- Yin, X.; Bi, Y.; Jiang, F.; Guo, R.; Zhang, Y.; Fan, J.; Manjit, K.; Fan, X. Fine mapping of candidate QTL for plant and ear height in a maize multi-parent population population. Front. Plant Sci. 2022, 13, 963985. [Google Scholar] [CrossRef]
- Fan, X.; Tan, J.; Yang, J. Combining ability and heterotic grouping of ten temperate, subtropical and tropical quality protein maize inbreds. Maydica 2004, 49, 267–272. [Google Scholar]
- Fan, X.; Chen, H.; Tan, J.; Xu, C.; Zhang, Y.; Huang, Y.; Kang, M.S. A new maize heterotic pattern between temperate and tropical germplasms. Agron. J. 2008, 100, 917–923. [Google Scholar] [CrossRef]
- Fan, X.; Zhang, Y.; Yao, W.; Bi, Y.; Liu, L.; Chen, H.; Kang, M.S. Reciprocal Diallel Crosses Impact Combining Ability, Variance Estimation, and Heterotic Group lassification. Crop Sci. 2014, 54, 89–97. [Google Scholar] [CrossRef] [Green Version]
- Jiang, F.; Yin, X.; Li, Z.; Guo, R.; Wang, J.; Fan, J.; Zhang, Y.; Kang, M.; Fan, X. Predicting heterosis via genetic distance and the number of SNPs in selected segments of chromosomes in maize. Front. Plant Sci. 2023, 14, 1111961. [Google Scholar] [CrossRef] [PubMed]
- Stewart, C.; Via, J. A rapid CTAB DNA isolation technique useful for RAPD fingerprinting and other PCR applications. Biotechniques 1993, 14, 748–750. [Google Scholar]
- Poland, J.; Brown, P.; Sorrells, M.; Jannink, J. Development of High-Density Genetic Maps for Barley and Wheat Using a Novel Two-Enzyme Genotyping-by-Sequencing Approach. PLoS ONE 2012, 7, e32253. [Google Scholar] [CrossRef] [Green Version]
- Li, C.; Guan, H.; Jing, X.; Li, Y.; Wang, B.; Li, Y.; Liu, X.; Zhang, D.; Liu, C.; Xie, X.; et al. Genomic insights into historical improvement of heterotic groups during modern hybrid maize breeding. Nat. Plants 2022, 8, 750–763. [Google Scholar] [CrossRef]
- McKenna, A.; Hanna, M.; Banks, E.; Sivachenko, A.; Cibulskis, K.; Kernytsky, A.; Garimella, K.; Altshuler, D.; Gabriel, S.; Daly, M.; et al. The Genome Analysis Toolkit: A MapReduce framework for analyzing next-generation DNA sequencing data. Genom. Res. 2010, 20, 1297–1303. [Google Scholar] [CrossRef] [Green Version]
- Jiao, Y.; Peluso, P.; Shi, J.; Liang, T.; Stitzer, M.; Wang, B.; Campbell, M.; Stein, J.; Wei, X.; Chin, C.; et al. Improved maize reference genome with single-molecule technologies. Nature 2017, 546, 524–540. [Google Scholar] [CrossRef]
- Wang, K.; Li, M.; Hakonarson, H. ANNOVAR: Functional annotation of genetic variants from high-throughput sequencing data. Nucleic Acids Res. 2010, 38, e164. [Google Scholar] [CrossRef]
- Zhou, X.; Stephens, M. Genome-wide efficient mixed-model analysis for association studies. Nat. Genet. 2012, 44, 821–824. [Google Scholar] [CrossRef] [PubMed] [Green Version]
- Purcell, S.; Neale, B.; Todd-Brown, K.; Thomas, L.; Ferreira, M.; Bender, D.; Maller, J.; Sklar, P.; Bakker, P.; Daly, M.; et al. PLINK: A tool set for whole-genome association and population-based linkage analyses. Am. J. Hum. Genet. 2007, 81, 559–575. [Google Scholar] [CrossRef] [PubMed] [Green Version]
- Ooijen, J. JoinMap 4, Software for the Calculation of Genetic Linkage Maps in Experimental Populations; Kyazma BV: Wageningen, The Netherlands, 2006; Volume 33, p. 1371. Available online: https://www.scirp.org/(S(i43dyn45teexjx455qlt3d2q))/reference/ReferencesPapers.aspx?ReferenceID=1542595 (accessed on 6 March 2022).
- Zeng, Z. Precision mapping of quantitative trait loci. Genetics 1994, 136, 1457–1468. [Google Scholar] [CrossRef] [PubMed]
- Churchill, G.; Doerge, R. Empirical threshold values for quantitative trait mapping. Genetics 1994, 138, 963–971. [Google Scholar] [CrossRef]
- Woodhouse, M.; Cannon, E.; Portwood, J.; Harper, L.; Gardiner, J.; Schaeffer, M.; Andorf, C. A pan-genomic approach to genome databases using maize as a model system. BMC Plant Biol. 2021, 21, 385. [Google Scholar] [CrossRef]
- Pei, Y.; Deng, Y.; Zhang, H.; Zhang, Z.; Liu, J.; Chen, Z.; Cai, D.; Li, K.; Du, Y.; Zang, J.; et al. EAR APICAL DEGENERATION1 regulates maize ear development by maintaining malate supply for apical inflorescence. Plant Cell 2022, 6, 2222–2241. [Google Scholar] [CrossRef]
- Ning, Q.; Jian, Y.; Du, Y.; Li, Y.; Shen, X.; Jia, H.; Zhao, R.; Zhan, J.; Yang, F.; Jackson, D.; et al. An ethylene biosynthesis enzyme controls quantitative variation in maize ear length and kernel yield. Nat. Commun. 2021, 12, 5832. [Google Scholar] [CrossRef]
- Bommert, P.; Nagasawa, N.; Jackson, D. Quantitative variation in maize kernel row number is controlled by the FASCIATED EAR2 locus. Nat. Genet. 2013, 45, 334–337. [Google Scholar] [CrossRef]
- Xu, R.; Li, Y.; Sui, Z.; Lan, T.; Song, W.; Zhang, M.; Zhang, Y.; Xing, J. A C-terminal encoded peptide, ZmCEP1, is essential for kernel development in maize. J. Exp. Bot. 2021, 72, 5390–5406. [Google Scholar] [CrossRef]
- Wu, J.; Sun, Y.; Zhao, Y.; Zhang, J.; Luo, L.; Li, M.; Wang, J.; Yu, H.; Liu, G.; Yang, L.; et al. Deficient plastidic fatty acid synthesis triggers cell death by modulating mitochondrial reactive oxygen species. Cell Res. 2015, 25, 621–633. [Google Scholar] [CrossRef] [Green Version]
- Chen, W.; Chen, L.; Zhang, X.; Yang, N.; Guo, J.; Wang, M.; Ji, S.; Zhao, X.; Yin, P.; Cai, L.; et al. Convergent selection of a WD40 protein that enhances grain yield in maize and rice. Science 2022, 375, eabg7985. [Google Scholar] [CrossRef]
- Wang, B.; Andargie, M.; Fang, R. The function and biosynthesis of callose in high plants. Heliyon 2022, 8, e09248. [Google Scholar] [CrossRef]
- Zhu, X.; Shao, X.; Pei, Y.; Guo, X.; Li, J.; Song, X.; Zhao, M. Genetic Diversity and Genome-Wide Association Study of Major Ear Quantitative Traits Using High-Density SNPs in Maize. Front. Plant Sci. 2018, 9, 966–982. [Google Scholar] [CrossRef] [PubMed] [Green Version]
- Zhao, Y.; Su, C. Mapping quantitative trait loci for yield-related traits and predicting candidate genes for grain weight in maize. Sci. Rep. 2019, 9, 16112. [Google Scholar] [CrossRef] [PubMed] [Green Version]
- Brown, P.; Upadyayula, N.; Mahone, G.; Tian, F.; Bradbury, P.; Myles, S.; Holland, J.; Flint-Garcia, S.; McMullen, M.; Buckler, E.; et al. Distinct genetic architectures for male and female inflorescence traits of maize. PLoS Genet. 2011, 7, e1002383. [Google Scholar] [CrossRef] [PubMed] [Green Version]
- Hao, D.; Xue, L.; Zhang, Z.; Cheng, Y.; Chen, G.; Zhou, G.; Li, P.; Yang, Z.; Xu, C. Combined linkage and association mapping reveal candidate loci for kernel size and weight in maize. Breed. Sci. 2019, 69, 420–428. [Google Scholar] [CrossRef] [Green Version]
- Liu, Y.; Wang, L.; Sun, C.; Zhang, Z.; Zheng, Y.; Qiu, F. Genetic analysis and major QTL detection for maize kernel size and weight in multi-environments. Theor. Appl. Genet. 2014, 127, 1019–1037. [Google Scholar] [CrossRef]
- Li, M.; Zhong, W.; Yang, F.; Zhang, Z. Genetic and Molecular Mechanisms of Quantitative Trait Loci Controlling Maize Inflorescence Architecture. Plant Cell Physiol. 2018, 59, 448–457. [Google Scholar] [CrossRef] [Green Version]
- Luo, Y.; Zhang, M.; Liu, Y.; Liu, J.; Li, W.; Chen, G.; Peng, Y.; Jin, M.; Wei, W.; Jian, L.; et al. Genetic variation in YIGE1 contributes to ear length and grain yield in maize. New Phytol. 2022, 234, 513–526. [Google Scholar] [CrossRef]
- Li, Z.; Ahn, K.; Avenson, T.; Ballottari, M.; Cruz, J.; Kramer, D.; Bassi, R.; Fleming, G.; Keasling, J.; Niyogi, K. Lutein accumulation in the absence of zeaxanthin restores nonphotochemical quenching in the Arabidopsis thaliana npq1 mutant. Plant Cell 2009, 21, 1798–1812. [Google Scholar] [CrossRef] [Green Version]
- Yang, L.; Li, T.; Tian, X.; Yang, B.; Lao, Y.; Wang, Y.; Zhang, X.; Xue, J.; Xu, S. Genome-wide association study (GWAS) reveals genetic basis of ear-related traits in maize. Euphytica 2020, 216, 172. [Google Scholar] [CrossRef]
- Jiang, F.; Li, Z.; Yin, X.; Zhang, Y.; Guo, R.; Kang, M.; Fan, X. Impact of donor QTL on grain yield and gray leaf spot of four recombinant inbred lines of maize. Crop Sci. 2020, 2, 841–851. [Google Scholar] [CrossRef] [Green Version]


| ED_DH | CML312 | CML373 | CML395 | Y32 | D39 | Q11 | TRL02 |
|---|---|---|---|---|---|---|---|
| MIN | 2.200 | 2.700 | 2.400 | 2.300 | 2.400 | 2.600 | 2.300 |
| MAX | 4.300 | 4.500 | 4.700 | 4.500 | 4.400 | 4.500 | 4.300 |
| mean | 3.067 | 3.560 | 3.625 | 3.300 | 3.602 | 3.511 | 3.290 |
| SD | 0.460 | 0.322 | 0.379 | 0.384 | 0.332 | 0.335 | 0.425 |
| CV | 0.150 | 0.091 | 0.105 | 0.116 | 0.092 | 0.095 | 0.129 |
| ED_BS | CML312 | CML373 | CML395 | Y32 | D39 | Q11 | TRL02 |
| MIN | 2.300 | 2.800 | 2.500 | 2.600 | 2.800 | 2.600 | 2.400 |
| MAX | 4.300 | 4.300 | 4.600 | 4.600 | 4.500 | 4.600 | 4.300 |
| mean | 3.138 | 3.569 | 3.605 | 3.445 | 3.725 | 3.506 | 3.378 |
| SD | 0.429 | 0.322 | 0.356 | 0.359 | 0.373 | 0.337 | 0.413 |
| CV | 0.137 | 0.090 | 0.099 | 0.104 | 0.100 | 0.096 | 0.122 |
| loc. | chr. | SNP | ref | alt | −log(P) |
|---|---|---|---|---|---|
| BS | 1 | 143985532 | A | G | 5.00 |
| BS | 2 | 156355406 | A | G | 4.82 |
| BS | 6 | 157559780 | C | T | 5.04 |
| BS | 6 | 157646040 | C | T | 4.84 |
| BS | 9 | 44163724 | A | G | 4.56 |
| DH | 1 | 143985532 | A | G | 4.58 |
| DH | 2 | 89769384 | C | T | 4.63 |
| DH | 3 | 87449415 | T | G | 4.90 |
| DH | 6 | 157559780 | C | T | 4.94 |
| DH | 8 | 8176464 | C | A | 4.82 |
| DH | 9 | 37837960 | A | T | 5.66 |
| QTL | Chromosome | Position(cM) | LOD | Mapping Interval | Additive_Effect | R2 |
|---|---|---|---|---|---|---|
| qED1-1 | 1 | 135.31 | 2.80 | 133–136.5 | −0.189 | 0.071 |
| qED9-1 | 9 | 91.31 | 3.56 | 85.8–94.7 | 0.127 | 0.102 |
| qED9-2 | 9 | 99.71 | 3.16 | 94.7–103.7 | 0.122 | 0.095 |
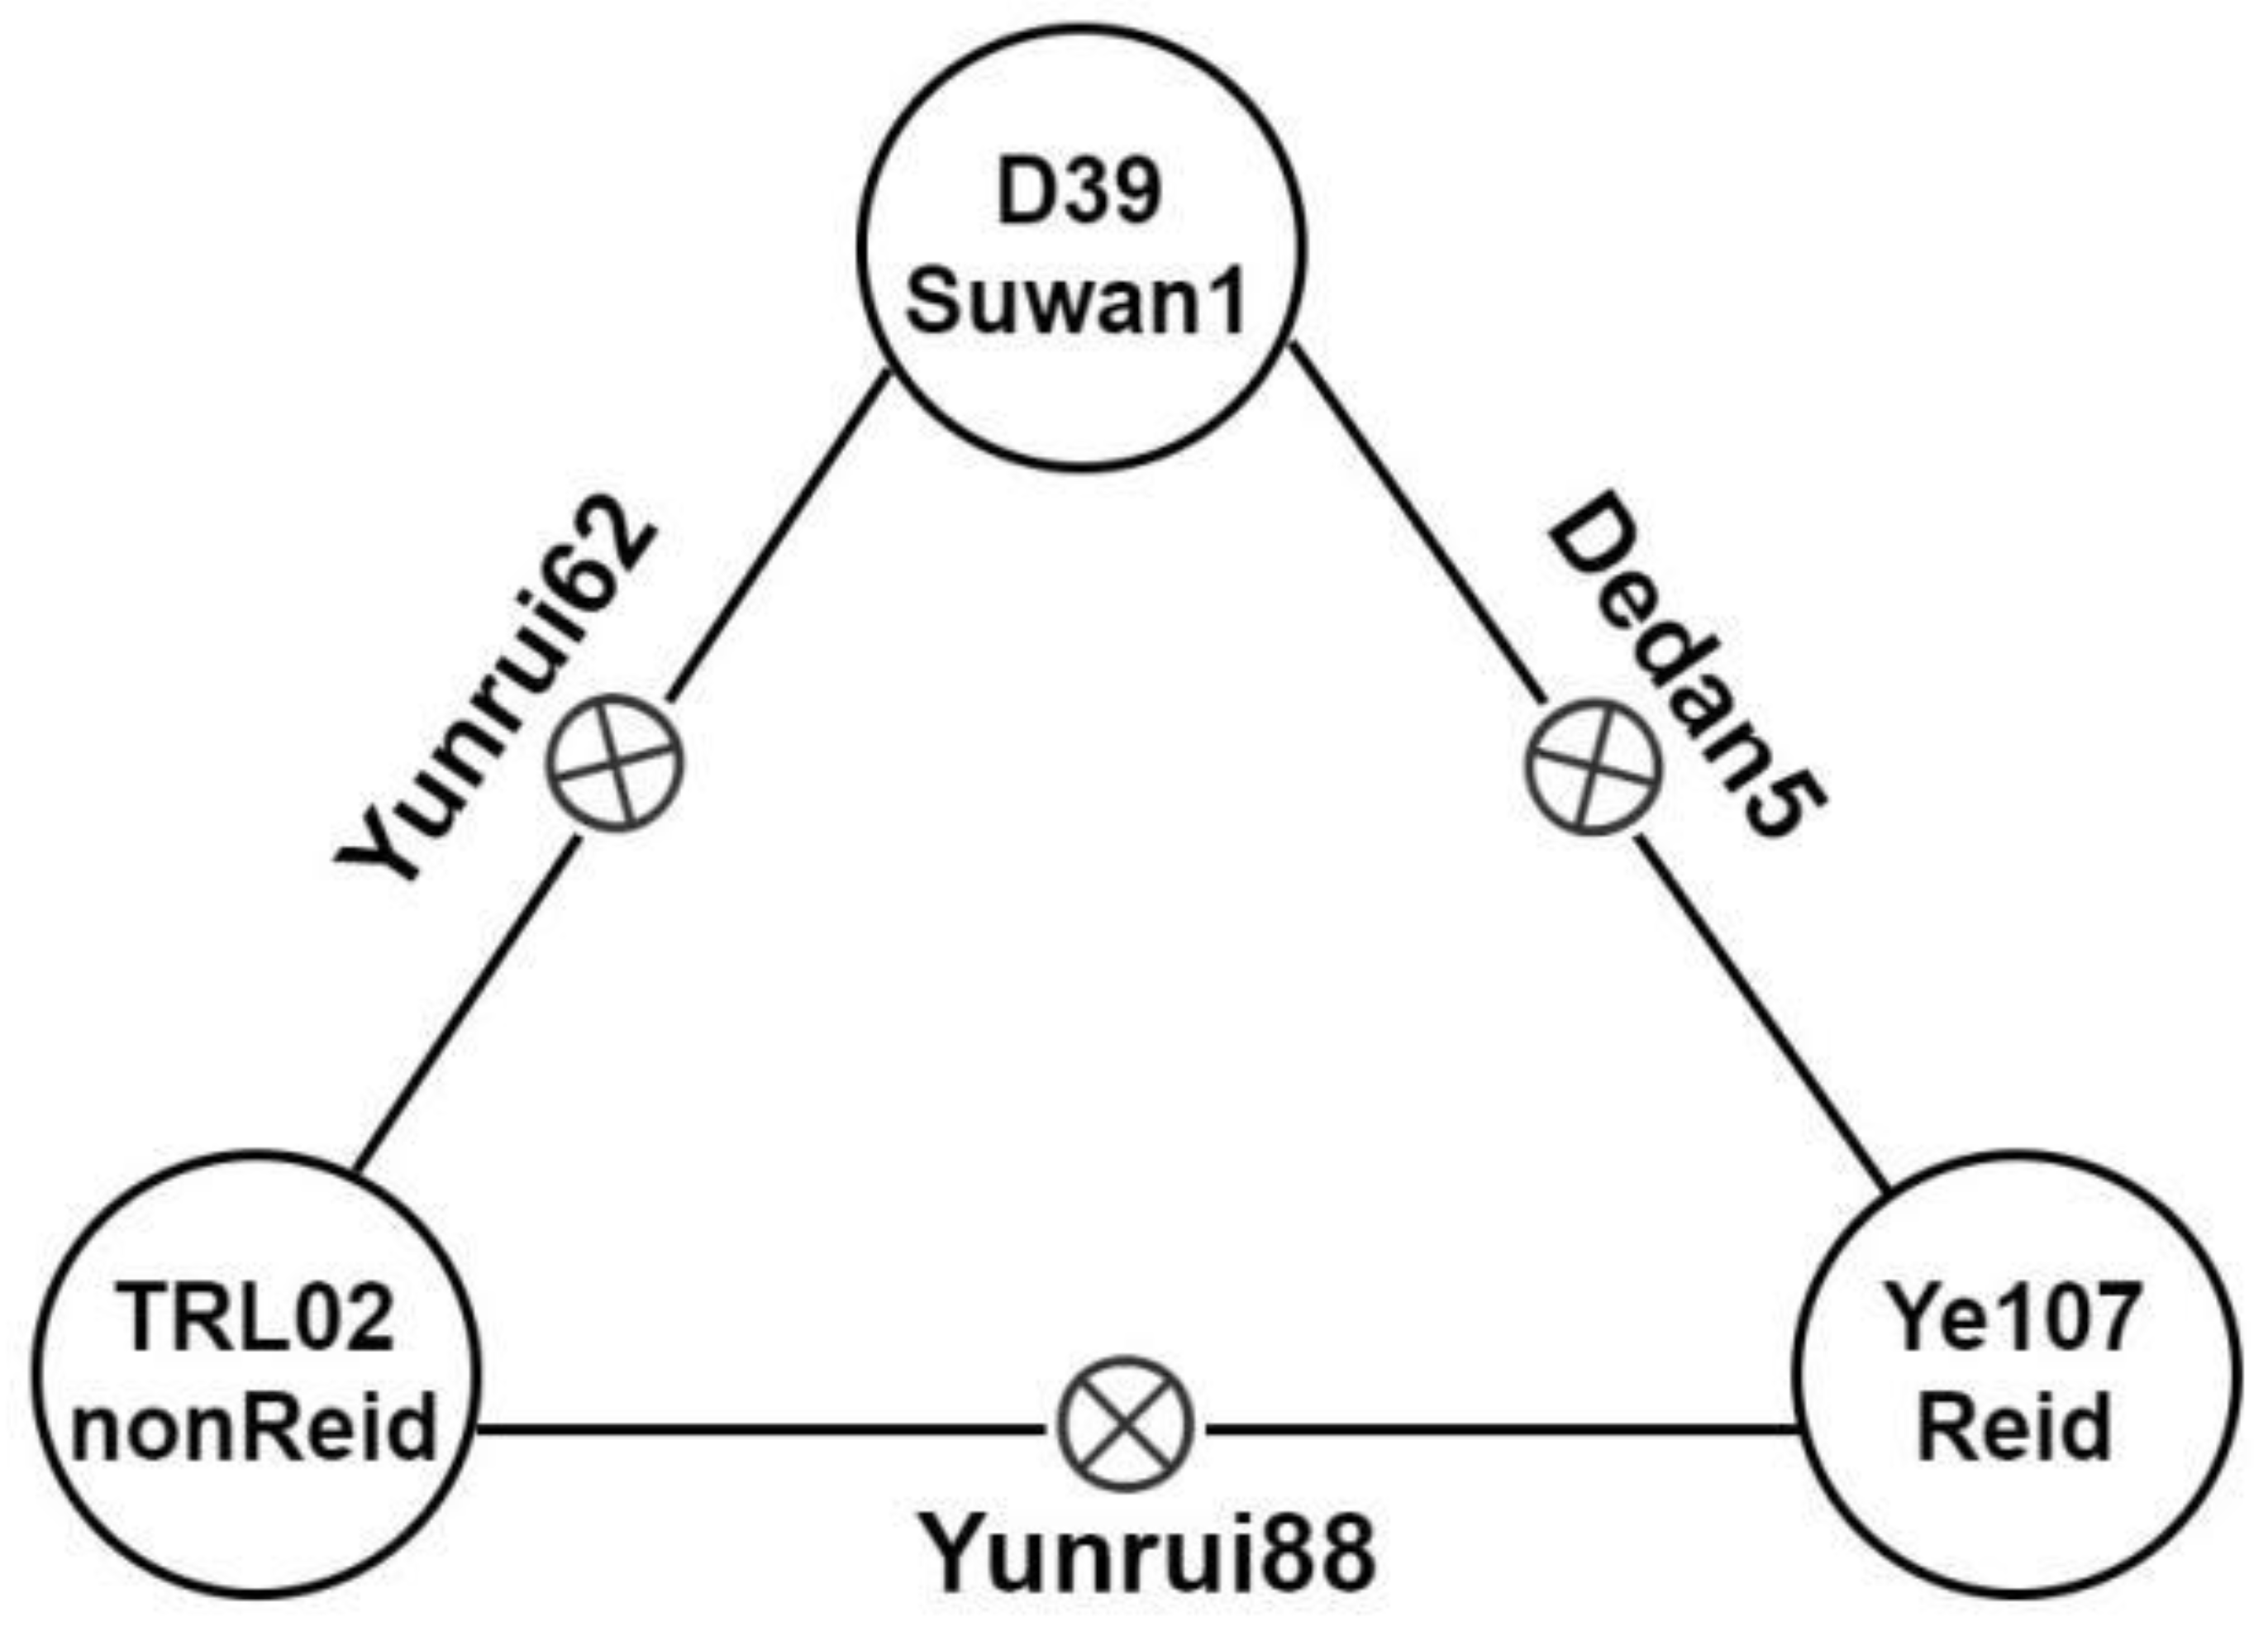
| Materials | Heterotic Group | ED_line | ED_F1 | ED_MPH | GY_line | GY_F1 | GY_MPH |
|---|---|---|---|---|---|---|---|
| CML312 | nonReid | 4.5 | 5.8 | 0.47 | 4.1 | 12.0 | 2.20 |
| TRL02 | nonReid | 4.2 | 5.5 | 0.45 | 4.3 | 12.7 | 2.43 |
| CML395 | nonReid | 4.4 | 5.7 | 0.46 | 4.2 | 11.1 | 1.92 |
| CML373 | nonReid | 4.3 | 5.4 | 0.40 | 4.9 | 8.8 | 1.12 |
| Y32 | Suwan1 | 4.6 | 6.2 | 0.55 | 3.7 | 12.3 | 2.46 |
| D39 | Suwan1 | 3.8 | 5.4 | 0.50 | 3.9 | 12.5 | 2.42 |
| Q11 | Reid | 4.2 | 5.5 | 0.45 | 3.6 | 9.7 | 1.77 |
| Ye107 | Reid | 3.4 | 3.4 | ||||
| Yunrui88 (TRL02×Ye107) | nonReid×Reid | 5.5 | 0.45 | 12.7 | 2.43 | ||
| Dedan5 (D39×Ye107) | Suwan1×Reid | 5.4 | 0.50 | 12.5 | 2.42 | ||
| Yunrui62 (TRL02×D39) | Suwan1×nonReid | 5.6 | 0.40 | 14.2 | 2.38 |
Disclaimer/Publisher’s Note: The statements, opinions and data contained in all publications are solely those of the individual author(s) and contributor(s) and not of MDPI and/or the editor(s). MDPI and/or the editor(s) disclaim responsibility for any injury to people or property resulting from any ideas, methods, instructions or products referred to in the content. |
© 2023 by the authors. Licensee MDPI, Basel, Switzerland. This article is an open access article distributed under the terms and conditions of the Creative Commons Attribution (CC BY) license (https://creativecommons.org/licenses/by/4.0/).
Share and Cite
Jiang, F.; Liu, L.; Li, Z.; Bi, Y.; Yin, X.; Guo, R.; Wang, J.; Zhang, Y.; Shaw, R.K.; Fan, X. Identification of Candidate QTLs and Genes for Ear Diameter by Multi-Parent Population in Maize. Genes 2023, 14, 1305. https://doi.org/10.3390/genes14061305
Jiang F, Liu L, Li Z, Bi Y, Yin X, Guo R, Wang J, Zhang Y, Shaw RK, Fan X. Identification of Candidate QTLs and Genes for Ear Diameter by Multi-Parent Population in Maize. Genes. 2023; 14(6):1305. https://doi.org/10.3390/genes14061305
Chicago/Turabian StyleJiang, Fuyan, Li Liu, Ziwei Li, Yaqi Bi, Xingfu Yin, Ruijia Guo, Jing Wang, Yudong Zhang, Ranjan Kumar Shaw, and Xingming Fan. 2023. "Identification of Candidate QTLs and Genes for Ear Diameter by Multi-Parent Population in Maize" Genes 14, no. 6: 1305. https://doi.org/10.3390/genes14061305