
Short-Term Hypoxia in Cells Induces Expression of Genes Which Are Enhanced in Stressed Cells
 ,
,  , and
, and
Abstract
:
1. Introduction
2. Materials and Methods
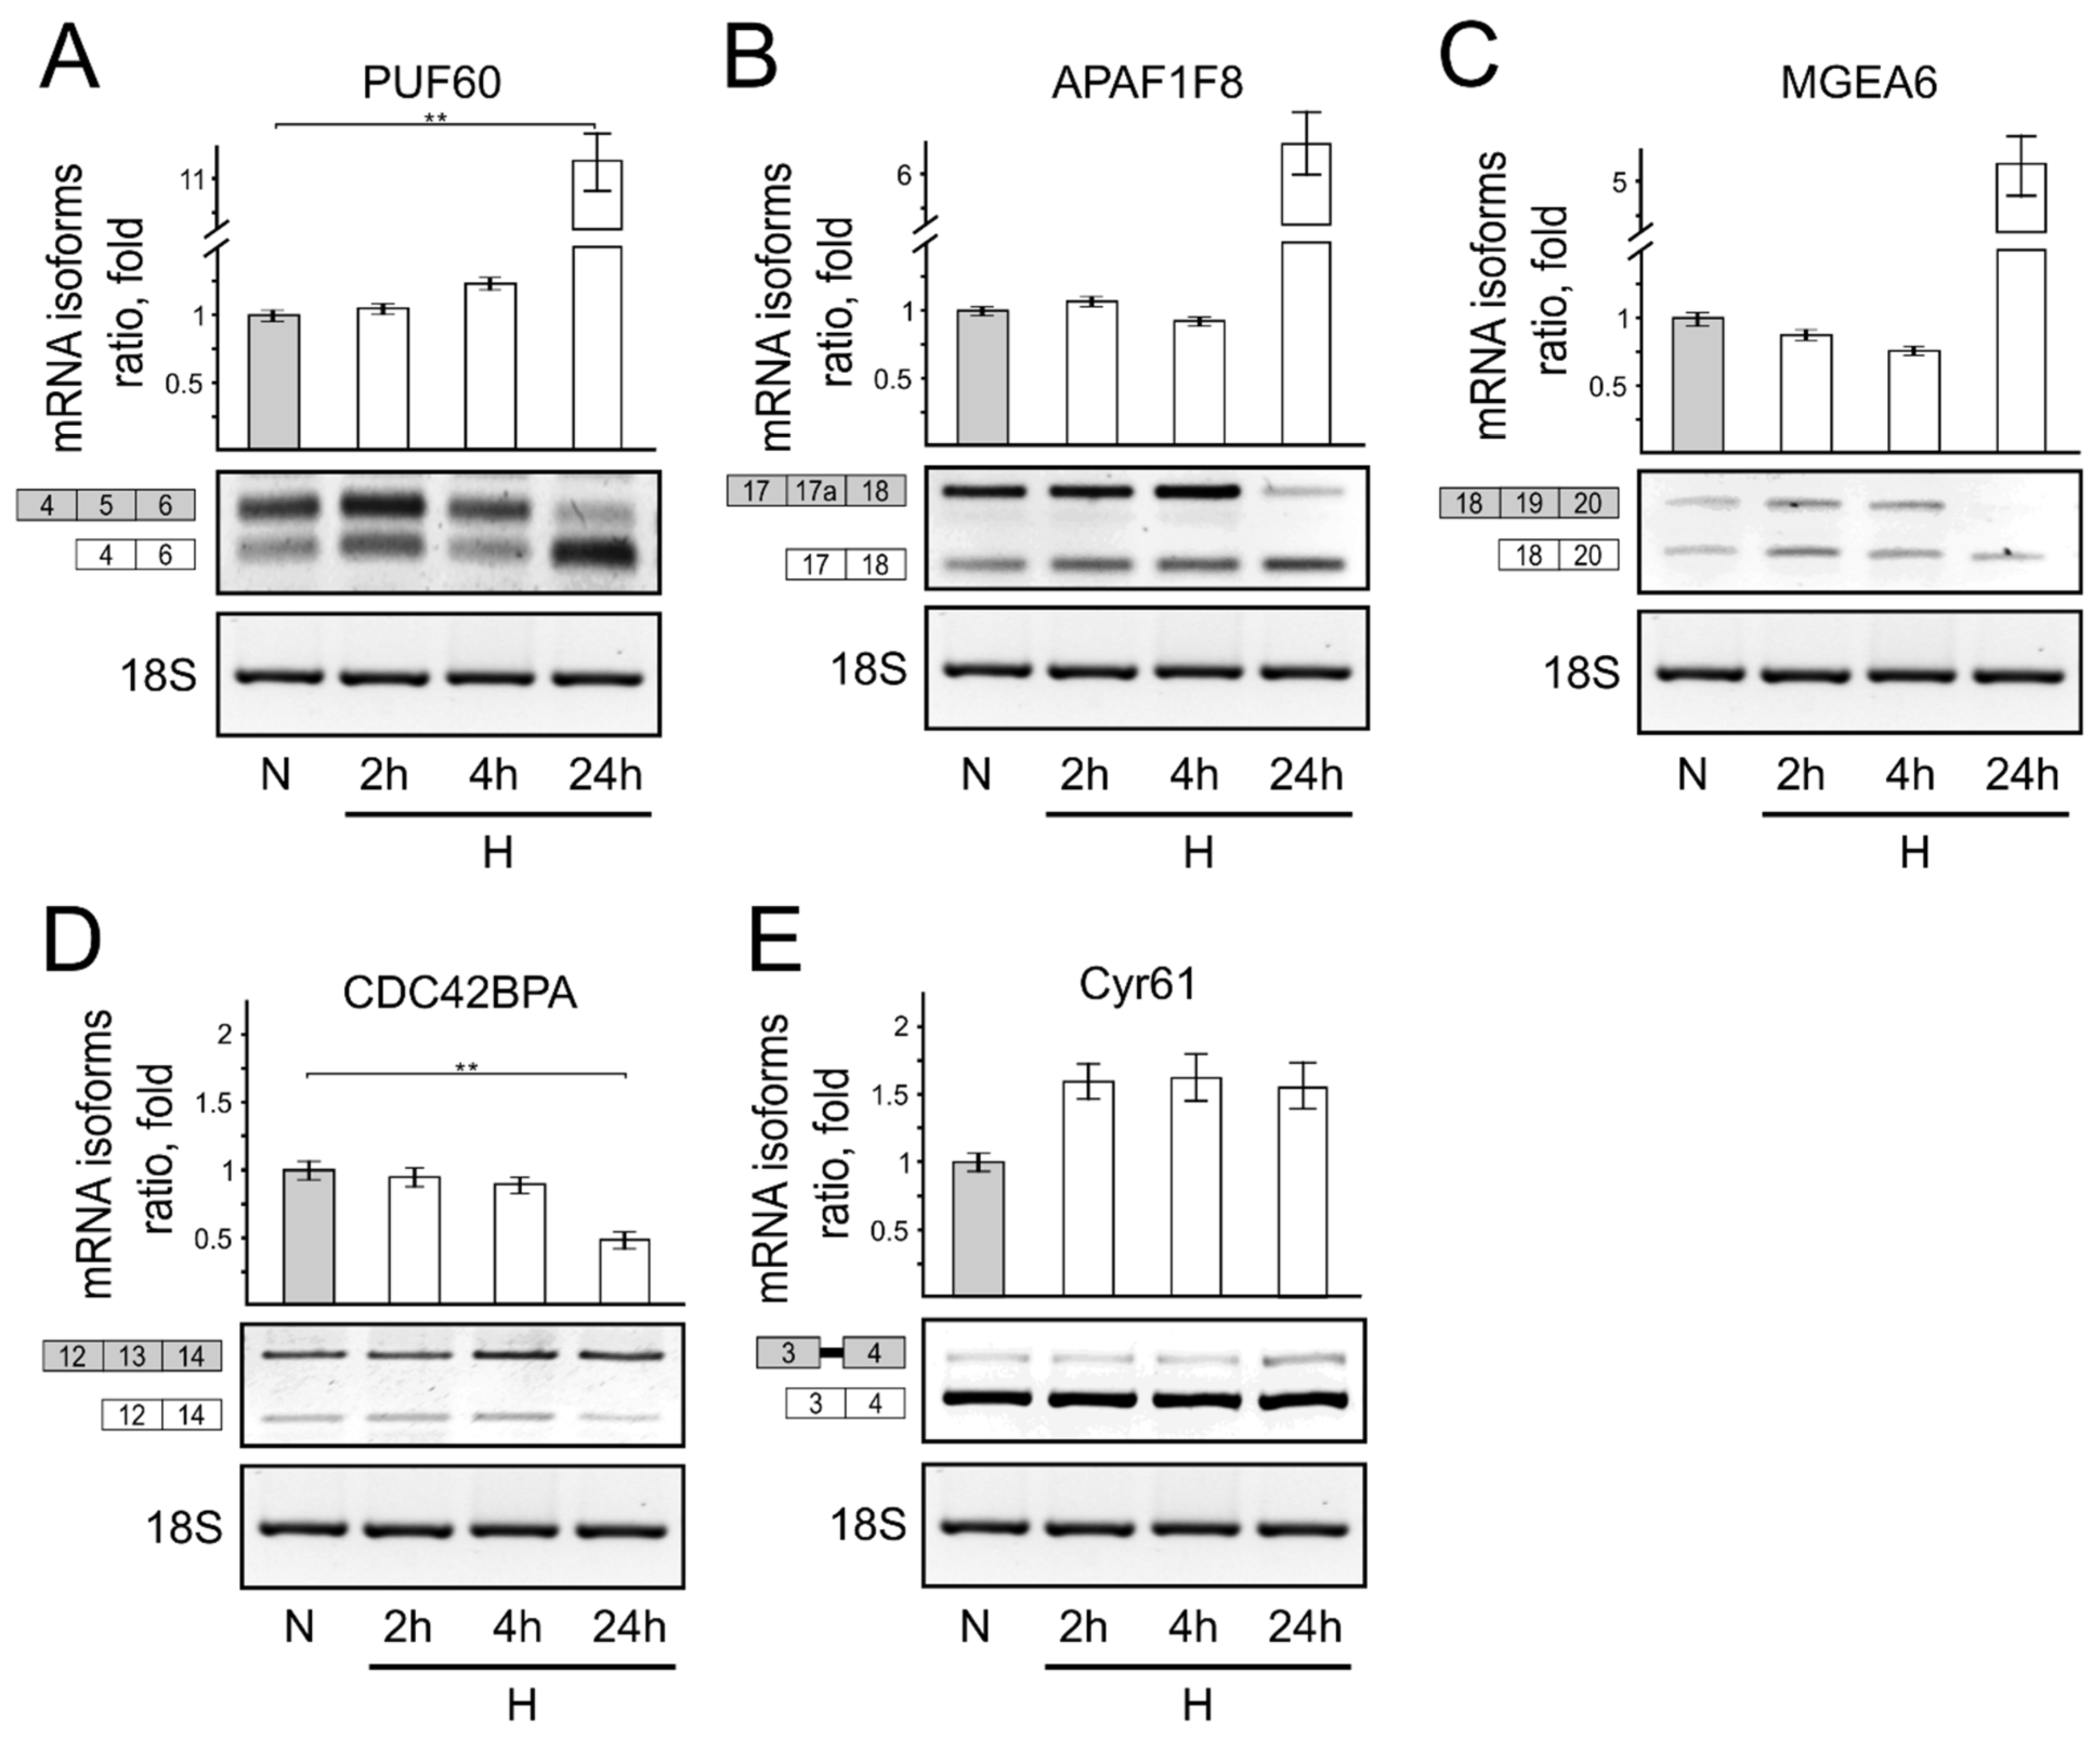
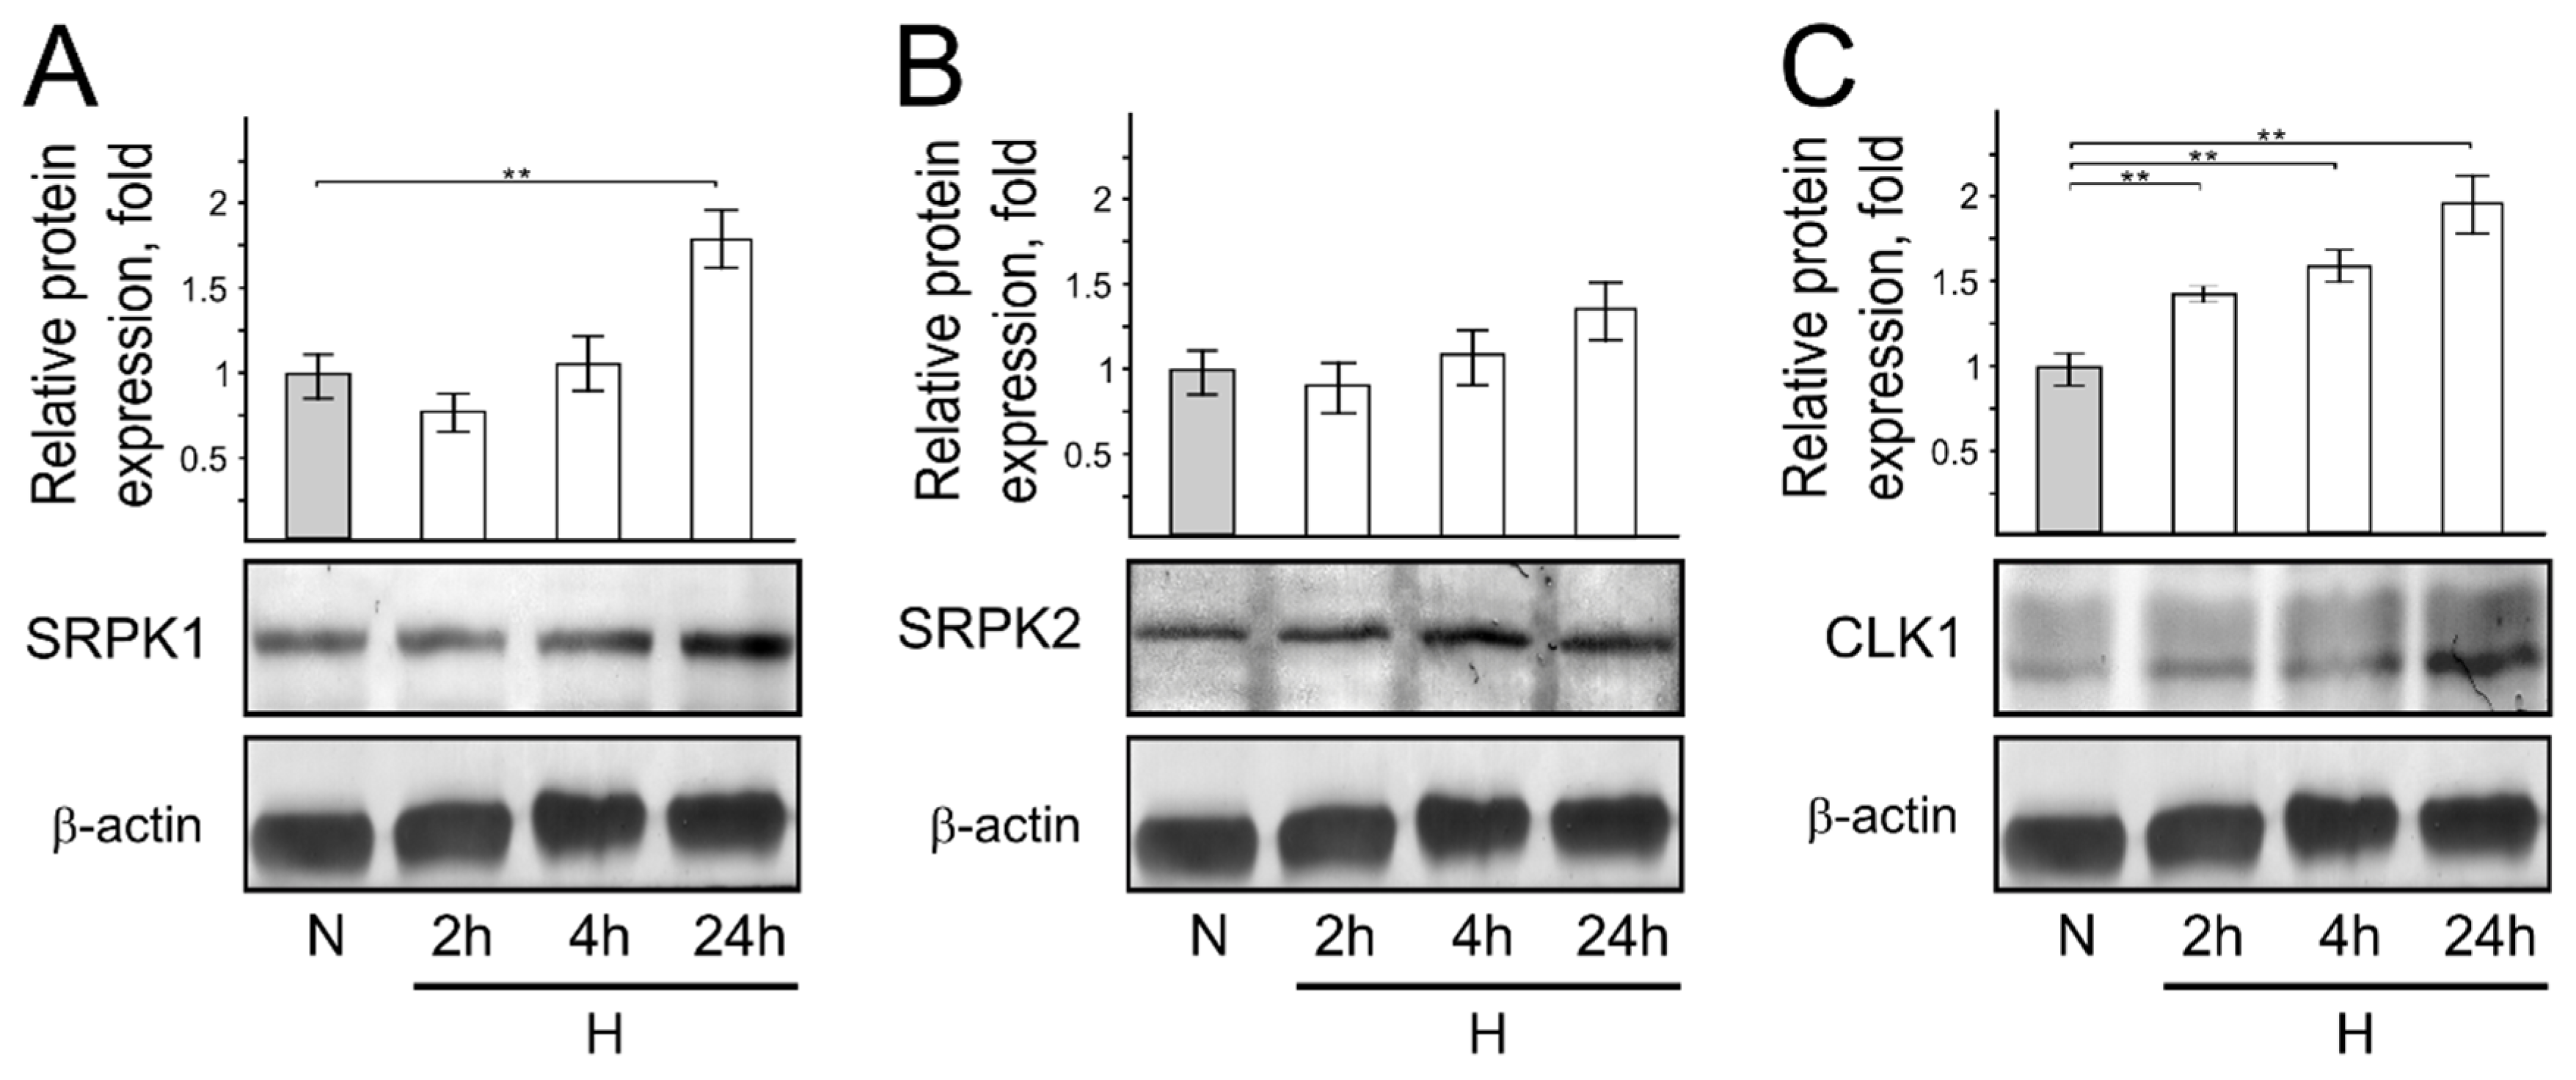
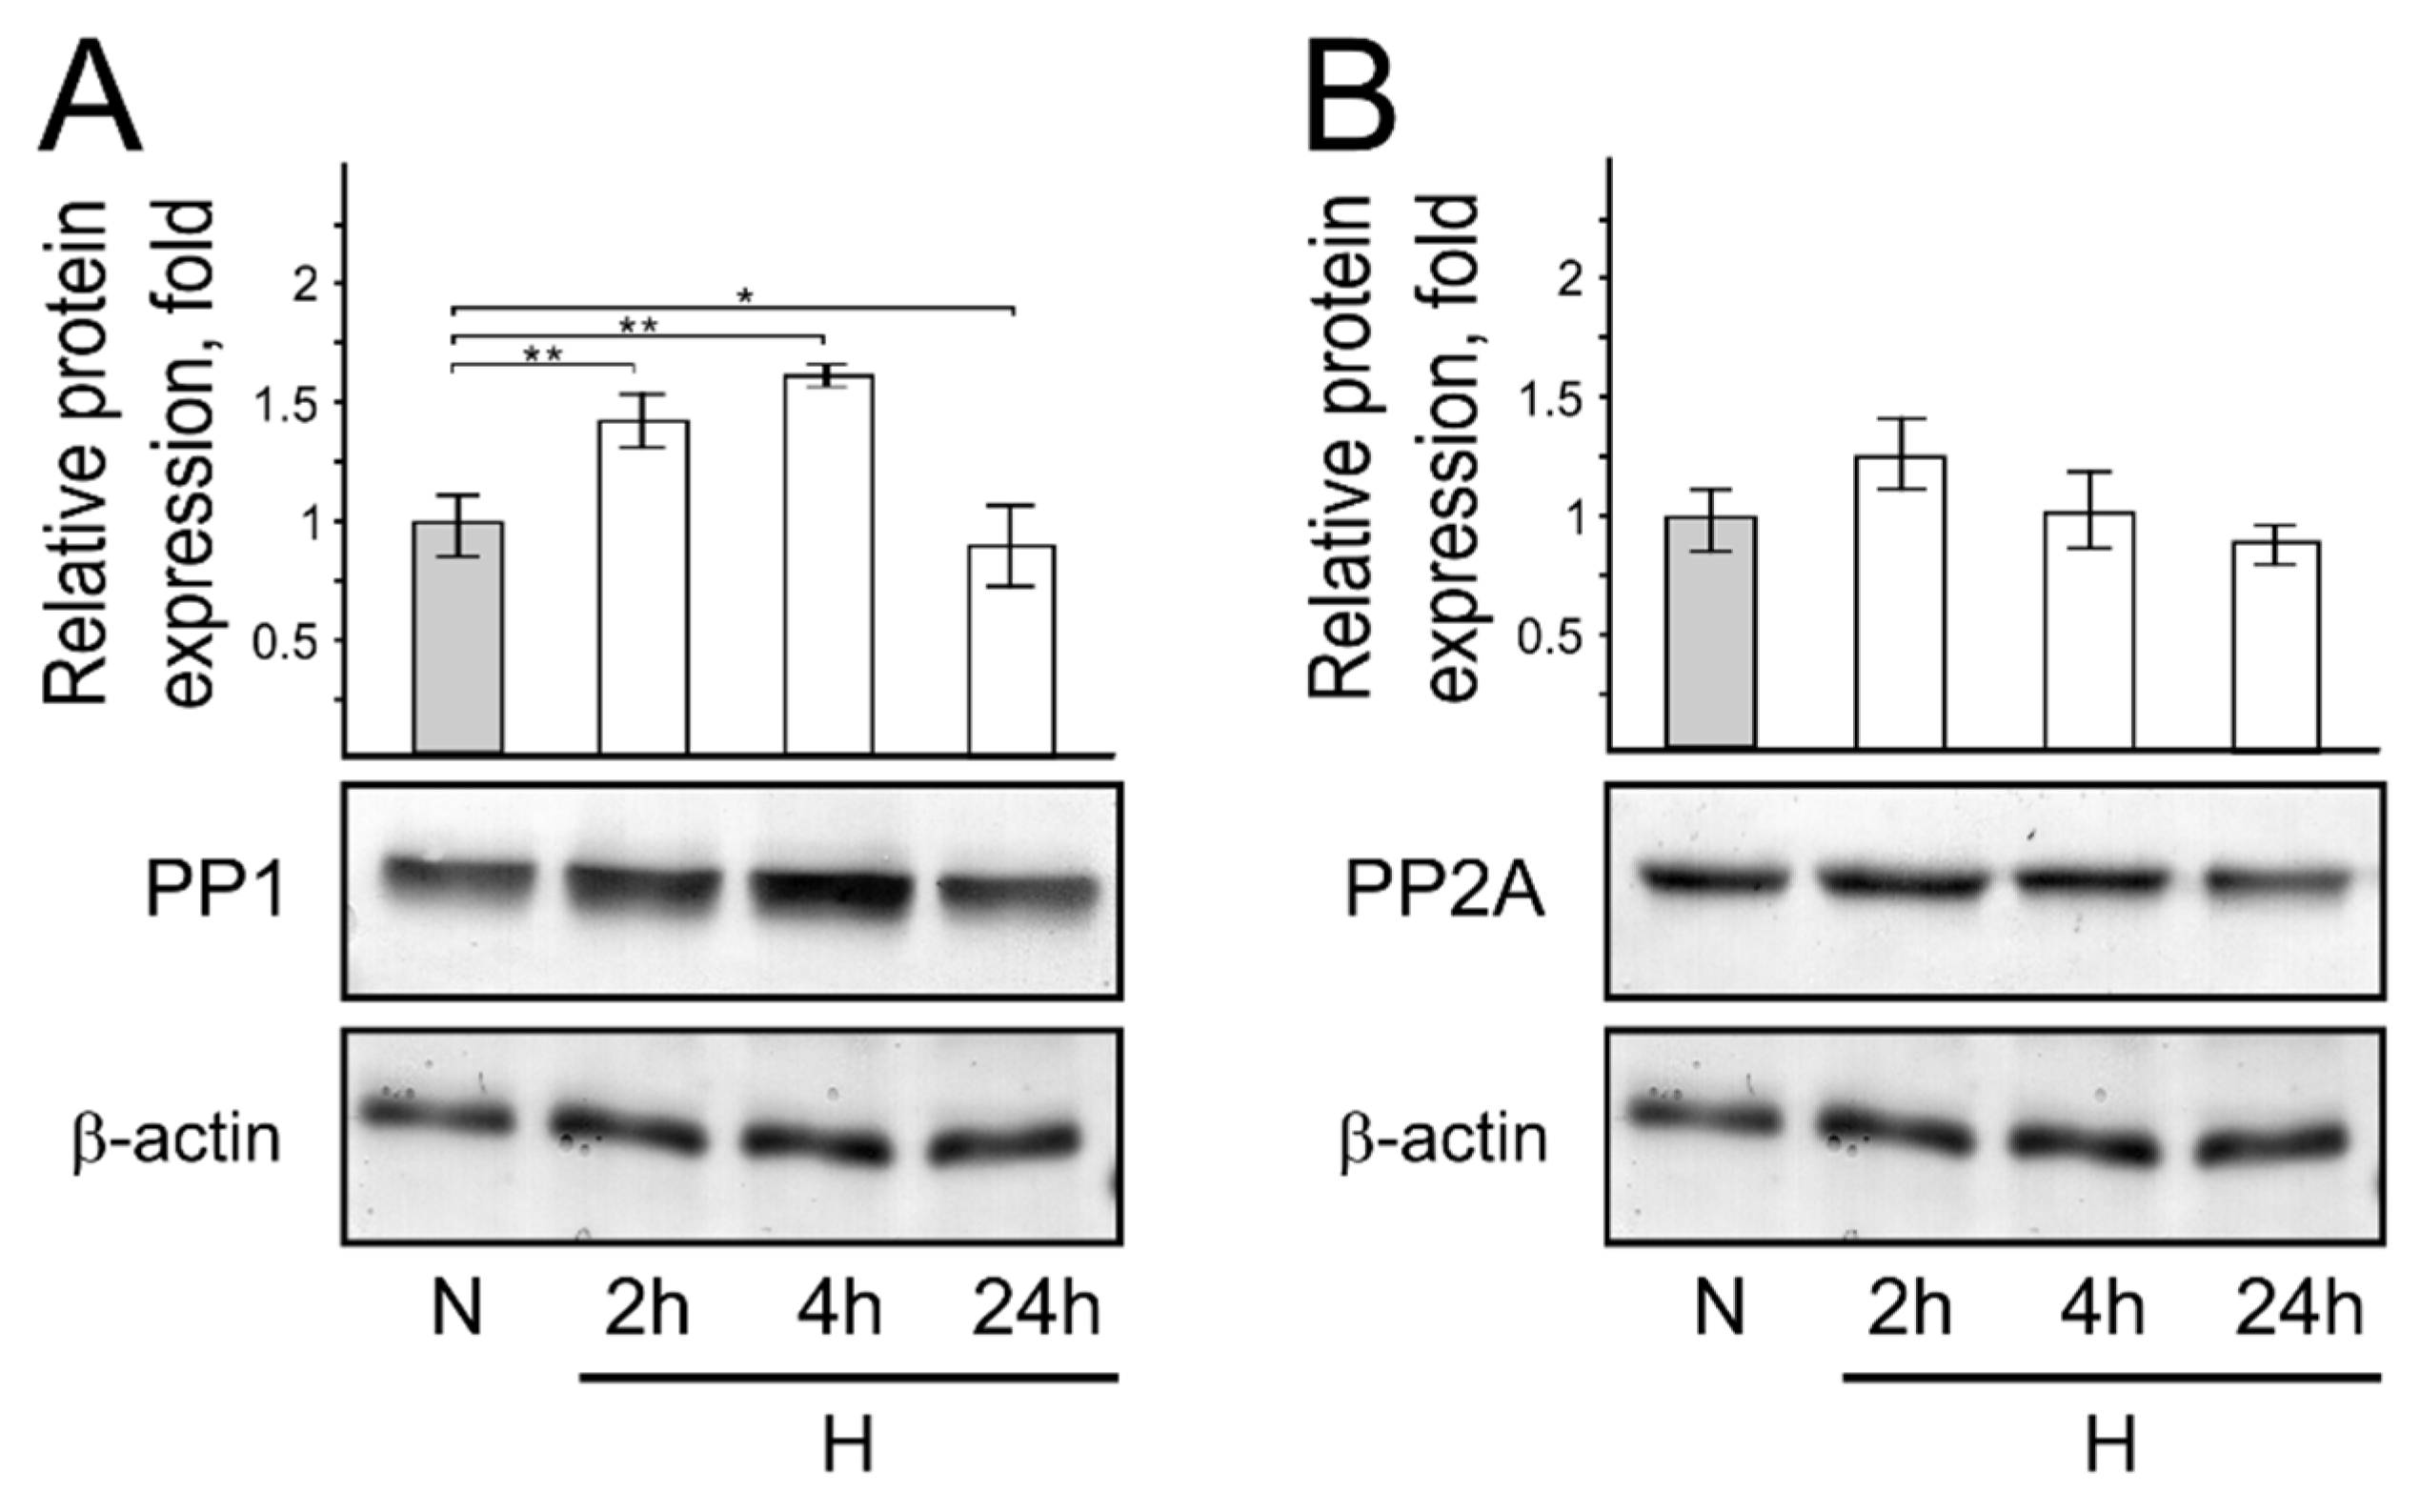
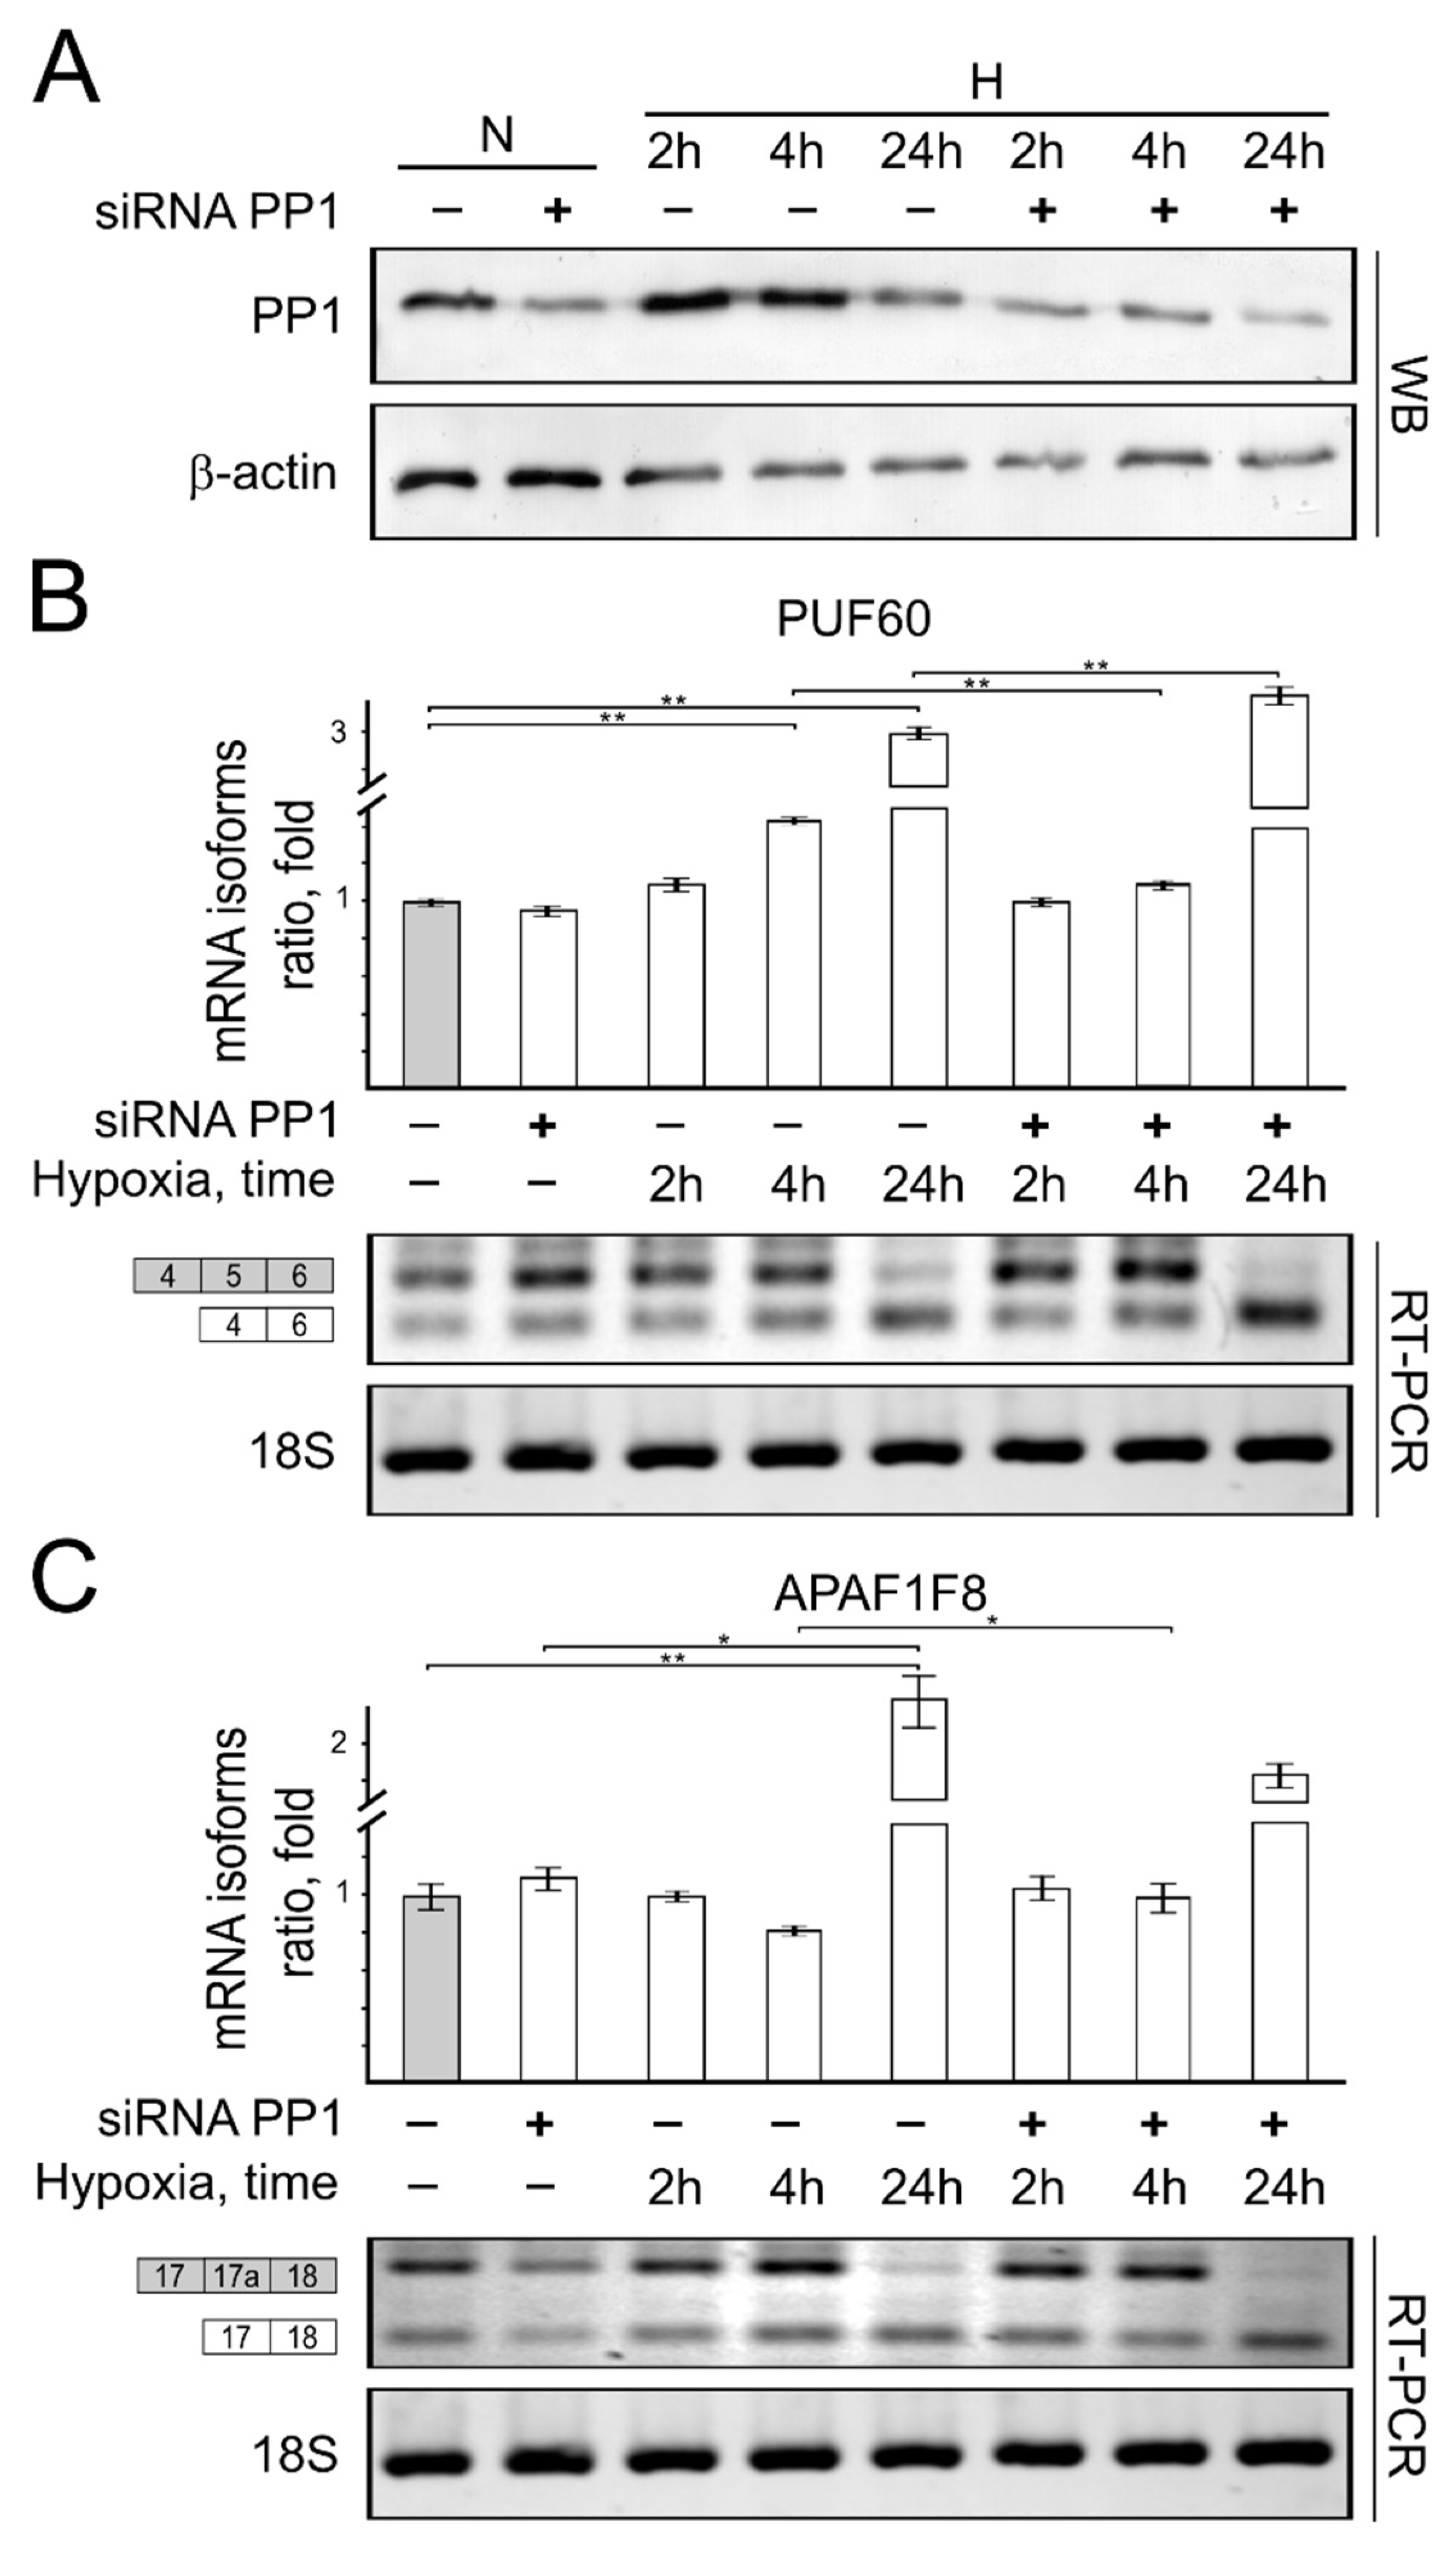
3. Results
4. Discussion
5. Limitations of the Study
Supplementary Materials
Author Contributions
Funding
Institutional Review Board Statement
Informed Consent Statement
Data Availability Statement
Conflicts of Interest
References
- Galluzzi, L.; Yamazaki, T.; Kroemer, G. Linking cellular stress responses to systemic homeostasis. Nat. Rev. Mol. Cell Biol. 2018, 19, 731–745. [Google Scholar] [CrossRef] [PubMed]
- Spriggs, K.A.; Bushell, M.; Willis, A.E. Translational regulation of gene expression during conditions of cell stress. Mol. Cell 2010, 40, 228–237. [Google Scholar] [CrossRef] [PubMed]
- Fulda, S.; Gorman, A.M.; Hori, O.; Samali, A. Cellular stress responses: Cell survival and cell death. Int. J. Cell Biol. 2010, 2010, 214074. [Google Scholar] [CrossRef] [PubMed]
- Filippi, I.; Saltarella, I.; Aldinucci, C.; Carraro, F.; Ria, R.; Vacca, A.; Naldini, A. Different Adaptive Responses to Hypoxia in Normal and Multiple Myeloma Endothelial Cells. Cell. Physiol. Biochem. 2018, 46, 203–212. [Google Scholar] [CrossRef] [PubMed]
- Natua, S.; Ashok, C.; Shukla, S. Hypoxia-induced alternative splicing in human diseases: The pledge, the turn, and the prestige. Cell. Mol. Life Sci. 2021, 78, 2729–2747. [Google Scholar] [CrossRef]
- Lammers, T.; Lavi, S. Role of type 2C protein phosphatases in growth regulation and in cellular stress signaling. Crit. Rev. Biochem. Mol. Biol. 2007, 42, 437–461. [Google Scholar] [CrossRef]
- Memon, D.; Dawson, K.; Smowton, C.S.; Xing, W.; Dive, C.; Miller, C.J. Hypoxia-driven splicing into noncoding isoforms regulates the DNA damage response. NPJ Genom. Med. 2016, 1, 16020. [Google Scholar] [CrossRef]
- Kim, D.; Paggi, J.M.; Park, C.; Bennett, C.; Salzberg, S.L. Graph-based genome alignment and genotyping with HISAT2 and HISAT-genotype. Nat. Biotechnol. 2019, 37, 907–915. [Google Scholar] [CrossRef]
- Li, H.; Handsaker, B.; Wysoker, A.; Fennell, T.; Ruan, J.; Homer, N.; Marth, G.; Abecasis, G.; Durbin, R.; Genome Project Data Processing, S. The Sequence Alignment/Map format and SAMtools. Bioinformatics 2009, 25, 2078–2079. [Google Scholar] [CrossRef]
- Robinson, M.D.; McCarthy, D.J.; Smyth, G.K. edgeR: A Bioconductor package for differential expression analysis of digital gene expression data. Bioinformatics 2010, 26, 139–140. [Google Scholar] [CrossRef] [Green Version]
- Gu, Z.; Eils, R.; Schlesner, M. Complex heatmaps reveal patterns and correlations in multidimensional genomic data. Bioinformatics 2016, 32, 2847–2849. [Google Scholar] [CrossRef] [PubMed]
- Kuleshov, M.V.; Jones, M.R.; Rouillard, A.D.; Fernandez, N.F.; Duan, Q.; Wang, Z.; Koplev, S.; Jenkins, S.L.; Jagodnik, K.M.; Lachmann, A.; et al. Enrichr: A comprehensive gene set enrichment analysis web server 2016 update. Nucleic Acids Res. 2016, 44, W90–W97. [Google Scholar] [CrossRef] [PubMed]
- Zahler, A.M.; Lane, W.S.; Stolk, J.A.; Roth, M.B. SR proteins: A conserved family of pre-mRNA splicing factors. Genes Dev. 1992, 6, 837–847. [Google Scholar] [CrossRef] [PubMed]
- Peciuliene, I.; Vilys, L.; Jakubauskiene, E.; Zaliauskiene, L.; Kanopka, A. Hypoxia alters splicing of the cancer associated Fas gene. Exp. Cell Res. 2019, 380, 29–35. [Google Scholar] [CrossRef] [PubMed]
- Lee, S.; Bui Nguyen, T.M.; Kovalenko, D.; Adhikari, N.; Grindle, S.; Polster, S.P.; Friesel, R.; Ramakrishnan, S.; Hall, J.L. Sprouty1 inhibits angiogenesis in association with up-regulation of p21 and p27. Mol. Cell. Biochem. 2010, 338, 255–261. [Google Scholar] [CrossRef]
- Radons, J. The human HSP70 family of chaperones: Where do we stand? Cell Stress Chaperones 2016, 21, 379–404. [Google Scholar] [CrossRef]
- Szego, E.M.; Dominguez-Meijide, A.; Gerhardt, E.; Konig, A.; Koss, D.J.; Li, W.; Pinho, R.; Fahlbusch, C.; Johnson, M.; Santos, P.; et al. Cytosolic Trapping of a Mitochondrial Heat Shock Protein Is an Early Pathological Event in Synucleinopathies. Cell Rep. 2019, 28, 65–77.e6. [Google Scholar] [CrossRef]
- Tomita, M.; Holman, B.J.; Santoro, C.P.; Santoro, T.J. Astrocyte production of the chemokine macrophage inflammatory protein-2 is inhibited by the spice principle curcumin at the level of gene transcription. J. Neuroinflamm. 2005, 2, 8. [Google Scholar] [CrossRef] [PubMed]
- Xu, L.; Guo, Z.N.; Yang, Y.; Xu, J.; Burchell, S.R.; Tang, J.; Zhang, J.; Xu, J.; Zhang, J.H. Angiopoietin-like 4: A double-edged sword in atherosclerosis and ischemic stroke? Exp. Neurol. 2015, 272, 61–66. [Google Scholar] [CrossRef]
- Babincak, M.; Jendzelovsky, R.; Kosuth, J.; Majernik, M.; Vargova, J.; Mikulasek, K.; Zdrahal, Z.; Fedorocko, P. Death Receptor 5 (TNFRSF10B) Is Upregulated and TRAIL Resistance Is Reversed in Hypoxia and Normoxia in Colorectal Cancer Cell Lines after Treatment with Skyrin, the Active Metabolite of Hypericum spp. Cancers 2021, 13, 1646. [Google Scholar] [CrossRef]
- De Zio, D.; Bordi, M.; Tino, E.; Lanzuolo, C.; Ferraro, E.; Mora, E.; Ciccosanti, F.; Fimia, G.M.; Orlando, V.; Cecconi, F. The DNA repair complex Ku70/86 modulates Apaf1 expression upon DNA damage. Cell Death Differ. 2011, 18, 516–527. [Google Scholar] [CrossRef] [PubMed]
- Kano, M.; Matsushita, K.; Rahmutulla, B.; Yamada, S.; Shimada, H.; Kubo, S.; Hiwasa, T.; Matsubara, H.; Nomura, F. Adenovirus-mediated FIR demonstrated TP53-independent cell-killing effect and enhanced antitumor activity of carbon-ion beams. Gene Ther. 2016, 23, 50–56. [Google Scholar] [CrossRef] [PubMed]
- Li, T.L.; Su, L.; Lei, Y.J.; Liu, X.F.; Zhang, Y.J.; Liu, X.G. DDIT3 and KAT2A Proteins Regulate TNFRSF10A and TNFRSF10B Expression in Endoplasmic Reticulum Stress-mediated Apoptosis in Human Lung Cancer Cells. J. Biol. Chem. 2015, 290, 11108–11118. [Google Scholar] [CrossRef] [PubMed]
- Matsushita, K.; Tamura, M.; Tanaka, N.; Tomonaga, T.; Matsubara, H.; Shimada, H.; Levens, D.; He, L.S.; Liu, J.H.; Yoshida, M.; et al. Interactions between SAP155 and FUSE-Binding Protein-Interacting Repressor Bridges c-Myc and P27Kip1 Expression. Mol. Cancer Res. 2013, 11, 689–698. [Google Scholar] [CrossRef] [PubMed]
- Yang, R.; Chen, Y.; Chen, D.Z. Biological functions and role of CCN1/Cyr61 in embryogenesis and tumorigenesis in the female reproductive system. Mol. Med. Rep. 2018, 17, 3–10. [Google Scholar] [CrossRef]
- Tamura, I.; Rosenbloom, J.; Macarak, E.; Chaqour, B. Regulation of Cyr61 gene expression by mechanical stretch through multiple signaling pathways. Am. J. Physiol. Cell Physiol. 2001, 281, C1524–C1532. [Google Scholar] [CrossRef]
- Leung, T.; Chen, X.Q.; Tan, I.; Manser, E.; Lim, L. Myotonic dystrophy kinase-related Cdc42-binding kinase acts as a Cdc42 effector in promoting cytoskeletal reorganization. Mol. Cell. Biol. 1998, 18, 130–140. [Google Scholar] [CrossRef]
- Bottger, A.; Islam, M.S.; Chowdhury, R.; Schofield, C.J.; Wolf, A. The oxygenase Jmjd6-a case study in conflicting assignments. Biochem. J. 2015, 468, 191–202. [Google Scholar] [CrossRef]
- Xi, Y.G.; Shalgi, R.; Fodstad, O.; Pilpel, Y.; Ju, J.F. Differentially regulated micro-RNAs and actively translated messenger RNA transcripts by tumor suppressor p53 in colon cancer. Clin. Cancer Res. 2006, 12, 2014–2024. [Google Scholar] [CrossRef]
- Bowler, E.; Porazinski, S.; Uzor, S.; Thibault, P.; Durand, M.; Lapointe, E.; Rouschop, K.M.A.; Hancock, J.; Wilson, I.; Ladomery, M. Hypoxia leads to significant changes in alternative splicing and elevated expression of CLK splice factor kinases in PC3 prostate cancer cells. BMC Cancer 2018, 18, 355. [Google Scholar] [CrossRef]
- Jakubauskiene, E.; Vilys, L.; Makino, Y.; Poellinger, L.; Kanopka, A. Increased Serine-Arginine (SR) Protein Phosphorylation Changes Pre-mRNA Splicing in Hypoxia. J. Biol. Chem. 2015, 290, 18079–18089. [Google Scholar] [CrossRef] [PubMed]
- Jakubauskiene, E.; Vilys, L.; Peciuliene, I.; Kanopka, A. The role of hypoxia on Alzheimer’s disease-related APP and Tau mRNA formation. Gene 2021, 766, 145146. [Google Scholar] [CrossRef] [PubMed]
- Hollenstein, D.M.; Gerecova, G.; Romanov, N.; Ferrari, J.; Veis, J.; Janschitz, M.; Beyer, R.; Schuller, C.; Ogris, E.; Hartl, M.; et al. A phosphatase-centric mechanism drives stress signaling response. EMBO Rep. 2021, 22, e52476. [Google Scholar] [CrossRef] [PubMed]
- Aubol, B.E.; Serrano, P.; Fattet, L.; Wuthrich, K.; Adams, J.A. Molecular interactions connecting the function of the serine-arginine-rich protein SRSF1 to protein phosphatase 1. J. Biol. Chem. 2018, 293, 16751–16760. [Google Scholar] [CrossRef] [PubMed]
- Ramos, F.; Villoria, M.T.; Alonso-Rodriguez, E.; Clemente-Blanco, A. Role of protein phosphatases PP1, PP2A, PP4 and Cdc14 in the DNA damage response. Cell Stress 2019, 3, 70–85. [Google Scholar] [CrossRef]
- Murray, J.I.; Whitfield, M.L.; Trinklein, N.D.; Myers, R.M.; Brown, P.O.; Botstein, D. Diverse and specific gene expression responses to stresses in cultured human cells. Mol. Biol. Cell 2004, 15, 2361–2374. [Google Scholar] [CrossRef]
- Huang, C.X.; Lv, B.; Wang, Y. Protein Phosphatase 2A Mediates Oxidative Stress Induced Apoptosis in Osteoblasts. Mediat. Inflamm. 2015, 2015, 804260. [Google Scholar] [CrossRef]
- Cicchillitti, L.; Fasanaro, P.; Biglioli, P.; Capogrossi, M.C.; Martelli, F. Oxidative stress induces protein phosphatase 2A-dependent dephosphorylation of the pocket proteins pRb, p107, and p130. J. Biol. Chem. 2003, 278, 19509–19517. [Google Scholar] [CrossRef] [Green Version]


| Primer Name | Primer Sequence | Product Length |
|---|---|---|
| 18S | Fw AACTCACTGAAGATGAGGTG Rev CAGACAAGGCCTACAGACTT | 305 bp |
| actin | Fw GACAGGATGCAGAAGGAGAT Rev TTGCTGATCCACATCTGCTG | 146 bp |
| ANGPL4 | Fw GATGGCTCAGTGGACTTCAACC Rev TGCTATGCACCTTCTCCAGACC | 100 bp |
| SRPY1 | Fw GAAAGAGGACCTGACACAGCAC Rev CTCTCAGCAGAGCAAAGGCACT | 162 bp |
| ZNF547 | Fw AGGCTCAGAGATTGCTGTACCG Rev CACTCCTACAGAAACACCTGGC | 125 bp |
| Hsp70 | Fw ACCTTCGACGTGTCCATCCTGA Rev TCCTCCACGAAGTGGTTCACCA | 122 bp |
| Hsp10 | Fw CTCCCAGAATATGGAGGCACC Rev TGGAATGGGCAGCATCATGT | 139 bp |
| FAS | Fw GTGAACACTGTGACCCTTGC Rev CCTTGGTTTTCCTTTCTGTGC | 205 bp 142 bp |
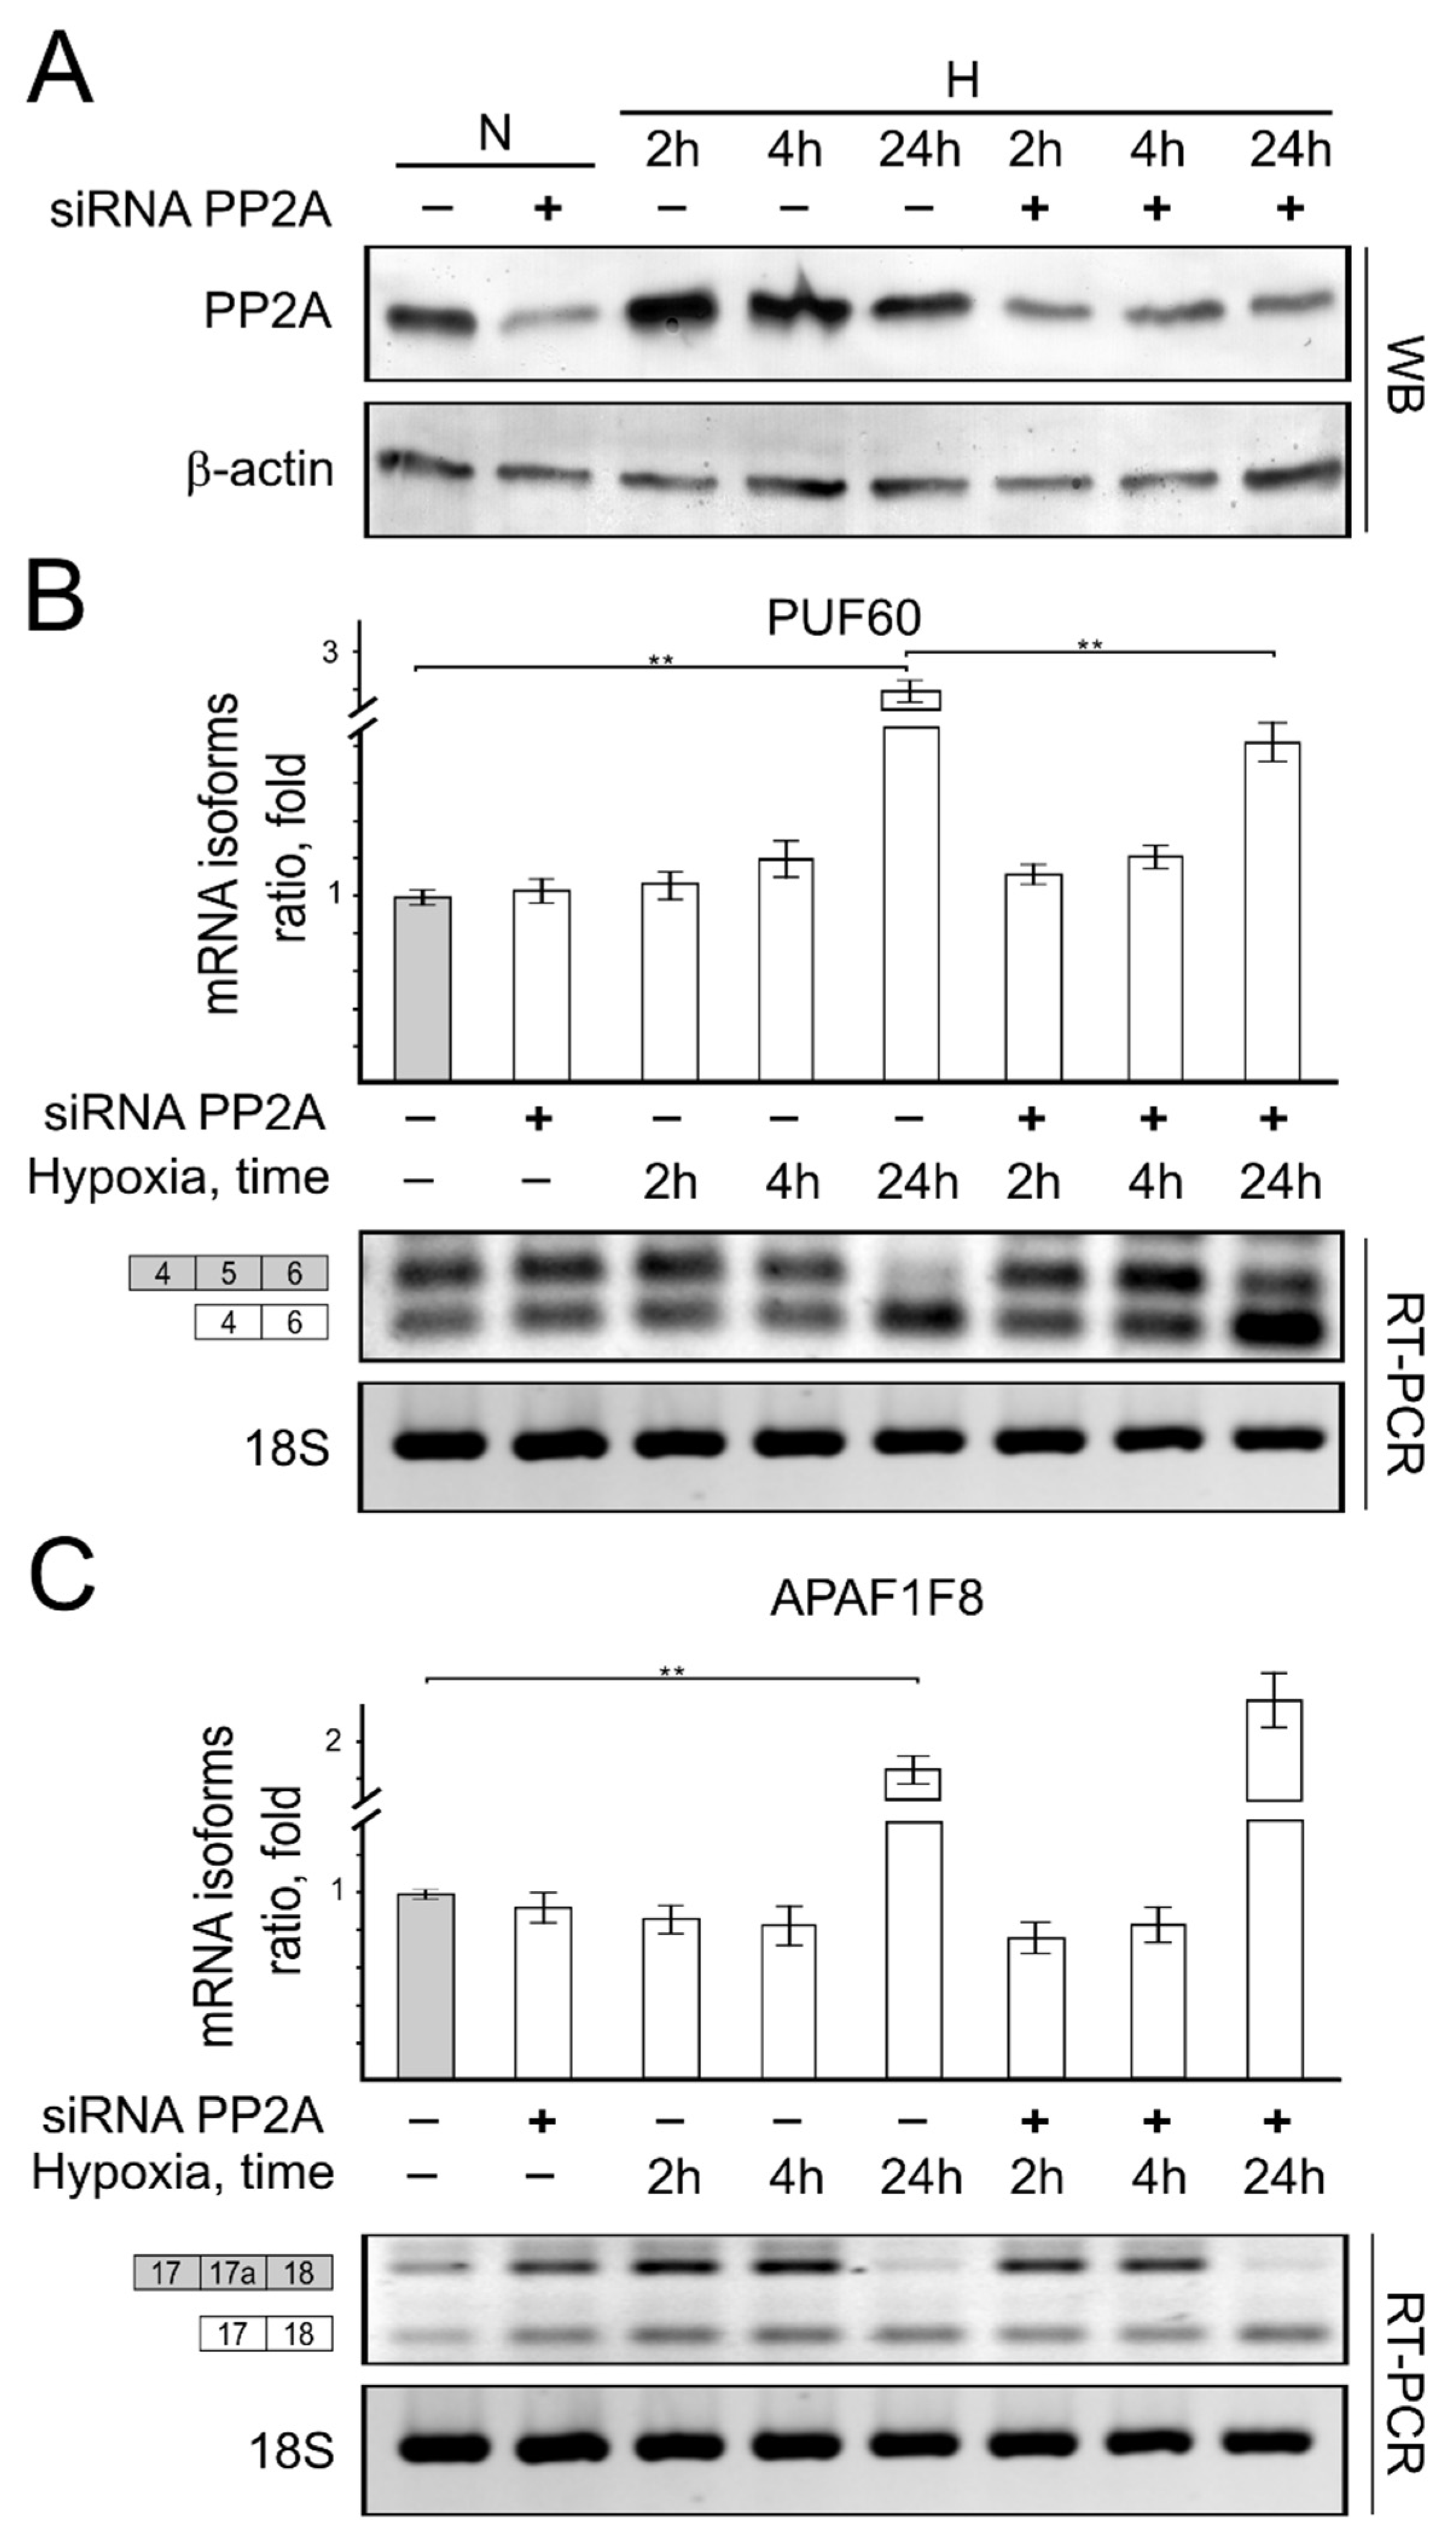
| PUF60 | Fw GCCAAGAAGTACGCCATGG Rev GTAGACGCGGCACATGATG | 189 bp 138 bp |
| APAF1F8 | Fw GTGAAGTGTTGTTCGTGGTCTG Rev CATCACACCATGAACCCAAC | 322 bp 193 bp |
| Cyr61 | Fw GGCAGACCCTGTGAATATAA Rev CAGGGTTGTCATTGGTAACT | 612 bp 481 bp |
| MGEA | Fw CTGAAACAGAGCTTAAATTTGAAC Rev CTGGCGGAGGAAACATCATCC | 366 bp 237 bp |
| CDC42BPA | Fw GCTAATGCTGTGAGGCAAGAAC Rev GCTCACTCTGTTCACGTAGCTT | 415 bp 172 bp |
| Antibody Name | Manufacturer, Cat. Number | Dilution Used |
|---|---|---|
| anti-HIF-1α, mouse mAb | BD transduction laboratories, 610959 | 1:500 |
| anti-SRPK1, rabbit mAb | Abcam, ab131160 | 1:1000 |
| anti-SRPK2, rabbit pAb | Abcam, ab67993 | 1:1000 |
| anti-CLK1, rabbit pAb | Abcam, ab74044 | 1:300 |
| anti-PP1, rabbit mAb | Abcam, ab134947 | 1:1000 |
| anti-PP2A, rabbit mAb | Abcam, ab32104 | 1:1000 |
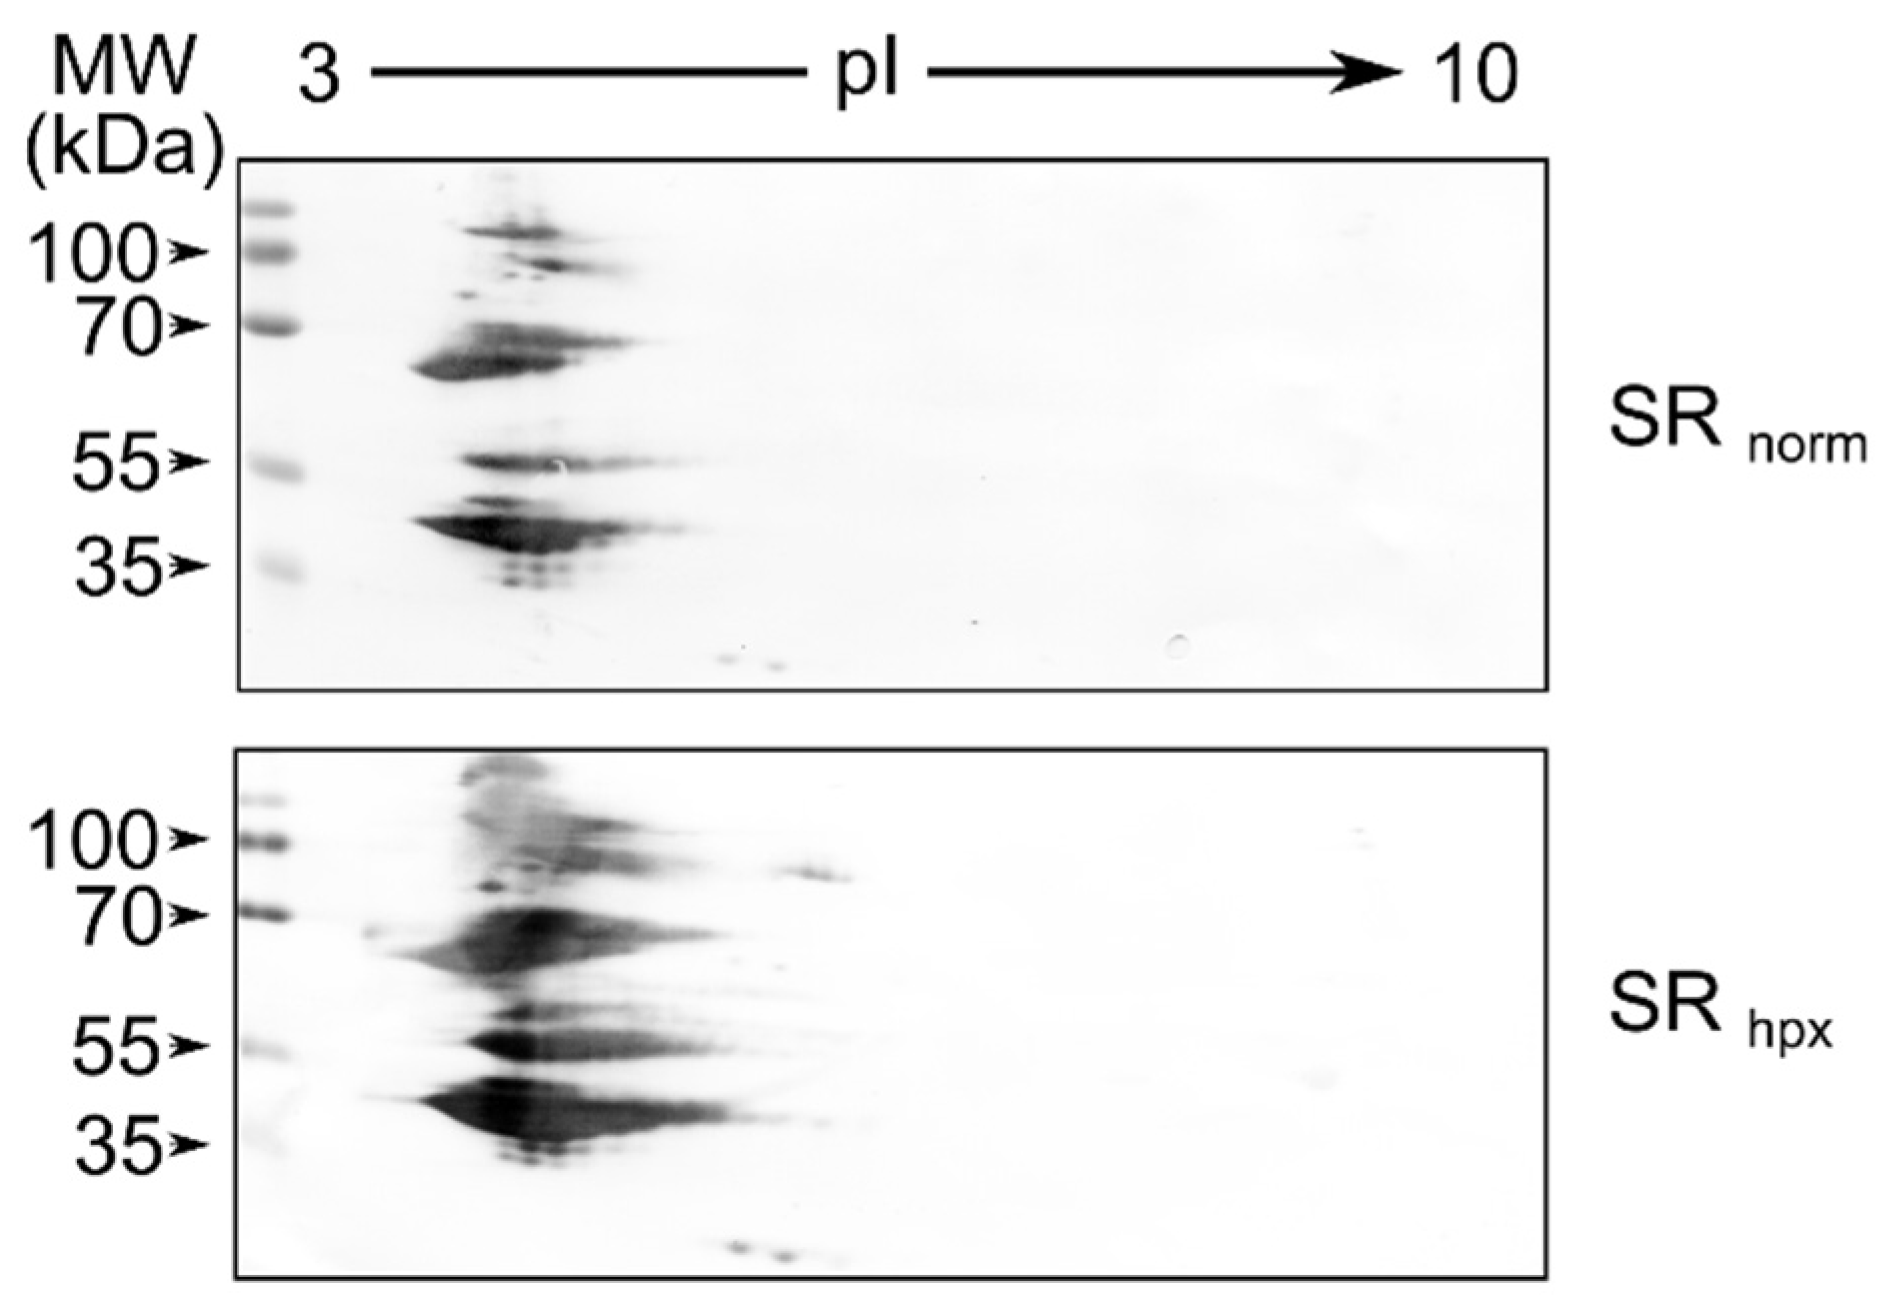
| anti-SR, mouse mAb | Lifespan Biosciences, LS-C75961 | 1:1000 |
| anti-β actin, mouse mAb | Abcam, ab3280 | 1:5000 |
| Goat anti-mouse, HPR conjugated | Dako, P 044701 | 1:2000 |
| Goat anti-rabbit, HPR conjugated | Dako, P 0448801 | 1:2000 |
Publisher’s Note: MDPI stays neutral with regard to jurisdictional claims in published maps and institutional affiliations. |
© 2022 by the authors. Licensee MDPI, Basel, Switzerland. This article is an open access article distributed under the terms and conditions of the Creative Commons Attribution (CC BY) license (https://creativecommons.org/licenses/by/4.0/).
Share and Cite
Peciuliene, I.; Jakubauskiene, E.; Vilys, L.; Zinkeviciute, R.; Kvedaraviciute, K.; Kanopka, A. Short-Term Hypoxia in Cells Induces Expression of Genes Which Are Enhanced in Stressed Cells. Genes 2022, 13, 1596. https://doi.org/10.3390/genes13091596
Peciuliene I, Jakubauskiene E, Vilys L, Zinkeviciute R, Kvedaraviciute K, Kanopka A. Short-Term Hypoxia in Cells Induces Expression of Genes Which Are Enhanced in Stressed Cells. Genes. 2022; 13(9):1596. https://doi.org/10.3390/genes13091596
Chicago/Turabian StylePeciuliene, Inga, Egle Jakubauskiene, Laurynas Vilys, Ruta Zinkeviciute, Kotryna Kvedaraviciute, and Arvydas Kanopka. 2022. "Short-Term Hypoxia in Cells Induces Expression of Genes Which Are Enhanced in Stressed Cells" Genes 13, no. 9: 1596. https://doi.org/10.3390/genes13091596