Article

Transcriptome Analyses of Prophage in Mediating Persistent Methicillin-Resistant Staphylococcus aureus Endovascular Infection

1
The Lundquist Institute for Biomedical Innovation at Harbor-UCLA Medical Center, Torrance, CA 90502, USA
2
Hackensack Meridian Health Center for Discovery and Innovation, Nutley, NJ 07110, USA
3
Hackensack Meridian School of Medicine, Nutley, NJ 07110, USA
4
David Geffen School of Medicine at UCLA, Los Angeles, CA 90095, USA
*
Author to whom correspondence should be addressed.
Genes 2022, 13(9), 1527; https://doi.org/10.3390/genes13091527
Submission received: 30 July 2022 / Revised: 23 August 2022 / Accepted: 23 August 2022 / Published: 25 August 2022
(This article belongs to the Special Issue Genetics and Genomics of Antimicrobial Resistance)

Abstract

:
Persistent methicillin-resistant Staphylococcus aureus (MRSA) endovascular infections represent a significant subset of S. aureus infections and correlate with exceptionally high mortality. We have recently demonstrated that the lysogenization of prophage ϕSA169 from a clinical persistent MRSA bacteremia isolate (300-169) into a clinical resolving bacteremia MRSA isolate (301-188) resulted in the acquisition of well-defined in vitro and in vivo phenotypic and genotypic profiles related to persistent outcome. However, the underlying mechanism(s) of this impact is unknown. In the current study, we explored the genetic mechanism that may contribute to the ϕSA169-correlated persistence using RNA sequencing. Transcriptomic analyses revealed that the most significant impacts of ϕSA169 were: (i) the enhancement of fatty acid biosynthesis and purine and pyrimidine metabolic pathways; (ii) the repression of galactose metabolism and phosphotransferase system (PTS); and (iii) the down-regulation of the mutual prophage genes in both 300-169 and 301-188 strains. In addition, the influence of different genetic backgrounds between 300-169 and 301-188 might also be involved in the persistent outcome. These findings may provide targets for future studies on the persistence of MRSA.

1. Introduction

Methicillin-resistant S. aureus (MRSA) is a major cause of life-threatening endovascular infections, including bacteremia and infective endocarditis (IE) [1,2]. Persistent MRSA bacteremia (PB; defined as ≥5 days of positive blood cultures in the presence of antibiotic therapy) represents ~15 to 30% of such infections [3,4]. In addition, it is very worrisome that most PB isolates appear to be susceptible in vitro to gold-standard anti-MRSA antibiotics (e.g., vancomycin (VAN) and daptomycin (DAP)) by the Clinical and Laboratory Standards Institute (CLSI) breakpoints [4,5,6], yet persistent in vivo. Thus, PB represents a uniquely vital variant of traditional antibiotic resistance mechanisms. This problem underscores an urgent need to understand the mechanism(s) of specific factors driving this syndrome.
Prophages can modify their bacterial host’s lifestyle, fitness, virulence, and pathogenesis in numerous ways [7,8,9,10]. We recently discovered a novel prophage ϕSA169 that exists in a clinical PB isolate (300-169), while is not present in a genetically matched (clonal complex 45 (CC45), agr I, and SCCmec IV) clinical resolving MRSA bacteremia strain (RB, defined as initial MRSA bacteremia resolved within 2–4 days of antibiotic treatment; 301-188) [4,11,12]. In addition, whole-genome sequencing (WGS) analyses demonstrated that besides the ϕSA169, both PB 300-169 and RB 301-188 strains carry an identical mutual prophage [12]. Importantly, the lysogenization of RB 300-188 by ϕSA169 (301-188::ϕSA169) leads to this latter construct having “PB-like” phenotypes and genotypes similar to PB 300-169 strain both in vitro (e.g., higher growth rate, lower ATP levels, stronger biofilm formation and δ-hemolysin activity, earlier activation of global regulators, and higher expression of purine biosynthesis gene purF) and in an experimental IE model [11]. However, the fundamental mechanisms of the ϕSA169-driven PB outcomes remain unknown.
The current study aimed to define the impact of ϕSA169 on genetic factors which may contribute to the PB phenotypes by RNA sequencing (RNA-seq) using PB 300-169 wild type (WT), RB 301-188 WT, and ϕSA169 lysogenized RB 301-188 (301-188::ϕSA169) strains. The transcriptomic analyses emphasized genetic factors that might contribute to the PB outcomes and provided clues for future studies on molecular mechanisms of PB outcomes.

2. Materials and Methods

2.1. Bacterial Strains, Plasmids, and Growth Medium

Three MRSA strains, including PB 300-169 WT (300-169), RB 301-188 WT (301-188), and 301-188 WT ϕSA169 lysogenization (301-188::ϕSA169), were used in our previous [11] and current studies. The PB 300-169 strain was isolated from a patient with 16 days of persistent MRSA bacteremia, while the RB 301-188 strain was obtained from a patient with 2 days of MRSA bacteremia [4]. In addition, all the three study strains have a minimum inhibitory concentration (MIC) to VAN of 0.5 µg/mL and are susceptible to VAN in vitro based upon the CLSI breakpoints [11]. The strains were routinely grown at 37 °C in tryptic soy broth (TSB; Becton Dickinson and Company, NJ, USA) or on tryptic soy agar (TSA) plates if not otherwise specified.

2.2. RNA Isolation

RNA isolation was performed following the method described in previous studies [13,14]. In brief, overnight cultured cells of the study strains were pelleted by centrifugation and resuspended in Buffer RLT from RNeasy kit (Qiagen, Germantown, MD, USA), and then transferred into lysing matrix B (MP Biomedicals, Irvine, CA, USA) containing 0.1 mm silica spheres for mechanical lysis using Fastprep (Thermo Fisher, Waltham, MA, USA). Total RNA was isolated according to the manufacturer’s instructions of the RNeasy kit. DNA in the samples was removed using a TURBOTM DNase kit (Thermo Fisher, Waltham, MA, USA) [11]. Biological duplicates from two different experiments were prepared for each study strain. RNA samples with concentrations ≥ 100 ng/μL and 260/280 ratio between 1.9 and 2.0 were submitted to the Novogene Corporation Inc (Sacramento, CA, USA) for RNA-seq.

2.3. RNA-Seq and Data Analyses

RNA degradation, purity, integrity, and quantitation were checked prior to the RNA-seq. RNA-seq libraries were constructed using NEBNext®UltraTM RNA Library Prep Kit for Illumina® (NEB, Ipswich, WA, USA). The index-coded samples were clustered using the PE Cluster Kit cBot-HS (Illumina, San Diego, CA, USA) on a cBot Cluster Generation System. Then, the samples were sequenced, and paired-end reads were obtained. For data analyses, RNA-seq reads were mapped to the genome of the PB 300-169 strain (Accession: JASL00000000) [12] using Bowtie2 [15]. Analyses of differential expressions between any two study strains (two biological replicates per study strain) were performed using DESeq2 R package based on a negative binomial distribution. The resulting p values were adjusted using Benjamini and Hochberg’s approach for controlling the false discovery rate. The genes with an adjusted p value (p adj) ≤ 0.05 and |log2(fold change)| > 0 were defined as differentially expressed genes (DEGs), indicating the genes had significantly different expression levels in the two strains comparison. The DEGs list generated from the comparison of transcriptomic profiles between the isogenic strain set (301-188 and 301-188::ϕSA169) indicated the impact of ϕSA169. In addition, comparisons of 300-169 vs. 301-188 and 300-169 vs. 301-188::ϕSA169 were also performed to further investigate the role of the distinct genetic backgrounds on the transcriptional changes. The DEGs were classified using the Kyoto Encyclopedia of Genes and Genomes (KEGG) mapper tool with the ST45 mode strain of MRSA CA-347 [16].

2.4. Verification of RNA-Seq Results by qRT-PCR

The expression levels of selected genes from the DEGs listed above were confirmed by qRT-PCR as described previously [11,17,18]. The expression of gyrB was used as a well-studied host gene to normalize transcripts levels, and relative expression was calculated by the ΔΔCT method [5]. The relative expression level was then used to calculate the fold changes in the selected genes in strain comparisons.

3. Results

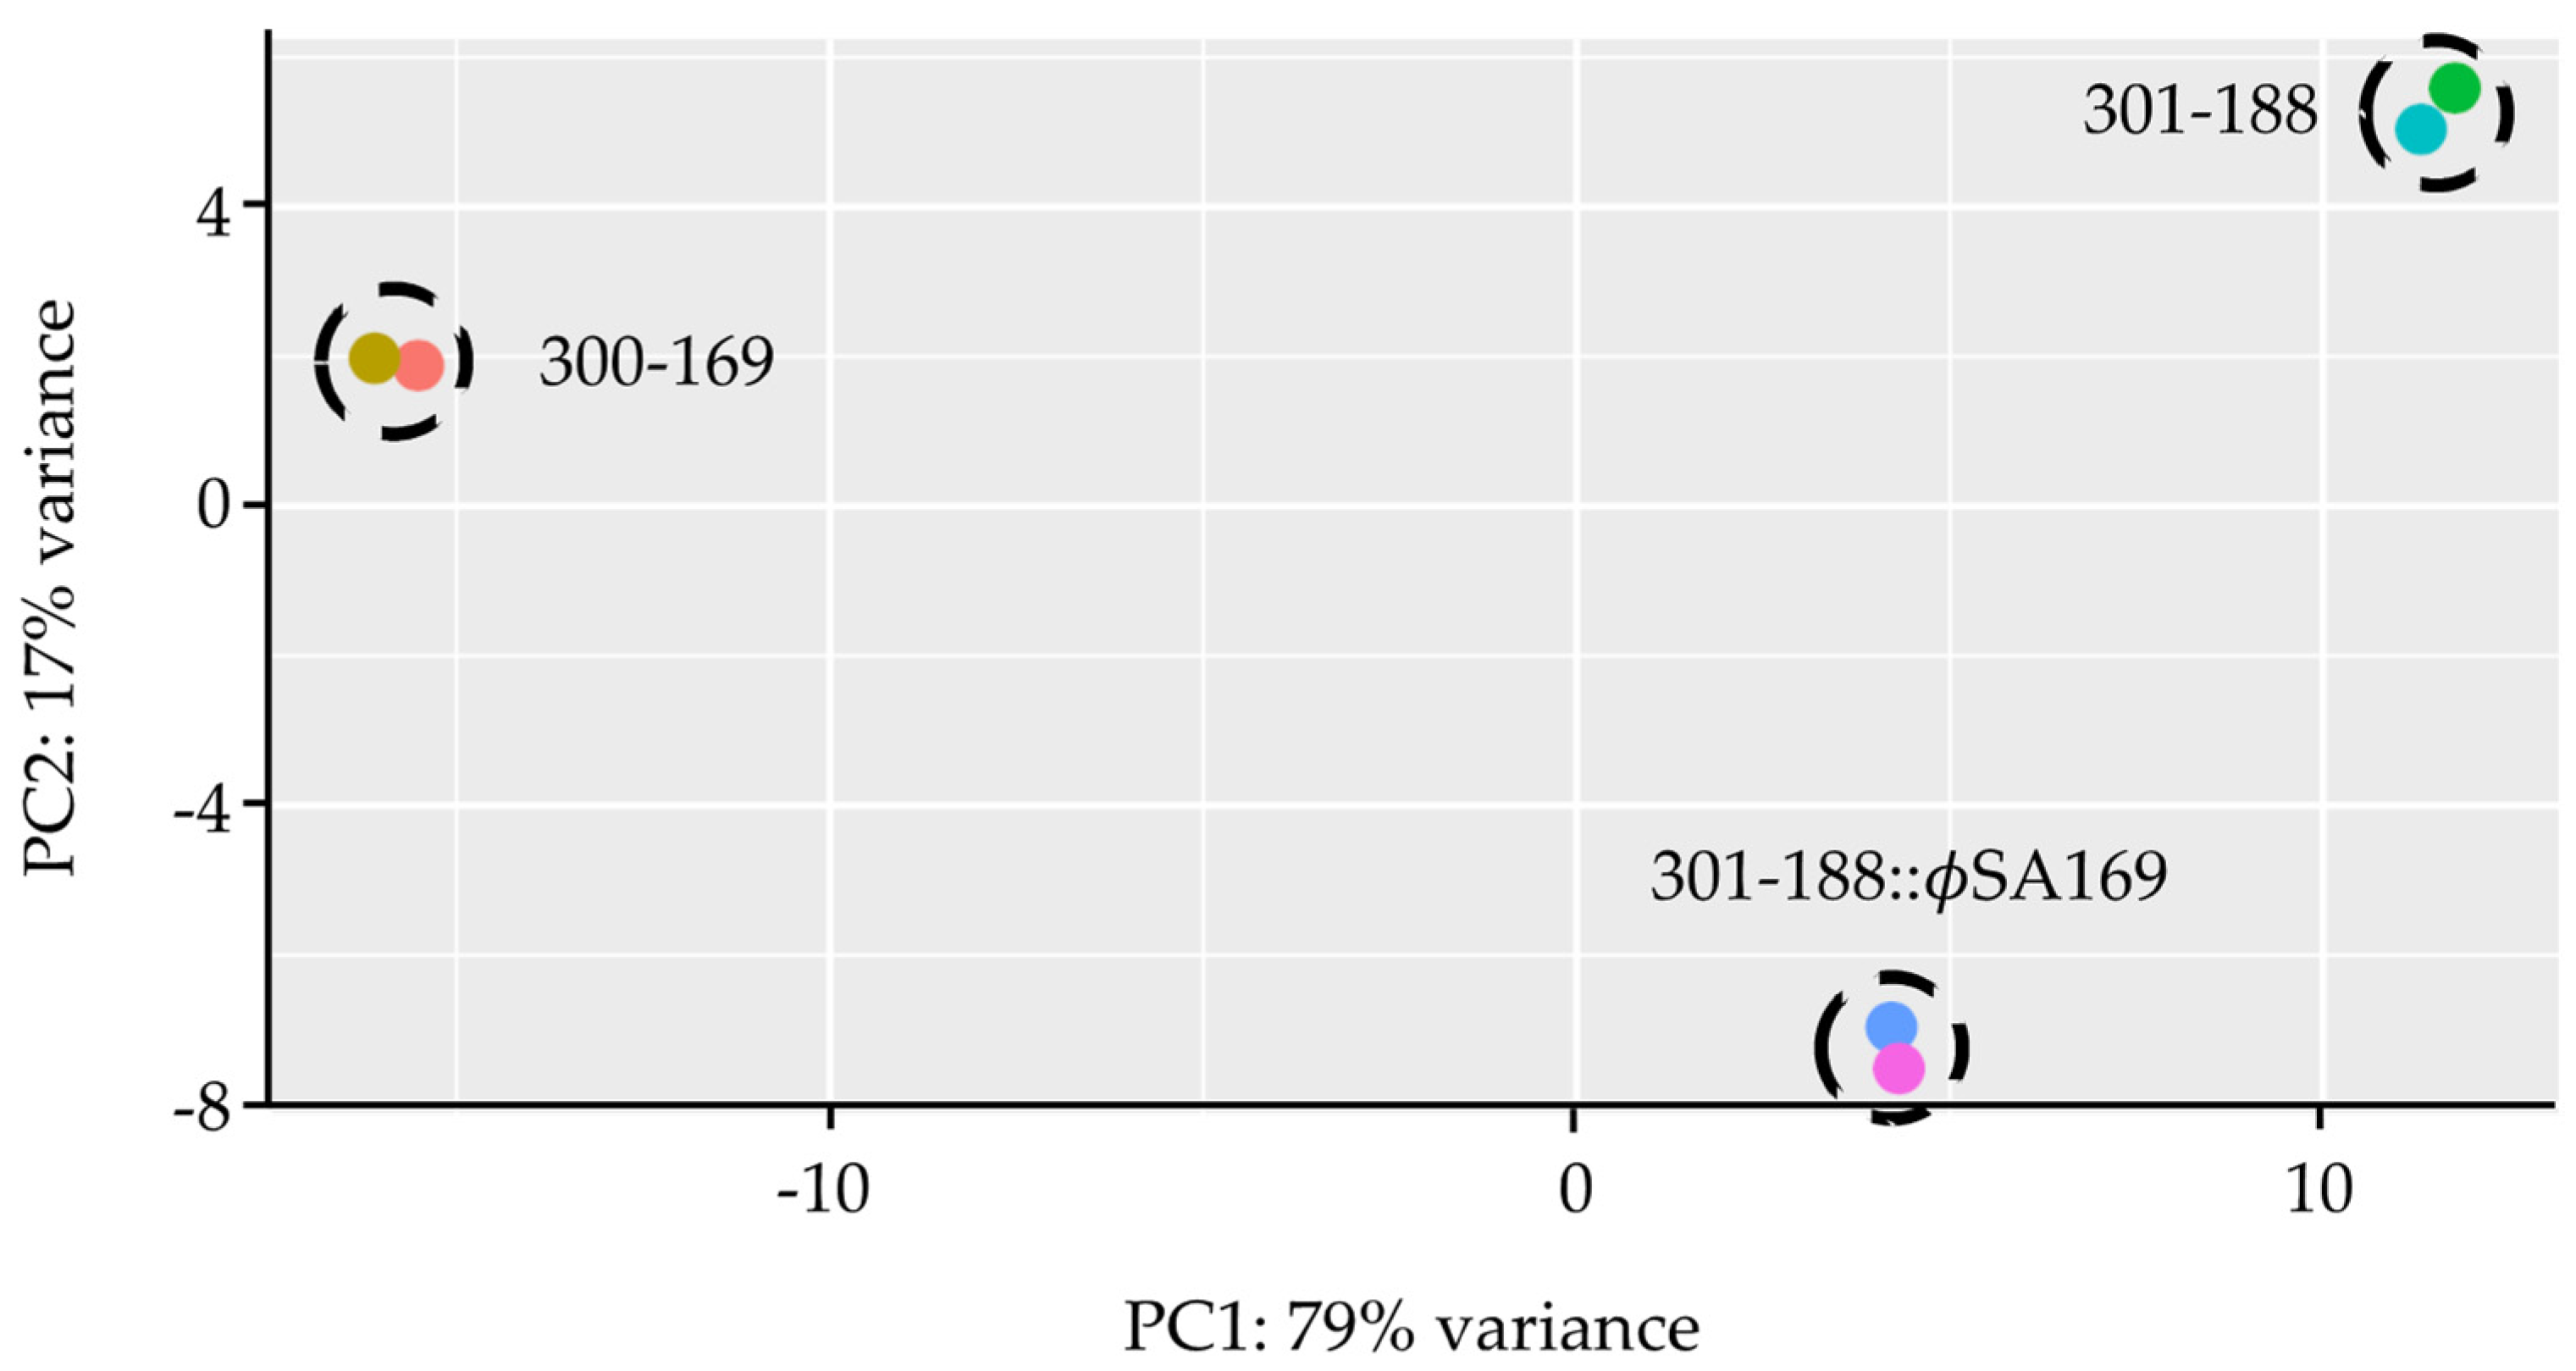
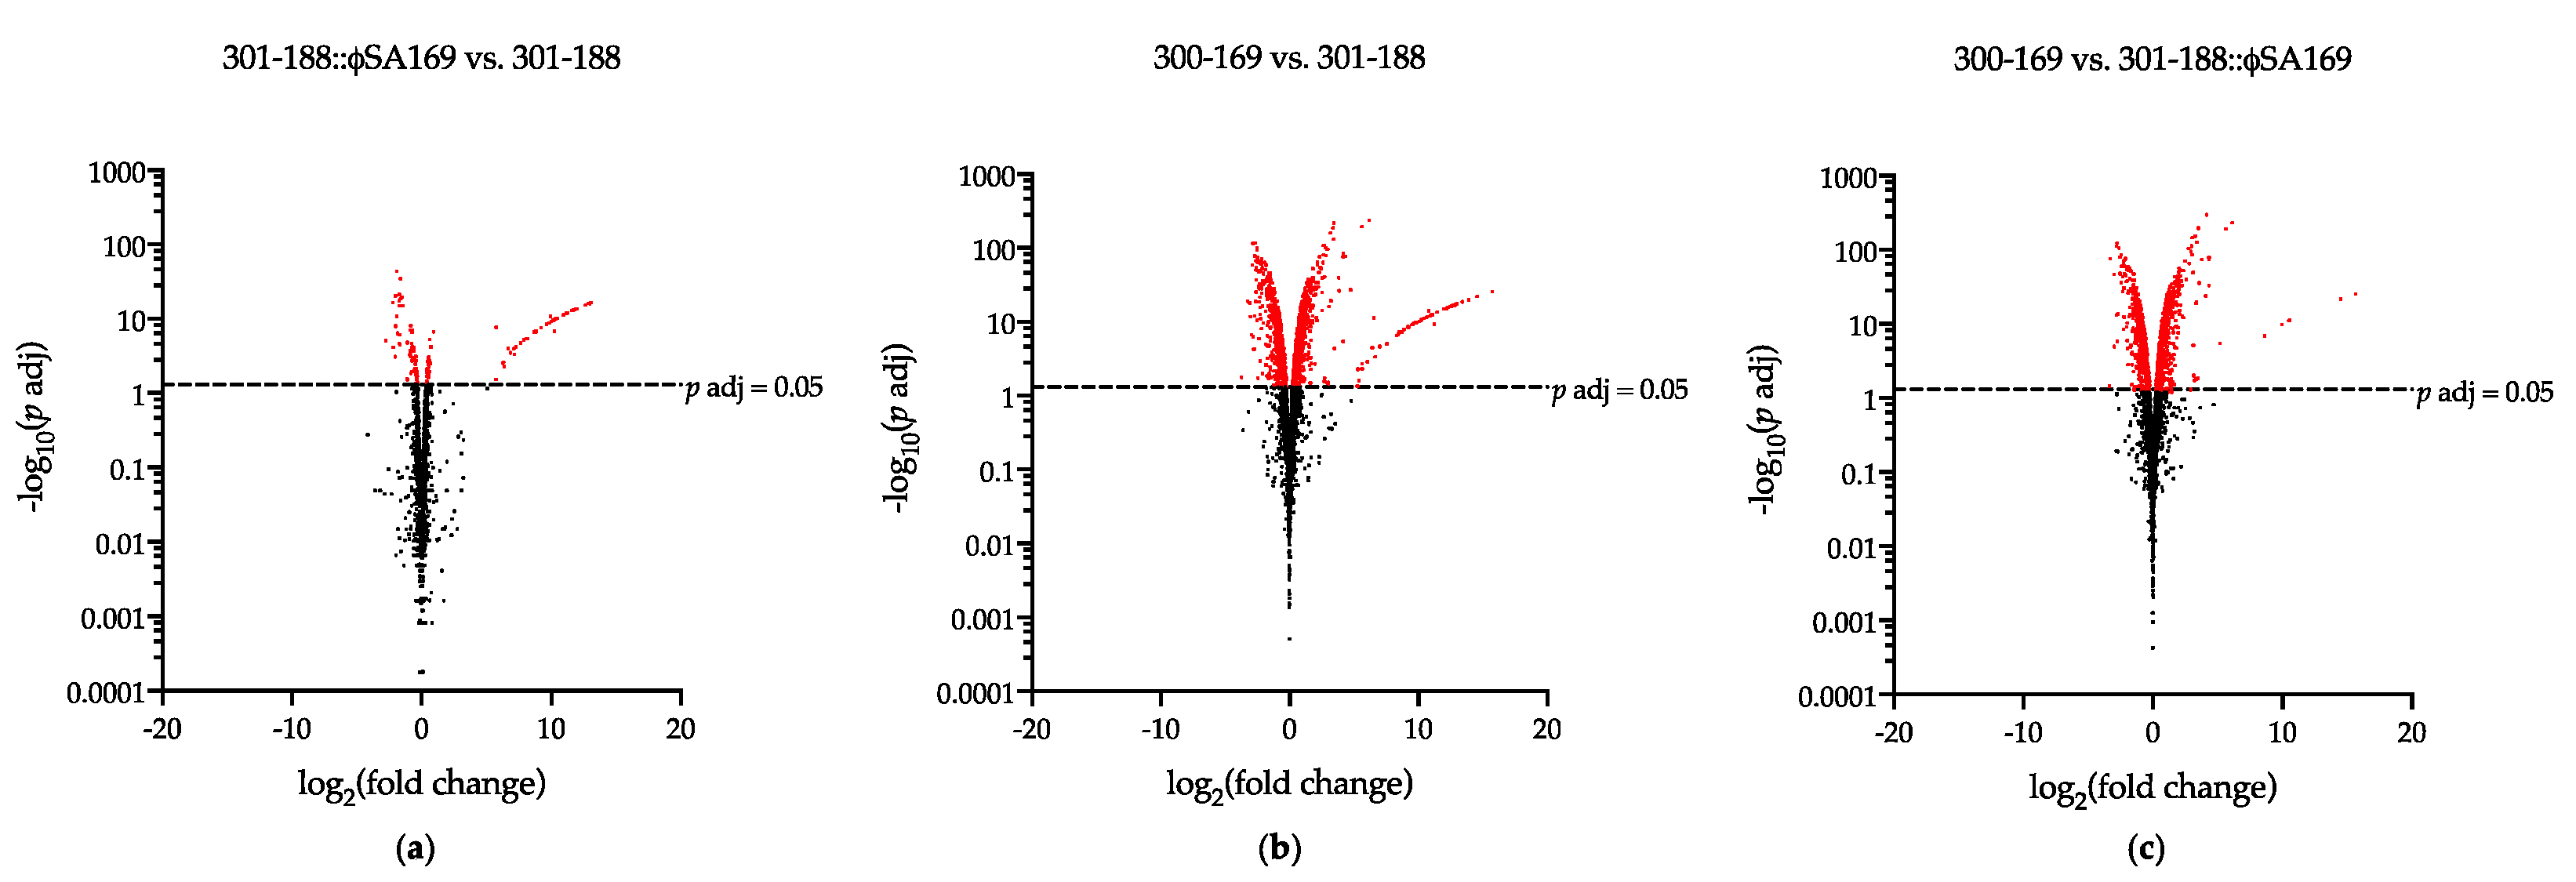
3.1. Global Analyses of Gene Expression

Each sample yielded a high percentage of exon-mapped reads (85.3–90.1%) that covered over 2000 genes, indicating the abundance of mRNA and low interference from non-coding RNAs. More than 86% of the mapped genes had at least one fragment per kilobase of transcript sequence per million (FPKM), suggesting that the transcriptional profiles covered most of the genes in the study strains. Principal component analysis (PCA) was performed to assess the overall differences in the gene expression of the study strains (Figure 1). Among the study strains, 300-169 had a different genetic background vs. 301-188, while 301-188 and 301-188::ϕSA169 were isogenic strain-set with the only difference in the absence/presence of ϕSA169. The strains 301-169 and 301-188 had the most distant locations on the PCA biplot, indicating the most significant genetic variation, while 301-188 and 301-188::ϕSA169 had the closest locations suggesting minor variation, which might be due to the same genetic background (Figure 1).
The transcriptome profiles of each study strain were compared to identify the DEGs (Figure 2, Table 1). There were 153 DEGs in 301-188::ϕSA169 vs. 301-188 (Figure 2a), while over 1200 DEGs were found in 300-169 vs. 301-188 (Figure 2b) and 300-169 vs. 301-188::ϕSA169 (Figure 2c). In the strain 301-188::ϕSA169, 77 and 76 DEGs were significantly up- and down-regulated, respectively, compared to the parental 301-188 (Table 1). Over half of the up-regulated DEGs (49 out of 77) were the genes of ϕSA169 (Table S1), while more than one-third of the down-regulated DEGs (24 out of 76) belonged to the mutual prophage in both 300-169 and 301-188 (Table S2). The high log2(fold change) values of the 49 ϕSA169 genes (Table S1) indicated the absence in 301-188. In the 300-169 strain, 666 and 633 DEGs were significantly up- and down-regulated, respectively, compared to 301-188 (Table 1). The detailed up- and down-regulated DEGs in the comparison of 300-169 vs. 301-188 are presented in Tables S3 and S4, respectively. In the comparison of 300-169 vs. 301-188::ϕSA169, a total of 637 and 613 DEGs were significantly up- and down-regulated, respectively (Table 1). The detailed up- and down-regulated DEGs are presented in Tables S5 and S6, respectively.

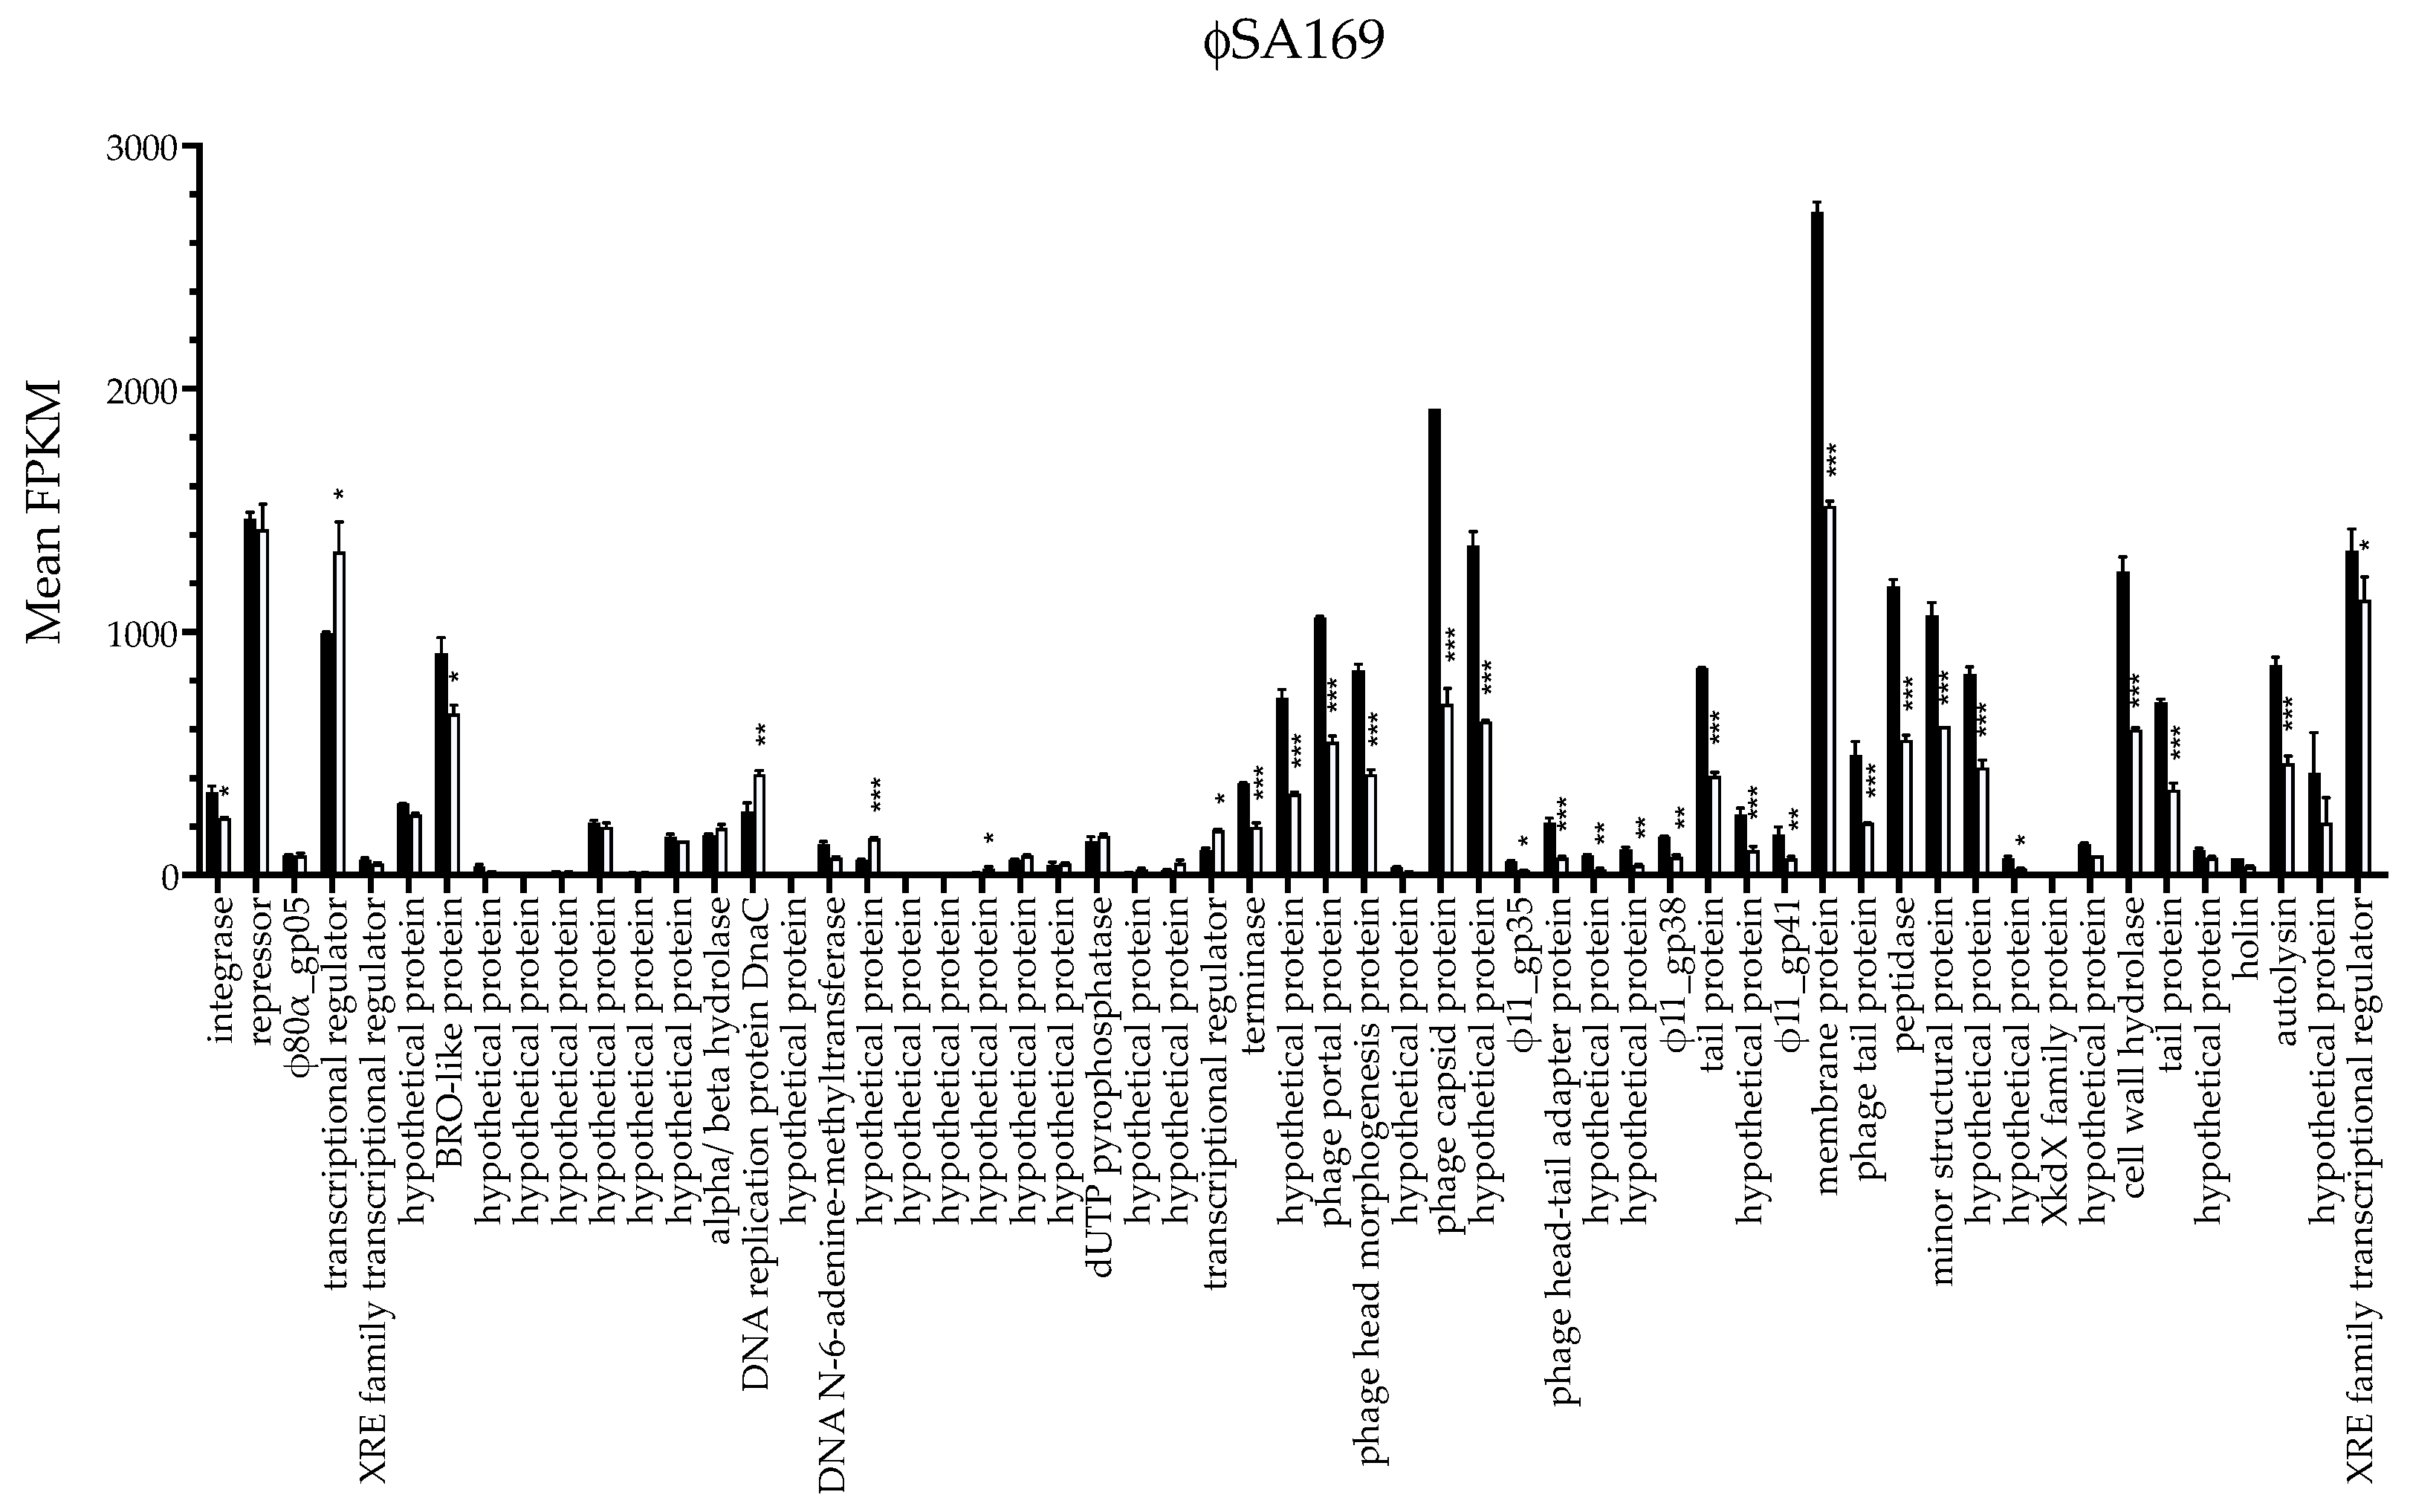
3.2. ϕSA169 Had Similar Transcriptional Profiles in 300-169 and 301-188::ϕSA169 Strains

Prophage ϕSA169 was initially identified in PB 300-169 and transduced into RB 301-188 to construct the 301-188::ϕSA169 strain. Therefore, ϕSA169 was an exogenous genomic element for the 301-188 chromosome despite the similar genetic background between 300-169 and 301-188 (e.g., CC45, agr I, and SCCmec IV); thus, the gene expression of ϕSA169 may differ in the 300-169 vs. 301-188::ϕSA169. There were 58 out of a total of 67 annotated genes in ϕSA169 detected in the current RNA-seq results (Figure 3). The plotted expression levels of ϕSA169 genes in both 300-169 and 301-188::ϕSA169 are presented in Figure 3. Bacteriophage (phage) genes are highly mosaic and grouped into different modules based on the functions of the gene products (18). In general, ϕSA169 genes in the modules of lysogeny, packing and morphogenesis, and lysis were highly expressed, while genes in the replication module had low expression (Figure 3). In addition, the transcriptional profiles of ϕSA169 were similar in both strains. However, some ϕSA169 genes, especially in the packing and morphogenesis module, had different expression levels in the two strains, which might imply the impact of the distinct genetic backgrounds.

3.3. The Impact of ϕSA169 on Transcriptional Profiles

The 301-188::ϕSA169 and 301-188 formed an isogenic strain set; thus, the DEGs from the comparison of the two strains were likely caused by ϕSA169. On the other hand, 300-169 and 301-188 strains had distinct genetic backgrounds; thus, the DEGs profile of these two strains might be affected by both ϕSA169 and their genetic backgrounds. Therefore, the overlapping DEGs between the two comparisons (301-188::ϕSA169 vs. 301-188 and 300-169 vs. 301-188) might indicate the specific impact of ϕSA169. There were total of 65 (29 + 36) DEGs up-regulated (Figure 4a) and 45 (22 + 23) DEGs down-regulated (Figure 4b) by the ϕSA169. Most up-regulated DEGs (49 out of 65) belonged to ϕSA169, and the other 16 genes fitted in the MRSA host genes (genes in the chromosome of the study MRSA strains excluding prophage genes) included purA and fatFH (Table 2). Over half of the down-regulated DEGs (24 out of 45) belonged to the mutual prophage in both 300-169 and 301-188 strains, and the remaining 21 DEGs were the MRSA host genes, including lacABCDEF, treP, and pfkB (Table 3).

3.4. The Impact of MRSA Genetic Background on Transcriptional Profiles

The overlapping DEGs of 300-169 vs. 301-188 and 300-169 vs. 301-188::ϕSA169 were analyzed to explore the impact of distinct genetic backgrounds of 300-169 and 301-188 excluding the impact of ϕSA169 (Figure 4). There were 555 (519 + 36) DEGs up-regulated (Figure 4a, Table S7) and 546 (523 + 23) DEGs down-regulated (Figure 4b, Table S8) in these two comparisons. The up-regulated DEGs included 26 genes of ϕSA169 and 6 genes of the mutual prophage in 300-169 and 301-188 (Table S7). The down-regulated DEGs included 3 genes of ϕSA169 and 18 genes of the mutual prophage (Table S8).

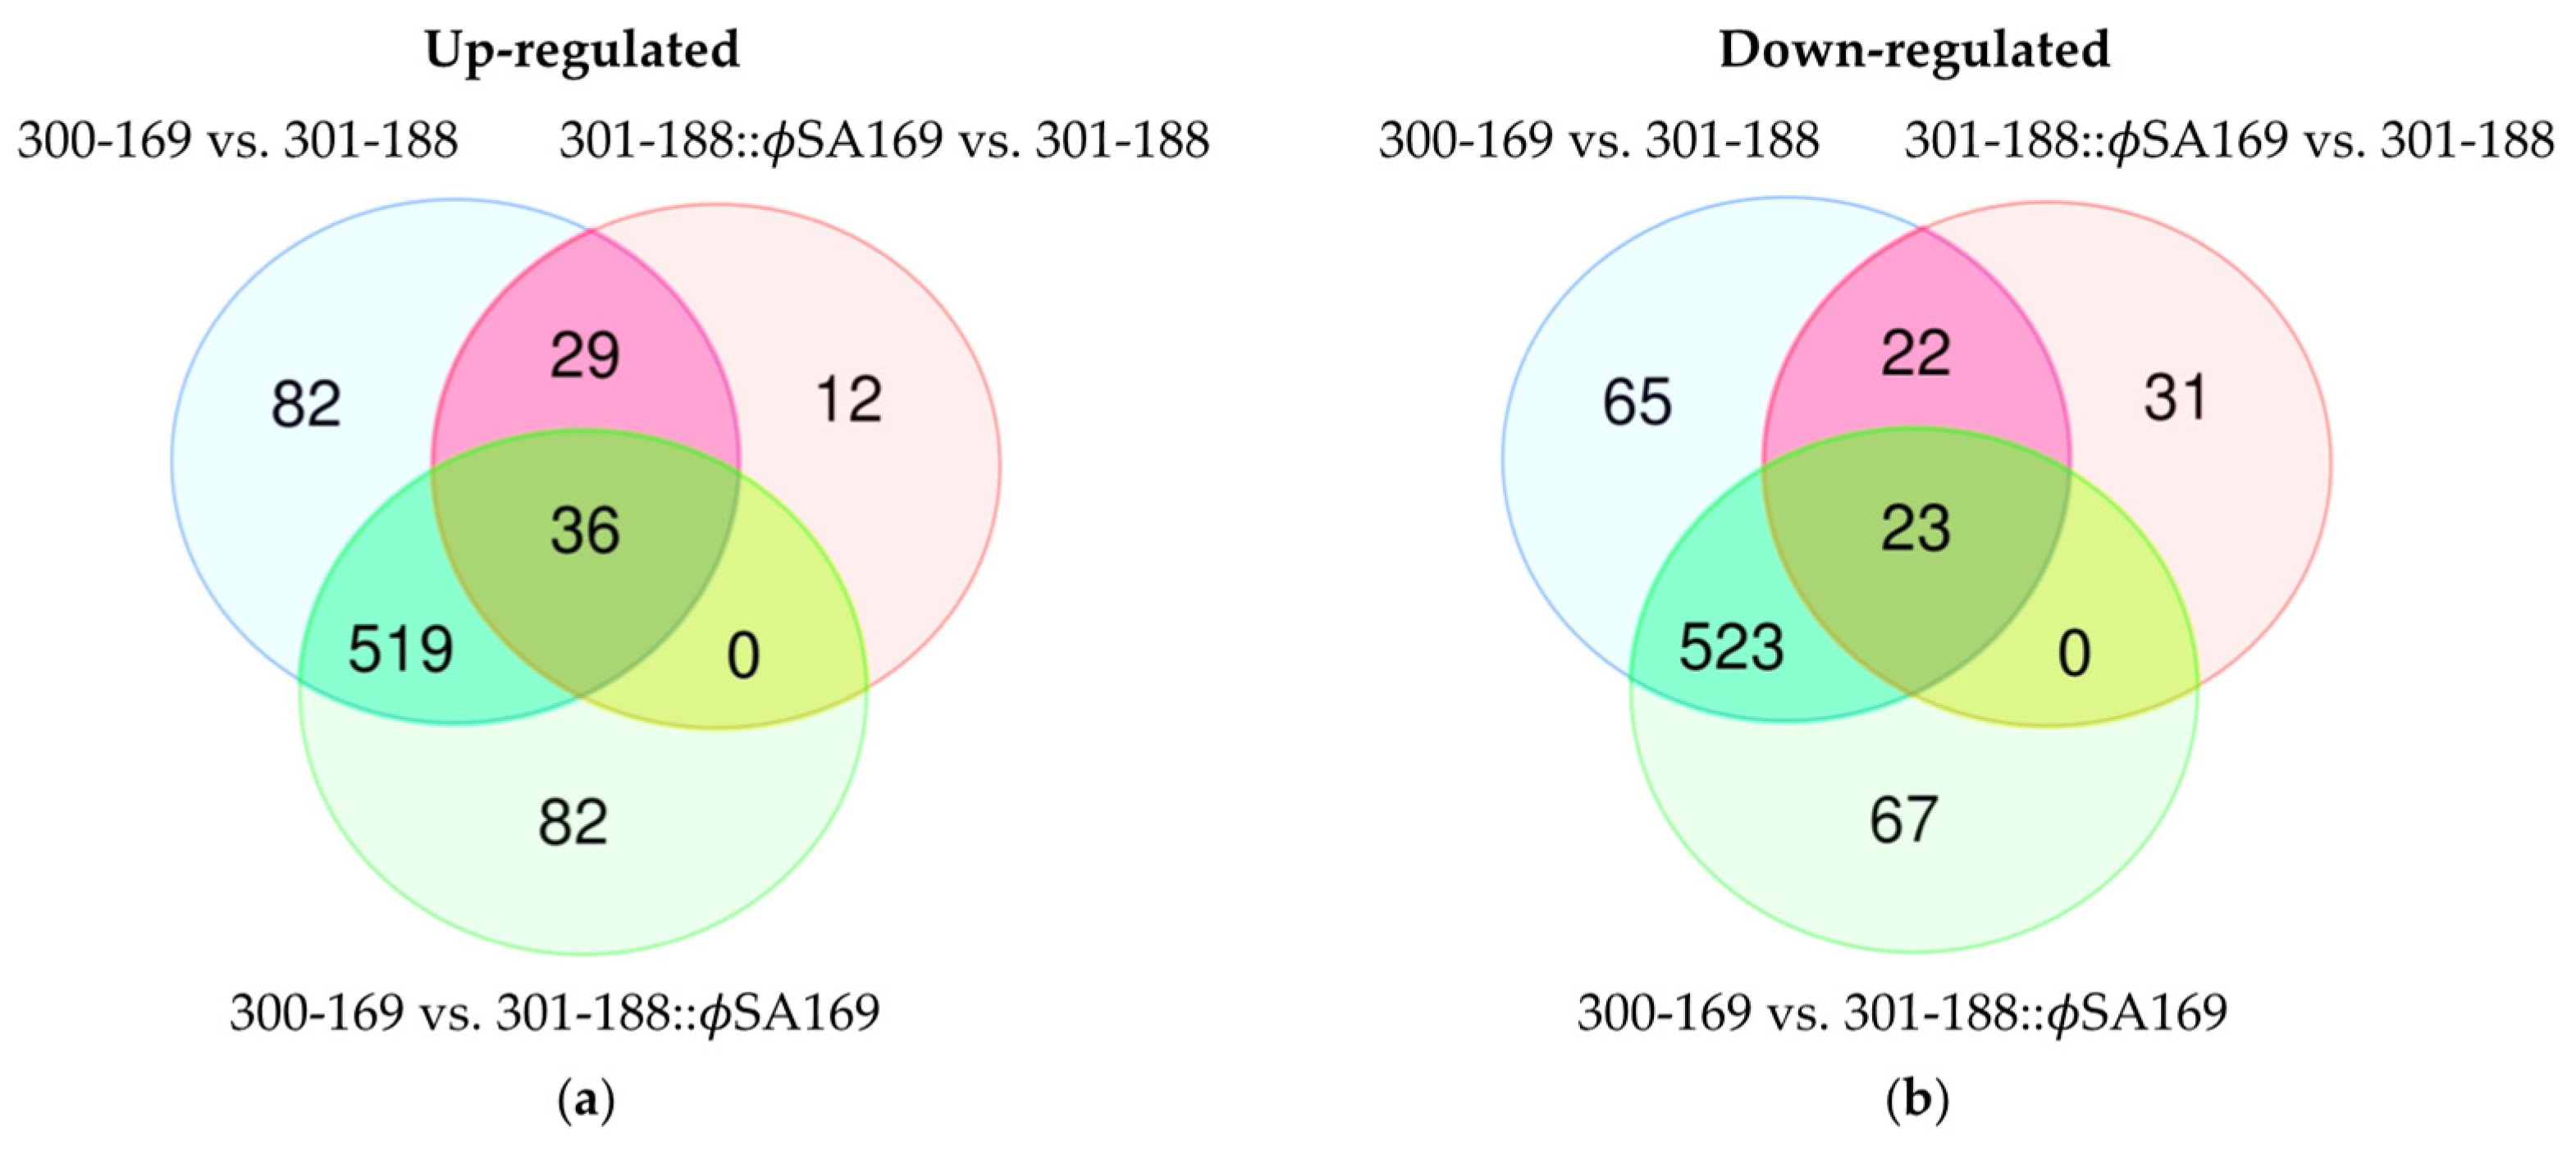
3.5. DEGs Impacted by Both ϕSA169 and MRSA Genetic Backgrounds

There were 36 (Figure 4a, Table S9) and 23 (Figure 4b, Table S10) DEGs up- and down-regulated in all three comparisons, respectively. It indicated that these DEGs were affected by both ϕSA169 and the genetic backgrounds of 300-169 and 301-188. The up-regulated DEGs included 26 genes in ϕSA169 and 10 other staphylococcal genes (Table S9). The down-regulated DEGs consisted of 10 genes in the mutual prophage and 13 MRSA genes (Table S10).

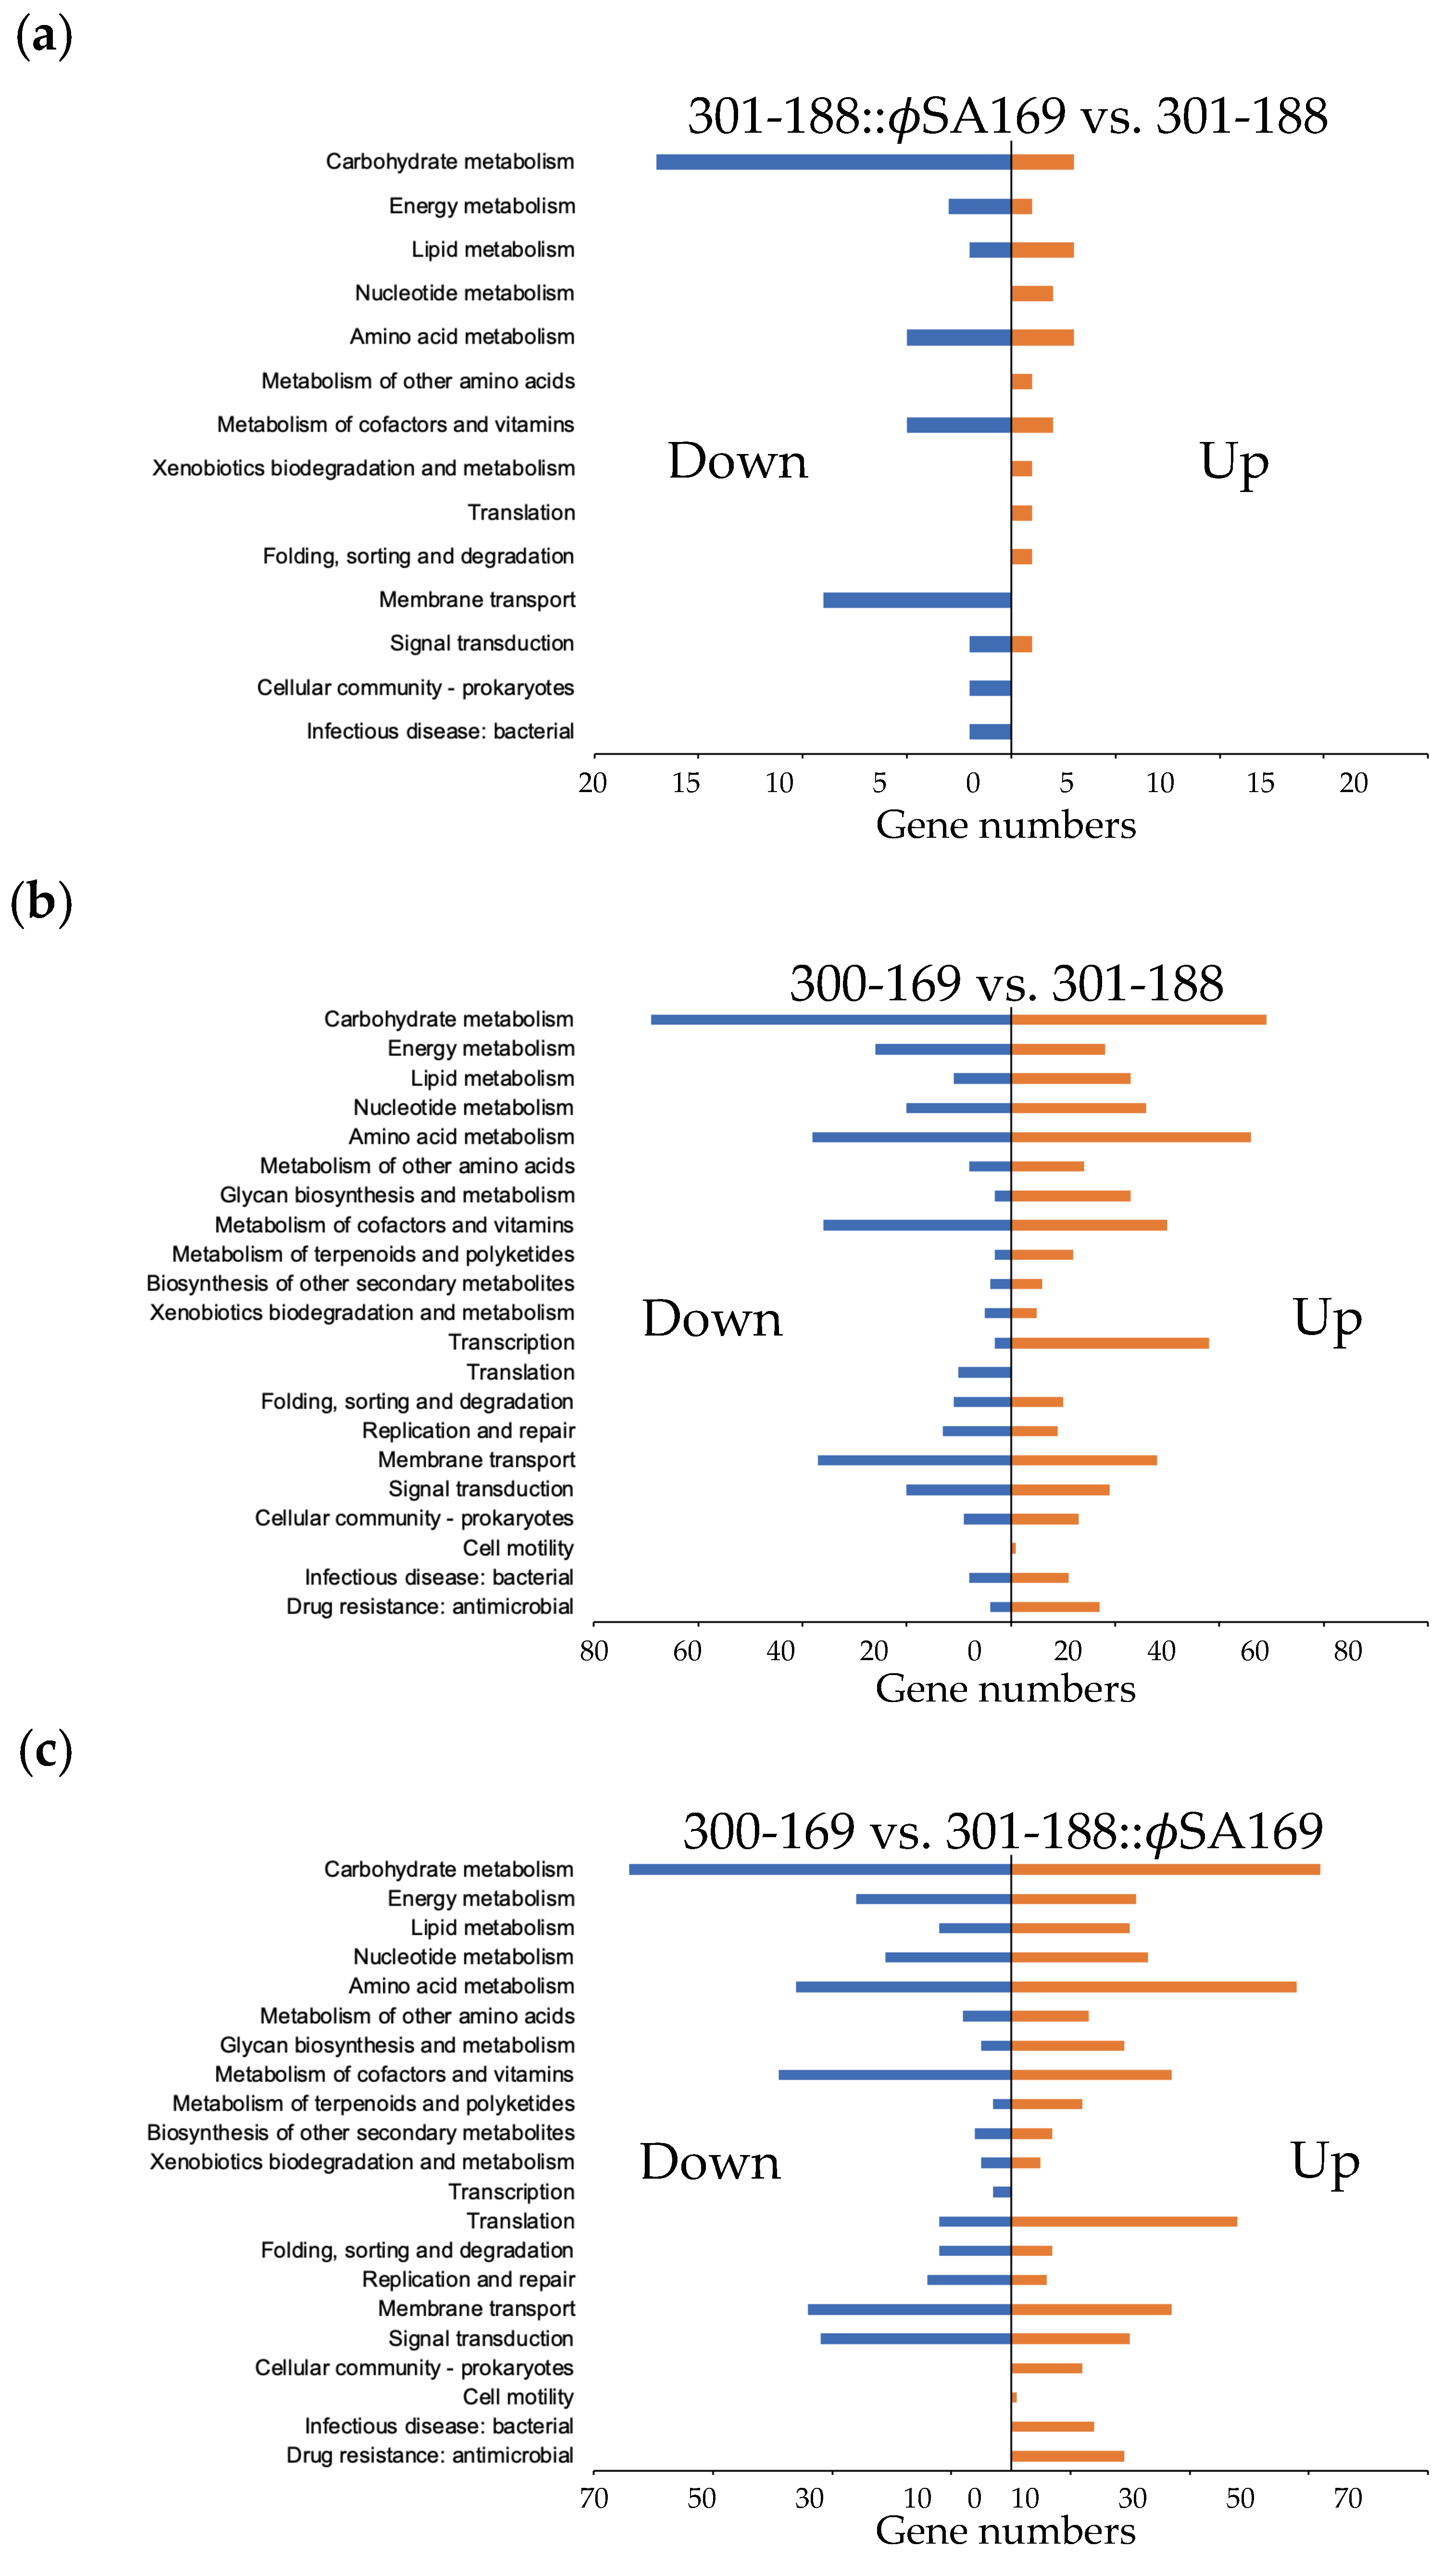
3.6. Global KEGG Analyses of DEG Profiles

To understand the gene functions and pathways associated with the persistent outcomes, we classified the DEGs using the KEGG pathways mapper tool (Figure 5). In 301-188::ϕSA169, a significant number of genes were down-regulated compared to 301-188 (e.g., carbohydrate metabolism and membrane transport; Figure 5a). In 300-169, genes involved in carbohydrate and amino acids metabolisms, metabolism of cofactors and vitamins, and membrane transport were mainly differentially expressed vs. 301-188 (Figure 5b). Some pathways were found up-regulated in 300-169 vs. 301-188 (e.g., glycan biosynthesis and metabolism, transcription, and drug resistance; Figure 5b). The KEGG analysis profile of 300-169 vs. 301-188::ϕSA169 (Figure 5c) was similar to 300-169 vs. 301-188 (Figure 5b), suggesting the significant differences may be due to the different genetic backgrounds.

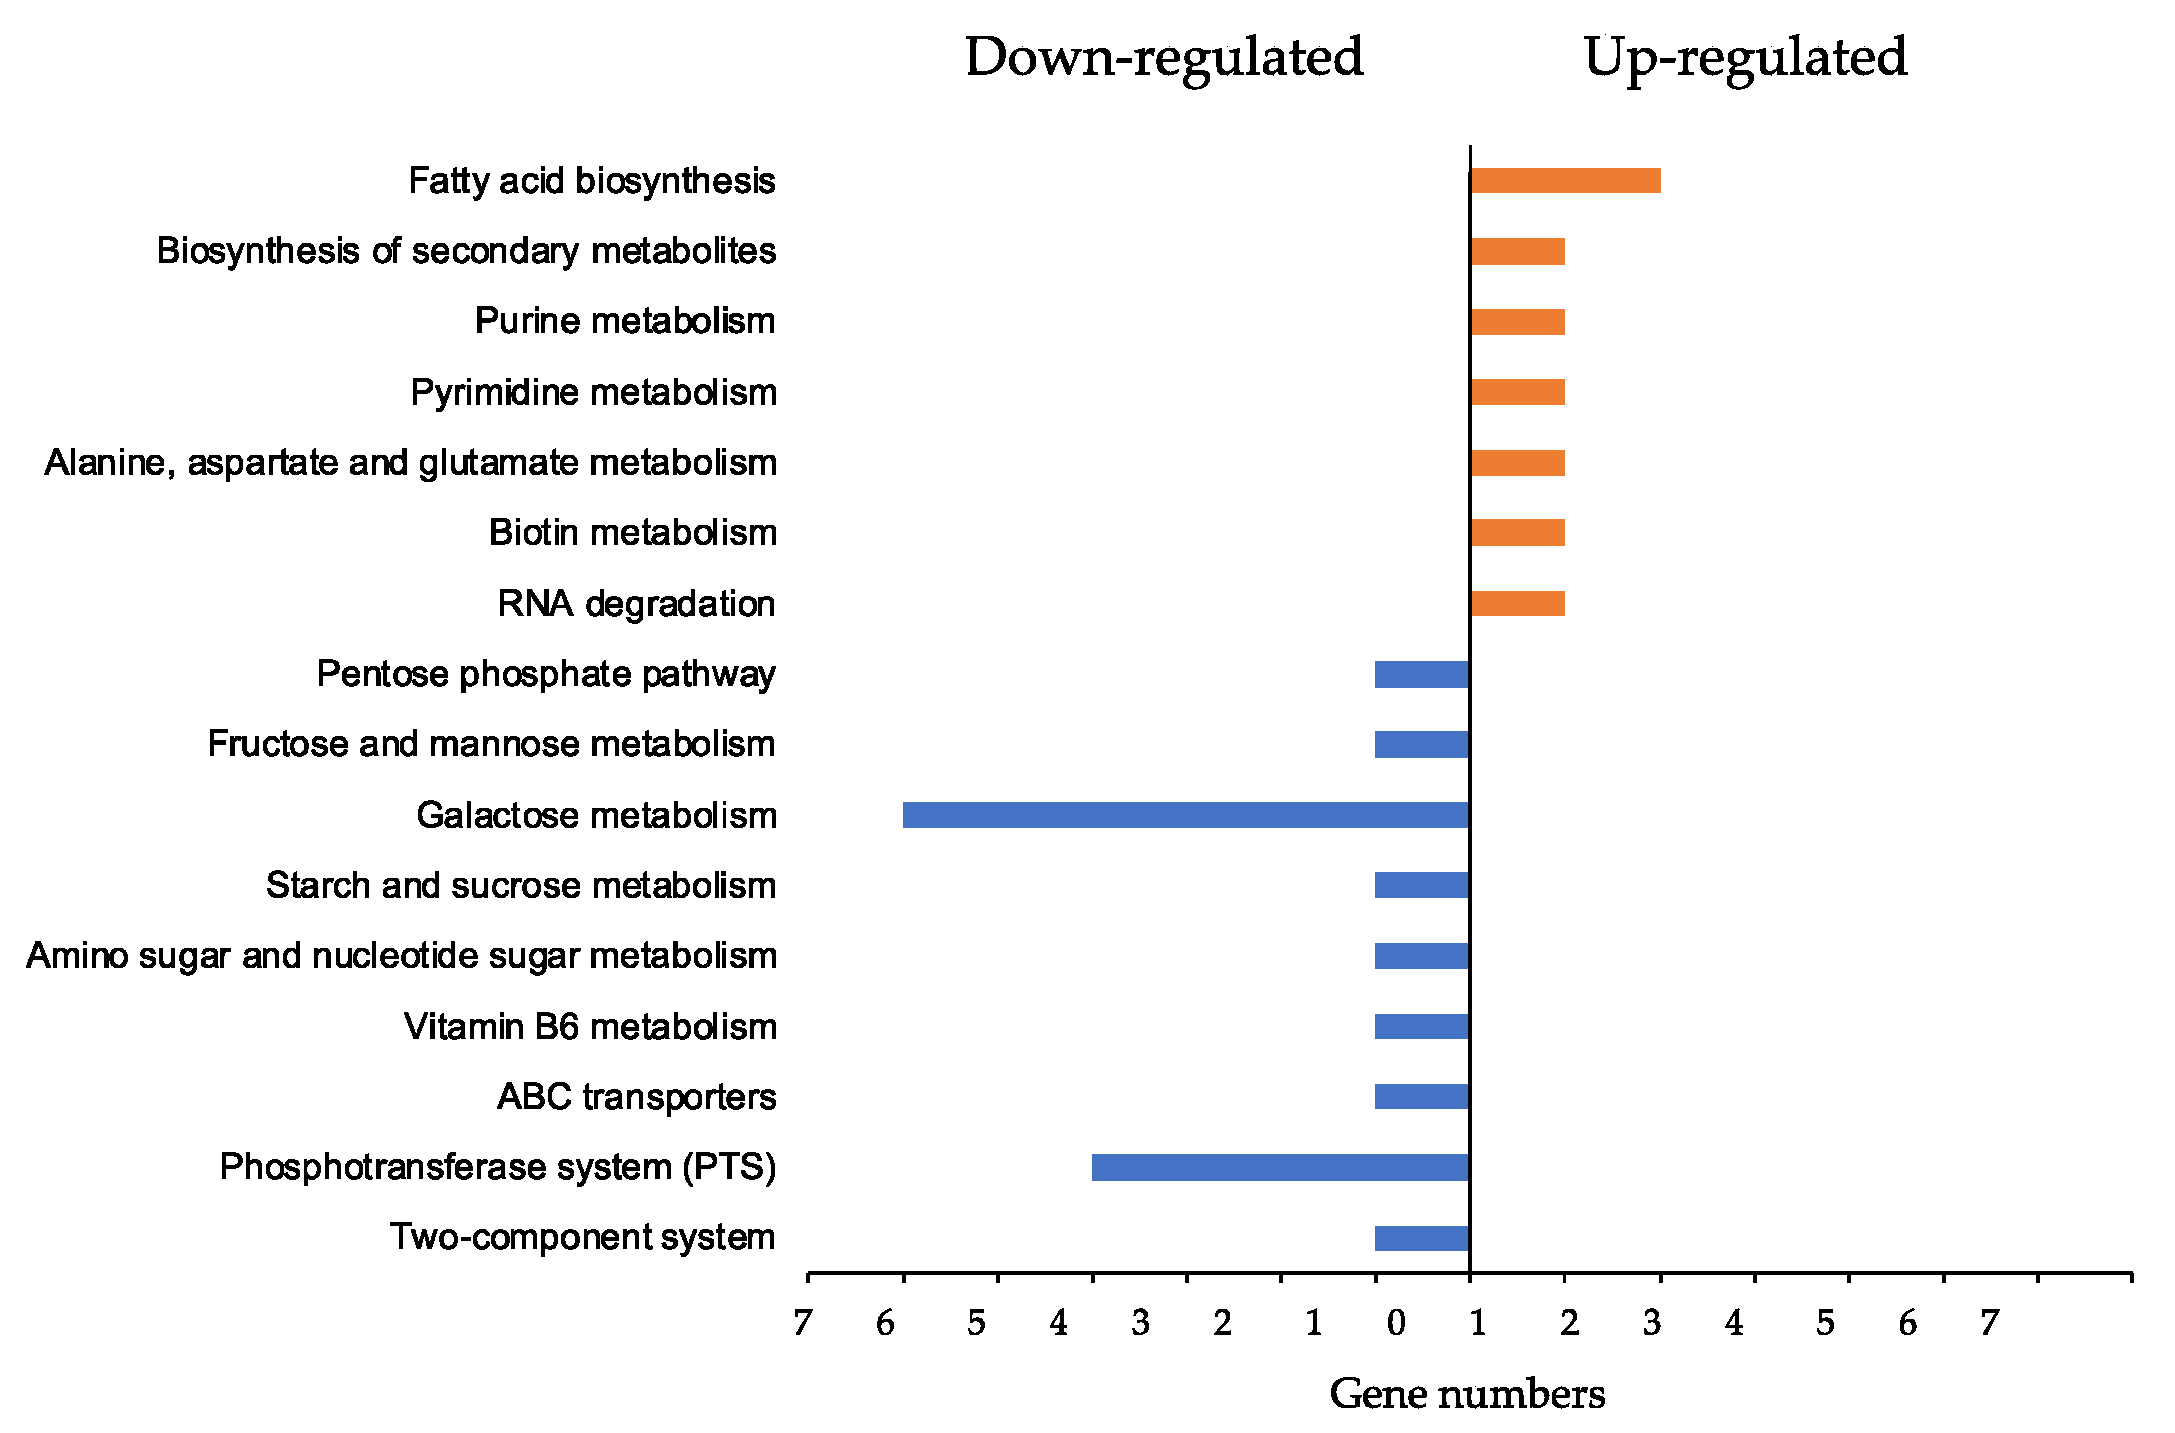
3.7. ϕSA169-Specific KEGG Analyses

The overlapping DEGs of 301-188::ϕSA169 vs. 301-188 and 300-169 vs. 301-188 might represent the genes regulated explicitly by ϕSA169 (Figure 4). The KEGG profile of the overlapping DEGs indicated that most of these genes were involved in metabolic pathways (Figure 6). For instance, the DEGs of fatty acid biosynthesis (fabFH), purine metabolism (purA), and RNA degradation (AS94_08925) were up-regulated by ϕSA169. Among the down-regulated DEGs by ϕSA169, many of them belonged to galactose metabolism (lacABCDEF) and phosphotransferase system (PTS) (treP, pfkB) (Figure 6).

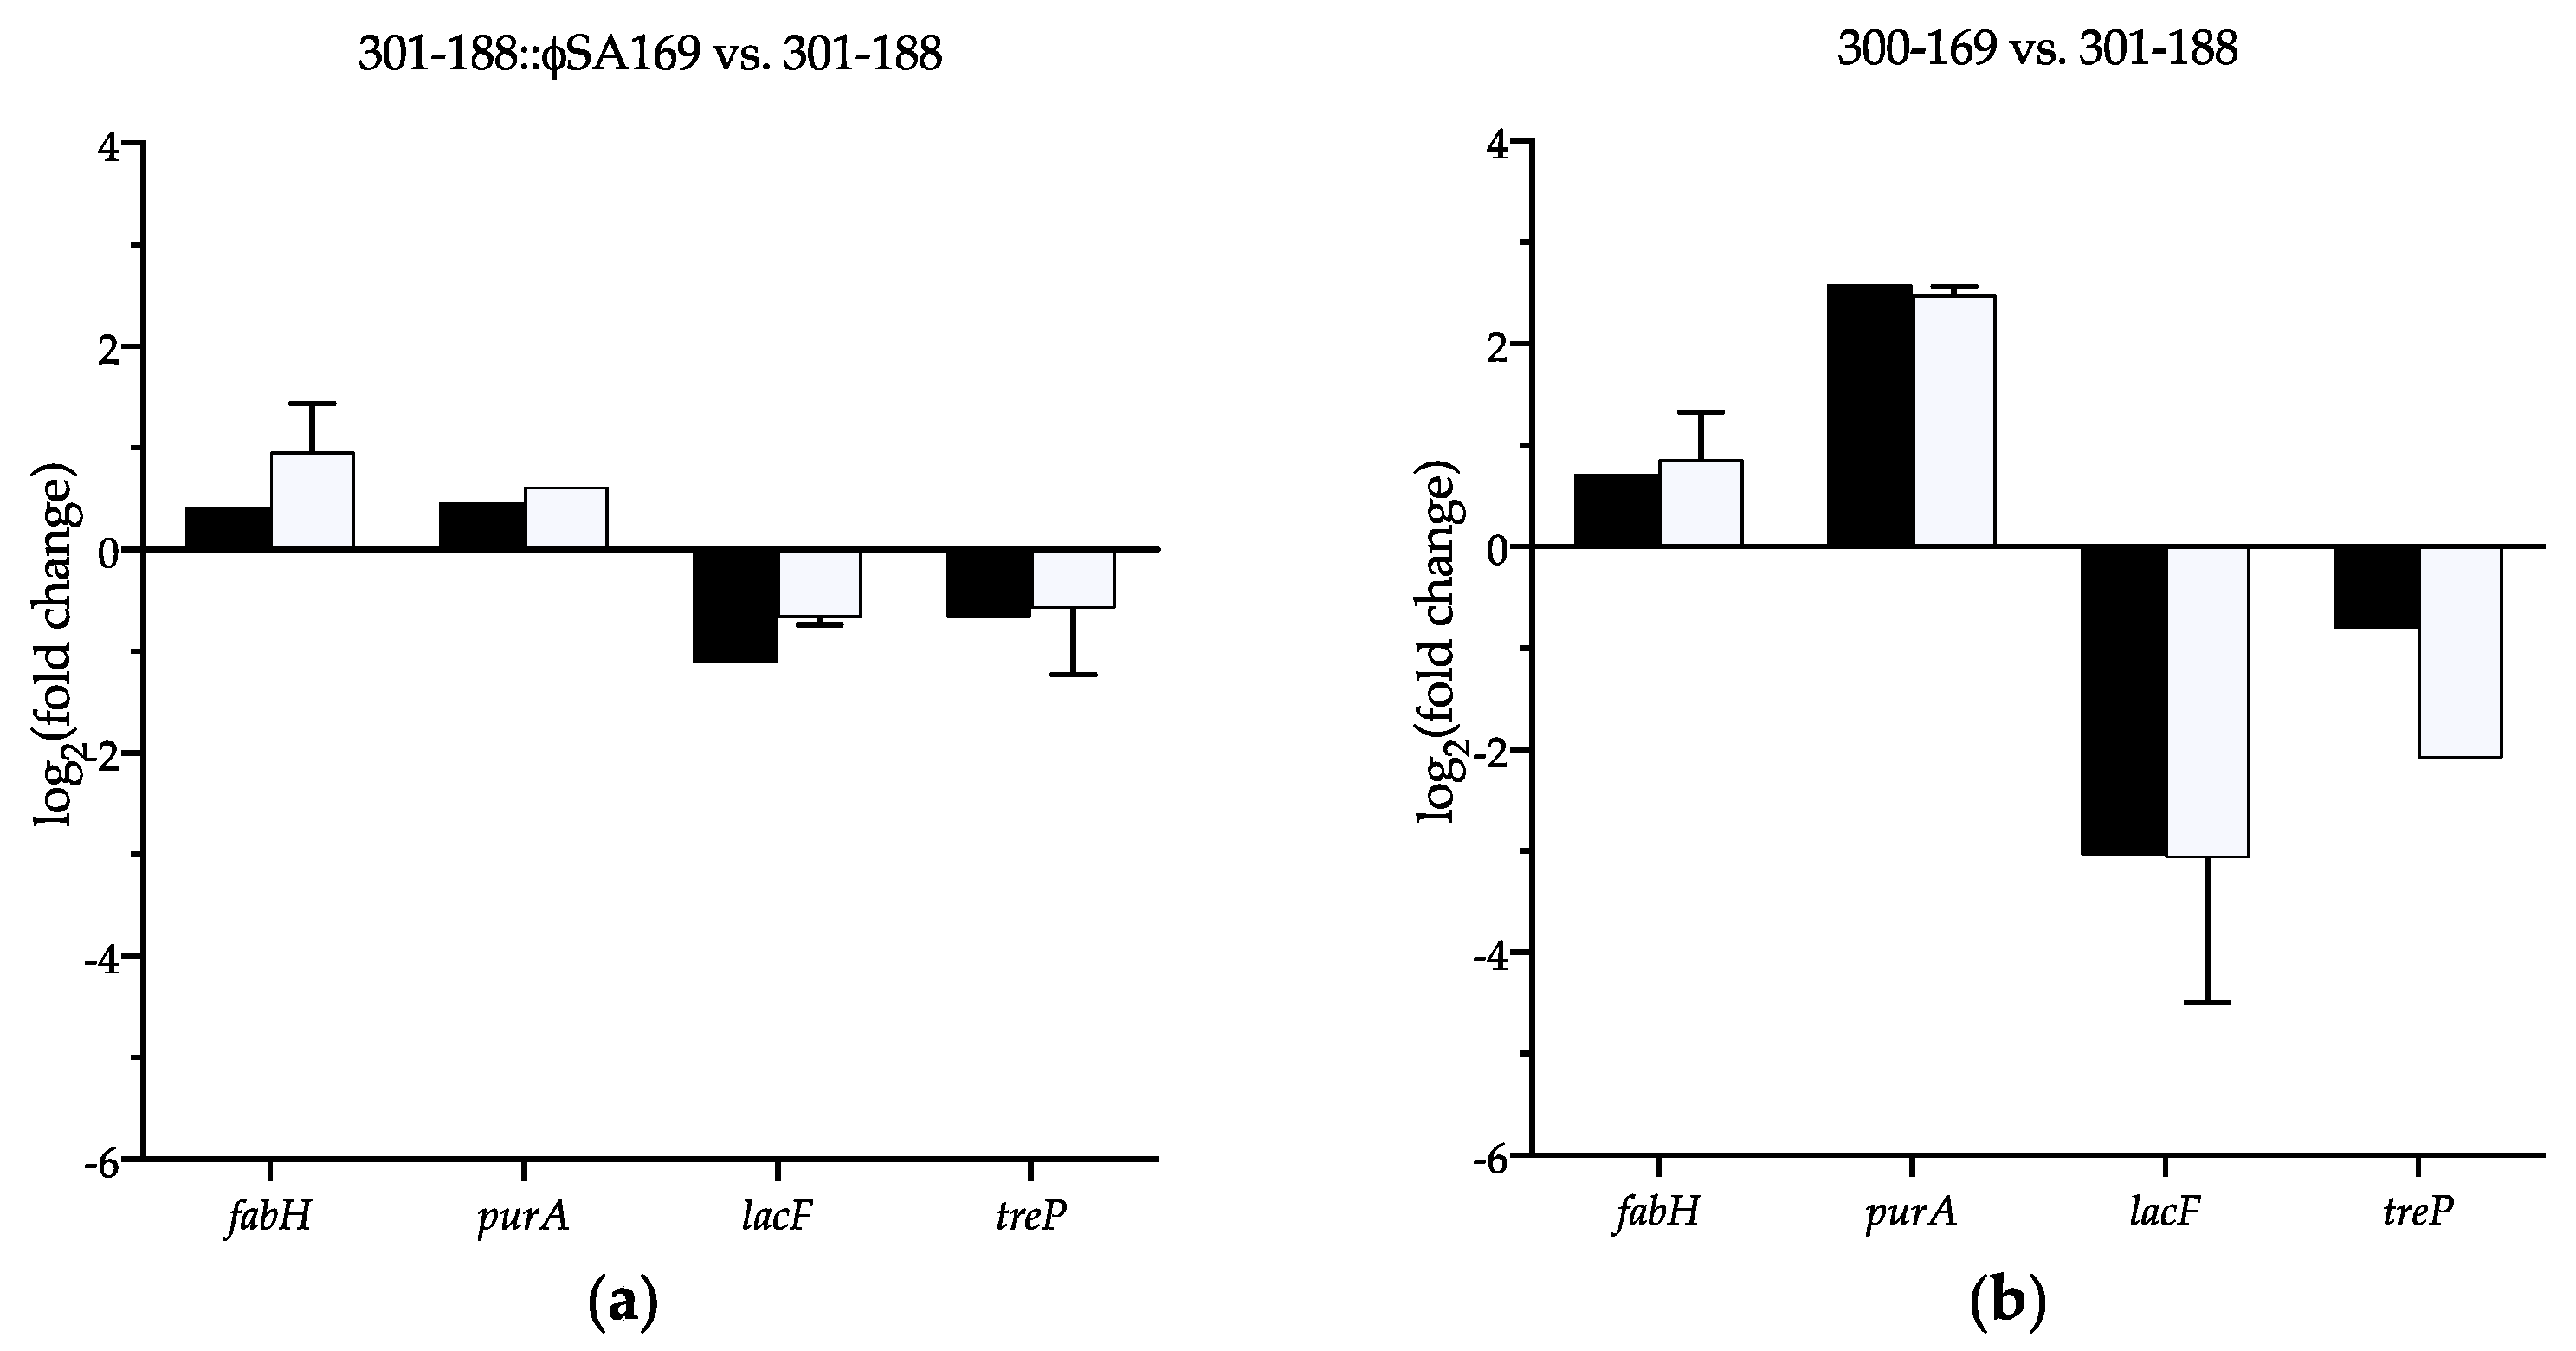
3.8. Verification of the Selected DEGs

DEGs that were up-/down-regulated in both comparisons 301-188::ϕSA169 vs. 301-188 and 300-169 vs. 301-188 were thought to be significantly impacted by ϕSA169. The expression of four DEGs (fabH, purA, lacF, and treP) involved in different KEGG pathways was selected to verify the RNA-seq results using qRT-PCR. Primers for the selected genes are listed in Table S11. Genes fabH/purA and lacF/treP represented significantly up- and down-regulated DEGs by ϕSA169, respectively. The fold changes of the four genes determined by the qRT-PCR were similar to the results obtained in the RNA-seq assays (Figure 7).

4. Discussion

Many phages carry virulence factors that significantly contribute to genome variation, pathogenesis, and antibiotic resistance in S. aureus [7,19,20]. Despite the obvious importance of phages, studies on the interactions between phage and MRSA persistent outcome are limited. Recently, we demonstrated that the lysogenization of clinical RB 301-188 strain with phage ϕSA169 resulted in persistent phenotypes in vitro and in an experimental endocarditis model [11]. Thus, the current study was designed to determine the impact of ϕSA169 on genetic factors that may contribute to persistent MRSA endovascular infections.
The RNA-seq results revealed that MRSA host genes up-regulated by ϕSA169 were mainly involved in fatty acid biosynthesis (fabF and fabH), purine (purA), pyrimidine (AS94_12220), and RNA degradation (AS94_08925). Both fabF and fabH encode essential enzymes for fatty acid biosynthesis in many pathogens, including S. aureus [21]. Fatty acids are crucial hydrophobic components of membrane lipids and are important metabolic energy sources in bacteria [22]. It has been reported that defected unsaturated fatty acid biosynthesis in Streptococcus mutans results in attenuated virulence (e.g., less transmissible, less carious lesions) in a rodent model of dental caries [23]. In addition, fatty acid biosynthesis contributes to virulence in Group B Streptococcus (GBS) [24]. Importantly, fatty acid biosynthesis pathway inhibition has been investigated as a possible antimicrobial agent in bacteria [25]. In the current study, significantly higher expressions of fabF and fabH were observed in the ϕSA169-carrying strains, which may result in survival advantage and consequent persistence.
As a member of pur regulon, purA encodes the enzyme that catalyzes the conversion of inosine-5-phosphate (IMP) to adenylosuccinate [26]. We and others have previously shown that purine biosynthesis promotes virulence and persistence in S. aureus [14,26,27,28]. For instance, the inactivation of purA causes the lower expression of a broad spectrum of genes (e.g., energy production and conversion) and attenuates the ability of S. aureus to cause kidney infection in mice [27]. Li et al. reported that higher purine biosynthesis production correlates with persistent outcomes in an experimental MRSA endocarditis model [14]. In addition, several studies demonstrated that the inactivation of purine biosynthesis repressor, purR, leads to a greater amount of secreted virulence factors and hypervirulence in the murine model of S. aureus bacteremia model [26,28]. In the current study, the purine biosynthesis gene, purA, was found to be significantly up-regulated by ϕSA169. Therefore, ϕSA169-related higher purA expression might contribute to the persistent outcomes we observed in our recent study [11].
It is also interesting that ϕSA169 significantly down-regulated several genes related to the galactose metabolism. Galactose is a common monosaccharide used by organisms [29]. S. aureus employs lac operon to import and metabolize galactose [30]. In a previous study, the down-regulation of lac operon was observed in a rpoB (A621E) mutant S. aureus strain that had decreased susceptibility to vancomycin compared to the parental strain [31]. Therefore, down-regulated lac operon in the ϕSA169-carrying strains might contribute to the persistent outcomes with VAN treatment in vivo [11]. However, more research into galactose metabolism and its role in pathogenesis and persistence in S. aureus is needed. The RNA-seq displayed down-regulation of the phosphotransferase system (PTS) by ϕSA169. It has been demonstrated that the PTS plays an important role in carbohydrate transport, and the regulation of sugar utilization genes, which further contributes to overall metabolic efficiency in Gram-positive bacteria [32,33]. Gera et al. reported that deleting ptsI that encodes cytosolic enzyme I (EI) (ΔptsI) in group A Streptococcus (GAS) strains resulted in a hypervirulent phenotype compared to their respective wild-type strains (e.g., significantly increased skin lesion severity and size) in a murine model of disseminating skin and soft tissue infection [33]. Thus, PTS appears to reduce the virulence of GAS skin infection. However, a conflict phenotype of interrupted ptsI in S. aureus was reported with an attenuated virulence compared to its wild-type strain in a systemic infection model [34]. We suspect this discrepancy is possibly due to (i) the PTS regulation of virulence factors in GAS vs. S. aureus and (ii) the animal models used (skin and soft tissue infection vs. systemic infection). Importantly, galactose is one of the carbohydrates that utilizes PTS [35]. Thus, down-regulated PTS in ϕSA169-carrying strains might be correlated with the lower expression of galactose metabolism genes. Detailed studies are needed to define the specific role of PTS, and the interaction between PTS and galactose, in persistent MRSA endovascular infection.
In this study, we also observed that some genes within the mutual prophage in both 300-169 and 301-188 strains were negatively impacted by ϕSA169, which suggested that the mutual prophage genes might be another ϕSA169-derived genetic factor that participated in the PB outcomes. It has been reported that the pathogenesis of S. aureus Newman requires the participation of its all four prophages [7]. Thus, multiple prophages might have combined effects on virulence and pathogenesis in S. aureus. Therefore, ϕSA169 might contribute to the PB outcomes by mediating the gene expression of the mutual prophage.
Besides the impact of ϕSA169 on genetic factors in the MRSA host genes and the mutual prophage, the different genetic backgrounds between 300-169 and 301-188 strains might also play a role in the persistent outcomes (Figure S1). We have previously demonstrated that key global regulators were differently expressed in 300-169 and 301-188 [11,14]. These differences may impact downstream virulence factors, subsequently contributing to the persistent outcome.
We recognize that there were some significant limitations in the current study. For instance, we only studied a PB 300-169 WT (300-169) containing ϕSA169, RB 301-188 WT (301-188) in the absence of ϕSA169, and 301-188 WT with ϕSA169 lysogenization (301-188::ϕSA169) in the current and previous research [11]. It would be important to verify the genetic impact of ϕSA169 using ϕSA169 deletion in the PB 300-169 strain background. In addition, it would be interesting to study the combinational effect of VAN with ϕSA169 on the MRSA host and ϕSA169 genes, which may demonstrate how ϕSA169 mediates the response to VAN treatment in the IE model [11]. Therefore, further investigations are needed to address these limitations.

5. Conclusions

In this study, we explored the impact of prophage ϕSA169 on genetic factors, which might play an essential role in MRSA-persistent endovascular infection. The results highlighted that ϕSA169 contributed to PB outcomes mainly through mediating metabolisms, especially the up-regulation of fatty acid biosynthesis and down-regulation of galactose metabolism and PTS. In addition, the mutual prophage in both 300-169 and 301-188 strains and different genetic backgrounds of these two strains might also be the genetic factors that contribute to the PB outcomes.

Supplementary Materials

The following supporting information can be downloaded at: https://www.mdpi.com/article/10.3390/genes13091527/s1, Table S1: Up-regulated DEGs in 301-188::ϕSA169 vs. 301-188; Table S2: Down-regulated DEGs in 301-188::ϕSA169 vs. 301-188; Table S3: Up-regulated DEGs in 300-169 vs. 301-188; Table S4: Down-regulated DEGs in 300-169 vs. 301-188; Table S5: Up-regulated DEGs in 300-169 vs. 301-188::ϕSA169; Table S6: Down-regulated DEGs in 300-169 vs. 301-188::ϕSA169; Table S7: Up-regulated DEGs in both 300-169 vs. 301-188 and 300-169 vs. 301-188::ϕSA169; Table S8: Down-regulated DEGs in both 300-169 vs. 301-188 and 300-169 vs. 301-188::ϕSA169; Table S9: DEGs up-regulated by both ϕSA169 and MRSA genetic backgrounds; Table S10: DEGs down-regulated by both ϕSA169 and MRSA genetic backgrounds; Table S11: Primers for qRT-PCR confirmation; Figure S1: KEGG analysis of the DEGs impacted by the distinct genetic backgrounds of 300-169 and 301-188.

Author Contributions

Conceptualization, Y.Q.X.; Formal analysis, Y.L., L.C. and Y.Q.X.; Investigation, Y.L. and F.Z.; Supervision, Y.Q.X.; Writing—original draft, Y.L. and Y.Q.X.; Writing—reviewing and editing, L.C. and A.S.B. All authors have read and agreed to the published version of the manuscript.

Funding

This work was funded by the National Institutes of Health/National Institute of Allergy and Infectious Diseases grant R01AI139244 to Y.Q.X.

Institutional Review Board Statement

Not applicable.

Informed Consent Statement

Not applicable.

Data Availability Statement

Not applicable.

Conflicts of Interest

The authors declare no conflict of interest.

References

  1. Fowler, V.G., Jr.; Miro, J.M.; Hoen, B.; Cabell, C.H.; Abrutyn, E.; Rubinstein, E.; Corey, G.R.; Spelman, D.; Bradley, S.F.; Barsic, B.; et al. Staphylococcus aureus endocarditis: A consequence of medical progress. JAMA 2005, 293, 3012–3021. [Google Scholar] [CrossRef] [PubMed]
  2. Klevens, R.M.; Morrison, M.A.; Nadle, J.; Petit, S.; Gershman, K.; Ray, S.; Harrison, L.H.; Lynfield, R.; Dumyati, G.; Townes, J.M.; et al. Invasive methicillin-resistant Staphylococcus aureus infections in the United States. JAMA 2007, 298, 1763–1771. [Google Scholar] [CrossRef] [PubMed]
  3. Fowler, V.G., Jr.; Sakoulas, G.; McIntyre, L.M.; Meka, V.G.; Arbeit, R.D.; Cabell, C.H.; Stryjewski, M.E.; Eliopoulos, G.M.; Reller, L.B.; Corey, G.R.; et al. Persistent bacteremia due to methicillin-resistant Staphylococcus aureus infection is associated with agr dysfunction and low-level in vitro resistance to thrombin-induced platelet microbicidal protein. J. Infect. Dis. 2004, 190, 1140–1149. [Google Scholar] [CrossRef] [PubMed]
  4. Xiong, Y.Q.; Fowler, V.G.; Yeaman, M.R.; Perdreau-Remington, F.; Kreiswirth, B.N.; Bayer, A.S. Phenotypic and genotypic characteristics of persistent methicillin-resistant Staphylococcus aureus bacteremia in vitro and in an experimental endocarditis model. J. Infect. Dis. 2009, 199, 201–208. [Google Scholar] [CrossRef]
  5. Seidl, K.; Chen, L.; Bayer, A.S.; Hady, W.A.; Kreiswirth, B.N.; Xiong, Y.Q. Relationship of agr expression and function with virulence and vancomycin treatment outcomes in experimental endocarditis due to methicillin-resistant Staphylococcus aureus. Antimicrob. Agents Chemother. 2011, 55, 5631–5639. [Google Scholar] [CrossRef] [PubMed]
  6. Li, L.; Yeaman, M.R.; Bayer, A.S.; Xiong, Y.Q. Phenotypic and genotypic characteristics of methicillin-resistant Staphylococcus aureus (MRSA) related to persistent endovascular infection. Antibiotics 2019, 8, 71. [Google Scholar] [CrossRef]
  7. Bae, T.; Baba, T.; Hiramatsu, K.; Schneewind, O. Prophages of Staphylococcus aureus Newman and their contribution to virulence. Mol. Microbiol. 2006, 62, 1035–1047. [Google Scholar] [CrossRef]
  8. Fernandez, L.; Gonzalez, S.; Campelo, A.B.; Martinez, B.; Rodriguez, A.; Garcia, P. Low-level predation by lytic phage phiIPLA-RODI promotes biofilm formation and triggers the stringent response in Staphylococcus aureus. Sci. Rep. 2017, 7, 40965. [Google Scholar] [CrossRef]
  9. Fernandez, L.; Gonzalez, S.; Quiles-Puchalt, N.; Gutierrez, D.; Penades, J.R.; Garcia, P.; Rodriguez, A. Lysogenization of Staphylococcus aureus RN450 by phages ϕ11 and ϕ80α leads to the activation of the SigB regulon. Sci. Rep. 2018, 8, 12662. [Google Scholar] [CrossRef]
  10. El Haddad, L.; Moineau, S. Characterization of a novel Panton-Valentine leukocidin (PVL)-encoding staphylococcal phage and its naturally PVL-lacking variant. Appl. Environ. Microbiol. 2013, 79, 2828–2832. [Google Scholar] [CrossRef] [Green Version]
  11. Li, L.; Wang, G.; Li, Y.; Francois, P.; Bayer, A.S.; Chen, L.; Seidl, K.; Cheung, A.; Xiong, Y.Q. Impact of the novel prophage ϕSA169 on persistent methicillin-resistant Staphylococcus aureus endovascular infection. mSystems 2020, 5, 3. [Google Scholar] [CrossRef] [PubMed]
  12. Hernandez, D.; Seidl, K.; Corvaglia, A.R.; Bayer, A.S.; Xiong, Y.Q.; Francois, P. Genome sequences of sequence type 45 (ST45) persistent methicillin-resistant Staphylococcus aureus (MRSA) bacteremia strain 300-169 and ST45 resolving MRSA bacteremia strain 301-188. Genome Announc. 2014, 2, 2. [Google Scholar] [CrossRef]
  13. Li, L.; Wang, G.; Cheung, A.; Abdelhady, W.; Seidl, K.; Xiong, Y.Q. MgrA governs adherence, host cell interaction, and virulence in a murine model of bacteremia due to Staphylococcus aureus. J. Infect. Dis. 2019, 220, 1019–1028. [Google Scholar] [CrossRef] [PubMed]
  14. Li, L.; Abdelhady, W.; Donegan, N.P.; Seidl, K.; Cheung, A.; Zhou, Y.F.; Yeaman, M.R.; Bayer, A.S.; Xiong, Y.Q. Role of purine biosynthesis in persistent methicillin-resistant Staphylococcus aureus infection. J. Infect. Dis. 2018, 218, 1367–1377. [Google Scholar] [CrossRef]
  15. Langmead, B.; Salzberg, S.L. Fast gapped-read alignment with Bowtie 2. Nat. Methods 2012, 9, 357–359. [Google Scholar] [CrossRef] [PubMed]
  16. Kanehisa, M.; Sato, Y.; Kawashima, M. KEGG mapping tools for uncovering hidden features in biological data. Protein Sci. 2022, 31, 47–53. [Google Scholar] [CrossRef] [PubMed]
  17. Abdelhady, W.; Chen, L.; Bayer, A.S.; Seidl, K.; Yeaman, M.R.; Kreiswirth, B.N.; Xiong, Y.Q. Early agr activation correlates with vancomycin treatment failure in multi-clonotype MRSA endovascular infections. J. Antimicrob. Chemother. 2015, 70, 1443–1452. [Google Scholar] [CrossRef]
  18. Abdelhady, W.; Bayer, A.S.; Seidl, K.; Moormeier, D.E.; Bayles, K.W.; Cheung, A.; Yeaman, M.R.; Xiong, Y.Q. Impact of vancomycin on sarA-mediated biofilm formation: Role in persistent endovascular infections due to methicillin-resistant Staphylococcus aureus. J. Infect. Dis. 2014, 209, 1231–1240. [Google Scholar] [CrossRef]
  19. Novick, R.P. Mobile genetic elements and bacterial toxinoses: The superantigen-encoding pathogenicity islands of Staphylococcus aureus. Plasmid 2003, 49, 93–105. [Google Scholar] [CrossRef]
  20. Kondo, K.; Kawano, M.; Sugai, M. Distribution of antimicrobial resistance and virulence genes within the prophage-associated regions in nosocomial pathogens. mSphere 2021, 6, e0045221. [Google Scholar] [CrossRef]
  21. Payne, D.J.; Warren, P.V.; Holmes, D.J.; Ji, Y.; Lonsdale, J.T. Bacterial fatty-acid biosynthesis: A genomics-driven target for antibacterial drug discovery. Drug Discov. Today 2001, 6, 537–544. [Google Scholar] [CrossRef]
  22. Fujita, Y.; Matsuoka, H.; Hirooka, K. Regulation of fatty acid metabolism in bacteria. Mol. Microbiol. 2007, 66, 829–839. [Google Scholar] [CrossRef]
  23. Fozo, E.M.; Scott-Anne, K.; Koo, H.; Quivey, R.G., Jr. Role of unsaturated fatty acid biosynthesis in virulence of Streptococcus mutans. Infect. Immun. 2007, 75, 1537–1539. [Google Scholar] [CrossRef]
  24. Yamamoto, Y.; Pargade, V.; Lamberet, G.; Gaudu, P.; Thomas, F.; Texereau, J.; Gruss, A.; Trieu-Cuot, P.; Poyart, C. The Group B Streptococcus NADH oxidase Nox-2 is involved in fatty acid biosynthesis during aerobic growth and contributes to virulence. Mol. Microbiol. 2006, 62, 772–785. [Google Scholar] [CrossRef] [PubMed]
  25. Wang, J.; Soisson, S.M.; Young, K.; Shoop, W.; Kodali, S.; Galgoci, A.; Painter, R.; Parthasarathy, G.; Tang, Y.S.; Cummings, R.; et al. Platensimycin is a selective FabF inhibitor with potent antibiotic properties. Nature 2006, 441, 358–361. [Google Scholar] [CrossRef] [PubMed]
  26. Sause, W.E.; Balasubramanian, D.; Irnov, I.; Copin, R.; Sullivan, M.J.; Sommerfield, A.; Chan, R.; Dhabaria, A.; Askenazi, M.; Ueberheide, B.; et al. The purine biosynthesis regulator PurR moonlights as a virulence regulator in Staphylococcus aureus. Proc. Natl. Acad. Sci. USA 2019, 116, 13563–13572. [Google Scholar] [CrossRef]
  27. Lan, L.; Cheng, A.; Dunman, P.M.; Missiakas, D.; He, C. Golden pigment production and virulence gene expression are affected by metabolisms in Staphylococcus aureus. J. Bacteriol. 2010, 192, 3068–3077. [Google Scholar] [CrossRef]
  28. Goncheva, M.I.; Flannagan, R.S.; Sterling, B.E.; Laakso, H.A.; Friedrich, N.C.; Kaiser, J.C.; Watson, D.W.; Wilson, C.H.; Sheldon, J.R.; McGavin, M.J.; et al. Stress-induced inactivation of the Staphylococcus aureus purine biosynthesis repressor leads to hypervirulence. Nat. Commun. 2019, 10, 775. [Google Scholar] [CrossRef]
  29. Chai, Y.; Beauregard, P.B.; Vlamakis, H.; Losick, R.; Kolter, R. Galactose metabolism plays a crucial role in biofilm formation by Bacillus subtilis. mBio 2012, 3, e00184-12. [Google Scholar] [CrossRef]
  30. Miallau, L.; Hunter, W.N.; McSweeney, S.M.; Leonard, G.A. Structures of Staphylococcus aureus D-tagatose-6-phosphate kinase implicate domain motions in specificity and mechanism. J. Biol. Chem. 2007, 282, 19948–19957. [Google Scholar] [CrossRef] [Green Version]
  31. Cui, L.; Isii, T.; Fukuda, M.; Ochiai, T.; Neoh, H.M.; Camargo, I.L.; Watanabe, Y.; Shoji, M.; Hishinuma, T.; Hiramatsu, K. An RpoB mutation confers dual heteroresistance to daptomycin and vancomycin in Staphylococcus aureus. Antimicrob. Agents Chemother. 2010, 54, 5222–5233. [Google Scholar] [CrossRef] [PubMed]
  32. Deutscher, J.; Francke, C.; Postma, P.W. How phosphotransferase system-related protein phosphorylation regulates carbohydrate metabolism in bacteria. Microbiol. Mol. Biol. Rev. 2006, 70, 939–1031. [Google Scholar] [CrossRef] [PubMed]
  33. Gera, K.; Le, T.; Jamin, R.; Eichenbaum, Z.; McIver, K.S. The phosphoenolpyruvate phosphotransferase system in group A Streptococcus acts to reduce streptolysin S activity and lesion severity during soft tissue infection. Infect. Immun. 2014, 82, 1192–1204. [Google Scholar] [CrossRef] [PubMed]
  34. Kok, M.; Bron, G.; Erni, B.; Mukhija, S. Effect of enzyme I of the bacterial phosphoenolpyruvate: Sugar phosphotransferase system (PTS) on virulence in a murine model. Microbiology 2003, 149, 2645–2652. [Google Scholar] [CrossRef]
  35. Egan, J.B.; Morse, M.L. Carbohydrate transport in Staphylococcus aureus I. Genetic and biochemical analysis of a pleiotropic transport mutant. Biochim. Biophys. Acta 1965, 97, 310–319. [Google Scholar] [CrossRef]
Figure 1. Principle component analysis (PCA) of RNA-seq results of 300-169, 301-188, and 301-188::ϕSA169 strains. The X-axis represents the first principal component (PC1) that displays the maximum variation through the data, while the Y-axis represents the second principal component (PC2) that displays the next highest variation. Each dot represents a biological duplicate of a study strain. The replicates of each study strain were well clustered, indicating the good reproducibility of the samples in each strain. RNA-seq results of the study strains were scattered in the graph, which indicated the significant genetic variations of the study strains.
Genes 13 01527 g001
Figure 2. Volcano plots displayed the genes differentially expressed in (a) 301-188::ϕSA169 vs. 301-188; (b) 300-169 vs. 301-188; (c) 300-169 vs. 301-188::ϕSA169. The genes with p adj ≤ 0.05 and |log2(fold change)| > 0 were defined as differentially expressed genes (DEGs) and were labeled in red.
Genes 13 01527 g002
Figure 3. Transcriptional analysis of ϕSA169 genes in 300-169 (black bars) and 301-188::ϕSA169 (white bars). The transcriptional profiles of ϕSA169 in 300-169 and 301-188::ϕSA169 were similar, and genes from the packing and morphogenesis module had higher expression levels than genes from other modules. Expression levels of some ϕSA169 genes, especially the genes from packing and morphogenesis, were significantly higher in 300-169 compared to 301-188::ϕSA169. * p adj < 0.05, ** p adj < 0.01, *** p adj < 0.001.
Genes 13 01527 g003
Figure 4. Venn diagram of the DEGs from the comparisons carried out between the study strains. The overlapping DEGs of 300-169 vs. 301-188 and 301-188::ϕSA169 vs. 301-188 might represent the genes specifically affected by ϕSA169, while the overlapping DEGs of 300-169 vs. 301-188 and 300-169 vs. 301-188::ϕSA169 might represent the genes specifically affected by the distinct genetic backgrounds. (a) Up-regulated DEGs: 300-169 vs. 301-188 and 301-188::ϕSA169 vs. 301-188 had 65 (29 + 36) overlapping DEGs; 300-169 vs. 301-188 and 300-169 vs. 301-188::ϕSA169 had 555 (519 + 36) overlapping DEGs; all the three comparisons had 36 overlapping DEGs. (b) Down-regulated DEGs: 300-169 vs. 301-188 and 301-188::ϕSA169 vs. 301-188 had 45 (22 + 23) overlapping DEGs; 300-169 vs. 301-188 and 300-169 vs. 301-188::ϕSA169 had 546 (523 + 23) overlapping DEGs, all the three comparisons have 23 overlapping DEGs.
Genes 13 01527 g004
Figure 5. KEGG analysis of the DEGs from (a) 301-188::ϕSA169 vs. 301-188; (b) 300-169 vs. 301-188; (c) 300-169 vs. 301-188::ϕSA169. 301-188::ϕSA169 vs. 301-188 had significantly more DEGs down-regulated than the DEGs up-regulated, and most DEGs were related to metabolic pathways. 300-169 vs. 301-188 and 300-169 vs. 301-188::ϕSA169 had similar KEGG analysis profiles; most of the DEGs were involved in metabolism.
Genes 13 01527 g005
Figure 6. KEGG analysis of the DEGs impacted by ϕSA169. Fatty acid biosynthesis had the most genes up-regulated, compared to the other pathways, while galactose metabolism and phosphotransferase system (PTS) were the pathways that had most genes down-regulated.
Genes 13 01527 g006
Figure 7. Verification of selected genes fabH, purA, lacF, and treP using qRT-PCR. The fold changes of the selected genes determined by qRT-PCR (white bars) were consistent with the values obtained by RNA-seq (black bars) in both comparisons of (a) 301-188::ϕSA169 vs. 301-188 and (b) 300-169 vs. 301-188.
Genes 13 01527 g007
Table 1. A comparison of differentially expressed genes (DEGs) between the study strains.
No. of Total DEGsNo. of Up-Regulated DEGsNo. of Down-Regulated DEGs
301-188::ϕSA169 vs. 301-1881537776
300-169 vs. 301-1881299666633
300-169 vs. 301-188::ϕSA1691250637613
Table 2. DEGs up-regulated by ϕSA169.
Log2(Fold Change)
Gene LocusGroup301-188::ϕSA169 vs. 301-188300-169 vs. 301-188Products
AS94_02505host genes0.930.71MerR family transcriptional regulator
AS94_041150.420.72fabH, 3-oxoacyl-ACP synthase
AS94_041200.581.09fabF, 3-oxoacyl-ACP synthase
AS94_047800.511.29amino acid permease
AS94_051600.690.86Na/Pi cotransporter
AS94_055400.441.64glycine/betaine ABC transporter permease
AS94_058600.560.68guanine permease
AS94_060800.661.52hypothetical protein
AS94_060900.500.70octopine dehydrogenase
AS94_063100.481.09sodium:glutamate symporter
AS94_073850.711.00transglycosylase
AS94_089250.500.51DEAD/DEAH box helicase
AS94_112750.472.59purA, adenylosuccinate synthetase
AS94_119850.420.93multidrug ABC transporter ATP-binding protein
AS94_120300.370.70general stress protein
AS94_124100.421.23ribonuclease BN
AS94_12040ϕSA169 genes7.118.46hypothetical protein
AS94_1204512.6512.89XRE family transcriptional regulator
AS94_1205010.2611.22hypothetical protein
AS94_120559.9410.84autolysin
AS94_120607.658.65holin
AS94_120658.709.21hypothetical protein
AS94_1207010.9711.98tail protein
AS94_1207511.7312.79cell wall hydrolase
AS94_120808.849.51hypothetical protein
AS94_120907.308.65hypothetical protein
AS94_1209511.2912.19hypothetical protein
AS94_1210011.7612.57minor structural protein
AS94_1210511.6312.72peptidase
AS94_1211010.2511.46phage tail protein
AS94_1211513.0713.92membrane protein
AS94_121208.679.90ϕ11_gp41
AS94_121259.2010.46hypothetical protein
AS94_1213011.1812.24tail protein
AS94_121358.789.81ϕ11_gp38
AS94_121407.899.24hypothetical protein
AS94_121457.158.87hypothetical protein
AS94_121508.6910.26phage head-tail adapter protein
AS94_121556.858.35ϕ11_gp35
AS94_1216011.8112.91hypothetical protein
AS94_1216511.9713.41phage capsid protein
AS94_121706.297.51hypothetical protein
AS94_1217511.2112.22phage head morphogenesis protein
AS94_1218011.6112.56phage portal protein
AS94_1218510.8912.01hypothetical protein
AS94_1219010.1411.07terminase
AS94_1219510.049.18transcriptional regulator
AS94_122108.227.00hypothetical protein
AS94_122157.155.65hypothetical protein
AS94_122209.859.62dut, dUTP pyrophosphatase
AS94_122306.696.41hypothetical protein
AS94_122408.848.52hypothetical protein
AS94_122705.766.56DNA N-6-adenine-methyltransferase
AS94_122959.669.80hypothetical protein
AS94_123205.725.64hypothetical protein
AS94_1232510.1310.26hypothetical protein
AS94_123306.366.05hypothetical protein
AS94_123406.277.58hypothetical protein
AS94_1234511.8812.34BRO-like protein
AS94_1235010.4710.70hypothetical protein
AS94_123558.098.50XRE family transcriptional regulator
AS94_1236012.8812.46transcriptional regulator
AS94_123658.868.90ϕ80α_gp05
AS94_1237012.9813.02repressor
AS94_1237510.3810.92integrase
Table 3. DEGs down-regulated by ϕSA169.
Log2(Fold Change)
Gene LocusGroup301-188::ϕSA169 vs. 301-188300-169 vs. 301-188Products
AS94_03800host genes−0.82−2.38cysteine protease
AS94_04675−0.39−0.50sdrD, hydrolase
AS94_05575−0.74−2.33lacE, PTS lactose transporter subunit IIBC
AS94_05580−1.11−3.04lacF, PTS lactose transporter subunit IIA
AS94_05585−0.81−2.57lacD, tagatose-bisphosphate aldolase
AS94_05590−0.85−2.37lacC, tagatose-6-phosphate kinase
AS94_05595−1.09−2.30lacB, galactose-6-phosphate isomerase
AS94_05600−0.76−2.60lacA, galactose-6-phosphate isomerase
AS94_06915−0.54−0.84nikA, nickel ABC transporter substrate-binding protein
AS94_07070−0.39−0.70gntk, gluconokinase
AS94_08235−0.48−0.83pfkB, phosphofructokinase
AS94_08280−0.48−0.40hypothetical protein
AS94_09210−0.58−1.88general stress protein
AS94_10090−0.86−0.78murein hydrolase regulator lrgA, LrgA
AS94_10365−0.78−1.53sialic acid transporter
AS94_10370−0.84−1.75nanA, N-acetylneuraminate lyase
AS94_10375−0.37−0.87N-acetylmannosamine kinase
AS94_11050−0.67−0.81treP, PTS ascorbate transporter subunit IIA
AS94_11645−0.38−0.35pyridoxal biosynthesis protein
AS94_12380−0.90−0.88hypothetical protein
AS94_12875−0.43−0.72hld, delta-hemolysin
AS94_13070the mutual prophage in 300-169 and 301-188−1.47−2.34autolysin
AS94_13075−1.69−3.25holin
AS94_13080−1.68−2.51hypothetical protein
AS94_13090−2.18−2.40hypothetical protein
AS94_13095−1.70−2.35hypothetical protein
AS94_13100−1.53−2.07minor structural protein
AS94_13110−1.72−2.18peptidase
AS94_13115−1.90−2.25holin
AS94_13120−1.62−2.11tail protein
AS94_13130−2.75−2.80hypothetical protein
AS94_13135−1.42−2.07tail protein
AS94_13140−2.01−2.12tail protein
AS94_13150−1.85−1.72hypothetical protein
AS94_13160−2.00−2.24hypothetical protein
AS94_13165−1.93−2.10phage capsid protein
AS94_13170−2.19−2.07ATP-dependent Clp protease ClpP
AS94_13175−1.61−1.79portal protein
AS94_13180−1.71−1.80terminase
AS94_13185−1.74−1.59terminase
AS94_13190−2.02−1.49HNH endonuclease
AS94_13195−0.73−1.93transcriptional regulator
AS94_13200−0.89−1.56helicase
AS94_13205−0.75−1.44hypothetical protein
AS94_13355−0.46−0.74antirepressor
Publisher’s Note: MDPI stays neutral with regard to jurisdictional claims in published maps and institutional affiliations.

