Article

Meta-Analysis of SNPs Determining Litter Traits in Pigs

by
Ewa Sell-Kubiak
1,*,
Jan Dobrzanski
1,
Martijn F. L. Derks
2,
Marcos S. Lopes
2,3 and
Tomasz Szwaczkowski
1
1
Department of Genetics and Animal Breeding, Poznań University of Life Sciences, Wołyńska 33, 60-637 Poznań, Poland
2
Topigs Norsvin Research Centre, Schoenaker 6, 6641 SZ Beuningen, The Netherlands
3
Topigs Norsvin, R. Visc. do Rio Branco, 1310-Centro, Curitiba 80420-210, PR, Brazil
*
Author to whom correspondence should be addressed.
Genes 2022, 13(10), 1730; https://doi.org/10.3390/genes13101730
Submission received: 30 August 2022 / Revised: 16 September 2022 / Accepted: 20 September 2022 / Published: 26 September 2022
(This article belongs to the Special Issue Trends and Prospects in Pig Genomics and Genetics)

Abstract

:
Nearly 2000 SNPs associated with pig litter size traits have been reported based on genome-wide association studies (GWASs). The aims of this study were to gather and integrate previously reported associations between SNPs and five litter traits: total number born (TNB), number born alive (NBA), number of stillborn (SB), litter birth weight (LWT), and corpus luteum number (CLN), in order to evaluate their common genetic background and to perform a meta-analysis (MA) of GWASs for total number born (TNB) recorded for animals from five pig populations. In this study, the genes with the largest number of associations with evaluated litter traits were GABRG3, RBP7, PRKD1, and STXBP6. Only 21 genes out of 233 associated with the evaluated litter traits were reported in more than one population or for more than one trait. Based on this evaluation, the most interesting candidate gene is PRKD1, which has an association with SB and TNB traits. Based on GO term analysis, PRKD1 was shown to be involved in angiogenesis as well. As a result of the MA, two new genomic regions, which have not been previously reported, were found to be associated with the TNB trait. One SNP was located on Sus scrofa chromosome (SSC) 14 in the intron of the FAM13C gene. The second SNP was located on SSC9 within the intron of the AGMO gene. Functional analysis revealed a strong candidate causal gene underlying the QTL on SSC9. The third best hit and the most promising candidate gene for litter size was found within the SOSTDC1 gene, associated with lower male fertility in rats. We showed that litter traits studied across pig populations have only a few genomic regions in common based on candidate gene comparison. PRKD1 could be an interesting candidate gene with a wider association with fertility. The MA identified new genomic regions on SSC9 and SSC14 associated with TNB. Further functional analysis indicated the most promising gene was SOSTDC1, which was confirmed to affect male fertility in other mammals. This is an important finding, as litter traits are by default linked with females rather than males.

1. Introduction

Since the discovery of the first genomic association between litter size and estrogen receptors in 1996 [1], there have been high hopes of finding more major genomic regions for reproduction traits [2]. Currently, one of the most popular methods for uncovering the associations between traits and genes is genome-wide association study (GWAS) using single nucleotide polymorphism (SNP) markers [2,3,4]. Genomic regions related to litter traits were revealed by GWAS in various farm animal species, including rabbits [5,6], goats [7,8], cattle [9], and pigs [10,11,12]. Although GWAS has presented some shortcomings resulting from the rigid structure of the chips and uneven distribution of markers across the chromosomes, those studies still provided the greatest insight into the genetic bases of many reproduction traits in a variety of pig populations [10].
Many results of GWAS and earlier QTL mapping are stored in the Pig QTL database [13]. Although it doesn’t store all associations reported in the literature, this database is a highly important source of information and gathers 30,869 QTLs for 692 traits, with 1625 of those being QTLs for litter traits. Among those QTLs, 356 are related to total number born (TNB), 223 to number born alive (NBA), 137 to number of stillborn (SB), 52 to litter birth weight (LWT), and 130 to corpus luteum number (CLN). The reported QTL regions were in most cases identified using SNPs in GWASs.
Even though those studies were performed on different populations, they often used the same SNP chips and statistical methodology. However, the results of those studies are not repeatable across breeds or even within one breed. This lack of overlap among GWAS results for TNB and NBA was recently described in a review by Bakoev et al. [12]. Moreover, litter traits proved to be highly complex polygenic traits. This, in contrast to production traits such as backfat and growth rate that have several major genes confirmed [14,15,16], resulted in detection of only one major QTL, the previously mentioned estrogen receptor [1].
Despite the high number of studies and QTLs reported for litter traits, no research aimed at reviewing the existing results of GWASs for several litter traits in a more systematic manner. One of the main approaches to integrate and pool the results from single GWASs is a meta-analysis (MA). The GWAS MA is widely used in medical research and is becoming more popular in livestock studies [17,18,19]. Meta-analysis could also be used to increase the power of association studies by combining datasets from different sources and reducing false positive associations [20,21]. This also could help indicate new major QTLs for litter traits.
Therefore, the aims of this study were to (1) gather and integrate previously reported associations between SNPs and five litter traits: total number born (TNB), number born alive (NBA), number of stillborn (SB), litter birth weight (LWT), and corpus luteum number (CLN) to evaluate their common genetic background; (2) investigate the relationships among reported candidate genes for litter traits by searching for functional interactions among proteins encoded by those genes; and (3) combine the full GWAS results from several studies to identify the effects of gene sets in a meta-analysis.

2. Materials and Methods

This study’s main objectives were to: (1) gather and integrate previously reported associations between SNPs and five litter traits: total number born (TNB), number born alive (NBA), number of stillborn (SB), litter birth weight (LWT), and corpus luteum number (CLN) to evaluate their common genetic background; (2) investigate the relationships among reported candidate genes for litter traits by searching for functional interactions among proteins encoded by those genes; and (3) combine the full GWAS results from several studies to identify the effects of gene sets in a meta-analysis. This was performed using two datasets. Dataset A (Tables S1–S5; Supplementary_Tables) refers to the data generated from significant SNPs reported in studies performed for five traits: total number born (TNB), number born alive (NBA), number of stillborn (SB), litter birth weight (LWT), and corpus luteum number (CLN). Dataset B refers to data created from full GWAS results for TNB generated in five studies: [10,22,23,24,25] (Table 1).

2.1. Dataset A

To create dataset A, this part of the study was performed following the guidelines from “Genome-wide association studies meta-analysis” by Thompson et al. [26]. The selection of published GWAS results included in the analysis was conducted from March 2020 to December 2020 within the following databases: Web of Knowledge, Web of Science, PubMed, and Google Scholar. Studies reporting associations between SNPs and TNB, NBA, SB, LWT, or CLN were collected using various combinations of the following terms: “pig”, “litter size”, “total number born”, “number born alive”, “litter size”, “SNP”, “litter birth weight”, ”stillbirth”, “born dead”, “ovulation”, “corpus luteum number”, “polymorphism”, and “GWAS”. Later, the survey was supported by searching for QTL associations in the Pig QTL database and also by screening the references of retrieved papers. The complete data collected for dataset A are presented in Supplementary_Tables in Tables S1–S5, which include Sus scrofa chromosome (SSC) location, allele, candidate gene, and breed. The general overview of dataset A is presented in Table 2.

2.2. Dataset B

Dataset B was created by merging complete results of GWAS for TNB from five publications: Uimari et al. [22], Sell-Kubiak et al. [23], Ma et al. [25], Balogh et al. [24], and Zhang et al. [10]. The dataset created after merging the results from the five GWASs consisted of 63,531 SNPs available for further analysis. A specific overview of data collected in dataset B is presented in Table 1. In short, the data came from five different populations: Finnish Landrace, Large White, Erhualian, Duroc, and Hungarian Large White, and different methods were applied to perform the GWASs: single-SNP mixed model with pedigree additive relationship matrix or with genomic relationship matrix, and multiple-SNP Bayesian approach (Table 1). All populations were genotyped with Porcine SNP60 Bead Chip. The GWAS data from Sell-Kubiak et al. [23] covered phenotypes presented in a published paper, whereas the p-values of SNPs are the result of the single-SNP GWAS with genomics relationship matrix (more details in Supplementary_Method) and were not published in the mentioned paper.

2.3. Gene Ontology Analysis

Analysis of gene ontology (GO) terms [45] assigned to candidate genes collected in dataset A was performed using the PANTHER classification system Version 16 [46] with the newest available Ensembl Sscrofa11.1 as a reference genome. The analysis was performed with the binomial test of overrepresentation to explore biological processes in which the candidate genes are involved [46]. Results from the PANTHER were considered statistically significant at a false discovery rate (FDR)-corrected p-value ≤ 0.05 [47]. This analysis was performed on all candidate genes for five litter traits simultaneously.

2.4. Gene Network Analysis

The gene network analysis was performed with GeneMANIA [48] as a plug-in to Cytoscape v3.8.2 [49], with the human gene annotation as a reference. Settings allowed the authors to evaluate co-expression, physical interaction, gene interactions, shared protein domains, and co-localization. This analysis was performed only on candidate genes from dataset A that either had at least two SNPs detected along their sequence (Table 3) or were associated with more than one trait or presented in more than one study (Table 4).

2.5. Protein–Protein Interactions

Interactions between proteins coded by candidate genes reported in dataset A were investigated using a protein–protein interactions network using STRING Genomics v.11 [50]. The level of confidence for observed protein–protein interactions was limited to medium confidence interactions with scores > 0.40 with remaining settings at default [51].

2.6. Meta-Analysis on Dataset B

To combine estimates of SNP associations for TNB obtained from different populations, MA was performed on dataset B. Based on Garrick et al. [52], the decision was made that despite different definitions of phenotypes for TNB, the five datasets can be combined into one. All available 63,531 SNPs were included in the MA based on the weighted Z-score model. This approach considers the p-value, direction of effect, and number of individuals present in each study and was performed using METAL software [53]. The weighted Z-score model was chosen in accordance with Van den Berg et al. [54], who indicated this method as the most preferable when combining GWAS results with differences in the definition of the phenotypes, as is present in dataset B. Post-MA, the Bonferroni correction was applied to establish statistically significant associations. In addition, MA was performed in several runs with subsets of SNPs as follows: with all SNPs, with SNPs from at least 2 populations, with SNPs from at least 4 populations, and with SNPs present in all populations.
The evaluation of candidate genes found with the MA was performed with Bgee Version 14.2 (https://bgee.org/api/, accessed on 26 August 2022), GeneCards [55] and Ensembl BioMart.

2.7. Candidate Genes and Causal Variants

To assess possible candidate genes and variants underlying GWAS peaks, we also used the pCADD pipeline as described in [56]. In short, we extracted all sequence variants in linkage disequilibrium (LD) with the top SNP from the meta-GWAS. The candidate variants in LD with the top SNP were ranked according to their pCADD score. pCADD provides a per-base impact score [57] to distinguish between variants that likely have impact (positive or negative) and variants that are benign. The pipeline additionally provides gene annotation and functional genomic information to further fine-map the QTL region.

3. Results

In this study, two datasets were analyzed. First, dataset A (Tables S1–S5; Supplementary_Tables) refers to the data generated from significant SNPs reported in GWASs performed for five traits: total number born (TNB), number born alive (NBA), number of stillborn (SB), litter birth weight (LWT), and corpus luteum number (CLN). Second, dataset B refers to data created from full GWAS results for TNB generated in five studies [10,22,23,24,25] (Table 1).

3.1. SNPs and Candidate Genes from Dataset A

In total, 24 papers that studied at least one of the litter traits of interest were found (Tables S1–S5; Supplementary_Tables). Most of these studies focused on TNB and NBA, while studies for SB, LWT, and CLN were more limited (Table 2). The most common breeds evaluated in these studies were Large White, Yorkshire, Landrace, Duroc, and their crosses, with occasional occurrence of Erhualian and Berkshire. The definition of phenotypes varied across the publications and traits. While most of the publications used direct measurement of the trait, some authors chose deregressed breeding values as phenotypes [10,22,23]. In addition, in two studies, TNB phenotypes were divided into TNB at the first parity and the later parities [22,25].
The highest number of associations among SNPs and analyzed traits was reported as expected for TNB and NBA (Table 2), as those were the most-studied traits. Identified SNPs were rarely placed within the candidate gene. Most SNPs identified to be associated with the evaluated traits were located at least 50 Kbp away from the candidate gene. Only in the case of TNB, NBA, and SB were at least two SNPs with significant association with these traits in one population located within the candidate gene regions (Table 3). Genes with the largest number of associations along their sequences were GABRG3, RBP7, PRKD1, and STXBP6. Furthermore, only 21 genes out of 233 associated with the selected litter traits were reported in more than one population or for more than one trait (Table 4). For one gene out of this list (DDAH1) the overlap was expected, as the two studies reporting it were based on data from the same population [25,29]. This was not the case for the remaining populations presented in Table 4.

3.2. GO Term Analysis Results

In total 34 GO terms related to the biological processes were found (FDR < 0.05; Table 5). The most promising biological processes were “positive regulation of blood vessel endothelial cell migration”, describing genes NRP1, PIK3C2A, HDAC9, AKT3, and PRKD, and “positive regulation of cell migration involved in sprouting angiogenesis”, describing NRP1, PIK3C2A, HDAC9, and AKT3. Surprisingly, the majority of the remaining GO terms were involved with processes in nervous system development or regulation.

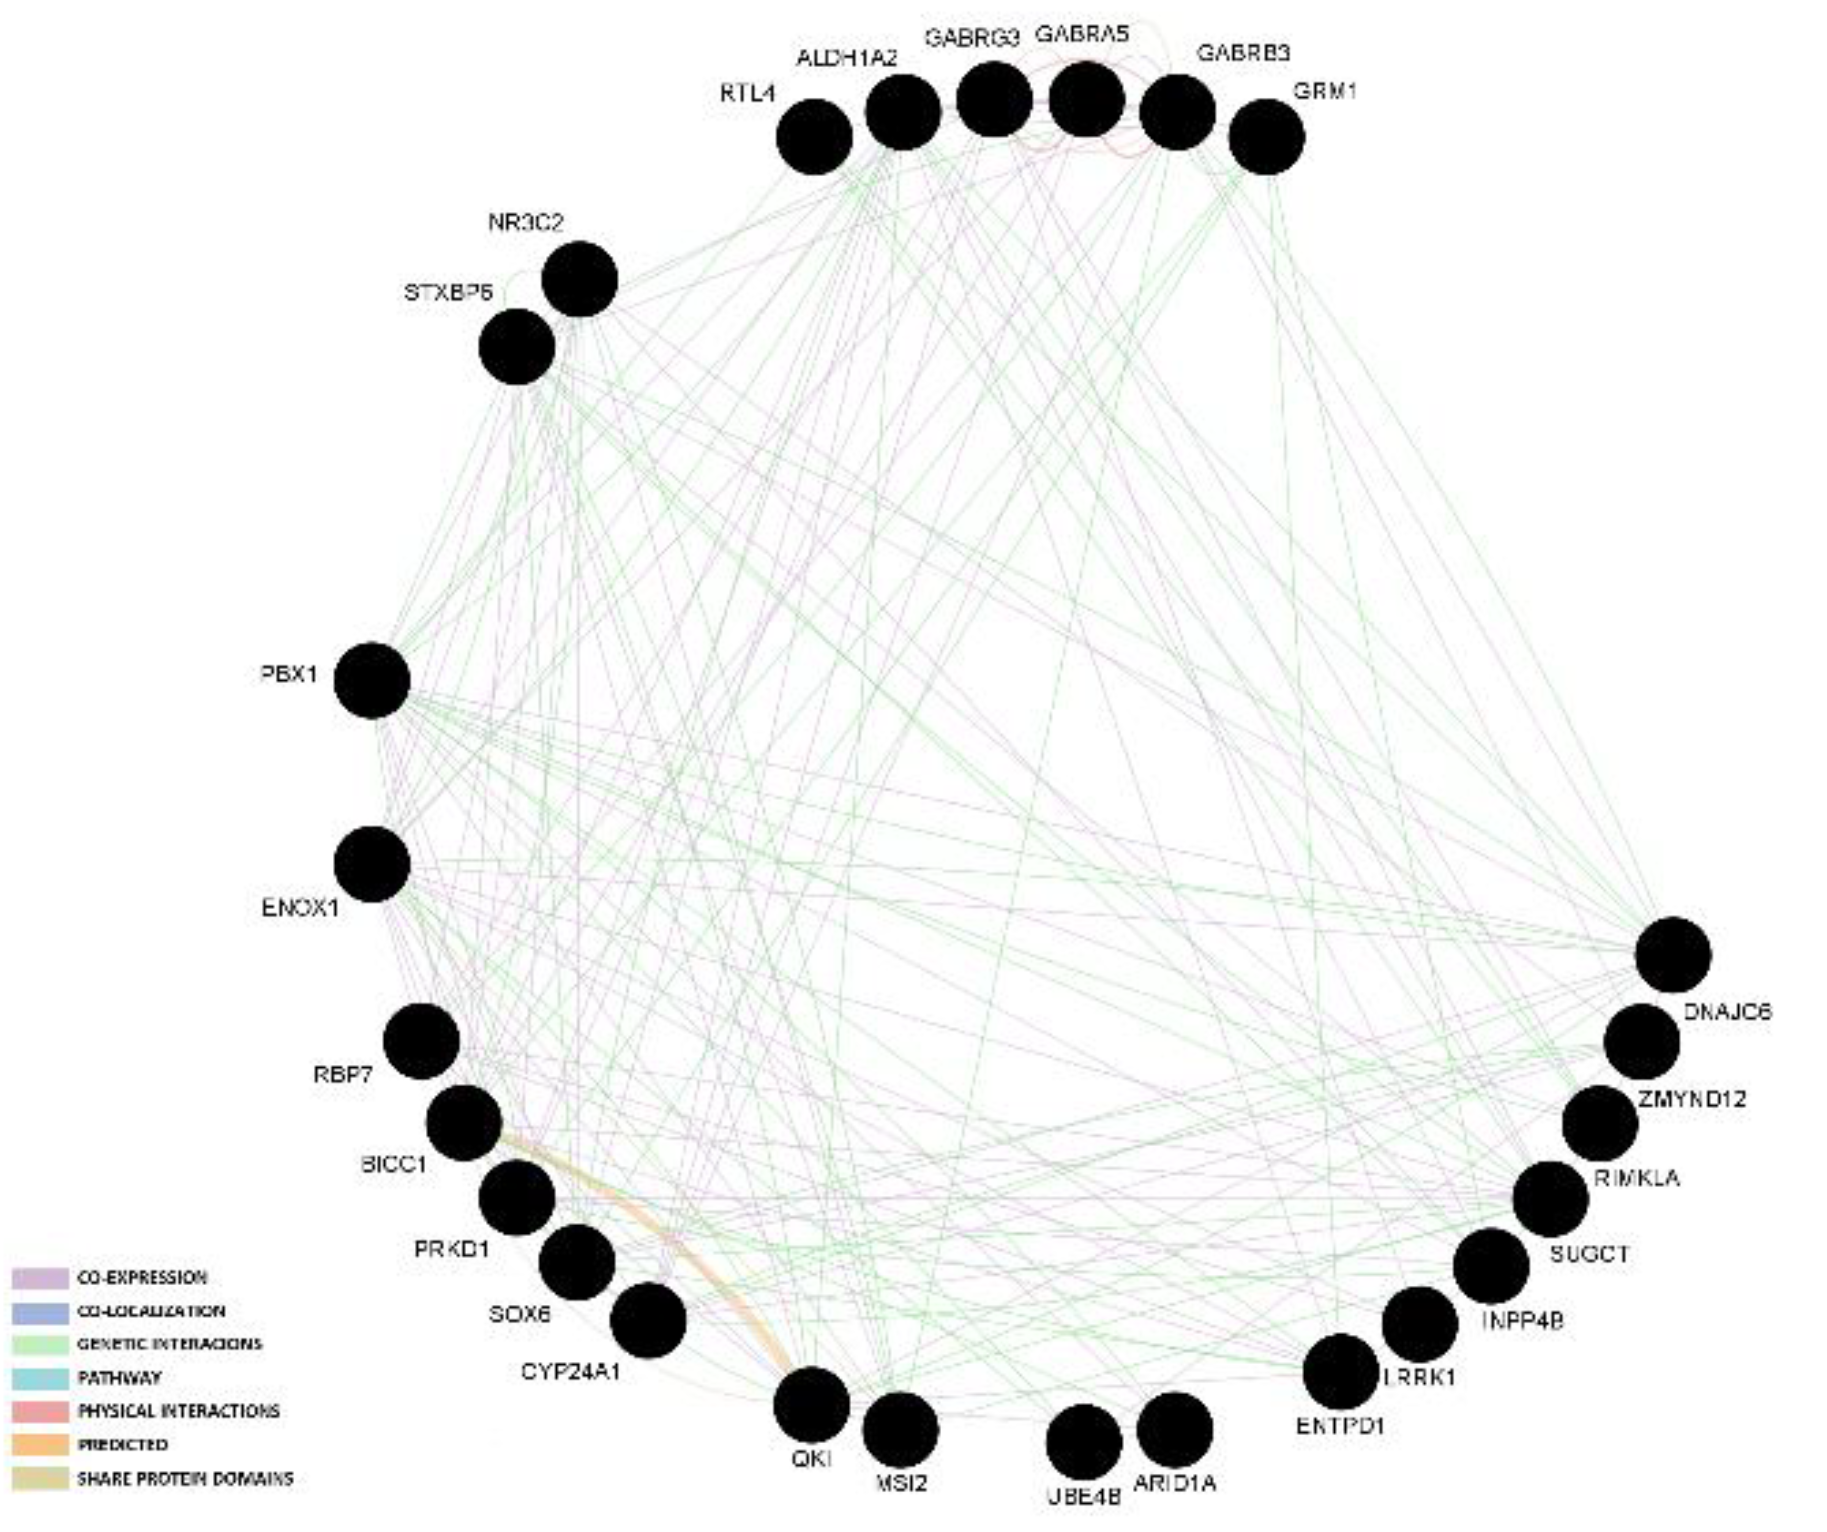
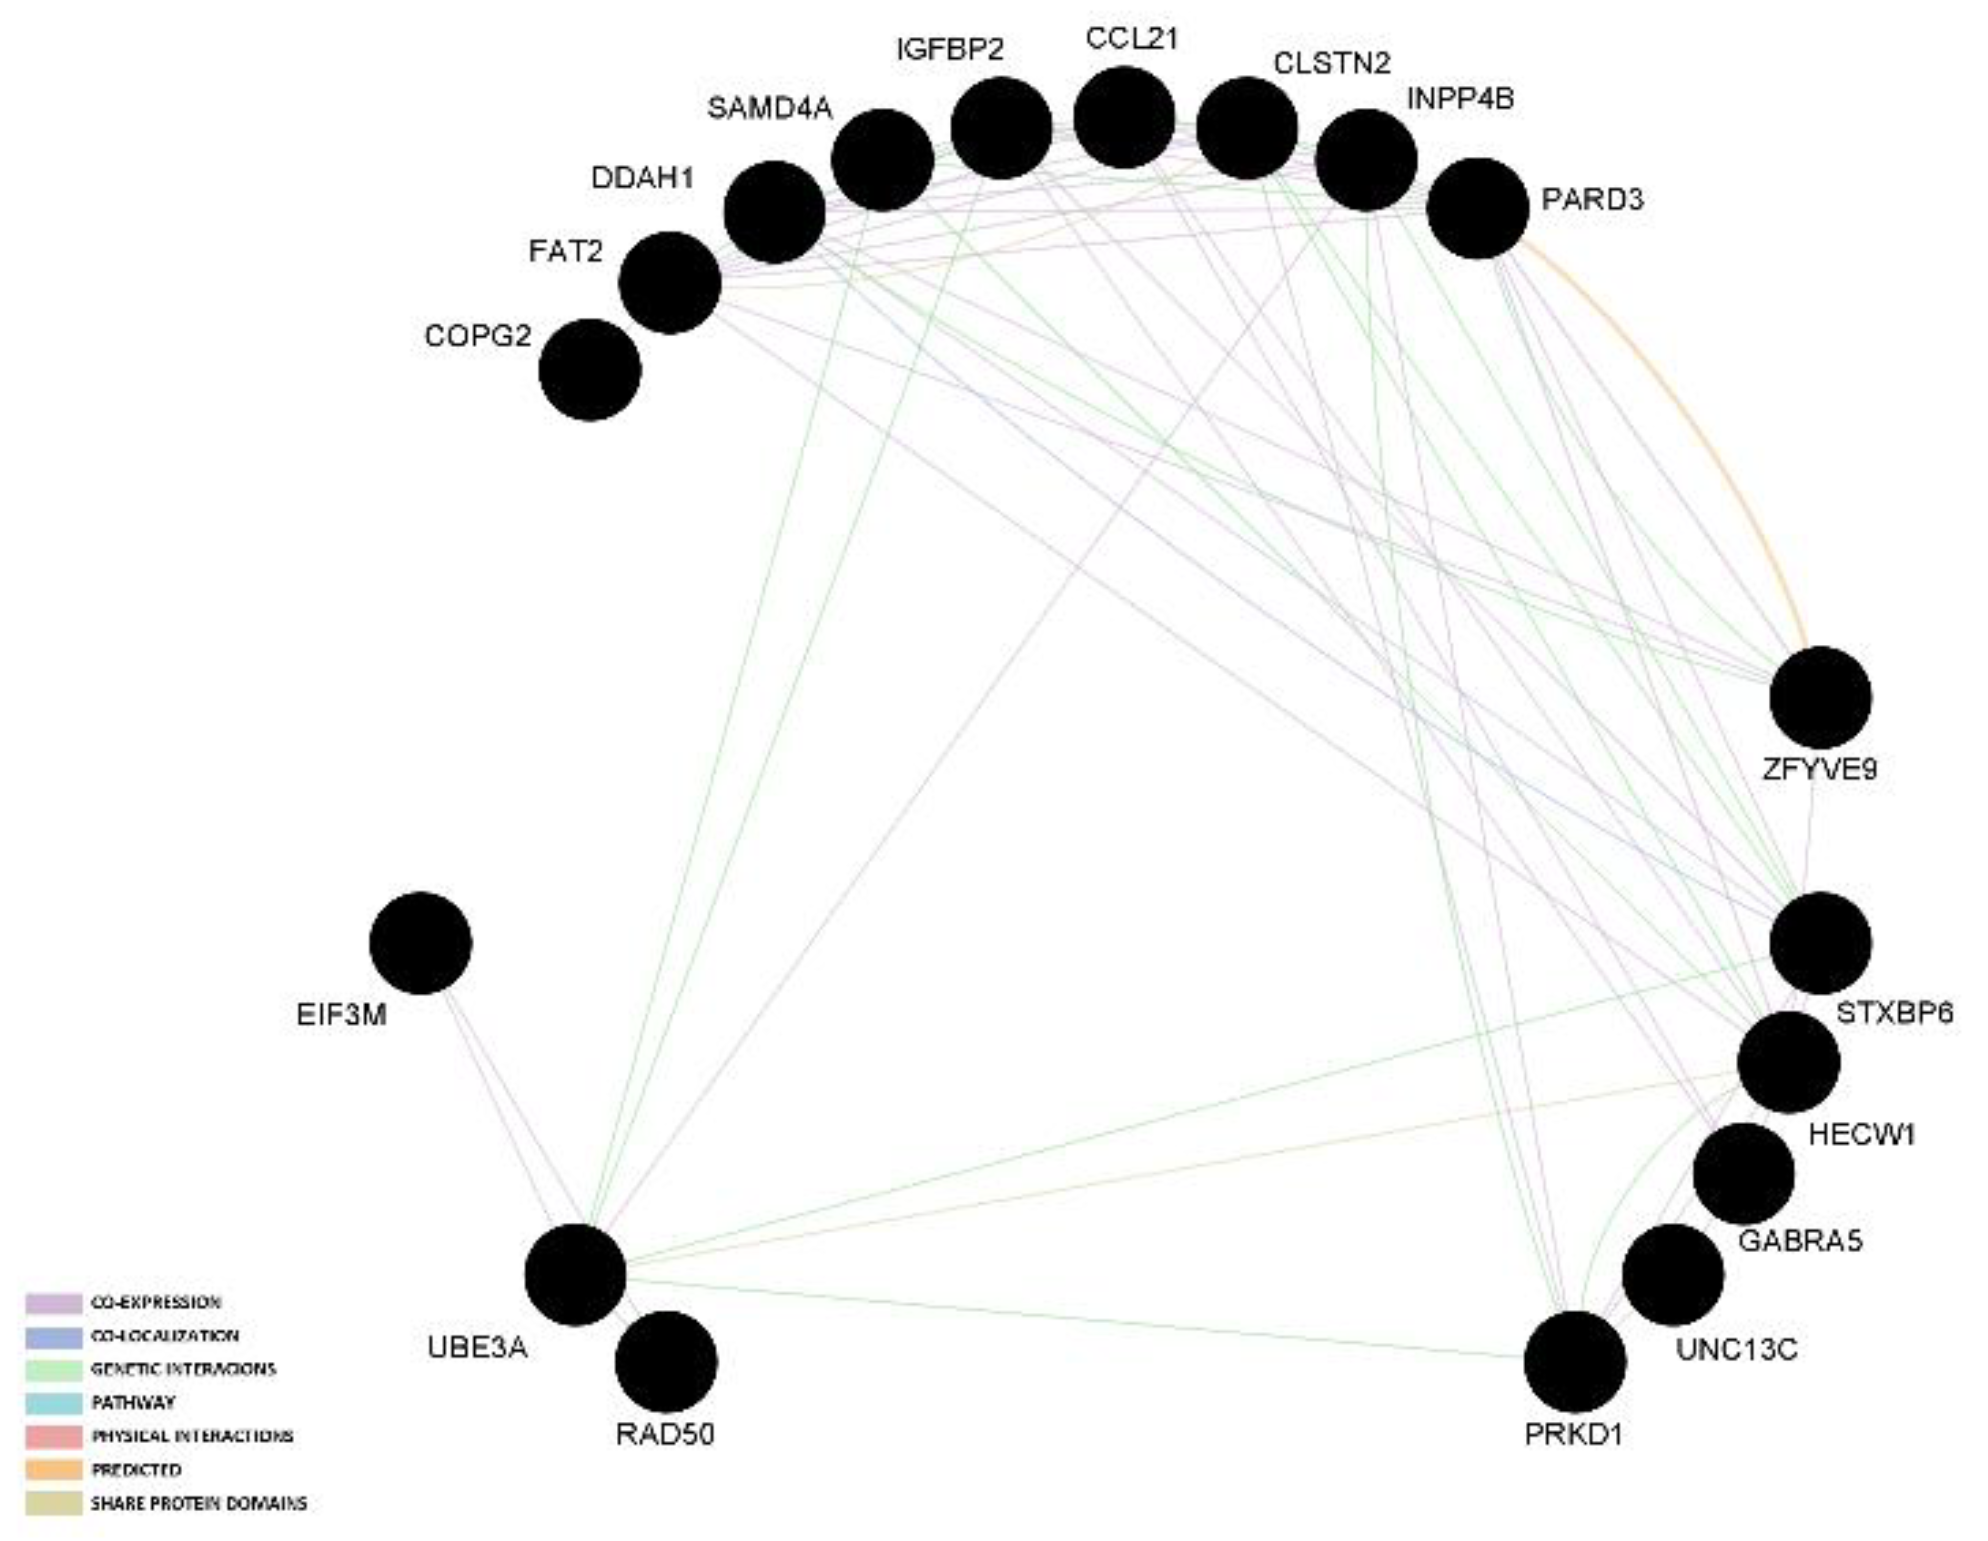
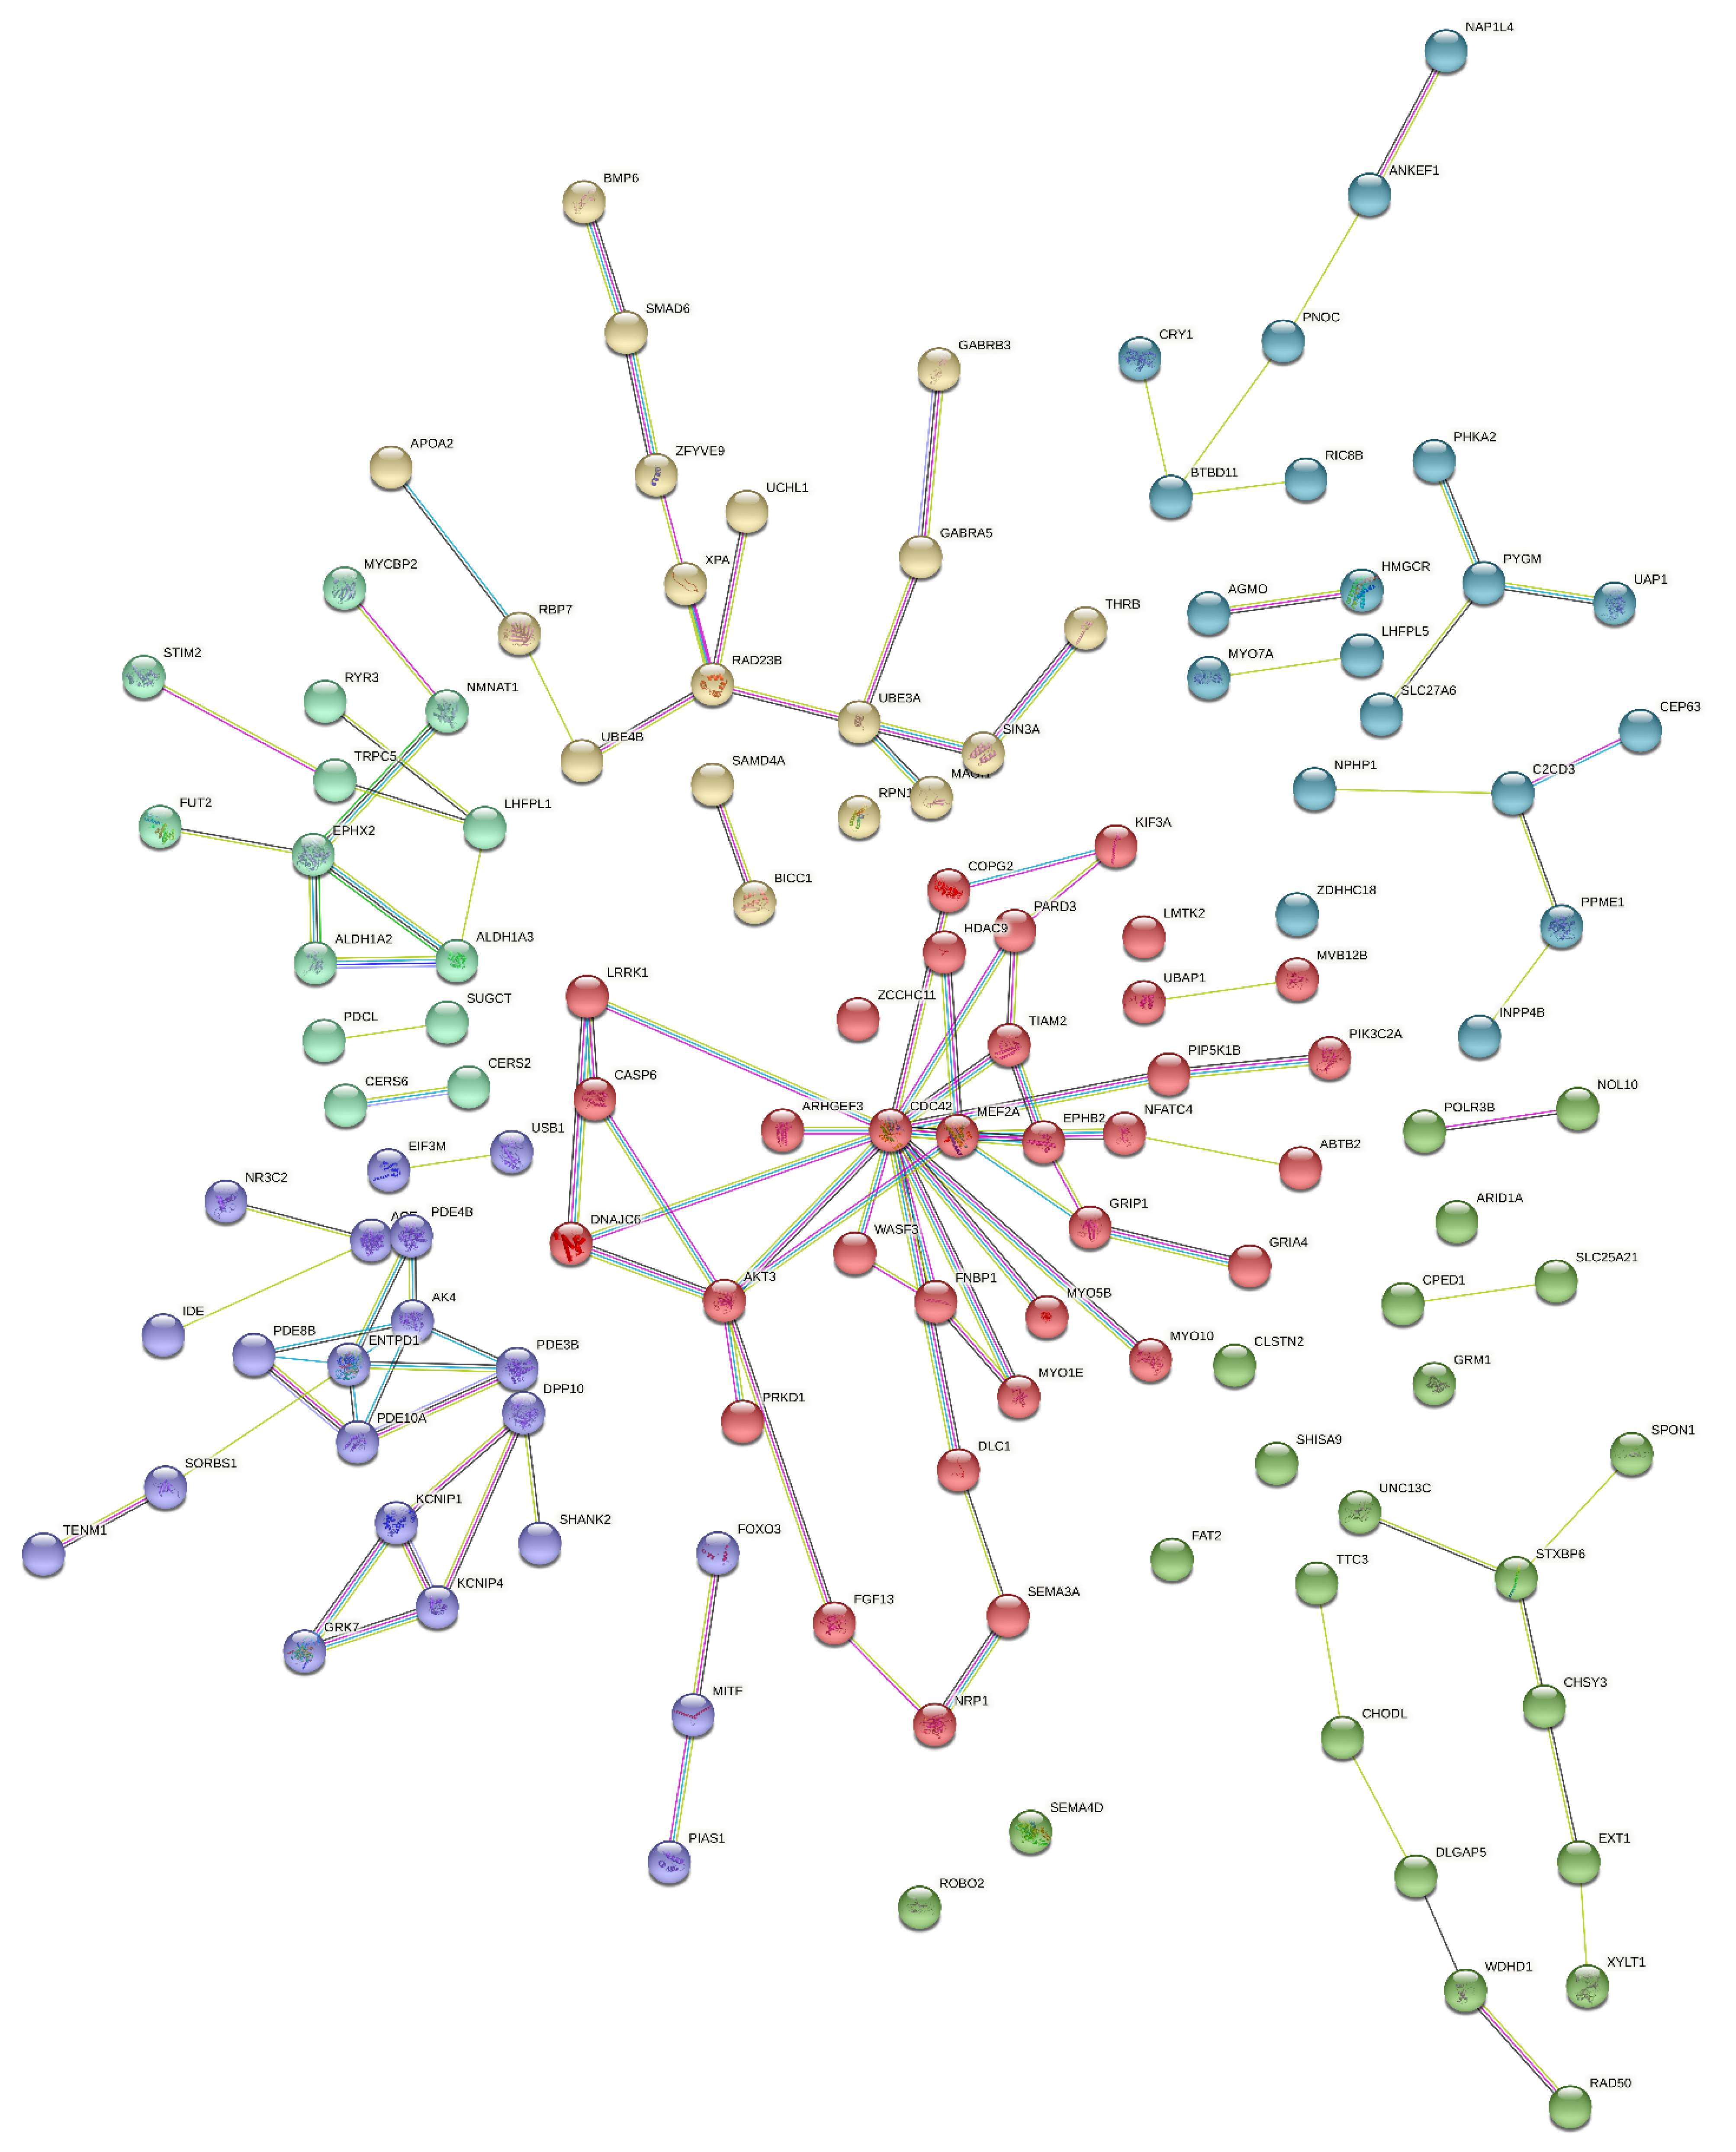
3.3. Gene Network and Protein–Protein Interactions

The two gene network analyses indicated that most links among genes are based on co-expression and genetic interaction. The graphical representation of those results in presented in Figure 1 and Figure 2.
Interactions among proteins (protein–protein interaction network; PPIN) coded by genes associated with the analyzed traits are presented in Figure 3. In total, 174 genes formed some pairs or chains of interactions with one evident cluster built of 138 proteins and 12 short chains that contained a maximum of 7 genes coding those proteins. The genes with the largest number of proven links among coded proteins were CDC42, LRRK1, and AKT3.
Overall, those two analyses did not provide strong evidence for interactions among candidate genes for the litter traits.

3.4. Meta-Analysis of Five GWA Studies

As a result of the MA performed on dataset B, two SNPs were found to be significantly associated with TNB. The first, rs80945731, located on SSC14: 62633073, was available in four out of five evaluated populations [10,22,24,25]. Based on Ensembl Sscrofa11.1, this SNP is located in the intron region of the FAM13C gene. The second, rs81300422, located on SSC9: 84696142, was unfortunately present in only one population [22]. According to Ensembl Sscrofa11.1, this gene is located within the intron of the gene AGMO. Importantly, these two SNPs found in the MA are reported for the first time to have an association with TNB. The last run of MA, which included only SNPs present in all populations, did not show any significant association with the evaluated traits.

3.5. Candidate Genes and Causal Variation

To assess candidate causal genes at the two QTL loci, we ran the pCADD-GWAS pipeline in four different breeds from Topigs Norsvin [45]. The rs81300422 SNP, which is located on SSC9, was segregated only in a synthetic boar line with a 7% minor allele frequency. The third best hit with the pCADD pipeline (after two intergenic SNPs) is upstream of the SOSTDC1 gene. The SOSTDC1 gene is a member of the sclerostin family functioning as a bone morphogenetic protein (BMP) antagonist, which is known to be associated with fertility. The descriptive statistics for TNB, NBA, SB, and mummies per genotype of rs81300422 is presented in Table 6. It can be observed that animals being homozygous for the alternative allele tend to lower SB (in sows and boars from a synthetic boar line and its crossbreeds) and higher rate of mummies (in sows from a synthetic boar line and in crossbreed sows) than homozygous animals for the reference allele. This is, however, not a statistically significant difference.
The rs80945731 SNP on SSC14 was common in all four commercial breeding populations. The results yielded SNPs within and close to the PHYHIPL and FAM13C genes, thus partially overlapping with the results of the candidate gene search applying the classical approach.

4. Discussion

This study intended to evaluate existing knowledge about the genomic regions associated with five litter traits in pigs: total number born (TNB), number born alive (NBA), number of stillborn (SB), litter birth weight (LWT), and corpus luteum number (CLN), and search for new candidate genes using bioinformatics analysis on combined results from previous studies. This study is the first one to evaluate the possibility of a common genetic background for those litter traits, as well as to present a meta-analysis for SNPs associated with TNB and combining data from five different populations.

4.1. Genetic Relationship between Litter Traits

One of the hypotheses at the beginning of this study was that there must be overlapping genomic regions and candidate genes among the evaluated litter traits. This hypothesis was based mostly on strong positive genetic correlations among TNB, NBA, CLN, and LWT [58,59]; however, it was not confirmed with the data collected in dataset A. Only one candidate gene, ZFYVE9, was reported for three litter traits (TNB, NBA, and CLN) and in two populations [31,42]. Another three candidate genes for SB (with a negative genetic correlation with the remaining litter traits [59]) were also found to be associated with TNB (STXBP6 [11,29]), NBA (PRKD1 [11,28]) or CLN (SAMD4A [42,43]). For LWT, only one candidate gene was in common with TNB (COPG2 [28]), whereas only one candidate gene for SB overlapped between two populations (MAPK1P1L [43,44]). The abovementioned relationships among traits could suggest some pleiotropic effect of those genes on litter traits. In two populations three candidate genes for TNB were also reported: ASIC2 [29,37], GABRA5 [28,37], and NEK10 [29,37]. Even though some connections across studies reporting candidate genes for litter traits can be observed, considering that we studied 233 candidate genes in total and only 21 of them covered more than one trait or population, one cannot assume the common genetic background of those traits. However, for production traits in pigs, except for major genes, such overlap between traits or populations is also not common [13]. It should be mentioned here that the older studies from PigQTLdb [13] reported very long QTLs because of high LD or access to SNP chips with low density. Thus, some of the reported candidate genes might in fact be very distant from the actual SNPs associated with the litter traits. Another reason might be the population stratification, which if not accounted for, can lead to false positives (e.g., [23]).
The lack of overlap between traits in terms of candidate genes was present not only among the studies for one trait but also within the same study if it focused on two or more traits. Moreover, more than one SNP was rarely reported within the candidate gene in the same population. Thus, the lack of overlap was not caused by the differences among the populations or the methodologies behind detecting associations, which are mentioned as two main reasons for differences among compared GWASs [12]. Even more so, the low repeatability of results across populations is surprising, because most of the studies were based on the same SNP chip and (in general) the most popular pig breeds. Another reason might have been the low heritability of the studied traits, which based on different studies varies from 0.05 to 0.2 [11,28,59,60]. The heritability level affects the ability to retrace the trait’s heritability based on SNP associations [23].
Those results clearly show that the polygenic characteristics of the litter traits are very complex, and despite the undeniable relationship among traits their genetic background is mostly affected by different genomic regions often involved in nervous system development.

4.2. Connections among Candidate Genes

The gene network and protein–protein interaction analysis did not indicate clear clusters among candidate genes. It needs to be noted, however, that those analyses were based only on linking selected candidate genes with existing databases. This is why the current study did not produce gene expression or any other empirical data that could have been included as additional information for candidate genes. In addition, pig genomic databases are lacking information in comparison with human, mouse, or even cattle gene databases. Thus, the majority of the evidence suggesting functional links among analyzed genes were based on the co-expression of putative homologs present in other organisms (Ensembl Sscrofa11.1). In only a few cases were links between proteins experimentally determined or proteins involved in the same pathway [55].
Some similarities among litter traits can be seen in the GO terms analysis performed on dataset A. This analysis clearly showed that genes involved in neurodevelopment and the nervous system are overrepresented among candidate genes for the studied litter traits. This came as a surprising result as we expected to see more genes involved in vasculogenesis and angiogenesis, as blood supply to the uterus and developing fetus was indicated in the past as one of the most limiting factors for litter size [22,61]. That is why from all the possible biological processes that were significant in GO term analysis, we are certain that those involved in positive regulation of blood vessel endothelial cell migration and positive regulation of cell migration involved in sprouting angiogenesis require the most attention.
Interestingly, out of the five genes that have the aforementioned GO terms annotated to them, PRKD1 is the gene with five SNPs along its sequence associated with number of stillborn [11] and one SNP with TNB [29]. PRKD1 encodes a protein kinase involved in many cellular processes, including cell migration and differentiation, cell survival, and regulation of cell shape and adhesion [55]. Mutation in this gene causes congenital heart defects in humans [62,63]. In addition, it was also indicated as a candidate gene for age at puberty in maternal and terminal Landrace, Duroc, and Yorkshire lines [64]. Thus, it is associated with at least three traits related to reproduction in their different populations. This indicates that PRKD1 should be one of the genes considered for molecular analysis involving gene expression or sequencing to confirm its association with litter traits in pigs.

4.3. The New Genomic Region Associated with Litter Size

The meta-analysis of GWAS results coming from five different populations indicated two new SNPs associated with litter size. Even though our MA produced far fewer significant results than each of the GWASs separately, this is the first time those SNPs are reported as associated with litter size.
The first of the significant SNPs on SSC9, rs81300422 (genotyped only in one population) is located in the intron of the gene AGMO encoding enzyme Alkylglycerol monooxygenase, not very well studied in swine, which is involved in the degradation of ether lipids [65] and the only enzyme that can breakdown alkylglycerols and lysol alkyl glycerophospholipids [66]. This gene was shown to be associated with neurodevelopmental disorders in humans [67], e.g., autism [68], type 2 diabetes [69,70,71], and immune defense [66]. In humans, this gene was expressed mostly in tissues of the digestive tract, especially in the liver, but also in the ovaries, uterus, prostate, and testes [55]. However, the literature does not report any direct links of AGMO with fertility.
Thus, a far more interesting and promising candidate gene is SOSTDC1, indicated by pCADD analysis, which has been found to affect fertility in male rats [72]. SOSTDC1 is a negative regulator of spermatogenesis, and downregulation of this gene during puberty is essential for quantitatively and qualitatively normal spermatogenesis governing male fertility. The association between TNB and male fertility comes as a surprise, as litter traits are in general linked with females. However, in some pig breeds it is observed that male genetics plays a more important role in final litter size than originally expected [73,74]. Further comparison of litter traits among pigs with different genotypes for rs81300422 showed that the detected SNP could be affecting the number of stillborn and mummies in pig populations available for pCADD. This was, unfortunately, not confirmed by the statistical analysis.
The second significant SNP, rs80945731 (present in four populations), is located within the gene FAM13C, which does not have a clear function in pigs. Nonetheless, it was expressed in swine adipose tissue and tissues of the nervous system (e.g., amygdala or medulla oblongata). At the same time, in humans FAM13C was shown to be associated with endometrial mixed adenocarcinoma [55] as well as being used as a marker for prostate cancer [75] or as a rectal adenocarcinoma survival predictor [76]. In humans, this gene also was expressed (among others) in the tissue of the ovaries and uterus as well as the prostate and testes [55]. The second gene indicated by pCADD for rs80945731 was PHYHIPL, which is differentially expressed among early, full, and expanded blastocysts in bovine IVP embryos [77]. Both FAM13C and PHYHIPL in humans were expressed (among others) in the tissue of the ovaries and uterus as well as the prostate and testes [55].

5. Conclusions

We have shown that litter traits (total number born, number born alive, number of stillborn, litter birth weight, and corpus luteum number) studied across pig populations have only a few genomic regions in common based on candidate gene comparison. The most interesting candidate gene is PRKD1, which has an association with SB and TNB as well as being involved in angiogenesis based on GO term analysis. Our meta-analysis of GWAS results coming from five populations helped identify the new genomic regions on SSC9 and SSC14 associated with TNB. Further pCADD analysis indicated the most promising gene was SOSTDC1, which actually has a confirmed effect on male fertility. This is an important finding, as litter traits are by default linked with females rather than males.

Supplementary Materials

The following are available online at https://www.mdpi.com/article/10.3390/genes13101730/s1, Supplementary_Method: The description of not published GWAS [23], Table S1. SNPs associated with total number born in pigs with their location within pig genome (including chromosome - SSC, position and gene), alleles as well as breed in which the SNP was detected. Table S2. SNPs associated with number born alive in pigs with their location within pig genome (including chromosome - SSC, position and gene), alleles as well as breed in which the SNP was detected. Table S3. SNPs associated with number of stillborn in pigs with their location within pig genome (including chromosome - SSC, position and gene), alleles as well as breed in which the SNP was detected. Table S4. SNPs associated with litter birthweight in pigs with their location within pig genome (including chromosome, position and gene), alleles as well as breed in which the SNP was detected. Table S5. SNPs associated with corpus luteum number in pigs with their location within pig genome (including chromosome, position and gene), alleles as well as breed in which the SNP was detected.

Author Contributions

Conceptualization—E.S.-K.; methodology—E.S.-K., J.D., M.F.L.D., M.S.L. and T.S.; formal analysis—E.S.-K., J.D., M.F.L.D. and M.S.L.; data curation—J.D. and E.S.-K.; original draft preparation—E.S.-K. and J.D.; review and editing—E.S.-K., M.F.L.D., M.S.L. and T.S.; figures—E.S.-K.; tables in the main manuscript—E.S.-K. and J.D.; supplementary tables—J.D. and E.S.-K.; funding acquisition—E.S.-K. All authors have read and agreed to the published version of the manuscript.

Funding

This project was financed by the National Science Centre, Poland (NCN SONATA grant no. 2016/23/D/NZ9/00029; E.S.K. is the grant holder). E.S.K. also acknowledges the financial support of the Polish Ministry of Science and Higher Education (grant no. 1021/STYP/12/2017).

Institutional Review Board Statement

Not applicable.

Informed Consent Statement

Not applicable.

Data Availability Statement

Data of dataset A are contained within the article and supplementary materials. The data that support the findings of this study (combined in dataset B) are available from the National Engineering Research Center for Breeding Swine Industry and the Guangdong Provincial Key Lab of Agro-Animal Genomics and Molecular Breeding, College of Animal Science, South China Agricultural University (China); the Institute of Swine Science, Nanjing Agricultural University (China); Agrifood Research Finland, MTT, Biotechnology and Food Research (Finland); the TopigsNorsvin Research Centre, Beuningen (the Netherlands); and the NARIC Research Institute for Animal Breeding, Nutrition and Meat Science (Hungary), but restrictions apply to the availability of these data, which were used under license for the current study, and so are not publicly available. Data are however available from the authors upon reasonable request and with permission of: the National Engineering Research Center for Breeding Swine Industry and Guangdong Provincial Key Lab of Agro-Animal Genomics and Molecular Breeding, College of Animal Science, South China Agricultural University (China); the Institute of Swine Science, Nanjing Agricultural University (China); Agrifood Research Finland, MTT, Biotechnology and Food Research (Finland); the TopigsNorsvin Research Centre, Beuningen (the Netherlands); and the NARIC Research Institute for Animal Breeding, Nutrition and Meat Science (Hungary).

Acknowledgments

The authors would like to thank five scientific groups that generously provided GWAS results from their studies for meta-analysis: the National Engineering Research Center for Breeding Swine Industry and the Guangdong Provincial Key Lab of Agro-Animal Genomics and Molecular Breeding, College of Animal Science, South China Agricultural University (China); the Institute of Swine Science, Nanjing Agricultural University (China); Agrifood Research Finland, MTT, Biotechnology and Food Research (Finland); the TopigsNorsvin Research Centre, Beuningen (the Netherlands); and the NARIC Research Institute for Animal Breeding, Nutrition and Meat Science (Hungary).

Conflicts of Interest

The authors declare no conflict of interest.

References

  1. Rothschild, M.; Jacobson, C.; Vaske, D.; Tuggle, C.; Wang, L.; Short, T.; Eckardt, G.; Sasaki, S.; Vincent, A.; McLaren, D.; et al. The estrogen receptor locus is associated with a major gene influencing litter size in pigs. Proc. Natl. Acad. Sci. USA 1996, 93, 201–205. [Google Scholar] [CrossRef]
  2. Ernst, C.W.; Steibel, J.P. Molecular advances in QTL discovery and application in pig breeding. Trends Genet. 2013, 29, 215–224. [Google Scholar] [CrossRef] [PubMed]
  3. Blaj, I.; Tetens, J.; Preuss, S.; Bennewitz, J.; Thaller, G. Genome-wide association studies and meta-analysis uncovers new candidate genes for growth and carcass traits in pigs. PLoS ONE 2018, 13, e0205576. [Google Scholar] [CrossRef]
  4. Rothschild, M.F.; Hu, Z.-L.; Jiang, Z. Advances in QTL Mapping in Pigs. Int. J. Biol. Sci. 2007, 3, 192–197. [Google Scholar] [CrossRef]
  5. Sosa-Madrid, B.S.; Santacreu, M.A.; Blasco, A.; Fontanesi, L.; Pena, R.N.; Ibáñez-Escriche, N. A genomewide association study in divergently selected lines in rabbits reveals novel genomic regions associated with litter size traits. J. Anim. Breed. Genet. 2020, 137, 123–138. [Google Scholar] [CrossRef]
  6. Casto-Rebollo, C.; Argente, M.J.; Garciá, M.L.; Pena, R.; Ibáñez-Escriche, N. Identification of functional mutations associated with environmental variance of litter size in rabbits. Genet. Sel. Evol. 2020, 52, 22. [Google Scholar] [CrossRef]
  7. Tao, L.; He, X.Y.; Jiang, Y.T.; Lan, R.; Li, M.; Li, Z.M.; Yang, W.F.; Hong, Q.H.; Chu, M.X. Combined approaches to reveal genes associated with litter size in Yunshang black goats. Anim. Genet. 2020, 51, 924–934. [Google Scholar] [CrossRef] [PubMed]
  8. Islam, R.; Liu, X.; Gebreselassie, G.; Abied, A.; Ma, Q.; Ma, Y. Genome-wide association analysis reveals the genetic locus for high reproduction trait in Chinese Arbas Cashmere goat. Genes Genom. 2020, 42, 893–899. [Google Scholar] [CrossRef] [PubMed]
  9. Jiang, J.; Ma, L.; Prakapenka, D.; VanRaden, P.M.; Cole, J.B.; Da, Y. A Large-Scale Genome-Wide Association Study in U.S. Holstein Cattle. Front. Genet. 2019, 10, 412. [Google Scholar] [CrossRef]
  10. Zhang, Z.; Chen, Z.; Ye, S.; He, Y.; Huang, S.; Yuan, X.; Li, J. Genome-Wide Association Study for Reproductive Traits in a Duroc Pig Population. Animals 2019, 9, 732. [Google Scholar] [CrossRef] [Green Version]
  11. Chen, Z.; Ye, S.; Teng, J.; Diao, S.; Yuan, X.; Chen, Z.; Zhang, H.; Li, J.; Zhang, Z. Genome-wide association studies for the number of animals born alive and dead in duroc pigs. Theriogenology 2019, 139, 36–42. [Google Scholar] [CrossRef] [PubMed]
  12. Bakoev, S.; Getmantseva, L.; Bakoev, F.; Kolosova, M.; Gabova, V.; Kolosov, A.; Kostyunina, O. Survey of SNPs Associated with Total Number Born and Total Number Born Alive in Pig. Genes 2020, 11, 491. [Google Scholar] [CrossRef] [PubMed]
  13. Animal Genome Project. Pig QTL Data Base. Available online: http//www.animalgenome.org/QTLdb/pig.html (accessed on 21 March 2021).
  14. Van Son, M.; Enger, E.G.; Grove, H.; Ros-Freixedes, R.; Kent, M.P.; Lien, S.; Grindflek, E. Genome-wide association study confirm major QTL for backfat fatty acid composition on SSC14 in Duroc pigs. BMC Genom. 2017, 18, 369. [Google Scholar] [CrossRef]
  15. Jungerius, B.J.; Van Laere, A.S.; Te Pas, M.F.W.; Van Oost, B.A.; Andersson, L.; Groenen, M.A.M. The IGF2-intron3-G3072A substitution explains a major imprinted QTL effect on backfat thickness in a Meishan x European white pig intercross. Genet. Res. 2004, 84, 95–101. [Google Scholar] [CrossRef]
  16. Van Laere, A.-S.; Nguyen, M.; Braunschweig, M.; Nezer, C.; Collette, C.; Moreau, L.; Archibald, A.; Haley, C.; Buys, N.; Tally, M.; et al. A regulatory mutation in IGF2 causes a major QTL effect on muscle growth in the pig. Nature 2003, 425, 832–836. [Google Scholar] [CrossRef] [PubMed]
  17. Alfonso, L. Use of meta-analysis to combine candidate gene association studies: Application to study the relationship between the ESR PvuII polymorphism and sow litter size. Genet. Sel. Evol. 2005, 37, 417–435. [Google Scholar] [CrossRef]
  18. Bouwman, A.C.; Daetwyler, H.D.; Chamberlain, A.J.; Ponce, C.H.; Sargolzaei, M.; Schenkel, F.S.; Sahana, G.; Govignon-Gion, A.; Boitard, S.; Dolezal, M.; et al. Meta-analysis of genome-wide association studies for cattle stature identifies common genes that regulate body size in mammals. Nat. Genet. 2018, 50, 362–367. [Google Scholar] [CrossRef]
  19. Duarte, D.A.S.; Newbold, C.J.; Detmann, E.; Silva, F.F.; Freitas, P.H.F.; Veroneze, R.; Duarte, M.S. Genome-wide association studies pathway-based meta-analysis for residual feed intake in beef cattle. Anim. Genet. 2019, 50, 150–153. [Google Scholar] [CrossRef] [PubMed]
  20. Tropf, F.C.; Lee, S.H.; Verweij, R.M.; Stulp, G.; van der Most, P.J.; de Vlaming, R.; Bakshi, A.; Briley, D.A.; Rahal, C.; Hellpap, R.; et al. Hidden heritability due to heterogeneity across seven populations. Nat. Hum. Behav. 2017, 1, 757–765. [Google Scholar] [CrossRef]
  21. Sauvant, D.; Letourneau-Montminy, M.P.; Schmidely, P.; Boval, M.; Loncke, C.; Daniel, J.B. Review: Use and misuse of meta-analysis in Animal Science. Animal 2020, 14, s207–s222. [Google Scholar] [CrossRef]
  22. Uimari, P.; Sironen, A.; Sevón-Aimonen, M.-L. Whole-genome SNP association analysis of reproduction traits in the Finnish Landrace pig breed. Genet. Sel. Evol. 2011, 43, 42. [Google Scholar] [CrossRef] [PubMed]
  23. Sell-Kubiak, E.; Duijvesteijn, N.; Lopes, M.S.; Janss, L.L.G.; Knol, E.F.; Bijma, P.; Mulder, H.A. Genome-wide association study reveals novel loci for litter size and its variability in a Large White pig population. BMC Genom. 2015, 16, 1049. [Google Scholar] [CrossRef]
  24. Balogh, E.E.; Gábor, G.; Bodó, S.; Rózsa, L.; Rátky, J.; Zsolnai, A.; Anton, I. Effect of single-nucleotide polymorphisms on specific reproduction parameters in Hungarian Large White sows. Acta Vet. Hung. 2019, 67, 256–273. [Google Scholar] [CrossRef]
  25. Ma, X.; Li, P.H.; Zhu, M.X.; He, L.C.; Sui, S.P.; Gao, S.; Su, G.S.; Ding, N.S.; Huang, Y.; Lu, Z.Q.; et al. Genome-wide association analysis reveals genomic regions on Chromosome 13 affecting litter size and candidate genes for uterine horn length in Erhualian pigs. Animal 2018, 12, 2453–2461. [Google Scholar] [CrossRef]
  26. Thompson, J.R.; Attia, J.; Minelli, C. The meta-analysis of genome-wide association studies. Brief. Bioinform. 2011, 12, 259–269. [Google Scholar] [CrossRef]
  27. An, S.M.; Hwang, J.H.; Kwon, S.; Yu, G.E.; Park, D.H.; Kang, D.G.; Kim, T.W.; Park, H.C.; Ha, J.; Kim, C.W. Effect of Single Nucleotide Polymorphisms in IGFBP2 and IGFBP3 Genes on Litter Size Traits in Berkshire Pigs. Anim. Biotechnol. 2018, 29, 301–308. [Google Scholar] [CrossRef]
  28. Coster, A.; Madsen, O.; Heuven, H.C.M.; Dibbits, B.; Groenen, M.A.M.; van Arendonk, J.A.M.; Bovenhuis, H. The Imprinted Gene DIO3 Is a Candidate Gene for Litter Size in Pigs. PLoS ONE 2012, 7, e31825. [Google Scholar] [CrossRef]
  29. He, L.C.; Li, P.H.; Ma, X.; Sui, S.P.; Gao, S.; Kim, S.W.; Gu, Y.Q.; Huang, Y.; Ding, N.S.; Huang, R.H. Identification of new single nucleotide polymorphisms affecting total number born and candidate genes related to ovulation rate in Chinese Erhualian pigs. Anim. Genet. 2017, 48, 48–54. [Google Scholar] [CrossRef]
  30. Kumchoo, T.; Mekchay, S. Association of non-synonymous SNPs of OPN gene with litter size traits in pigs. Arch. Anim. Breed. 2015, 58, 317–323. [Google Scholar] [CrossRef]
  31. Li, X.; Ye, J.; Han, X.; Qiao, R.; Li, X.; Lv, G.; Wang, K. Whole-genome sequencing identifies potential candidate genes for reproductive traits in pigs. Genomics 2020, 112, 199–206. [Google Scholar] [CrossRef]
  32. Liu, C.; Ran, X.; Yu, C.; Xu, Q.; Niu, X.; Zhao, P.; Wang, J. Whole-genome analysis of structural variations between Xiang pigs with larger litter sizes and those with smaller litter sizes. Genomics 2018, 111, 310–319. [Google Scholar] [CrossRef]
  33. Sato, S.; Kikuchi, T.; Uemoto, Y.; Mikawa, S.; Suzuki, K. Effect of candidate gene polymorphisms on reproductive traits in a Large White pig population. Anim. Sci. J. 2016, 87, 1455–1463. [Google Scholar] [CrossRef]
  34. Uzzaman, M.R.; Park, J.E.; Lee, K.T.; Cho, E.S.; Choi, B.H.; Kim, T.H. A genome-wide association study of reproductive traits in a Yorkshire pig population. Livest. Sci. 2018, 209, 67–72. [Google Scholar] [CrossRef]
  35. Wang, H.; Wu, S.; Wu, J.; Sun, S.; Wu, S.; Bao, W. Association analysis of the SNP (rs345476947) in the FUT2 gene with the production and reproductive traits in pigs. Genes Genom. 2018, 40, 199–206. [Google Scholar] [CrossRef]
  36. Wang, Y.; Ding, X.; Tan, Z.; Xing, K.; Yang, T.; Pan, Y.; Mi, S.; Sun, D.; Wang, C. Genome-wide association study for reproductive traits in a Large White pig population. Anim. Genet. 2018, 49, 127–131. [Google Scholar] [CrossRef]
  37. Wu, P.; Wang, K.; Yang, Q.; Zhou, J.; Chen, D.; Ma, J.; Tang, Q.; Jin, L.; Xiao, W.; Jiang, A.; et al. Identifying SNPs and candidate genes for three litter traits using single-step GWAS across six parities in Landrace and Large White pigs. Physiol. Genom. 2018, 50, 1026–1035. [Google Scholar] [CrossRef]
  38. Wu, P.; Yang, Q.; Wang, K.; Zhou, J.; Ma, J.; Tang, Q.; Jin, L.; Xiao, W.; Jiang, A.; Jiang, Y.; et al. Single step genome-wide association studies based on genotyping by sequence data reveals novel loci for the litter traits of domestic pigs. Genomics 2018, 110, 171–179. [Google Scholar] [CrossRef]
  39. Bergfelder-Drüing, S.; Grosse-Brinkhaus, C.; Lind, B.; Erbe, M.; Schellander, K.; Simianer, H.; Tholen, E. A Genome-Wide Association Study in Large White and Landrace Pig Populations for Number Piglets Born Alive. PLoS ONE 2015, 10, e0117468. [Google Scholar] [CrossRef]
  40. Suwannasing, R.; Duangjinda, M.; Boonkum, W.; Taharnklaew, R.; Tuangsithtanon, K. The identification of novel regions for reproduction trait in Landrace and Large White pigs using a single step genome-wide association study. Asian-Australas. J. Anim. Sci. 2018, 31, 1852–1862. [Google Scholar] [CrossRef]
  41. Onteru, S.K.; Fan, B.; Du, Z.-Q.; Garrick, D.J.; Stalder, K.J.; Rothschild, M.F. A whole-genome association study for pig reproductive traits. Anim. Genet. 2011, 43, 18–26. [Google Scholar] [CrossRef]
  42. Schneider, J.F.; Miles, J.R.; Brown-Brandl, T.M.; Nienaber, J.A.; Rohrer, G.A.; Vallet, J.L. Genomewide association analysis for average birth interval and stillbirth in swine. J. Anim. Sci. 2015, 93, 529–540. [Google Scholar] [CrossRef]
  43. Verardo, L.L.; Silva, F.F.; Lopes, M.S.; Madsen, O.; Bastiaansen, J.W.M.; Knol, E.F.; Kelly, M.; Varona, L.; Lopes, P.S.; Guimarães, S.E.F. Revealing new candidate genes for reproductive traits in pigs: Combining Bayesian GWAS and functional pathways. Genet. Sel. Evol. 2016, 48, 9. [Google Scholar] [CrossRef]
  44. Schneider, J.F.; Nonneman, D.J.; Wiedmann, R.T.; Vallet, J.L.; Rohrer, G.A. Genomewide association and identification of candidate genes for ovulation rate in swine. J. Anim. Sci. 2014, 92, 3792–3803. [Google Scholar] [CrossRef]
  45. Carbon, S.; Mungall, C. Gene Ontology Data Archive; Zenodo, Maryland, United States of America: 2021. Available online: https://doi.org/10.5281/zenodo.5228828 (accessed on 29 August 2022).
  46. Mi, H.; Ebert, D.; Muruganujan, A.; Mills, C.; Albou, L.-P.; Mushayamaha, T.; Thomas, P.D. PANTHER version 16: A revised family classification, tree-based classification tool, enhancer regions and extensive API. Nucleic Acids Res. 2020, 49, D394–D403. [Google Scholar] [CrossRef]
  47. Keel, B.N.; Snelling, W.M.; Lindholm-Perry, A.K.; Oliver, W.T.; Kuehn, L.A.; Rohrer, G. Using SNP Weights Derived From Gene Expression Modules to Improve GWAS Power for Feed Efficiency in Pigs. Front. Genet. 2020, 10, 1339. [Google Scholar] [CrossRef]
  48. Warde-Farley, D.; Donaldson, S.L.; Comes, O.; Zuberi, K.; Badrawi, R.; Chao, P.; Franz, M.; Grouios, C.; Kazi, F.; Lopes, C.T.; et al. The GeneMANIA prediction server: Biological network integration for gene prioritization and predicting gene function. Nucleic Acids Res. 2010, 38 (Suppl. 2), 214–220. [Google Scholar] [CrossRef]
  49. Shannon, P.; Markiel, A.; Ozier, O.; Baliga, N.S.; Wang, J.T.; Ramage, D.; Amin, N.; Schwikowski, B.; Ideker, T. Cytoscape: A software environment for integrated models of Biomolecular Interaction Networks. Genome Res. 2003, 13, 2498–2504. [Google Scholar] [CrossRef]
  50. Szklarczyk, D.; Morris, J.H.; Cook, H.; Kuhn, M.; Wyder, S.; Simonovic, M.; Santos, A.; Doncheva, N.T.; Roth, A.; Bork, P.; et al. The STRING database in 2017: Quality-controlled protein-protein association networks.; made broadly accessible. Nucleic Acids Res. 2017, 45, D362–D368. [Google Scholar] [CrossRef]
  51. Bozhilova, L.V.; Whitmore, A.V.; Wray, J.; Reinert, G.; Deane, C.M. Measuring rank robustness in scored protein interaction networks. BMC Bioinform. 2019, 20, 446. [Google Scholar] [CrossRef]
  52. Garrick, D.J.; Taylor, J.F.; Fernando, R.L. Deregressing estimated breeding values and weighting information for genomic regression analyses. Genet. Sel. Evol. 2009, 41, 55. [Google Scholar] [CrossRef] [Green Version]
  53. Willer, C.; Li, Y.; Abecasis, G.R. METAL: Fast and efficient meta-analysis of genomewide association scans. Bioinformatics 2010, 26, 2190–2191. [Google Scholar] [CrossRef] [PubMed]
  54. Berg, I.V.D.; Boichard, D.; Lund, M.S. Comparing power and precision of within-breed and multibreed genome-wide association studies of production traits using whole-genome sequence data for 5 French and Danish dairy cattle breeds. J. Dairy Sci. 2016, 99, 8932–8945. [Google Scholar] [CrossRef] [PubMed]
  55. Stelzer, G.; Rosen, N.; Plaschkes, I.; Zimmerman, S.; Twik, M.; Fishilevich, S.; Stein, T.I.; Nudel, R.; Lieder, I.; Mazor, Y.; et al. The GeneCards Suite: From Gene Data Mining to Disease Genome Sequence Analysis. Curr. Protoc. Bioinform. 2016, 54, 1.30.1–1.30.33. [Google Scholar] [CrossRef] [PubMed]
  56. Derks, M.F.; Gross, C.; Lopes, M.S.; Reinders, M.J.; Bosse, M.; Gjuvsland, A.B.; de Ridder, D.; Megens, H.-J.; Groenen, M.A. Accelerated discovery of functional genomic variation in pigs. Genomics 2021, 113, 2229–2239. [Google Scholar] [CrossRef] [PubMed]
  57. Groß, C.; Derks, M.; Megens, H.-J.; Bosse, M.; Groenen, M.A.M.; Reinders, M.; De Ridder, D. pCADD: SNV prioritisation in Sus scrofa. Genet. Sel. Evol. 2020, 52, 4. [Google Scholar] [CrossRef]
  58. Holm, B.; Bakken, M.; Klemetsdal, G.; Vangen, O. Genetic correlations between reproduction and production traits in swine. J. Anim. Sci. 2004, 82, 3458–3464. [Google Scholar] [CrossRef]
  59. Sell-Kubiak, E. Selection for litter size and litter birthweight in Large White pigs: Maximum, mean and variability of reproduction traits. Animal 2021, 15, 100352. [Google Scholar] [CrossRef] [PubMed]
  60. Li, H.; Wang, M.; Li, W.; He, L.; Zhou, Y.; Zhu, J.; Che, R.; Warburton, M.L.; Yang, X.; Yan, J. Genetic variants and underlying mechanisms influencing variance heterogeneity in maize. Plant J. 2020, 103, 1089–1102. [Google Scholar] [CrossRef]
  61. Lu, S.; Liu, S.; Wietelmann, A.; Kojonazarov, B.; Atzberger, A.; Tang, C.; Schermuly, R.; Gröne, H.-J.; Offermanns, S. Developmental vascular remodeling defects and postnatal kidney failure in mice lacking Gpr116 (Adgrf5) and Eltd1 (Adgrl4). PLoS ONE 2017, 12, e0183166. [Google Scholar] [CrossRef]
  62. Shaheen, R.; al Hashem, A.; Alghamdi, M.H.; Seidahmad, M.Z.; Wakil, S.M.; Dagriri, K.; Keavney, B.; Goodship, J.; Alyousif, S.; Al-Habshan, F.M.; et al. Positional mapping of PRKD1.; NRP1 and PRDM1 as novel candidate disease genes in truncus arteriosus. J. Med. Genet. 2015, 52, 322–329. [Google Scholar] [CrossRef]
  63. Massadeh, S.; Albeladi, M.; Albesher, N.; Alhabshan, F.; Kampe, K.; Chaikhouni, F.; Kabbani, M.; Beetz, C.; Alaamery, M. Novel Autosomal Recessive Splice-Altering Variant in PRKD1 Is Associated with Congenital Heart Disease. Genes 2021, 12, 612. [Google Scholar] [CrossRef]
  64. Nonneman, D.; Lents, C.; Rohrer, G.; Rempel, L.; Vallet, J. Genome-wide association with delayed puberty in swine. Anim. Genet. 2013, 45, 130–132. [Google Scholar] [CrossRef] [PubMed]
  65. Watschinger, K.; Werner, E.R. Alkylglycerol monooxygenase. IUBMB Life 2013, 65, 366–372. [Google Scholar] [CrossRef]
  66. Sailer, S.; Keller, M.A.; Werner, E.R.; Watschinger, K. The Emerging Physiological Role of AGMO 10 Years after Its Gene Identification. Life 2021, 11, 88. [Google Scholar] [CrossRef] [PubMed]
  67. Okur, V.; Watschinger, K.; Niyazov, D.; McCarrier, J.; Basel, D.; Hermann, M.; Werner, E.R.; Chung, W.K. Biallelic variants in AGMO with diminished enzyme activity are associated with a neurodevelopmental disorder. Hum. Genet. 2019, 138, 1259–1266. [Google Scholar] [CrossRef]
  68. Sebat, J.; Lakshmi, B.; Malhotra, D.; Troge, J.; Lese-Martin, C.; Walsh, T.; Yamrom, B.; Yoon, S.; Krasnitz, A.; Kendall, J.; et al. Strong Association of De Novo Copy Number Mutations with Autism. Science 2007, 316, 445–449. [Google Scholar] [CrossRef]
  69. Fontaine-Bisson, B.; The MAGIC investigators; Renström, F.; Rolandsson, O.; Payne, F.; Hallmans, G.; Barroso, I.; Franks, P.W. Evaluating the discriminative power of multi-trait genetic risk scores for type 2 diabetes in a northern Swedish population. Diabetologia 2010, 53, 2155–2162. [Google Scholar] [CrossRef] [PubMed]
  70. Boesgaard, T.W.; Grarup, N.; Jørgensen, T.; Borch-Johnsen, K.; Hansen, T.; Pedersen, O. Variants at DGKB/TMEM195.; ADRA2A.; GLIS3 and C2CD4B loci are associated with reduced glucose-stimulated beta cell function in middle-aged Danish people. Diabetologia 2010, 53, 1647–1655. [Google Scholar] [CrossRef] [PubMed]
  71. Dupuis, J.; Langenberg, C.; Prokopenko, I.; Saxena, R.; Soranzo, N.; Jackson, A.U.; Wheeler, E.; Glazer, N.L.; Bouatia-Naji, N.; Gloyn, A.L.; et al. Erratum: New genetic loci implicated in fasting glucose homeostasis and their impact on type 2 diabetes risk. Nat. Genet. 2010, 42, 464. [Google Scholar] [CrossRef]
  72. Pradhan, B.; Bhattacharya, I.; Sarkar, R.; Majumdar, S.S. Downregulation of Sostdc1 in Testicular Sertoli Cells is Prerequisite for Onset of Robust Spermatogenesis at Puberty. Sci. Rep. 2019, 9, 11458. [Google Scholar] [CrossRef] [Green Version]
  73. Myromslien, F.D.; Tremoen, N.H.; Andersen-Ranberg, I.; Fransplass, R.; Stenseth, E.-B.; Zeremichael, T.T.; Van Son, M.; Grindflek, E.; Gaustad, A.H. Sperm DNA integrity in Landrace and Duroc boar semen and its relationship to litter size. Reprod. Domest. Anim. 2018, 54, 160–166. [Google Scholar] [CrossRef]
  74. Tremoen, N.H.; Van Son, M.; Andersen-Ranberg, I.; Grindflek, E.; Myromslien, F.D.; Gaustad, A.H.; Våge, D.I. Association between single-nucleotide polymorphisms within candidate genes and fertility in Landrace and Duroc pigs. Acta Vet. Scand. 2019, 61, 58. [Google Scholar] [CrossRef] [PubMed]
  75. Burdelski, C.; Borcherding, L.; Kluth, M.; Hube-Magg, C.; Melling, N.; Simon, R.; Möller-Koop, C.; Weigand, P.; Minner, S.; Haese, A.; et al. Family with sequence similarity 13C (FAM13C) overexpression is an independent prognostic marker in prostate cancer. Oncotarget 2017, 8, 31494–31508. [Google Scholar] [CrossRef] [PubMed]
  76. Huang, H.; Cao, J.; Guo, G.; Li, X.; Wang, Y.; Yu, Y.; Zhang, S.; Zhang, Q.; Zhang, Y. Genome-wide association study identifies QTLs for displacement of abomasum in Chinese Holstein cattle1. J. Anim. Sci. 2019, 97, 1133–1142. [Google Scholar] [CrossRef]
  77. Georges, H.; Bishop, J.; Van Campen, H.; Barfield, J.; Hansen, T. 102 A delay in maternal zygotic transition may lead to early embryonic loss in poor-quality bovine blastocysts. Reprod. Fertil. Dev. 2020, 32, 177. [Google Scholar] [CrossRef]
Figure 1. Gene network analysis of candidate genes that had at least two SNPs associated with reproduction traits.
Genes 13 01730 g001
Figure 2. Gene network analysis of candidate genes that had an association reported with at least two reproduction traits or in two different populations.
Genes 13 01730 g002
Figure 3. Protein–protein interaction network analysis of genes associated with total number born, number born alive, number of stillborn, litter birth weight, and corpus luteum number in pigs. Types of interactions: teal line—known interaction based on curated database, pink line—known interaction experimentally determined, green line—predicted interaction based on gene neighborhood, red line—predicted interaction based on gene fusion, blue line—predicted interaction based on a gene co-occurrence.
Genes 13 01730 g003
Table 1. Overview of phenotypic and genomic data available for meta-analysis of GWAS results for total number born (TNB) collected in dataset B.
Source of DataUimari et al. [22]Sell-Kubiak et al. [23]Ma et al. [25]Zhang et al. [10]Balogh et al. [24]
PopulationFinnish LandraceLarge WhiteErhualianDurocHungarian Large White
PhenotypedeEBV 1deEBV 1EBV 2deEBV 1TNB
BeadChipPorcine SNP60 Bead Chip
Individuals3282351481067290
Available SNPs57,86840,96928,02032,14756,592
Methodsingle-SNP mixed model with pedigree relationship matrixsingle-SNP mixed model with genomic relationship matrixsingle-SNP mixed model with pedigree relationship matrixsingle-SNP mixed model with genomic relationship matrixmulti-SNP mixed model with genomic relationship matrix
Detected SNPs50573
Threshold−log10(p-value) ≤ 5.7 3−log10(p-value) ≥ 5−log10(p-value) ≤ 5.75 3−log10(p-value) ≥ 4−log10(p-value) ≥ 5
1 deEBV, i.e., deregressed breeding values of total number born; used to remove parents’ average. 2 EBV, i.e., direct breeding values of total number born. 3 Bonferroni corrected p-value.
Table 2. Publications reporting SNPs and genes associated with a total number of piglets born (TNB), number born alive (NBA), number of stillborn (SB), or litter birth weight (LWT).
TraitNumber of SNPsNumber of GenesPublication
TNB11An et al.[27]
137Coster et al.[28]
14583He et al.[29]
30Kumchoo and Mekchay[30]
11Li et al.[31]
11Liu et al.[32]
75Ma et al.[25]
44Sato et al.[33]
107Sell-Kubiak et al.[23]
52Uimari et al.[22]
22Uzzaman et al.[34]
105H. Wang et al.[35]
11Y. Wang et al.[36]
406Wu et al.[37]
53Wu et al.[38]
74Zhang et al.[10]
NBA11An et al.[27]
178Bergfelder-Drüing et al.[39]
116Chen et al.[11]
33Coster et al.[28]
33Kumchoo and Mekchay[30]
11Li et al.[31]
97Ma et al.[25]
22Sato et al.[33]
2711Suwannasing et al.[40]
10Uzzaman et al.[34]
53Y. Wang et al.[36]
10119Wu et al.[37]
156Wu et al.[38]
SB4622Chen et al.[11]
63Onteru et al.[41]
1311Schneider et al.[42]
21Uimari et al.[22]
2215Verardo et al.[43]
LWT11Coster et al.[28]
11Liu et al.[32]
102Zhang et al.[10]
CLN2412Schneider et al.[44]
Table 3. Genes with at least two SNPs in their sequence associated with total number born (TNB), number born alive (NBA), or number of stillborn (SB).
TraitGeneNumber of SNPsPublication
TNBGABRG35Coster et al.[28]
MSI23He et al.[29]
BICC12Zhang et al.[26]
ENTPD12He et al.[29]
ENOX12Sell-Kubiak et al.[23]
SUGCT2Sell-Kubiak et al.[23]
NR3C22Wu et al.[38]
GABRB32Coster et al.[28]
NBARBP75Suwannasing et al.[40]
ARID1A3Chen et al.[11]
LRRK12Suwannasing et al.[40]
ZMYND122Suwannasing et al.[40]
RIMKLA2Suwannasing et al.[40]
RTL42Suwannasing et al.[40]
UBE4B3Suwannasing et al.[40]
ALDH1A22Wu et al.[37]
GABRA52Wu et al.[37]
INPP4B2Wu et al.[37]
DNAJC62Wu et al.[37]
QKI2Wu et al.[37]
SOX62Wu et al.[37]
SBPRKD15Chen et al.[11]
STXBP64Chen et al.[11]
PBX12Chen et al.[11]
GRM12Chen et al.[11]
CYP24A12Verardo et al.[43]
Table 4. Genes with at least two SNPs in their sequence associated with more than one of the reproduction traits: total number born (TNB), number born alive (NBA), number of stillborn (SB), or litter birth weight (LWT), or reported in more than one population.
Candidate
Gene
Publication and Population
An et al. [27]Chen et al. [11]Coster et al. [28]He et al. [29]Li et al. [31]Ma et al. [25]Sato et al. [33]Schneider
et al. [44]
Schneider
et al. [42]
Verardo
et al. [43]
Wu et al. [37]Y. Wang
et al. [36]
BerkshireDurocLarge WhiteErhualianYorkshireErhualianLarge WhiteLandrace x DurocDuroc, Yorkshire, LandraceLarge WhiteYorkshireLarge White
ASIC2 TNB TNB
CCL21 TNB, NBA
CLSTN2 TNB, NBA
COPG2 TNB, LBW
DDAH1 TNB TNB, NBA
EIF3M TNB, NBA
FAT2 TNB, NBA
GABRA5 TNB TNB
HECW1 TNB, NBA
IGFBP2TNB
INPP4B TNB, NBA
MAPK1IP1L SBSB
NEK10 TNB TNB
PARD3 TNB, NBA
PRKD1 SBNBA
RAD50 TNB, NBA
SAMD4A CLN SB
STXBP6 SB TNB
UBE3A TNB, NBA
UNC13C TNB, NBA
ZFYVE9 TNB, NBA CLN
Table 5. Gene Ontology analysis for genes associated with total number born, number born alive, number of stillborn, litter birth weight, and corpus luteum number in pigs.
GO TermBiological Processes (with Hierarchy When Applicable)Observed GenesExpected GenesFDR
9987cellular process 177148.910.019
7399Genes 13 01730 i001nervous system development 3215.20.027
21785 Genes 13 01730 i002branchiomotor neuron axon guidance 30.060.02
48518positive regulation of the biological process 7749.50.012
31344Genes 13 01730 i003regulation of cell projection organization 174.360.003
120035 Genes 13 01730 i004regulation of plasma membrane-bounded cell projection organization 174.290.003
51489 Genes 13 01730 i005regulation of filopodium assembly 50.320.012
51491 Genes 13 01730 i006positive regulation of filopodium assembly40.170.016
51239regulation of multicellular organismal process 4120.210.009
43536Genes 13 01730 i007positive regulation of blood vessel endothelial cell migration 50.450.04
90050 Genes 13 01730 i008positive regulation of cell migration involved in sprouting angiogenesis 40.20.026
8299isoprenoid biosynthetic process 40.240.043
48813dendrite morphogenesis 50.460.042
22603regulation of anatomical structure morphogenesis 196.880.033
10975Genes 13 01730 i009regulation of neuron projection development 142.840.002
50770 Genes 13 01730 i010regulation of axonogenesis 81.130.013
50771 Genes 13 01730 i011negative regulation of axonogenesis 50.480.048
34765regulation of ion transmembrane transport 123.250.044
1904062Genes 13 01730 i012regulation of cation transmembrane transport 122.250.004
48583regulation of response to stimulus 5430.140.009
50920Genes 13 01730 i013regulation of chemotaxis 91.780.037
32409regulation of transporter activity 91.80.039
1655urogenital system development 122.550.01
72001Genes 13 01730 i014renal system development 102.290.044
44057regulation of system process 143.570.013
65008regulation of biological quality 5630.030.003
42592Genes 13 01730 i015homeostatic process 2912.430.013
48878 Genes 13 01730 i016chemical homeostasis 238.890.019
51240positive regulation of multicellular organismal process 2510.620.033
10646regulation of cell communication 4525.740.048
9966Genes 13 01730 i017regulation of signal transduction 4222.780.033
51179localization 7444.320.003
51234Genes 13 01730 i018establishment of localization 6033.770.004
6810 Genes 13 01730 i019transport 5732.40.009
Table 6. Descriptive statistics of total number born (with SD), number born alive (with SD), number of stillborn, and mummies per genotype of rs81300422 for sows ♀ and boars ♂ from a synthetic boar line and its crosses.
LineGenotypeNTNBNBASBMummies
Synthetic boar line ♀0/017,52710.13 (3.10)9.28 (3.10)0.850.30
0/1324710.07 (3.05)9.29 (3.02)0.780.32
1/111510.03 (2.95)9.46 (2.85)0.570.39
Synthetic boar line ♂0/025,50010.08 (3.10)9.23 (3.10)0.850.33
0/143339.95 (3.18)9.12 (3.17)0.830.37
1/12319.64 (3.01)8.86 (2.94)0.780.34
Crossbreed 10/032,01516.56 (3.89)15.39 (3.74)1.170.39
0/1529016.52 (3.86)15.30 (3.75)1.210.35
1/120616.41 (4.08)15.37 (3.84)1.040.43
Crossbreed 2 ♂0/054,82416.00 (3.93)15.06 (3.85)0.940.36
0/1971416.02 (3.80)15.05 (3.78)0.970.36
1/117215.83 (4.08)15.02 (3.92)0.800.34
1 Synthetic boar line × (Large White × Landrace) 2 Synthetic boar line × (Landrace × Large White).
Publisher’s Note: MDPI stays neutral with regard to jurisdictional claims in published maps and institutional affiliations.

