Article

Slc4 Gene Family in Spotted Sea Bass (Lateolabrax maculatus): Structure, Evolution, and Expression Profiling in Response to Alkalinity Stress and Salinity Changes

Key Laboratory of Mariculture, Ocean University of China, Ministry of Education, Qingdao 266003, China
*
Author to whom correspondence should be addressed.
These authors contributed equally to this work.
Genes 2020, 11(11), 1271; https://doi.org/10.3390/genes11111271
Submission received: 25 September 2020 / Revised: 23 October 2020 / Accepted: 26 October 2020 / Published: 28 October 2020
(This article belongs to the Special Issue Genetic Research in Aquaculture)

Abstract

:
The solute carrier 4 (SLC4) family is a class of cell membranes transporters involved in base transport that plays crucial roles in diverse physiological processes. In our study, 15 slc4 genes were identified and annotated in spotted sea bass, including five members of Cl/HCO3 exchangers, eight genes coding Na+-dependent HCO3 transporters, and two copies of Na+-coupled borate transporters. The gene sequence and structure, chromosomal and syntenic arrangement, phylogenetic and evolution profiles were analyzed. Results showed that the slc4 gene in teleosts obviously expanded compared with higher vertebrates, arising from teleost-specific whole genome duplication event. Most gene sites of slc4 in spotted sea bass were under strong purifying selection during evolution, while positive selection sites were only detected in slc4a1b, slc4a8, and slc4a10b. Additionally, qRT-PCR results showed that different slc4 genes exhibited distinct branchial expression patterns after alkalinity and salinity stresses, of which the strongly responsive members may play essential roles during these physiological processes. Our study provides the systemic overview of the slc4 gene family in spotted sea bass and enables a better understanding for the evolution of this family and further deciphering the biological roles in maintaining ion and acid–base homeostasis in teleosts.

1. Introduction

The solute carrier 4 (SLC4) family members are integral membrane proteins which carry bicarbonate (HCO3) or/and carbonate (CO32−) and other electrolytes (e.g., Na+ and Cl) across the plasma membrane [1]. These transporters are responsible for maintaining both intracellular and extracellular pH in all eukaryotes [2,3]. Based on the specific transport modes, SLC4 gene family proteins were classified into three functional groups in mammals: (1) Na+-independent, Cl/HCO3 exchangers including SLC4A1, SLC4A2, and SLC4A3; (2) Na+-dependent HCO3 transporters, containing electrogenic Na+/HCO3 cotransporters (SLC4A4, SLC4A5), electroneutral Na+/HCO3 cotransporters (SLC4A7, SLC4A10), and electroneutral Na+-driven Cl/HCO3 exchanger (SLC4A8); (3) Na+-coupled borate transporter that do not transport bicarbonate, which include the unique member SLC4A11 [2,4,5]. However, the classification of SLC4A9 remains unclear because its function is still incompletely characterized, although both Cl/HCO3 exchange and Na+-dependent HCO3 transport functions were reported in the previous studies about SLC4A9 [6,7,8].
As a result of the importance in regulating pH and maintaining acid–base homeostasis, SLC4 genes have been studied extensively to define their roles in mammals [9,10,11]. Compared with terrestrial vertebrates, studies about slc4 genes in fishes remain limited, however, accumulating evidences support the hypothesis that slc4 genes are closely associated with both acid/base and ion regulation in fishes [12,13]. For instance, slc4a1 and slc4a4 have been proposed to play critical roles in ion regulatory pathways in gills of zebrafish (Danio rerio) [14]. slc4a1, slc4a2, and slc4a4 were considered as the contributors for alkali-adaption in gill and kidney of Amur ide (Leuciscus waleckii) [15]. Salinity-dependent expression patterns of slc4a4 genes were observed in the anterior intestine of sea bream (Sparus aurata L.) [16]. Similarly, slc4a4 gene were induced significantly in the intestine of mefugu (Takifugu obscurus) [17] and tilapia (Oreochromis mossambicus) [13] during seawater-acclimated processes. However, those studies in fishes were focused on single or partial members of slc4 genes. Therefore, it is of great significance to systematically characterize slc4 genes and distinguish their functions in teleost.
Spotted sea bass (Lateolabrax maculatus) is one of the most promising aquaculture marine fish species in East Asia for its high nutritive value and pleasant taste [18,19]. In addition, spotted sea bass is well known for its ability to adapt to a wide range of salinity environments from complete fresh water (0‰, FW) to sea water (45‰, SW) [20]. Moreover, our previously experiment has proved that spotted sea bass can adapt well to the alkaline water (10 mmol/L) for more than two months and could survive in the water with relative highly alkalinity (18 mmol/L) for more than two weeks. Hence, spotted sea bass represented an ideal model to study the mechanisms of adaptation to extreme salinity and high alkalinity environments. To investigate the potential functions of slc4 gene family members in response to salinity adaptation and alkalinity stress, in the present study, a complete set of 15 slc4 genes were identified and characterized in the spotted sea bass. Phylogenetic and syntenic analyses were conducted to confirm the gene annotation and investigate the evolution relationships of slc4 genes. The gene structure and selective pressure analysis was performed to explore further molecular basis for gene functional studies. Moreover, expression patterns of L. maculatus slc4 genes were determined in gills during acclimation to extreme salinities (sea water and fresh water, respectively) and high alkalinity environments. Our findings provide insight into the structure, evolution, and potential function of the spotted sea bass slc4 genes.

2. Materials and methods

2.1. Ethics Statement

All animal experiments were conducted in accordance with the guidelines and approval of the respective Animal Research and Ethics Committees of Ocean University of China (Permit Number: 20141201). The field studies did not involve endangered or protected species.

2.2. Genome-Wide Identification of Spotted Sea Bass Slc4 Genes

The amino acid sequence of slc4 genes in humans (Homo sapiens) and zebrafish (Danio rerio) were downloaded from the NCBI database and used as queries for BLAST program. TBLASTN (1 × 10⁵) program was performed to obtain the cDNA sequences by searching the reference genome (PRJNA408177), Iso-Seq (PRJNA515783), and RNA-Seq databases (PRJNA347604) of spotted sea bass. Open reading frames (ORF) of candidate spotted sea bass slc4 genes were predicted by ORF finder program. The annotation results were further verified by BLAST against the NCBI non-redundant (NR) protein sequence database.

2.3. Phylogenetic and Syntenic Analysis

Phylogenetic analysis was conducted by using predicted amino acid sequences of spotted sea bass slc4 genes combined with the amino acid sequences from several selected vertebrate species, including human (Homo sapiens), mouse (Mus musculus), chicken (Gallus gallus), cow (Bos taurus), Japanese medaka (Oryzias latipes), Nile tilapia (Oreochromis niloticus), torafugu (Takifugu rubripes), channel catfish (Ictalurus punctatus), Atlantic cod (Gadus morhua), European sea bass (Dicentrarchus labrax), large yellow croaker (Larimichthys crocea), and zebrafish (Danio rerio). The phylogenetic tree was constructed using MEGA 7.0 software based on the Neighbor-Joining method and Jones-Taylor-Thornton (JTT) model with bootstrap value setting as 1000.
Syntenic analysis was conducted by comparing genomic regions that harbor slc4 genes in spotted sea bass with that in zebrafish and tilapia. The genomic regions surrounding slc4 genes in zebrafish and tilapia were determined according to Ensembl and Genomics databases. Gene full names are presented in Table S1. The spotted sea bass genome database was used to obtain information about chromosome collinear block. The chromosomal location of each slc4 gene was displayed according to its coordinates on the genome.

2.4. Gene Structure and Domain Analysis

The functional domain architectures of slc4 genes in spotted sea bass were predicted by the SMART 7.0 program. The exon–intron structures of slc4 genes in spotted sea bass were obtained from the General feature format (GFF) file of reference genome, which were subsequently visualized using online GSDS 2.0 software. The molecular weight (MW, kDa) and isoelectric point (pI) of each putative Slc4 protein were calculated using the ExPASy Prot-Param tool.

2.5. Selective Pressure Analysis

The coding sequences of slc4 genes in human, mouse, chicken, cow, zebrafish, channel catfish, Atlantic cod, Japanese medaka, torafugu, larger yellow croaker, European sea bass, and spotted sea bass were translated into protein sequences and aligned with MEGA7 software, respectively [21], and the aligned protein sequences of each slc4 gene were used to construct nine unrooted phylogenetic trees (Figure S1). Additionally, the aligned protein sequences were also back-translated into nucleotide-coding sequences for the following selection pressure analysis. To examine whether slc4 genes of spotted sea bass underwent adaptive sequence evolution, branch-site models were used to test the selection pressure using codeml software of PAML program based on the phylogenetic trees. In the branch site model (model = 2, Nsites = 2), the neutral model constrains a class of sites to have ω = 1 (fix_omega = 1, omega = 1), and the selection model allows a class of codons on the foreground branch to have ω > 1 (fix_omega = 0, omega = 1.5) [22]. A likelihood ratio test (LRT) was calculated using EasyCodeML (v1.2) for statistical significance [23]. The sites under positive selection were identified based on Bayes methods. The distribution of the positive selection site of the slc4a1b, slc4a8, and slc4a10b of spotted sea bass were shown in the secondary structure by Protter.

2.6. Carbonate Alkalinity Exposure Experiment

Carbonate alkalinity solution was prepared using NaHCO3 (12.8 mmol/L) and Na2CO3 (2.6 mmol/L), and fresh water (pH: 7.8 ± 0.4). The carbonate alkalinity (mmol/L) was monitored every day throughout the exposure period with acidimetric titrations. Before the experiment, 45 spotted sea bass (body weight: 140.32 ± 2.56 g) were acclimated in fresh water for 30 days. After that, the experimental fish were randomly assigned into three 100 L square tanks filled with alkaline water (carbonate alkalinity = 18 mmol/L), and the dissolved oxygen concentration, temperature, and pH in each test solution were maintained at 7.1 ± 0.4 mg/L, 22 ± 1 °C and 9.0 ± 0.2, respectively. The fish were not fed during the stress experiment. Three fish individuals in each tank were quickly anesthetized with MS-222 (200 mg/L) and sampled immediately for gill tissues at 0 h, 12 h, 24 h, 48 h, and 72 h after exposure. Samples were immediately placed in liquid nitrogen and then stored at −80 °C for subsequent RNA extraction.

2.7. Freshwater and Seawater Transition Experiments

All fish samples were obtained at Shuangying Aquatic Seedling Co., Ltd. (Lijin, Dongying, China). A total of 90 spotted sea bass adults (body weight: 120.66 ± 13.05 g) were randomly selected and equally placed in fresh water (0‰, FW) and sea water (30‰, SW) environments in triplicate tanks at a density of 15 individuals each tank for three weeks before the experiments. After acclimation, individuals in FW were directly transferred to SW which was labeled as FW-SW group. On the contrary, fish that were moved from SW to FW environment were marked as SW-FW group. During the whole experiments process, other experiment conditions were kept constant, including temperature (15 ± 0.5 °C), dissolved oxygen (7.1 ± 0.4 mg/L) and pH (8.0 ± 0.3). For both salinity treatment groups, 3 individuals per tank were anesthetized with MS-222 and sampled for gill tissues at 0 h (before transferring) and 12 h, 1 d, 3 d, and 7 d after transfer.

2.8. RNA Extraction and Quantitative Real-Time PCR (qPCR) Analysis

Total RNA was extracted using TRIzol® reagent (Invitrogen, Carlsbad, CA, USA). The concentration and integrity of RNA were examined by using the Biodropsis BD-1000 nucleic acid analyzer (OSTC, Beijing, China) and electrophoresis. Genomic DNA was eliminated and cDNA was synthetized using the PrimeScript™ RT reagent Kit with g DNA Eraser (Takara, Otsu, Japan). The cDNA samples were subsequently used as template for following qPCR experiment of slc4 genes experiments. qPCR reactions were performed on StepOne Plus Real-Time PCR system (Applied Biosystems, Foster City, CA, USA) using SYBR® Premix Ex Taq™ II (Tli RNaseH Plus) (Takara, Otsu, Japan) according to manufacturer instructions. All gene-specific primers used in qPCR were designed using Primer 5 software (Table S2). 18S ribosomal RNA was used as the internal control [24] and the samples were repeated in triplicate technical repeats. The total volume of the reaction is 20 containing 2 μL template cDNA, 0.4 μL each forward/reverse primers, 10 μL SYBR®FAST qPCR Master Mix (2×), 0.4 μL ROX, and 6.8 μL of nuclease-free water. qPCR process was designed as follows: 95 °C for 30 s, followed by 40 cycles at 95 °C for 5 s and 58 °C for 30 s. The relative expression level was calculated by 2∆∆Ct method.

2.9. Statistical Analysis

Data are expressed as means ± SD. The statistical analysis was performed using SPSS 21 software (SPSS Inc., Chicago, IL, USA). The mean relative mRNA expression levels of slc4 genes were assessed by one-way ANOVA and Least Significant Difference (LSD) multiple comparison. The significant level was set as p < 0.05.

3. Results

3.1. Characterizations of Slc4 Gene Sequences in Spotted Sea Bass

A total of 15 slc4 genes were identified in spotted sea bass and further classified into three classes based on the reported classification of Liu and Alper [3,4], including 5 genes of Na+-independent Cl/HCO3 exchangers (Cl/HCO3 exchanger) (slc4a1a, slc4a1b, slc4a2a, slc4a2b, slc4a3), 8 members of Na+-dependent HCO3 transporters (Na+/HCO3 cotransporter) (slc4a4, slc4a5a, slc4a5b, slc4a7a, slc4a7b, slc4a8, slc4a10a, slc4a10b), and 2 genes belonging to Na+-coupled borate transporter (Na+/Borate cotransporter) (slc4a11a and slc4a11b). The predicted amino acids sizes of slc4 genes ranged from 771 to 1340, with the molecular weights (MWs) were varied from 94.05 kDa to 149.04 kDa. The predicted pI varied from 5.31 to 8.68 (Table 1). The cDNA sequences of these slc4 genes had been submitted to GeneBank database and their access numbers were listed in Table 1.

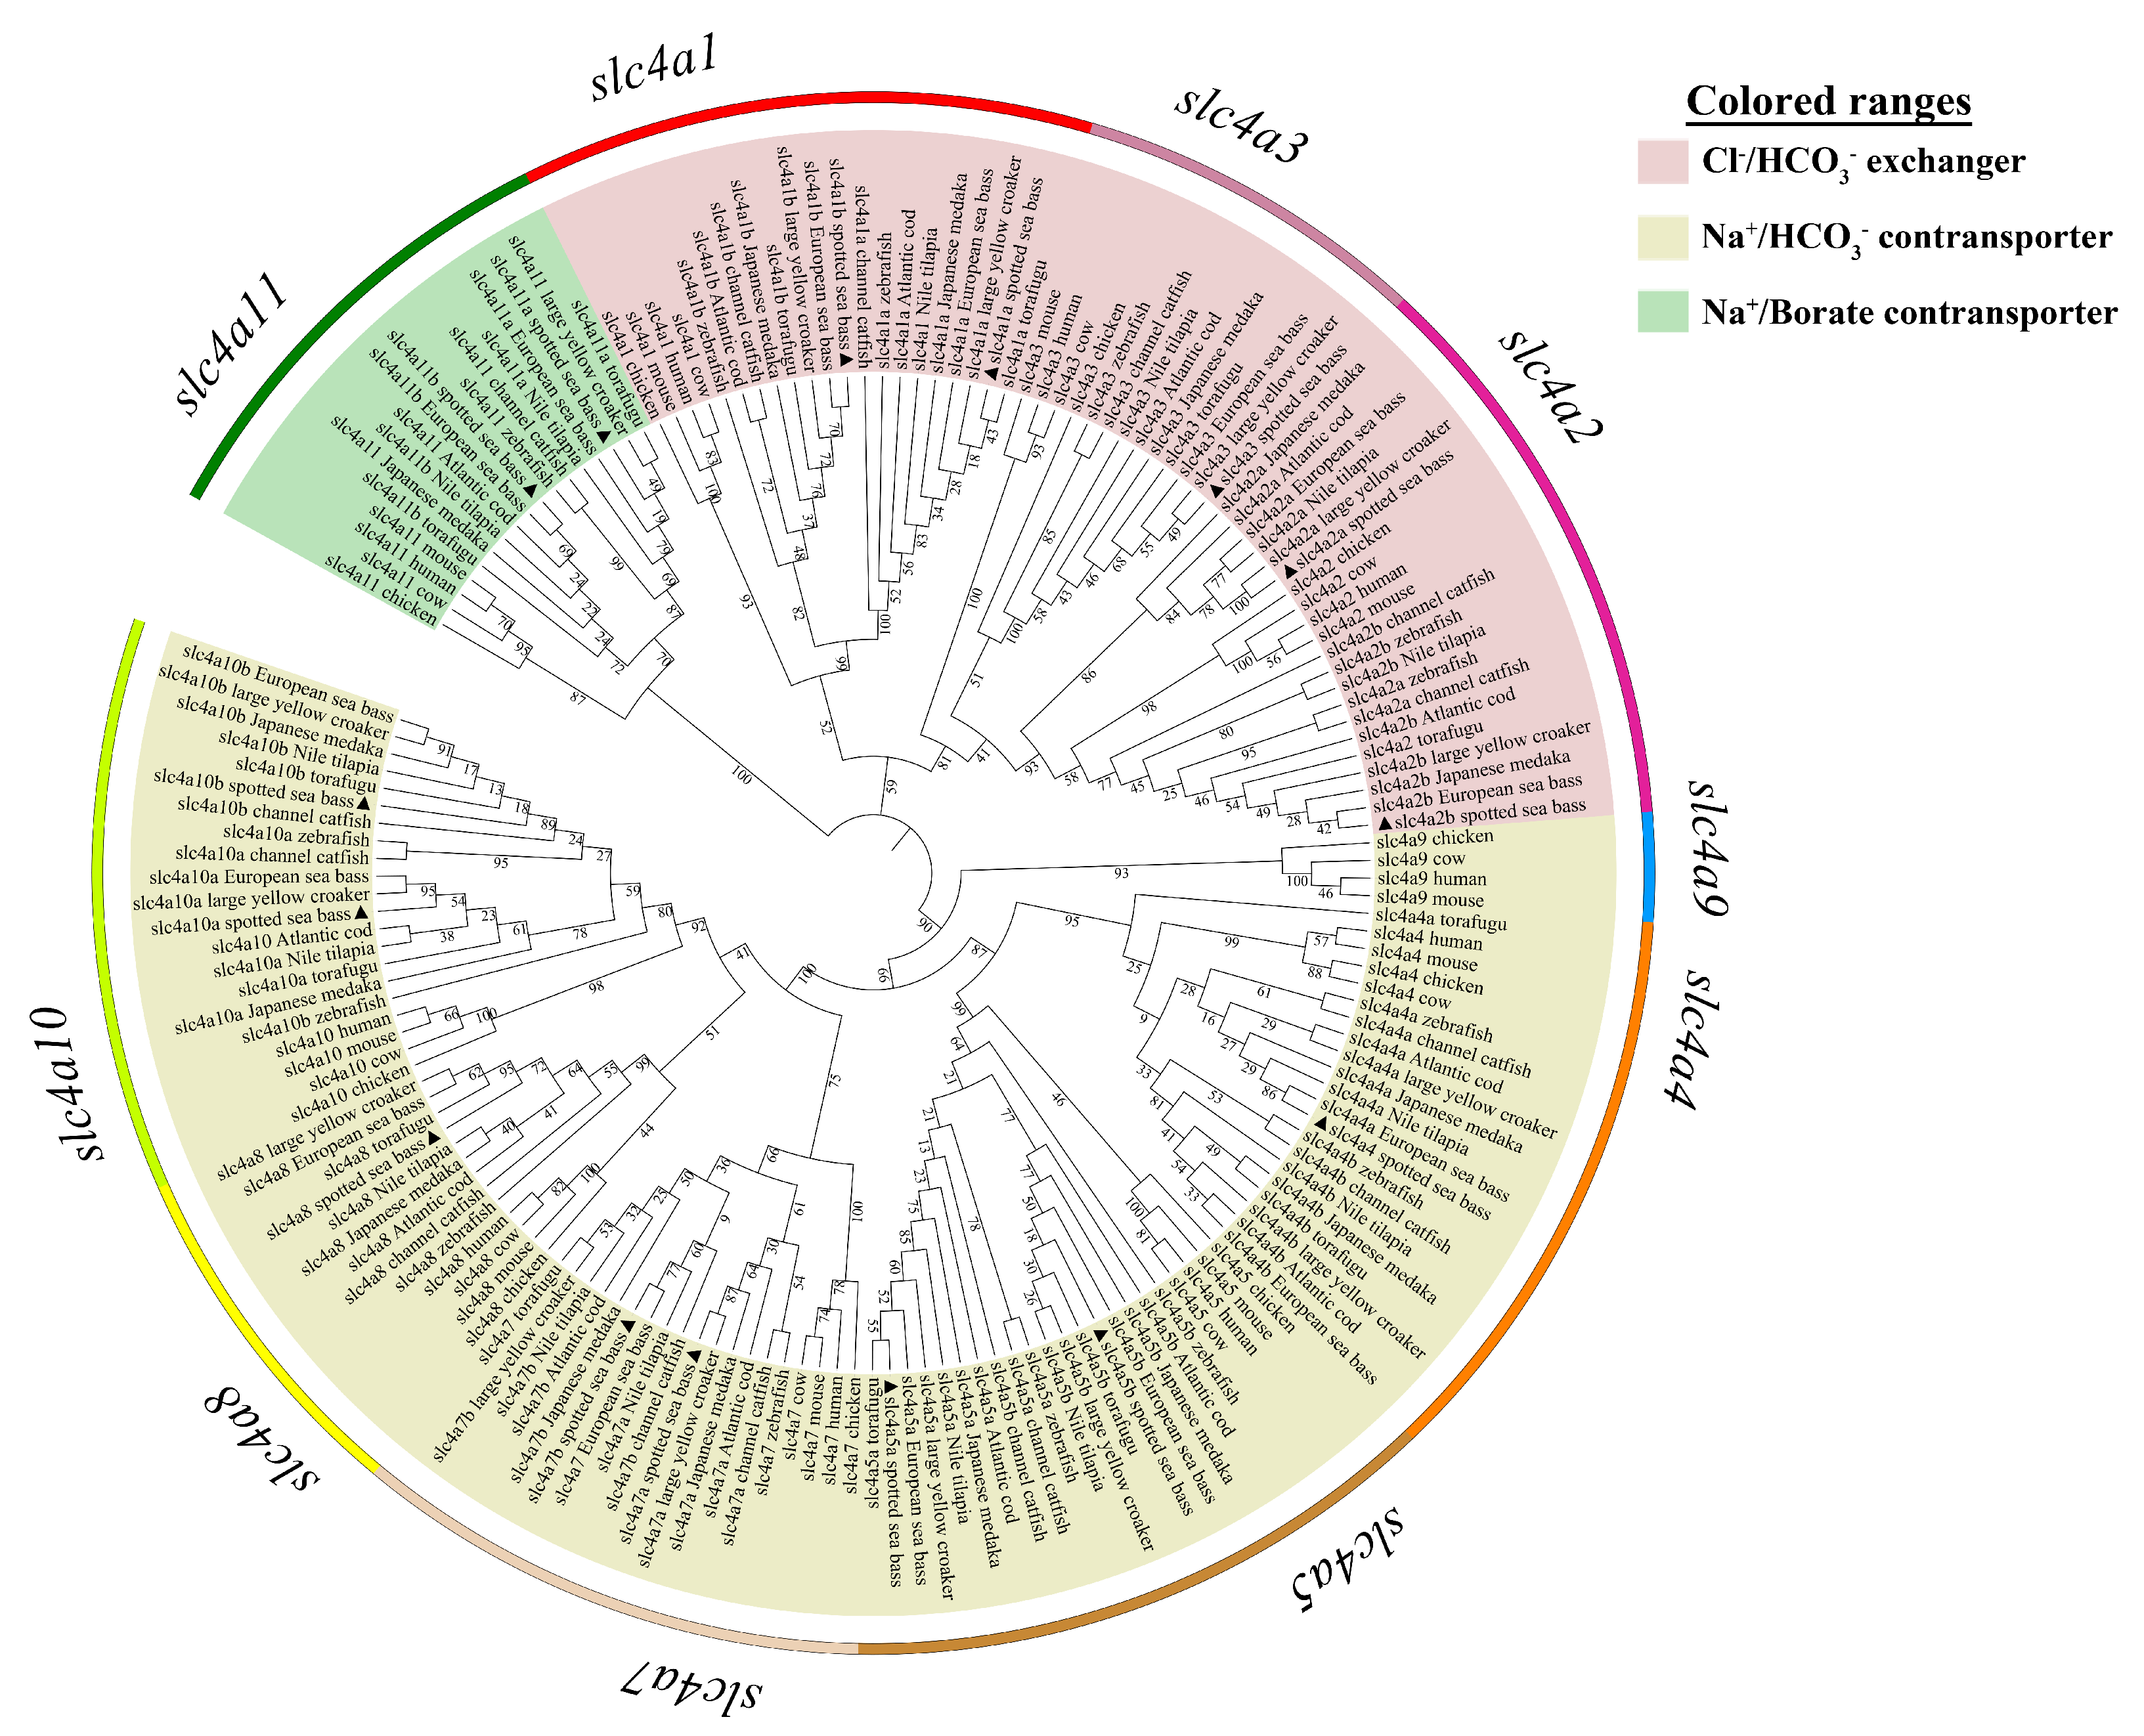
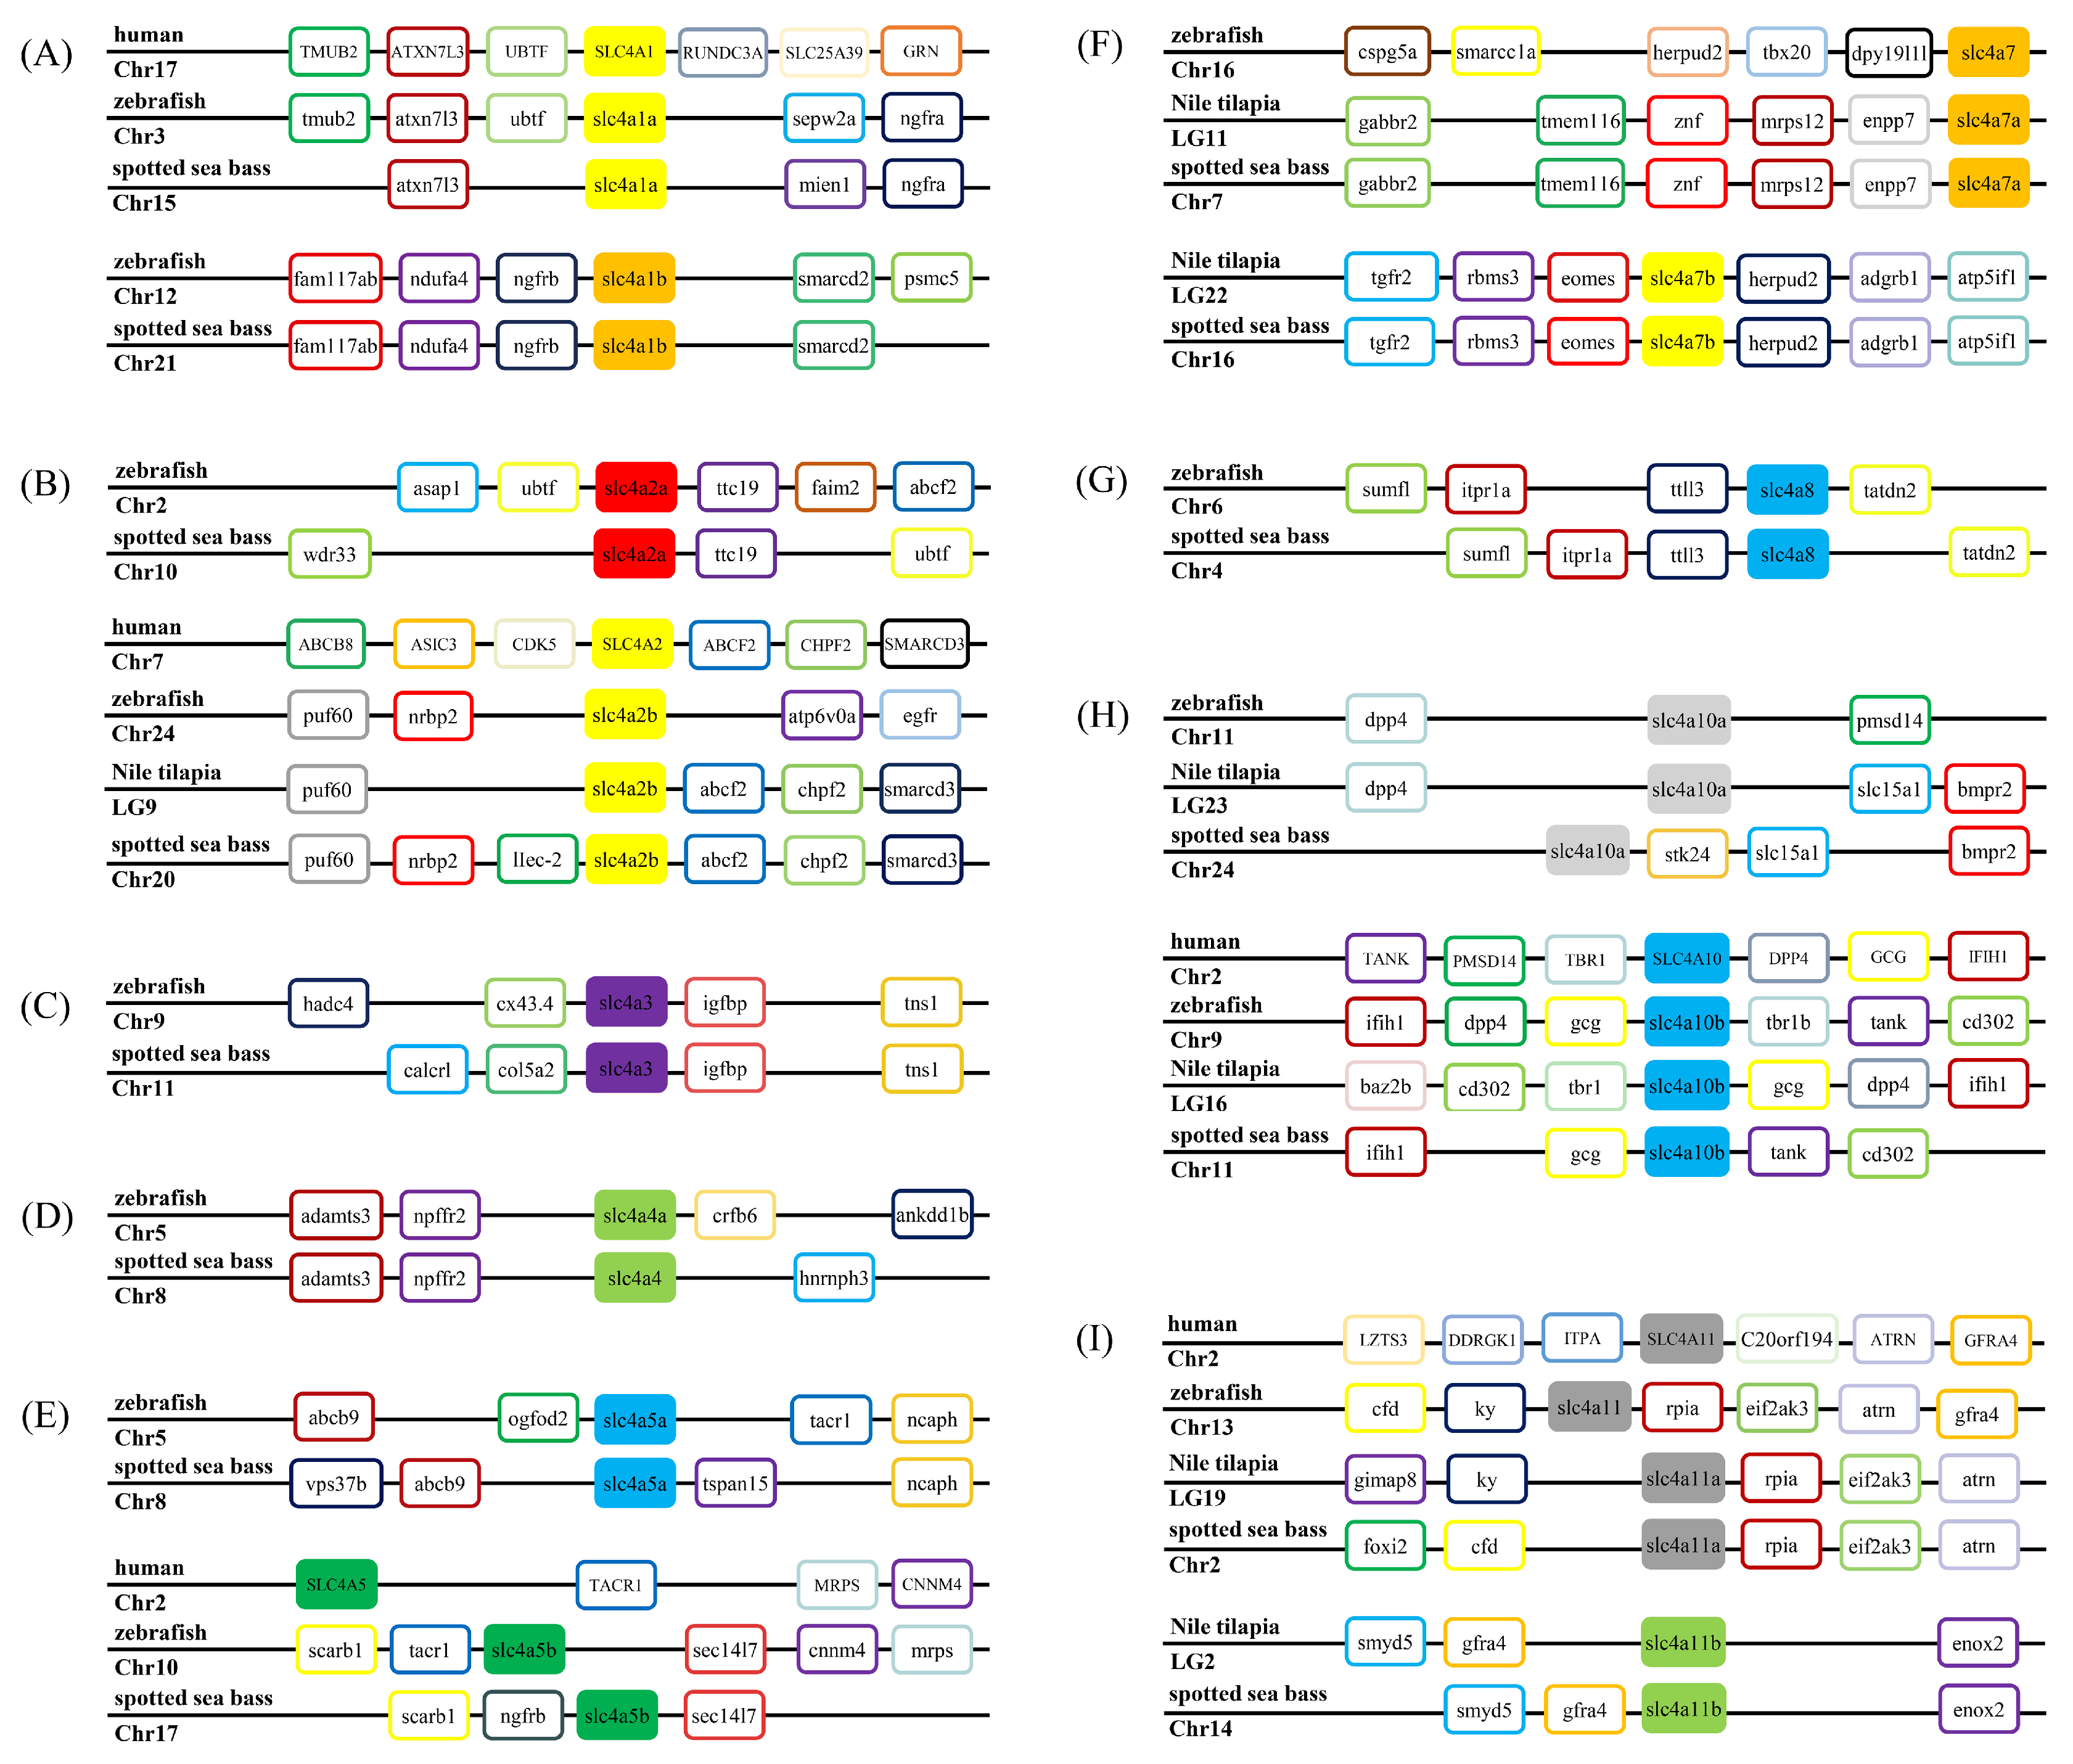
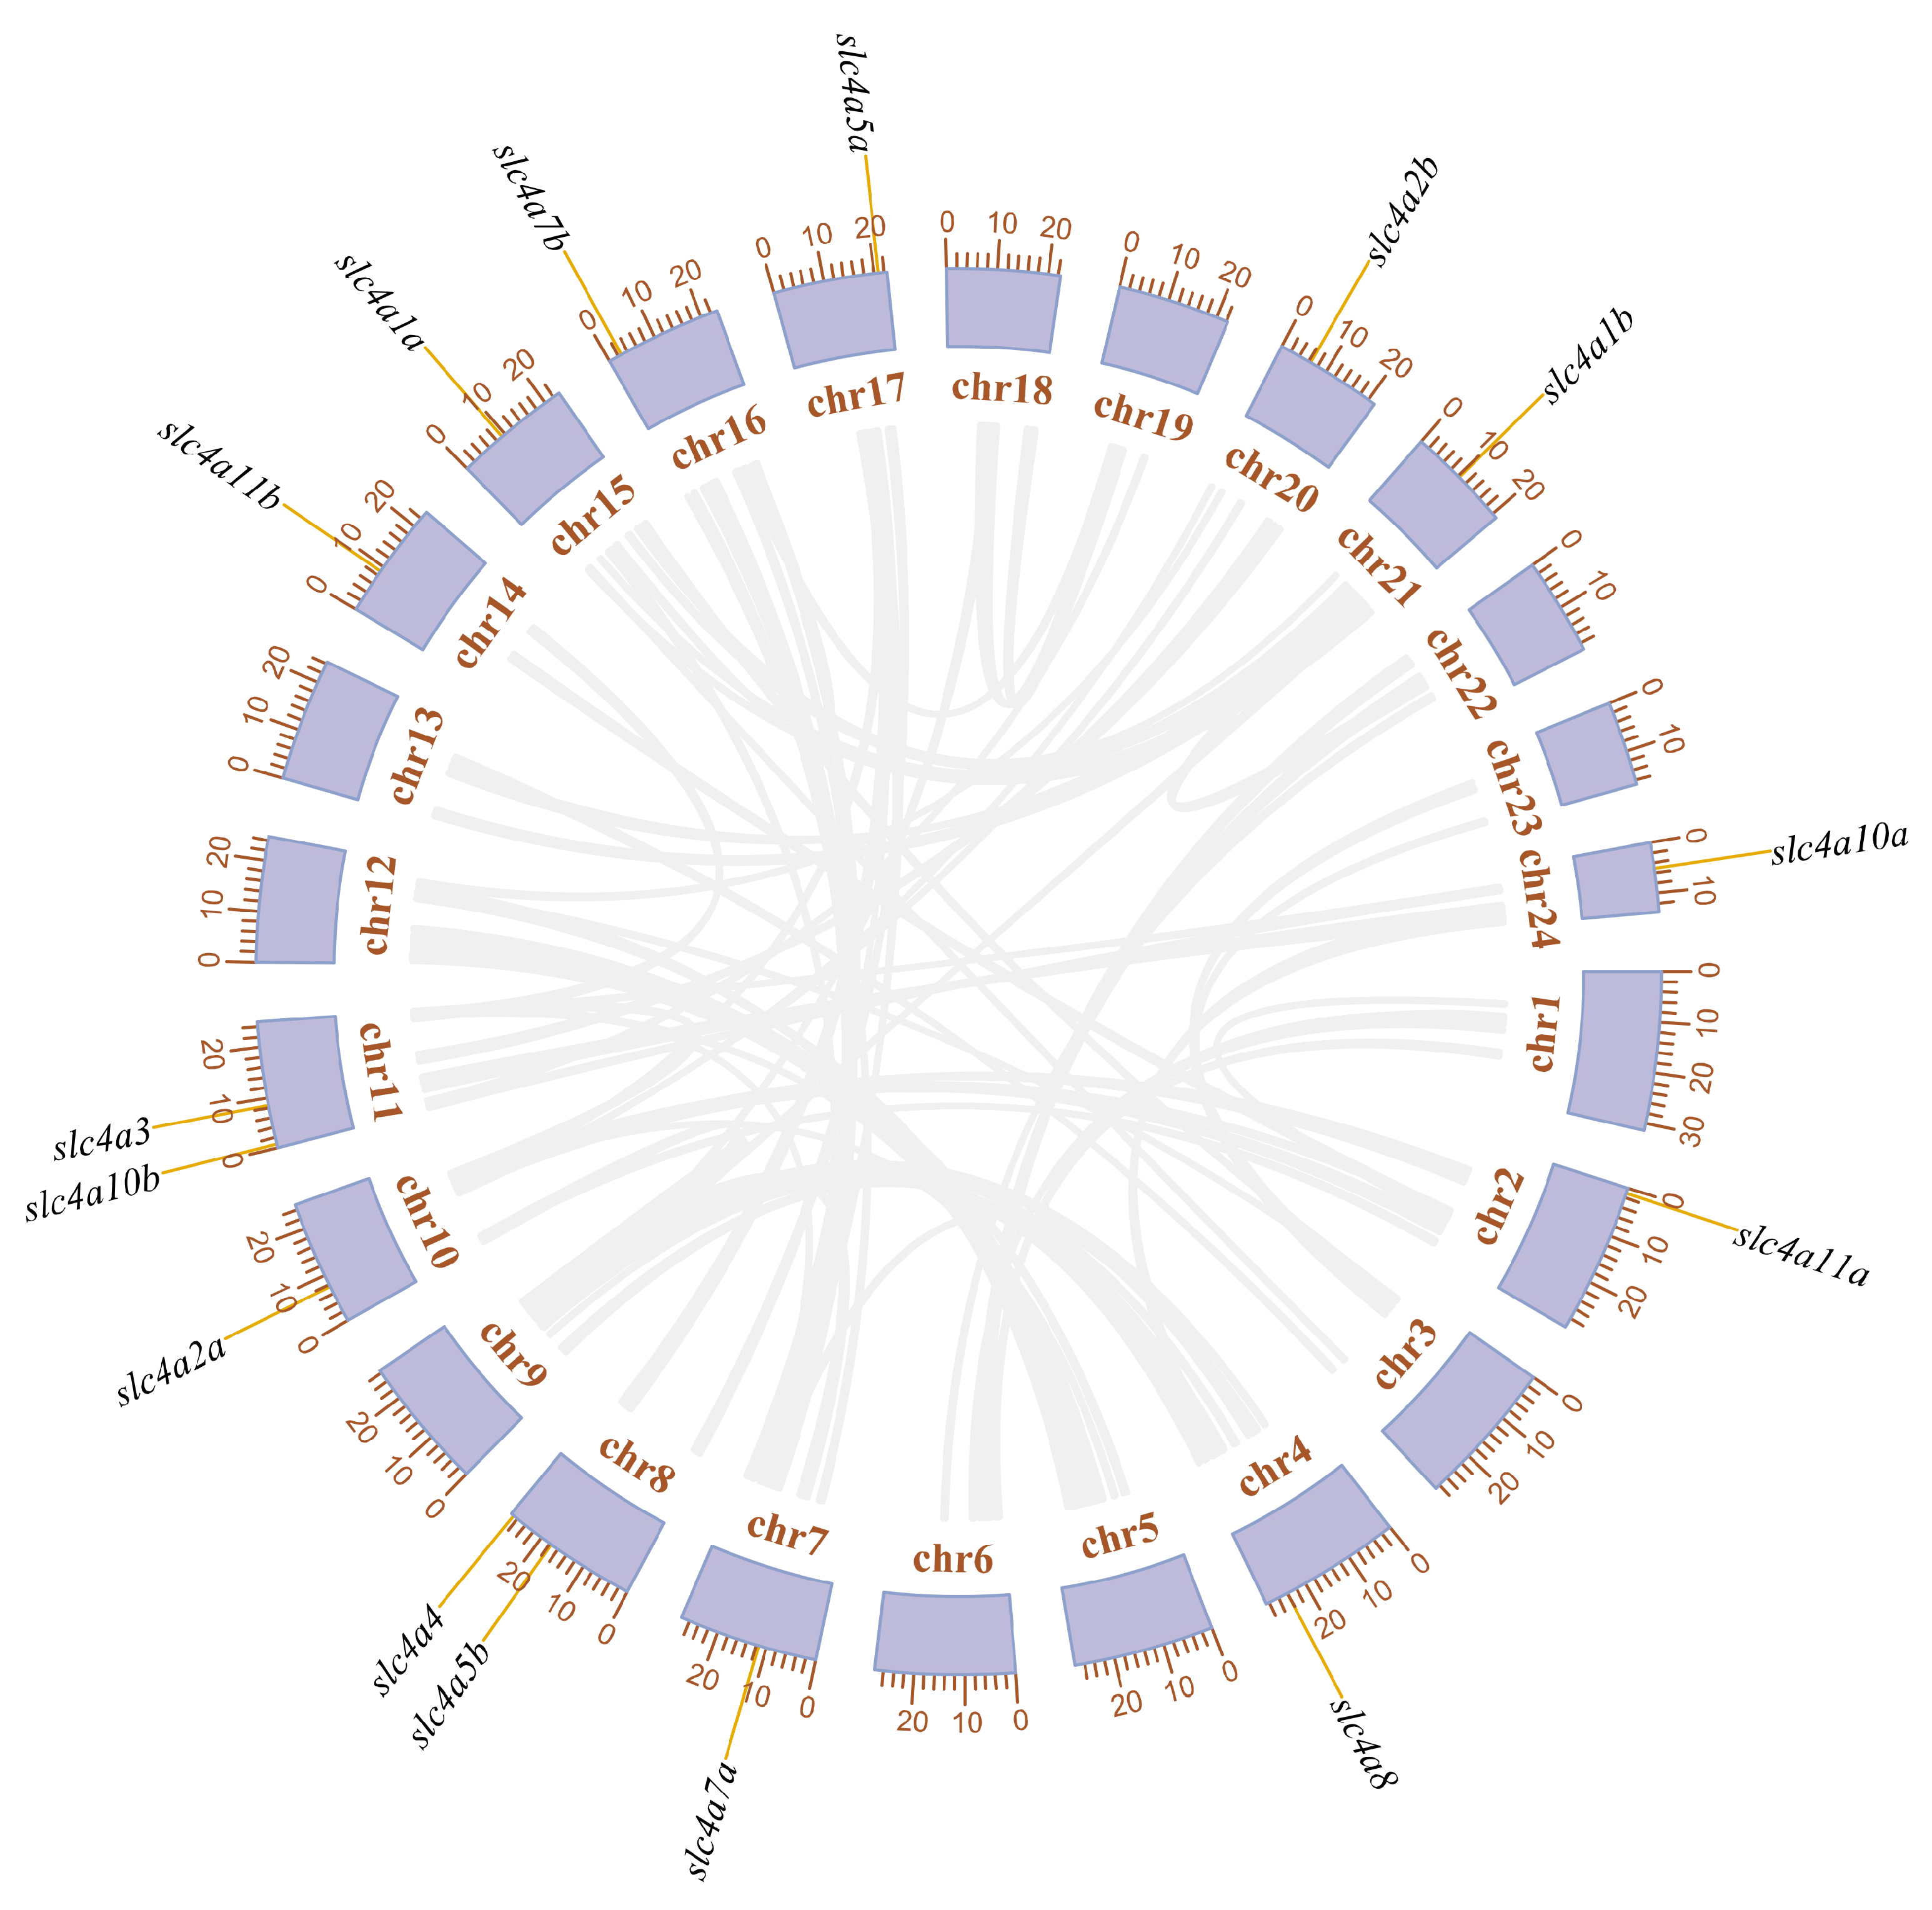
3.2. Phylogenetic, Syntenic, and Chromosomal Distribution Analysis of slc4 Genes

To confirm the annotation of slc4 genes in spotted sea bass, a phylogenetic tree was constructed using the protein sequences of slc4 genes from the selected higher vertebrates and teleosts (Figure 1). According to the topology of phylogenetic tree, these slc4 genes were divided into ten separate clades and all members of the slc4 genes in spotted sea bass were cluster together with the expected clades supported by strong bootstrap value. The ten clades were grouped into three major classes, which are consistent with their classification as defined in previous studies [4,25].
The annotation of three slc4a3, slc4a4, and slc4a8 genes with single copy could be well supported by the phylogenetic relationships (Figure 1). To provide additional evidence for the annotation and evaluate the evolution relationships of slc4 genes with multiple gene copies (slc4a1, slc4a2, slc4a5, slc4a7, slc4a10, and slc4a11), syntenic analysis were conducted to compare the neighbored genetic regions of slc4 genes among zebrafish, Nile tilapia, and spotted sea bass (Figure 2). The results indicated that slc4 genes in spotted sea bass shared a conserved genomic neighborhood with zebrafish and Nile tilapia, confirming the annotation of the duplicated slc4 gene. Therefore, our results not only well support the annotation of slc4 genes in spotted sea bass, but also indicate the slc4 genes were highly conserved in evolution.
In addition, slc4 genes in spotted sea bass were dispersed among 13 chromosomes (chrs), including chr2, chr4, chr7, chr8, chr10, chr11, chr14, chr15, chr16, chr17, chr20, chr21, and chr24 (Figure 3). Two slc4 genes (slc4a4 and slc4a5b) were located on chr8 and two (slc4a3 and slc4a10b) were located on chr11, and others were distributed on different chromosomes. Therefore, according to the chromosomal synteny analyses and location information of each slc4 genes, we were able to speculate that duplicated slc4 genes of spotted sea bass were mainly generated due to the whole genome duplication (WGD) event.

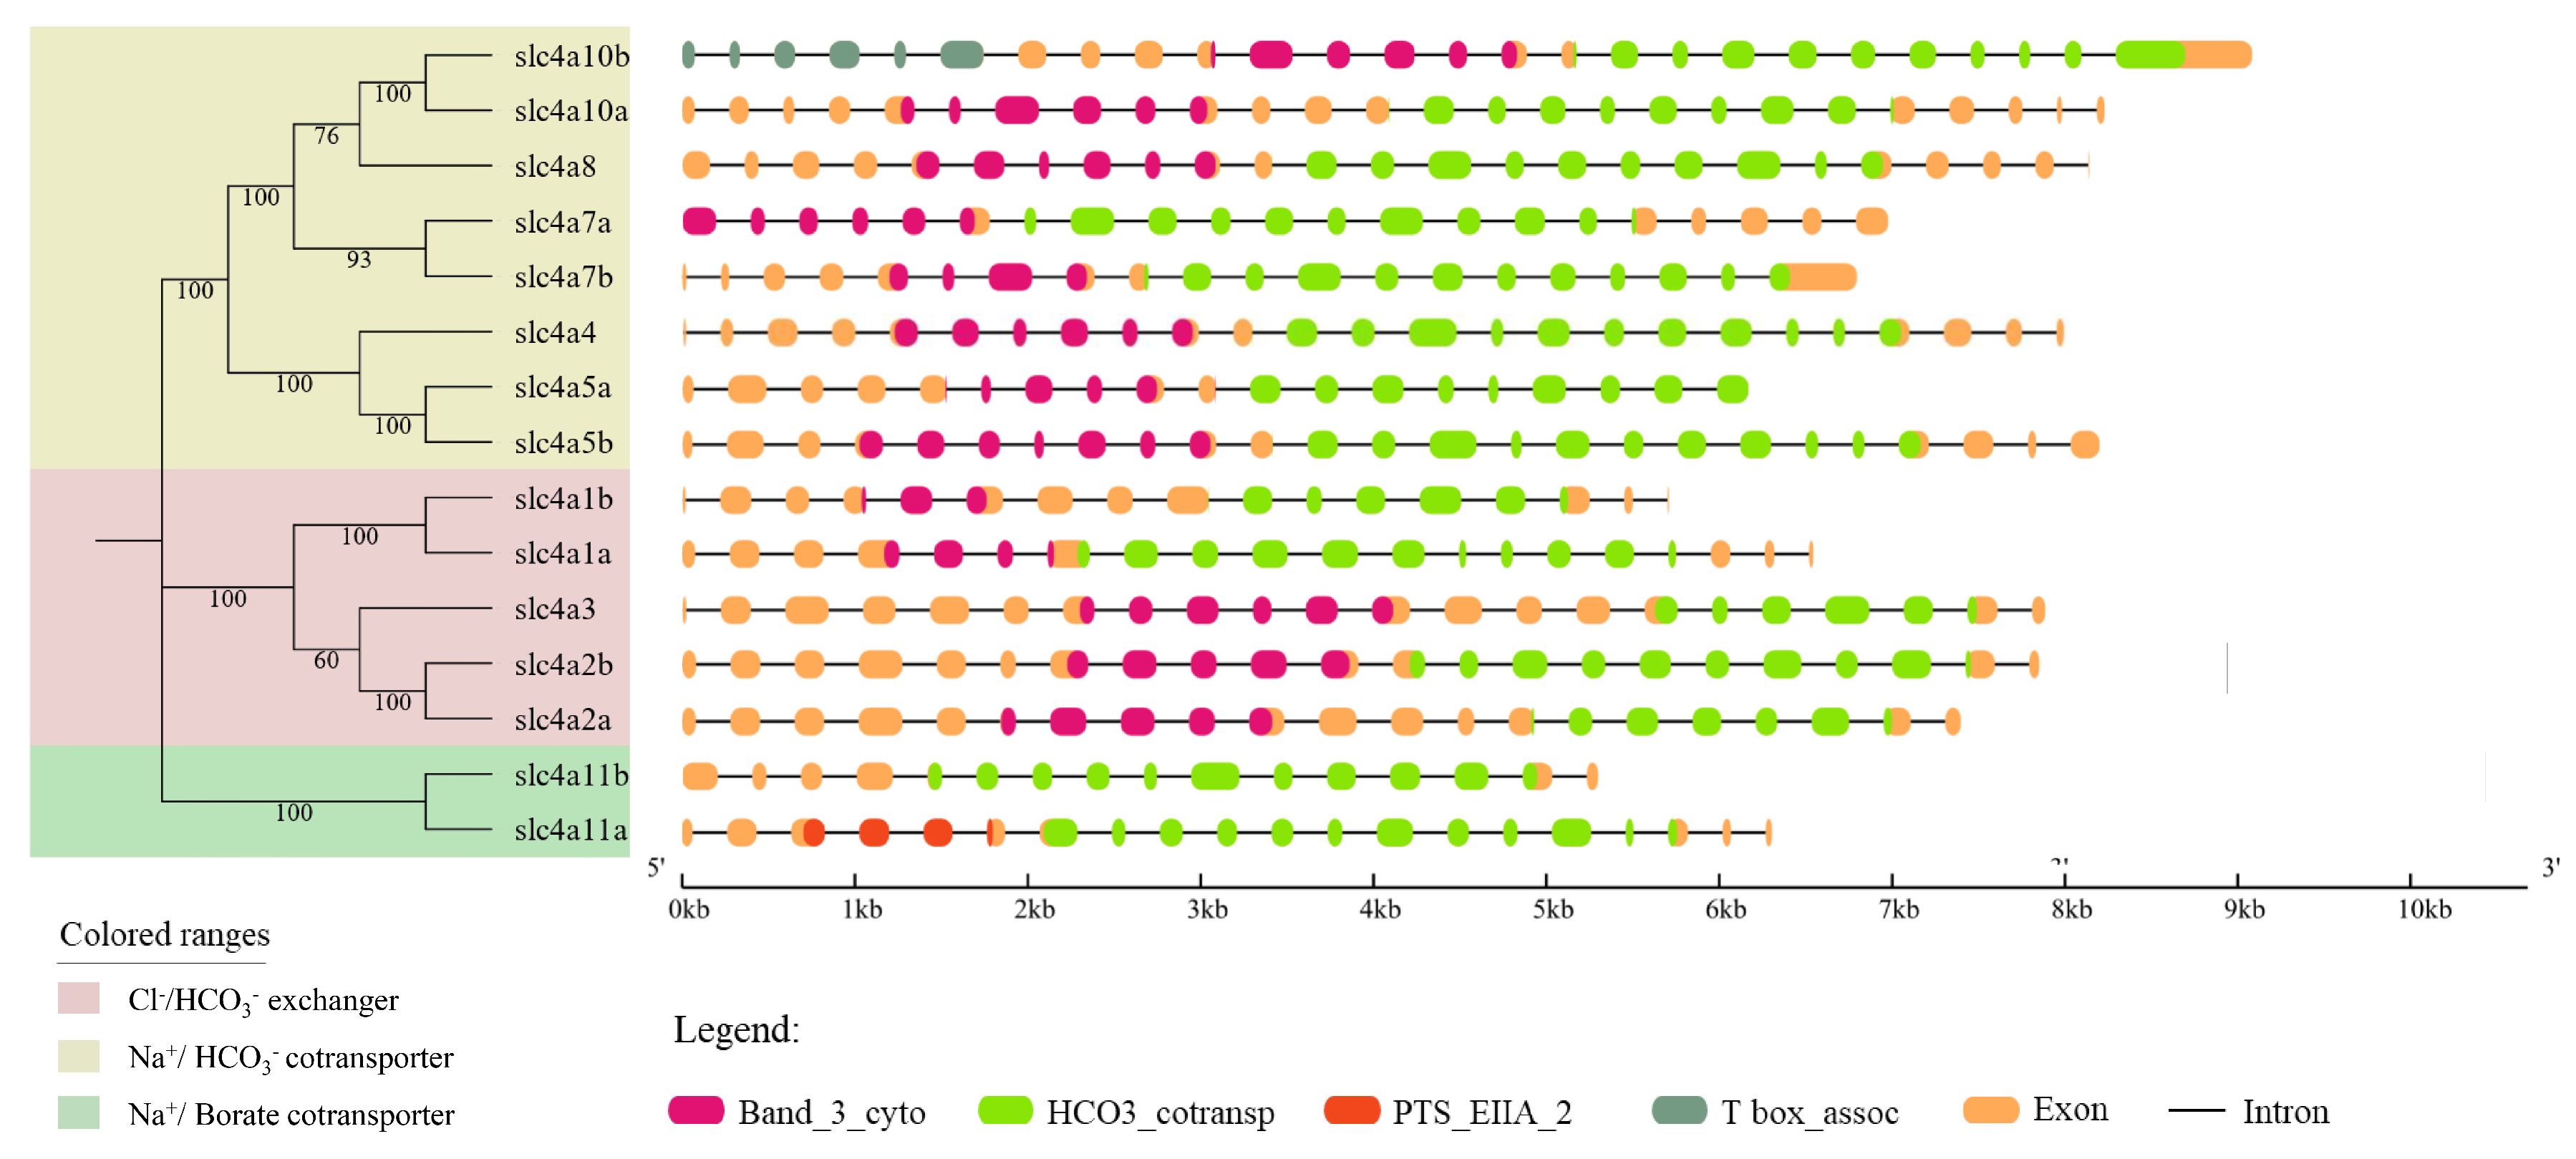
3.3. Gene Structure Analysis of Spotted Sea Bass slc4 Genes

To investigate the structural diversities of slc4 genes of spotted sea bass, their exon–intron structures were compared (Figure 4). Results showed that most members of Cl/HCO3 exchanger possessed 20–22 exons, except for slc4a1b with 17 exons. Among Na+/HCO3 group, the gene structures of slc4a4, slc4a5b, slc4a8, slc4a10a, and slc4a10b were comprise of 25 or 26 exons, while 19–21 exons were observed in slc4a5a, slc4a7a, and slc4a7b, respectively. In addition, the Na+/Borate group members, slc4a11a and slc4a11b contained 20 and 16 exons, respectively. In general, the exon–intron organizations were mainly consistent with the phylogenetic clustering results. Moreover, four functional domains (Band_3_cyto, HCO3_cotransp, T box_assoc, and PTS_EIIA_2) were predicted in slc4 genes (Figure 4). The Band_3_cyto and HCO3_cotransp domains presented in all slc4 genes of spotted sea bass except slc4a11a and slc4a11b, whereas T box_assoc domain was only observed in slc4a10b and PTS_EIIA_2 was presented solely in slc4a11a (Figure 4).

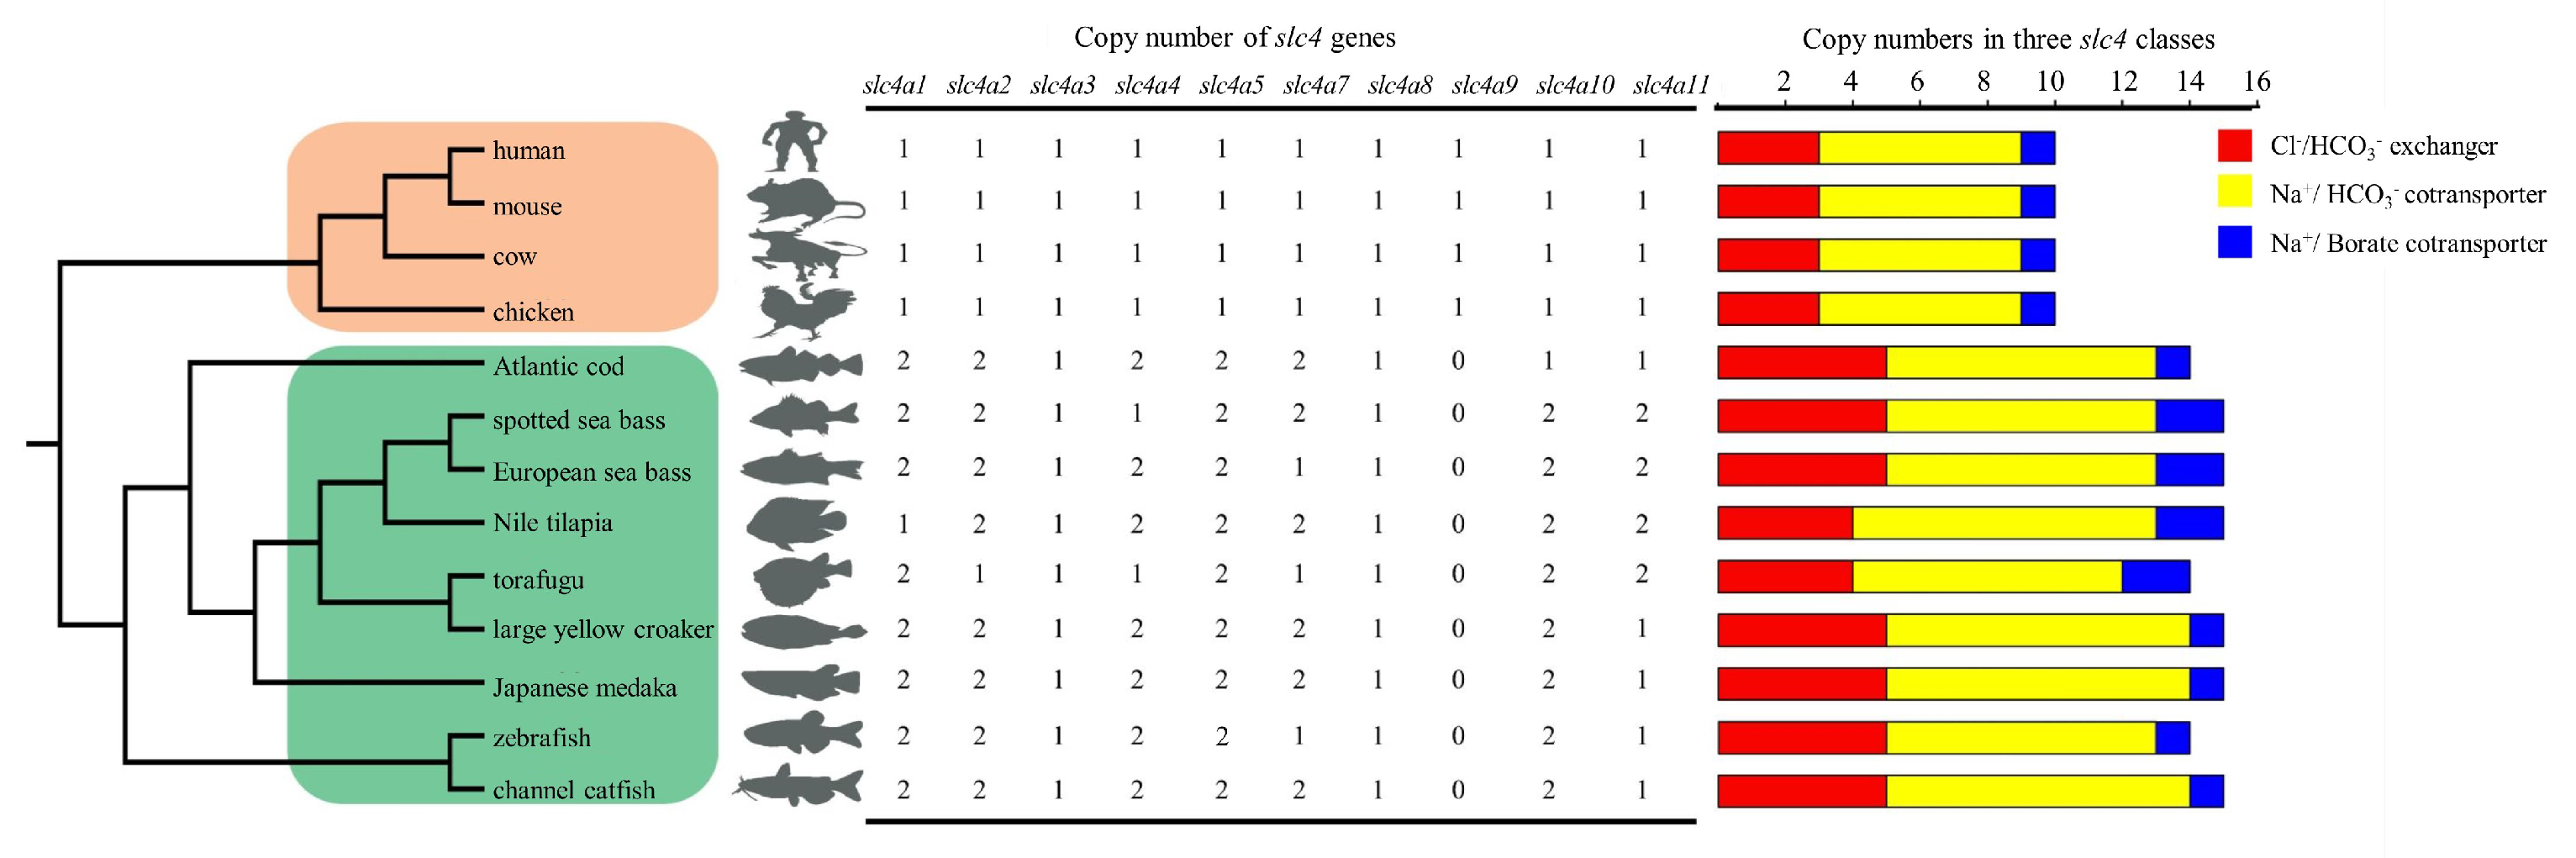
3.4. Copy Number Comparison of slc4 Genes in Selected Vertebrates

The copy number of slc4 genes from 13 representative species, covering species from higher vertebrates (human, mouse, cow and chicken) to teleosts (Atlantic cod, Japanese medaka, Nile tilapia, torafugu, channel catfish, large yellow croaker, European sea bass, spotted sea bass and zebrafish) were exhibited in Figure 5. In general, the number of slc4 genes in the selected vertebrates varied from 10 to 15. Notably, all slc4 genes in the tested higher vertebrates harbored single copy, while duplicated slc4 gene copies were frequently found in teleost genome, including slc4a1, slc4a2, slc4a4, slc4a5, slc4a7, slc4a10, and slc4a11 (Figure 5). This result indicated that slc4 gene family was significantly expanded in teleosts during evolution. In addition, it was observed that slc4a9 gene was absent in all examined teleost species (Figure 5).

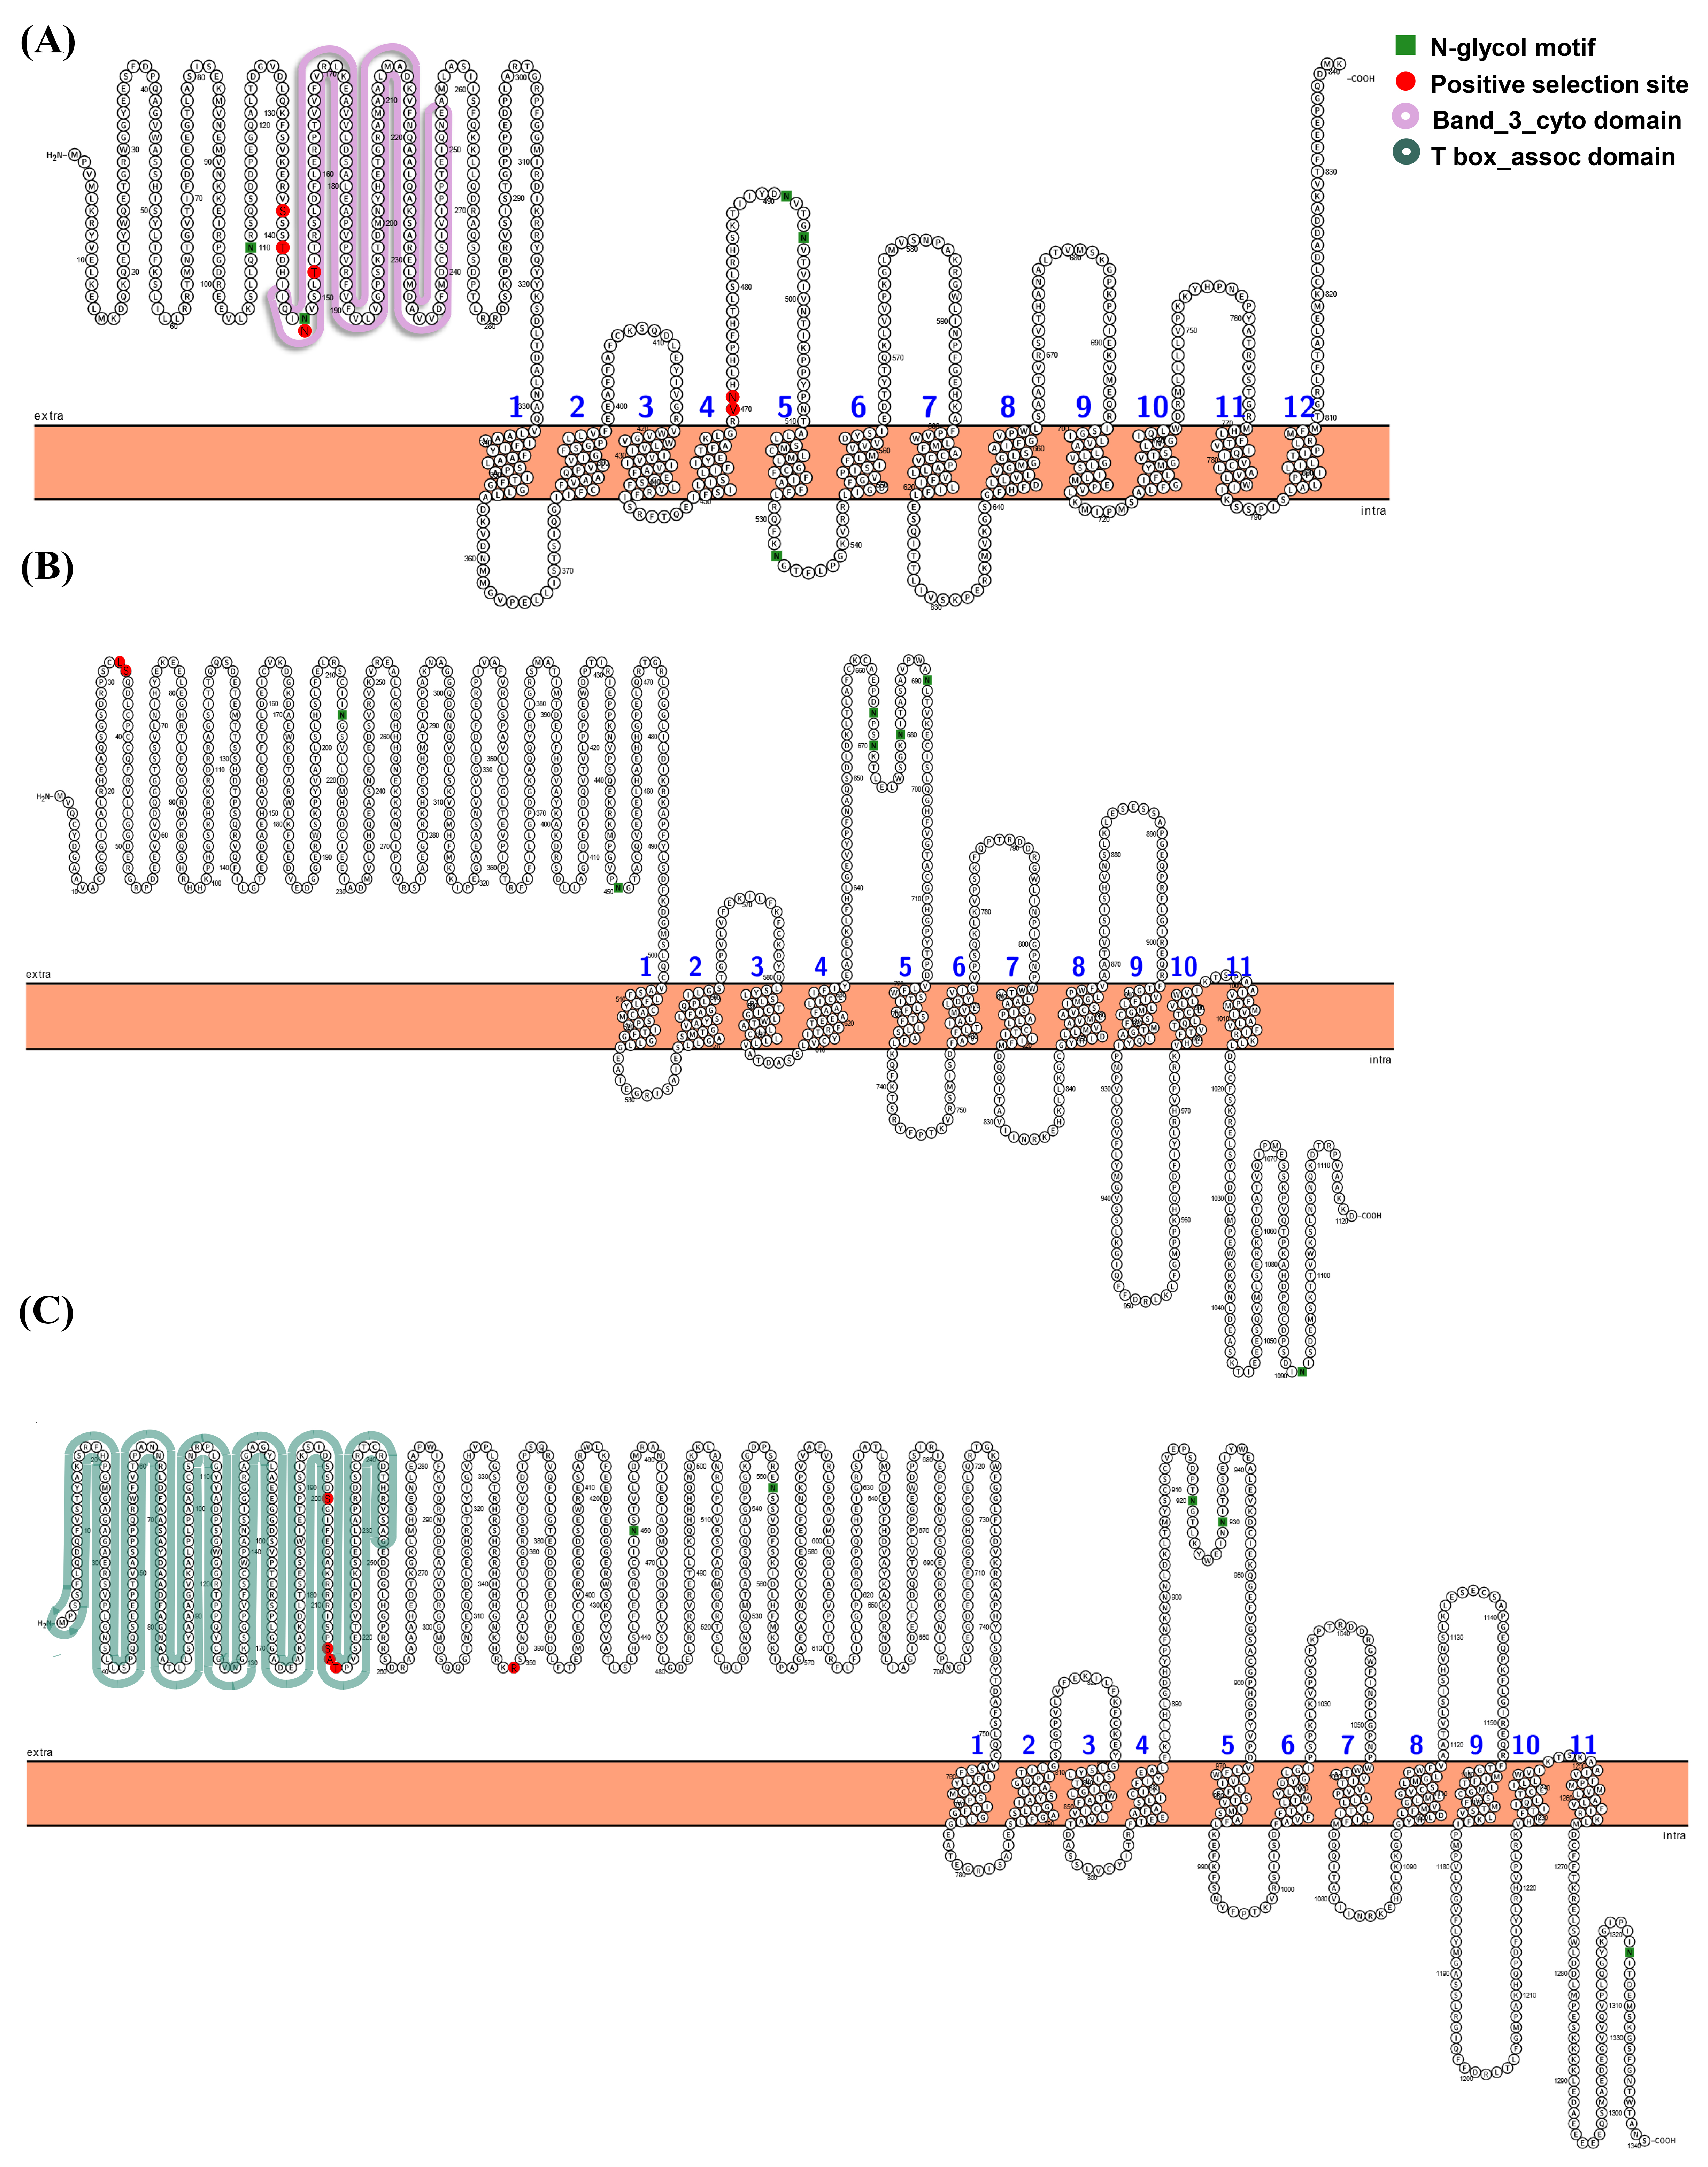
3.5. Selective Pressure Analysis

Using branch-site models, null and alternative models were compared to determine whether slc4 genes underwent positive selection in the particular lineages. The detailed parameter estimates, including likelihood value, LRT tests, p-values, and positive selected sites were summarized in Table 2. The LRT tests indicated that alternative model fitted the data significantly better than null model in slc4a1b, slc4a8, and slc4a10b of spotted sea bass (Table 2). There were 6 (138S, 141T, 148N, 152T, 470V, 471N), 2 (33L, 34S), and 5 (200S, 214S, 215A, 216T, 349R) sites were found that likely to be under positive selection (p < 0.05) along slc4a1b, slc4a8, and slc4a10b, respectively. No significant positive selection site was found in other spotted sea bass slc4 genes, which implied purifying selection during evolution. In addition, the majority of the positively selected sites we found were located in the N-terminal extracellular region. According to the position of slc4a1b, 2 positively sites (148N, 152T) were located on the Band_3_cyto domain, while 4 positively sites (200S, 214S, 215A, 216T) were located on T-box assoc domain according to the position of slc4a10b (Figure 6). It suggested that the functional diversification and adaptation might occurred in the three slc4 genes in spotted sea bass.

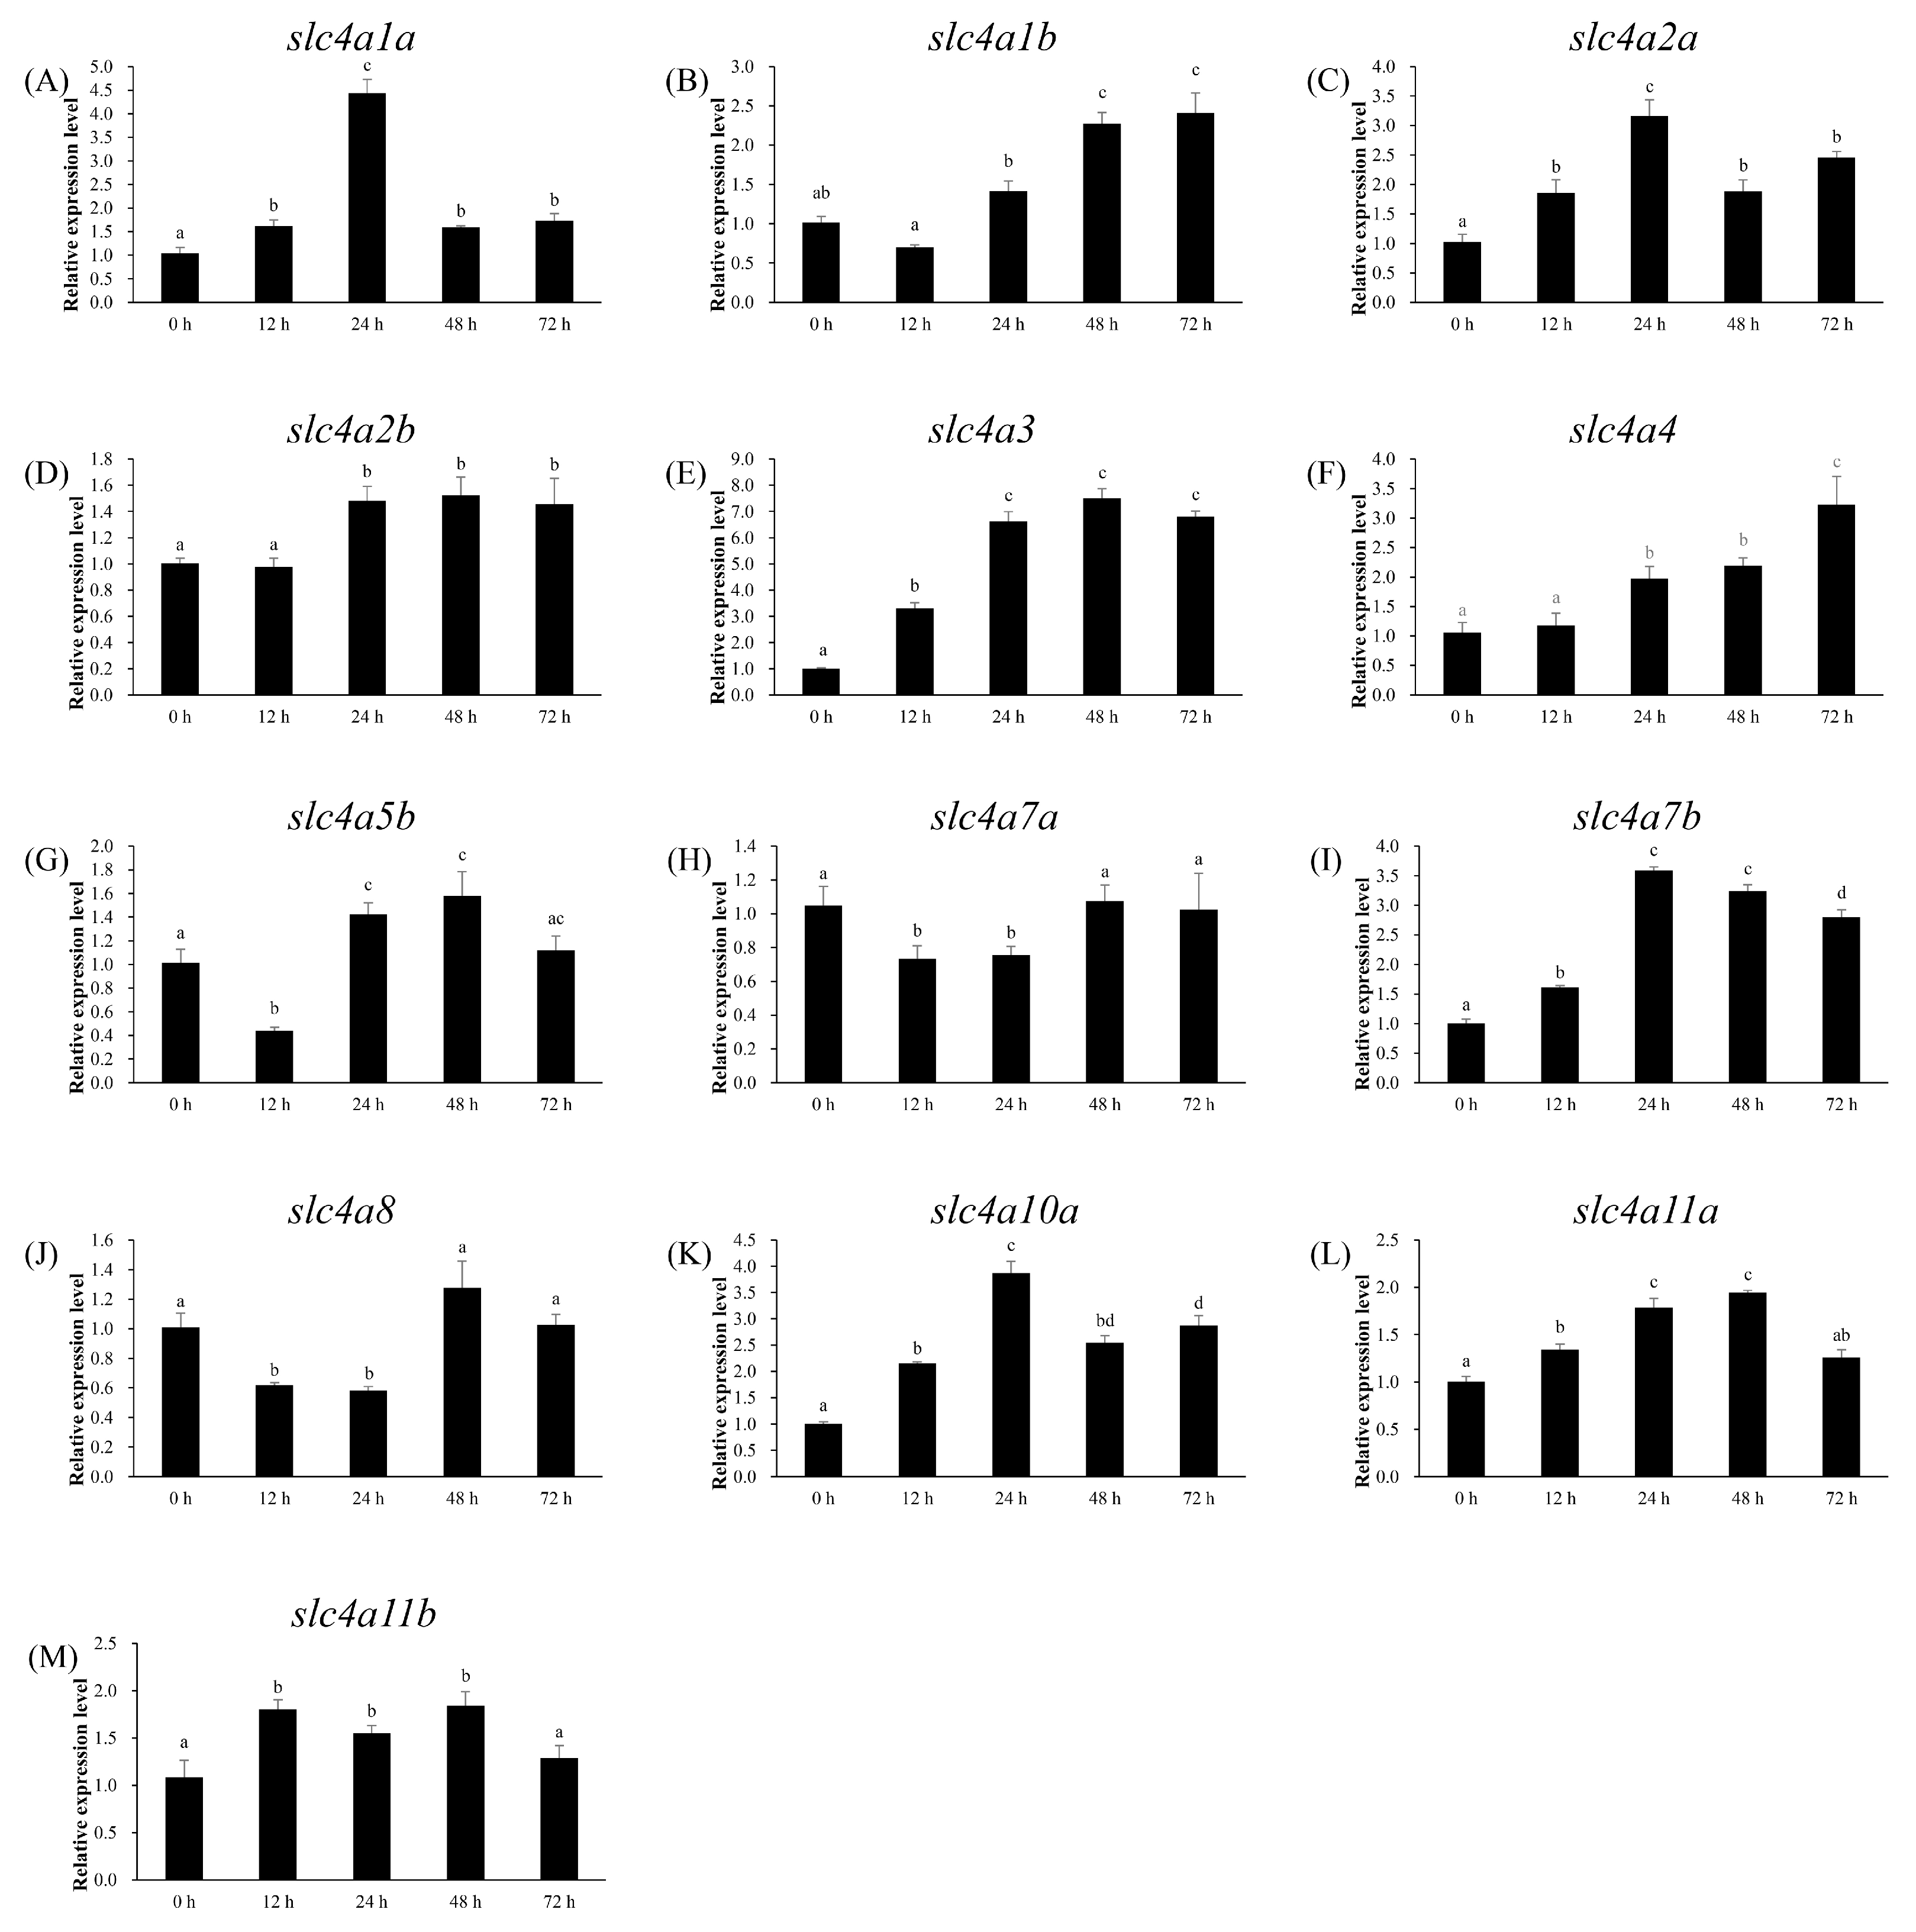
3.6. Expression Patterns of slc4 Genes in Response to Alkalinity Stress

The expression profile of slc4 genes in gill of spotted sea bass was determined by qPCR at different time points after alkalinity stress. The results showed that 13 slc4 genes (slc4a5a and slc4a10b were not detected in gill) were expressed differentially in the gill with distinct patterns (Figure 7). Among them, the expression of slc4a3 showed the strongest and most immediately up-regulated trend, with the relative mRNA levels at 12 h triple that at 0 h, and reached to a higher expression level at 24 h (Figure 7E). The highly expression was maintained at 48 h and 72 h with more than a 6-fold change compared with its expression at 0 h point (Figure 7E). The expressions of slc4a1a, slc4a2a, slc4a7b, and slc4a10a exhibited a similar pattern that their mRNA expressions were induced slightly at 12 h, and then up-regulated significantly at 24 h (> 3-fold), but decreased after 48 h (Figure 7A,C,I,K). The expression of slc4a1b and slc4a4 showed a continuous up-regulation trend after 24 h, and reached to their peak at 72 h with expression values 2.4- and 3.2-fold compared with 0 h (Figure 7B,F). The expression of slc4a5b showed a trend of decline at the 12 h (2.3-fold) and then rise slightly at the 24 h compared with its expression at 0 h (Figure 7G). The expressions of the remaining slc4 genes including slc4a2b, slc4a7a, slc4a8, slc4a11a, and slc4a11b showed slight variation (< 2-fold) during the entire experiment (Figure 7D,H,J,L,M).

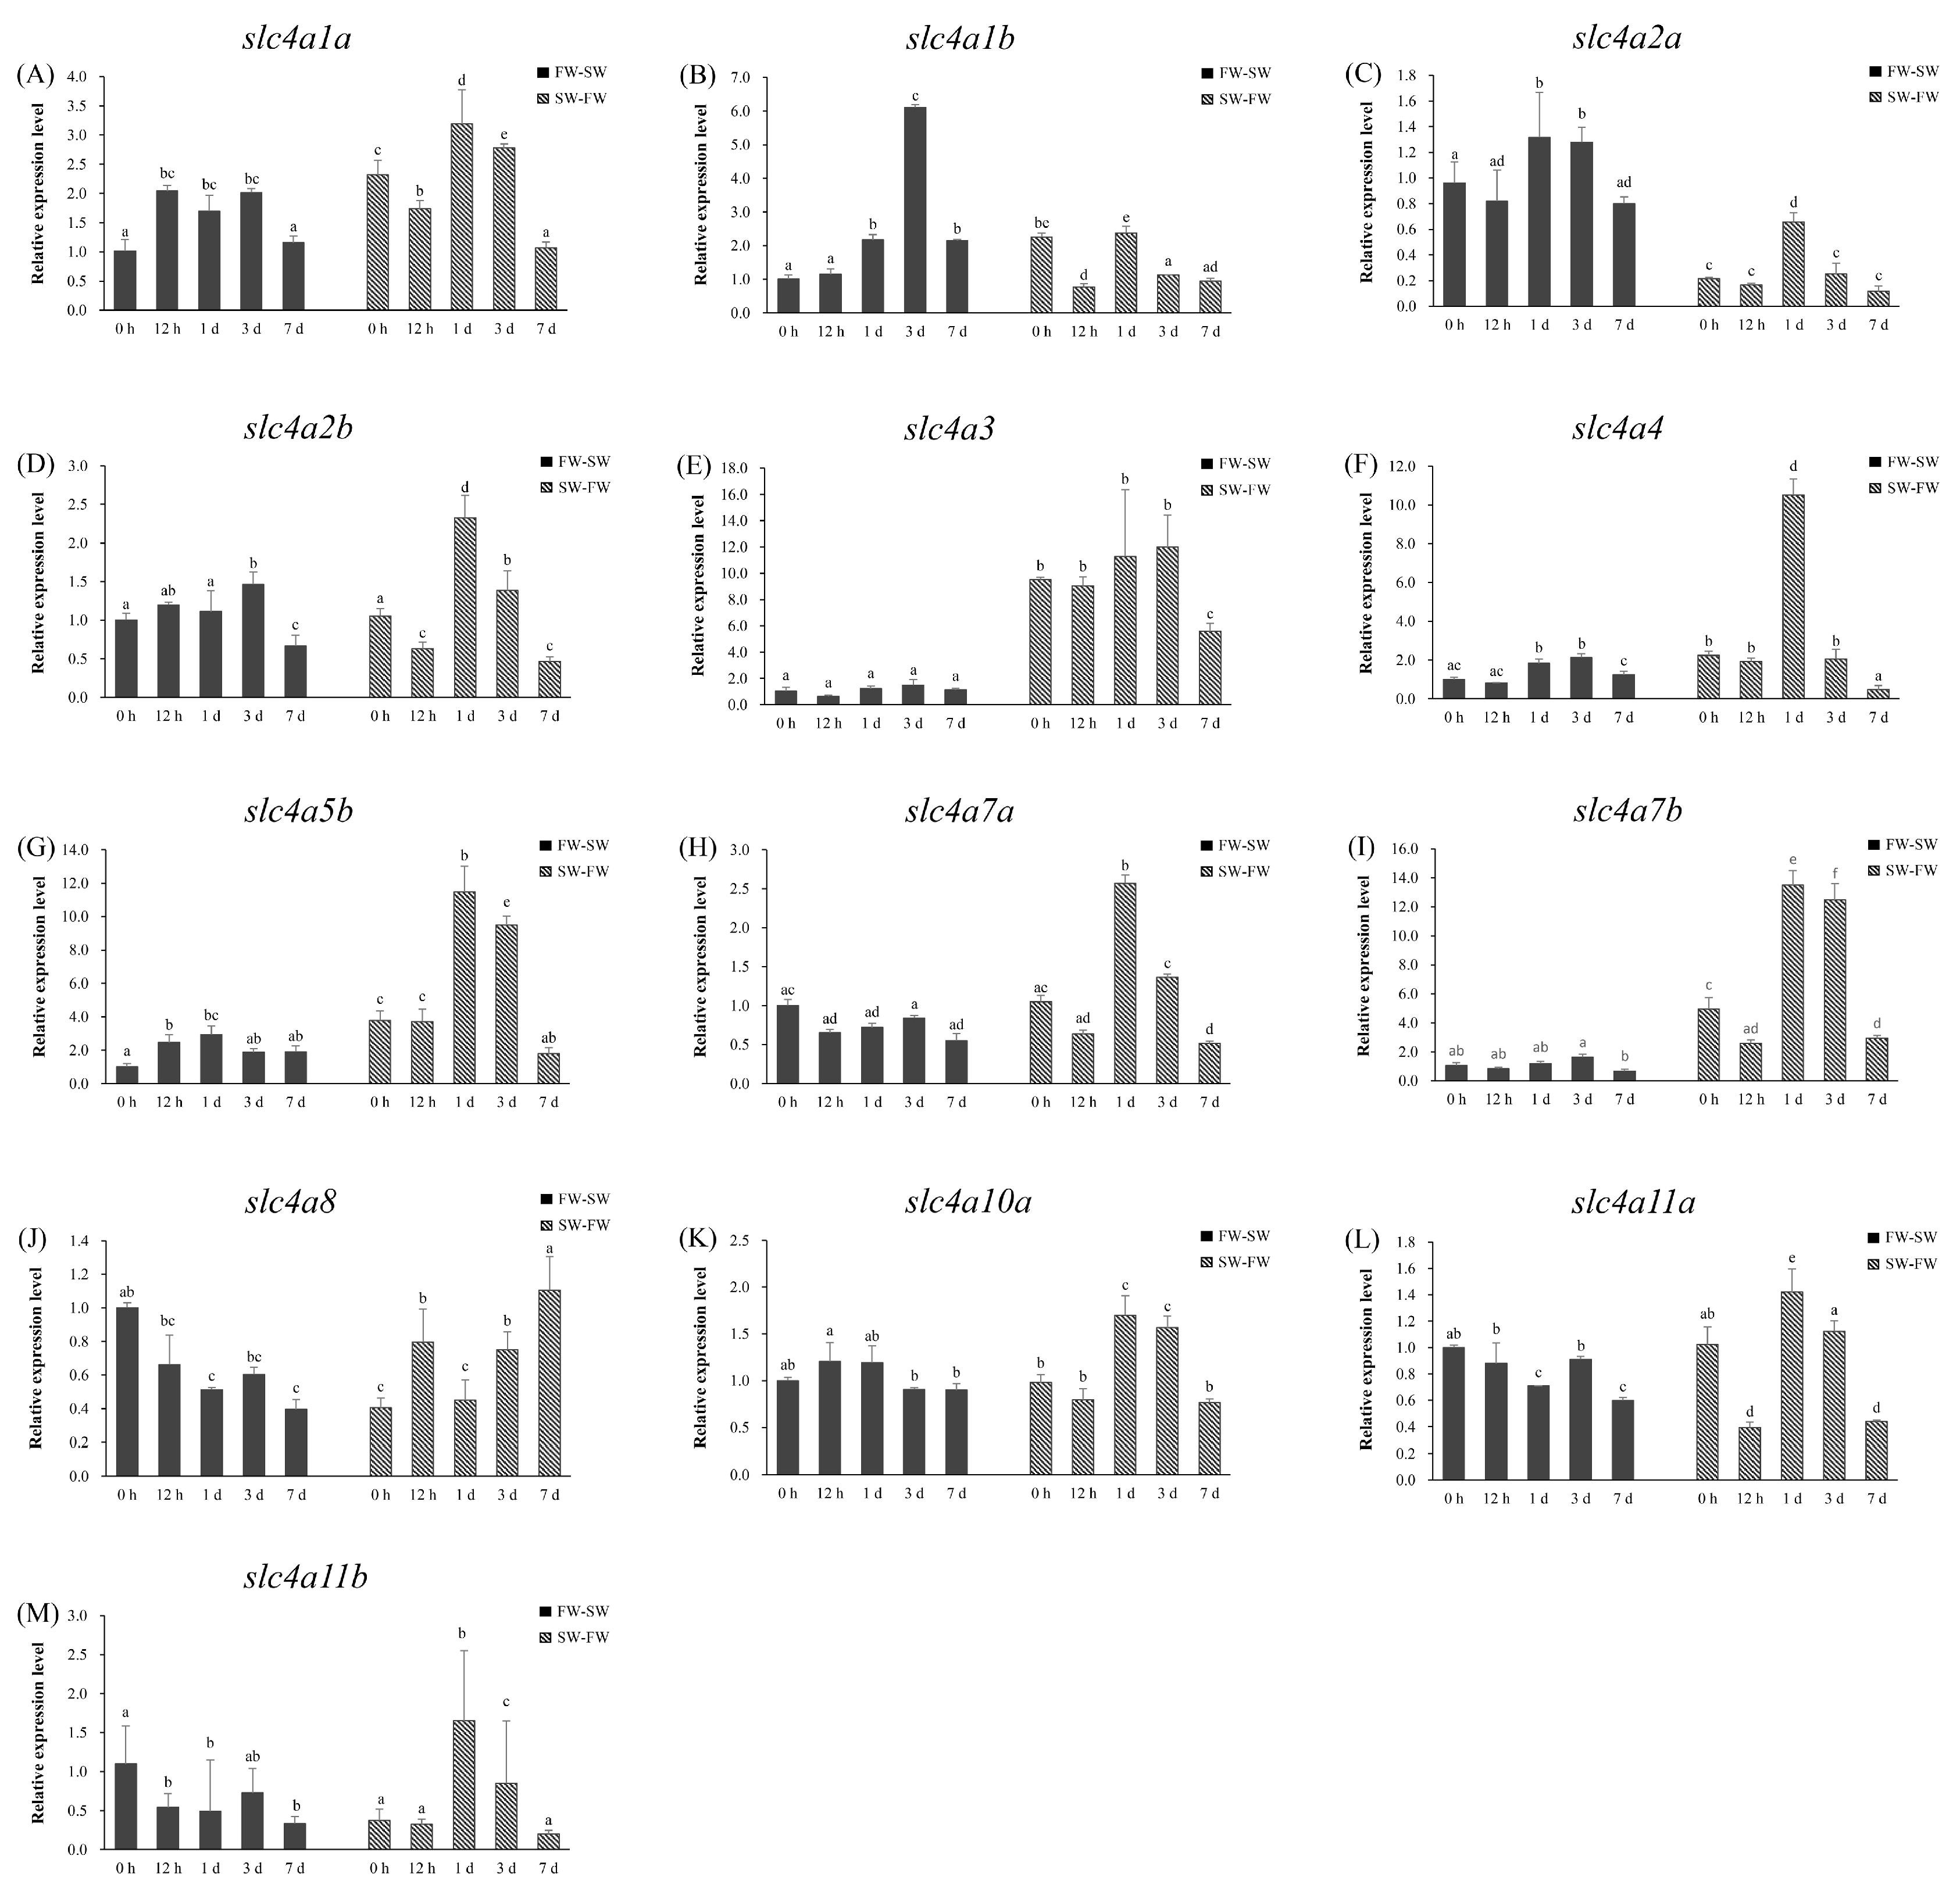
3.7. Branchial Expression Patterns of slc4 Genes During FW and SW Acclimation

In order to investigate the potential function of slc4 genes in spotted sea bass adapted to fresh water and sea water, the mRNA expression patterns of 13 slc4 genes with remarkable expression levels in the gill were determined using qPCR. As shown in Figure 8, after transferred from FW to SW (FW-SW), 12 of 13 slc4 genes (except slc4a3, Figure 8E) were found to be differentially expressed at varying degrees (p < 0.05). The expressions of 8 out of 13 slc4 genes (slc4a1a, slc4a1b, slc4a2a, slc4a2b, slc4a4, slc4a5b, slc4a7b, and slc4a10a) were elevated firstly and then decreased with the time, whereas most of them did not change much (< 2-fold) except slc4a1a, slc4a1b, and slc4a5b (Figure 8A–D,F,G,I,K). The expression levels of slc4a1b were up-regulated two-fold at 1 d, and highly increased at 3 d (> 6-fold) compared with its lowest expression level at 0 h, then decreased by 7 d (Figure 8B). Similarly, the expression of slc4a5b was induced significantly from 12 h (2.5-fold) and then declined after 3 d (Figure 8G). On the contrary, the rest slc4 genes, especially slc4a8, slc4a11a, and slc4a11b, the expressions of which were suppressed significantly compared with that at 0 h following transfer from FW to SW (Figure 8J,L,M).
As shown in Figure 8, all of 13 slc4 genes were found to be differentially expressed at varying degrees during FW acclimation processes. In fish transferred from SW-FW, the branchial mRNA expression of most slc4 genes decreased (slc4a1a, slc4a2a, slc4a2b, slc4a4, slc4a7a, slc4a7b, slc4a10a, and slc4a11a) or remained constant (slc4a3, slc4a5b, slc4a11b) at 12 h, and then significantly induced and reached the highest expression value by day 1 (Figure 8). Among these genes, the biggest up-regulation level was observed in slc4a4, slc4a5b, and slc4a7b, with the expressions 4.7-, 3.0- and 2.7-fold higher compared with its expression at 0 h (Figure 8F,G,I). The expressions of almost all slc4 genes decreased by 3 d, with only one exception that the branchial mRNA level of slc4a8 kept increasing until 7 d after transferred from SW to FW (Figure 8J). Notably, the relative expression levels of slc4a2a in the gill was significant higher (4.5-fold) in seawater- than freshwater-acclimated fish during the entire experimental process, by contrast, the slc4a3 showed the opposite pattern that the overall mRNA was more abundant (9.2-fold) in freshwater-acclimated fish (Figure 8C,E).

4. Discussion

Slc4 family proteins have been studied extensively in mammals as bicarbonate transporters, responsible for diverse physiological processes including cellular pH regulation, cell volume mediation, and NaCl absorption [4,25,26]. However, the slc4 genes and their physiological roles have not been well elucidated in teleosts. To fill the gap, in the present study, a comprehensive analysis of slc4 gene family was performed in spotted sea bass.

4.1. Features of slc4 Genes in Spotted Sea Bass

A complete set of 15 slc4 genes were identified from genomic and transcriptomic databases of spotted sea bass. It has been well documented that slc4 genes are generally classified into three clades based on their known transport function [2,4]. In the present study, 15 slc4 genes of spotted sea bass were comprised of 5 Cl/HCO3 exchangers (slc4a1a, slc4a1b, slc4a2a, slc4a2b, slc4a3), 8 Na+-dependent HCO3 transporters (slc4a4, slc4a5a, slc4a5b, slc4a7a, slc4a7b, slc4a8, slc4a10a, slc4a10b) and 2 Na+-coupled borate transporters (slc4a11a and slc4a11b). Phylogenetic and syntenic analysis provided additional evidence for the annotation of slc4 genes and gain insight into their evolutionary relationships. The phylogenetic tree was mainly divided into three major clades consistent with the function classifications of slc4 genes in human (Figure 1) [2]. The orthologous slc4 genes from tested species were clustered together as expected (Figure 1), and the similar neighboring genes of slc4 genes were comprised of zebrafish, tilapia and spotted sea bass (Figure 2), which not only confirm the gene annotation, but also demonstrate the relative conservation of slc4 genes in evolution.
Gene structure analysis of slc4 genes in spotted sea bass showed their exon–intron and functional domain patterns (Figure 4). HCO3_cotransp functional domains were located at the C terminal of all the slc4 genes in spotted sea bass, which were supposed to be responsible for their anion transport (GO:0006820). Band_3_cyto domains in both Cl/HCO3 exchangers and Na+-dependent HCO3 transporters were primarily considered as an anchoring site for other membrane-associated proteins such as ankyrin and aldolase [27]. Overall, members from the same classification with conserved exon–intron and functional domain patterns further support the functional similarities among slc4 gene members in the same evolutionary clade.
The number of slc4 genes differed between higher vertebrates and teleosts, due to the duplicated slc4 genes were common founded in teleost, such as slc4a1, slc4a2, slc4a4, slc4a5, slc4a7, slc4a10, and slc4a11. Notably, these duplicated slc4 genes were distributed on different chromosomes instead of tandem duplication arrangement (Figure 3). Therefore, it was reasonable to assume that these duplicated slc4 genes were derived from teleost-specific WGD event [28,29]. Additionally, the absence of slc4a9 in teleosts may be resulted from gene losses during evolution [30,31]. Additionally, previous studies have shown that positive selection, or adaptive sequence evolution, is considered as the hallmark of evolutionary change and molecular adaptation [22,32]. To better understand the evolutionary dynamics of slc4 genes in spotted sea bass, positive selection analysis was conducted using branch-site model. Our results showed that most sites of spotted sea bass slc4 genes were under purifying selection during evolution (Table 2), which is the expected outcome in evolutionary studies that strong purifying selection is used to keep the protein functional integrity [33]. Positive selection sites were identified in slc4a1b (6 sites), slc4a8 (2 sites), and slc4a10b (5 sites) (Table 2). Two sites of slc4a1b under selective pressures were located in the known protein functional domain—Band_3_cyto—which suggested that positive selection may have important roles in driving changes in the binding capability in spotted sea bass [27].

4.2. Function Studies of slc4 Genes of Spotted Sea Bass in Response to Salinity and Alkalinity Stresses

Compared with higher vertebrates, function study of slc4 genes in fish species lags far behind. In euryhaline teleosts, gill is the essential organ responsible for ionic regulation and acid–base regulation [34]. Hence, to investigate the potential roles of slc4 genes in adaptation to extreme salinity and high alkalinity environment, the branchial expression patterns of slc4 family genes were determined by qPCR in spotted sea bass after freshwater and seawater transfer, and alkalinity stress.

4.2.1. Anion Exchanger Proteins (AEs)

This group includes at least three anion exchanger proteins (AE1, AE2, AE3) in mammals, encoded by SLC4A1, SLC4A2, and SLC4A3, respectively. Five AEs encoding genes (slc4a1a, slc4a1b, slc4a2a, slc4a2b, slc4a3) of spotted sea bass were identified in our study (Table 1). In accordance with the gene structure of mammalian AEs, the predicted cytoplasmic N terminus of spotted sea bass slc4a2 (slc4a2a, slc4a2b) and slc4a3 are longer than that of slc4a1 (slc4a1a, slc4a1b) (Figure 4). AE anion exchangers have been widely reported for their roles in mediating the electroneutral exchange of one monovalent anion for another (Cl and HCO3 are the preferred substrates) across the plasma membrane in mammals [2], and their functions are reviewed in details by Alper [4]. By contrast, the in-depth study about the ion- and acid-base regulation function of AEs in teleosts is still lacking. In this study, the mRNA expressions of anion exchanger members in spotted sea bass were sensitive to changes in water pH and salinity (Figure 7A–E and Figure 8A–E). In teleosts, AE1 protein was found to present in gill mitochondrion-rich cells (MRCs), which is key sites responsible for both salt and acid regulation. [35,36,37]. In FW fish, AE1 at the apical side of MRCs has been speculated to absorb Cl and secrete HCO3, whereas the AE1 located to the basolateral membrane of acid-secreting MRCs was suggested to be involved in acid secretion instead of Cl uptake [25]. The branchial expression of zebrafish slc4a1b in high Na+ environment was lower than that in low Na+ environment, while the expression in acidic water was higher than that in fresh water environment [25]. In SW fish, the basolateral AE1 in MRCs showed to play a dual role in acid–base regulation and salt secretion. For example, in SW-acclimated medaka, treatment of inhibitor of AE suppressed both H+ and Cl- secretion of MRCs, and both AE1a and AE1b mRNA increased in fish acclimated to acidified SW [35]. In euryhaline spotted green pufferfish (Tetraodon nigroviridis), the protein abundance of AE1 in membrane fractions of gills was salinity dependent [37], and later proved that the branchial AE1 interacted with carbonic anhydrase II (CAII) in the membrane of gill Na+/K+-ATPase-immunoreactive cells to complete Cl/HCO3 transport. [37]. For slc4a2, the functional experiment has proved that the anion exchanger activity in zebrafish was inhibited by both intracellular and extracellular acidic pH and activated by alkaline pH [12], which corresponded to the mRNA variation pattern in our study (Figure 7C,D and Figure 8C,D). In spotted sea bass, after alkalinity challenge, the most dramatic change of branchial mRNA was observed for slc4a3 that was induced more than 6-fold compared with its expression at 0 h (Figure 7E). The study about the functions of slc4a3 in teleost was limited to zebrafish, that anion exchange activity of AE3 was suppressed at pH of 5.0, but greatly activated at pH 8.5 [38]. Although these findings provided evidences that AEs may play important roles in response to high alkalinity environment and osmoregulation in spotted sea bass and other fishes, however, the physiological roles of AEs-mediated anion exchange in teleost remain to be elucidated.

4.2.2. Na+-Coupled Bicarbonate Transporters (NCBTs)

Five mammalian NCBT proteins were identified in SLC4 family, including two electrogenic Na+, HCO3 cotransporters (NBCe2 and NBCe2), two electroneutral Na+, HCO3 cotransporters (NBCn1 and NBCn2), and one electroneutral Na+-driven Cl, HCO3 exchanger (NDCBE). NCBTs are involved in intracellular pH regulation in non-epithelial tissues, and play functions in transcellular movement of acid–base equivalents and controlling intracellular pH for epithelia tissues [39]. However, their functions in teleosts were only partially described. In this study, we identified 8 genes encoding for NCBT proteins in spotted sea bass (Table 1), and their expression levels were detected after alkalinity and salinity change.
Slc4a4 (NBCe1) and Slc4a5 (NBCe2) were electrogenic Na+-coupled HCO3 transporter and responsible for the accumulation of intracellular HCO3 by moving Na+ and HCO3 into cells [40,41]. The difference is that Slc4a5 transports Na+ and HCO3 in a ratio of 1:2, while Slc4a4 converts them in a ratio of 1:2, 1:3, or 1:4 [2,41,42]. Our results suggested that slc4a4 and slc4a5 genes in spotted sea bass might play important functions in gills for ion- and acid-regulation as their expression levels were remarkable regulated after alkalinity challenge and transferred from SW to FW (Figure 7F,G and Figure 8F,G). In agreement with our finding, the functional involvements of slc4a4 in the gills were reported in eel (Anguilla rostrata) [43]. In addition, as the intestinal HCO3 secretion is the key mechanism to enable luminal aggregate formation and water absorption, and transepithelial movement of basolateral HCO3 is mediated by slc4a4 present in the basolateral membrane, several studies have reported the essential function of Slc4a4 in the intestine of marine fishes like European sea bass (Dicentrarchus labrax), sea bream (Sparus aurata L.), Mozambique tilapia (Oreochromis mossambicus) [13,44,45], and hybrid tilapia (Oreochromis mossambicus female × O. urolepis hornorum male) [46]. In that case, the expression pattern of slc4a4 needs to be investigated in spotted sea bass in a future study. Moreover, we also detected the highly induced branchial expression of slc4a5b in spotted sea bass following transfer from SW to FW, however, the roles of NBCe2 in the regulation of sodium homeostasis and pH balance have been only reported in mammals [47].
NBCn1 encoded by SLC4A7 generally moves 1 Na+ and 1 HCO3 into the cells, and is widely distributed in both epithelial and nonepithelial tissues [39]. For Na+-coupled bicarbonate transporters, the function studies in teleosts was almost in a blank. Our results provide the evidence of the potential involvement of slc4a7 for ion- and acid–base in gills of spotted sea bass. The mRNA level of slc4a7b increased significantly after challenged by high alkalinity (Figure 7I), and the expressions of both slc4a7a and slc4a7b were induced after transferring from SW to FW, especially slc4a7b present more than a 10-fold higher expression level than its in SW environment (Figure 8H,I). In addition, the slc4a10 gene, which is a basolateral Na+ loader sharing the highest amino acid homology with slc4a7 and slc4a8 in mammals, showed significantly differentially expressed after alkalinity stress in spotted sea bass (Figure 7K).

4.2.3. Na+-Coupled Borate Transporter (NaBC)

Slc4a11 encoding the Na+-coupled borate cotransporter (NaBC1), is the only slc4 family member that does not transport HCO3. Slc4a11 was reported as an electrogenic, voltage-regulated, Na+-coupled B(OH)4 transporter in the presence of borate, while in the absence of borate, Slc4a11 was speculated to conduct Na+ and OH(H+) transportation [48]. Recently, Slc4a11 was identified as a novel NH3/H+ co-transporter with an apparent stoichiometry of 1:2 NH3/H+ [49]. Our results indicated Slc4a11 of spotted sea bass may involve in the regulation of ion- and acid–base/nitrogen homeostasis (Figure 7L,M and Figure 8L,M), although few related cases have been reported in the teleosts.
It was worth noting that whether these slc4 genes of spotted sea bass up- or down-regulated by environmental salinity, most of their expressions returned to nearing the initial level at 7 d in hyperosmotic and hypoosmotic transition experiment. It may indicate that as euryhaline species, spotted sea bass could back to homeostasis when acclimated to FW or SW within 7 days.

5. Conclusions

A genome-wide identification and comprehensive analysis of slc4 gene family in spotted sea bass was completed in this study. The 15 slc4 genes were sorted into three groups: Cl/HCO3 exchangers, Na+-dependent HCO3 transporters, and Na+-coupled borate transporter. The phylogenetic relationship, sequence structure, and syntenic arrangement supported the annotation and homology of these genes. Most gene sites were under purifying selection during evolution except a few positive selection sites detected in slc4a1b, slc4a8, and slc4a10b. In addition, the branchial gene expression patterns showed that several slc4 genes of spotted sea bass were differentially expressed at varying degrees in response to alkalinity stress and salinity changes. Among them, slc4a3 was induced most significantly after alkalinity stress. Following transfer from fresh water to sea water (FW-SW), slc4a1b and slc4a11b showed the most up-regulated and down-regulated trend, respectively, meanwhile slc4a4, slc4a5b, and slc4a7b exhibited the biggest up-regulation level after transferring from sea water to fresh water (SW-FW). In general, our study provided the fundamental information about the features of slc4 family in spotted sea bass, which help to better understanding the evolution of this family, and their biological roles in teleost species.

Supplementary Materials

Supplementary Materials can be found at https://www.mdpi.com/2073-4425/11/11/1271/s1. Table S1: List of sequences of primers for real-time PCR. Table S2: Abbreviations of gene names used in synteny analysis. Figure S1: Phylogenetic tree of teleosts slc4 genes for branch-sites model. The phylogenetic tree was constructed using MEGA 7.0 software based on the Neighbor-Joining method and Jones–Taylor–Thornton (JTT) model with 1000 replicates. The slc4 genes of spotted sea bass were marked by green color.

Author Contributions

Conceptualization, L.-Y.W., Y.T., and Y.L. (Yun Li); methodology, L.-Y.W., Y.T., P.Y., Y.L.(Yang Liu), Z.-C.G., and K.-Q.Z.; software, L.-Y.W. and Y.T.; writing—original draft, L.-Y.W. and Y.T.; writing—review and editing, Y.L. (Yun Li); resources, X.Q.; funding acquisition, Y.L. (Yun Li) and H.-S.W. All authors have read and agreed to the published version of the manuscript.

Funding

This research was funded by the National Key R&D Program of China and the China Agriculture Research System, grant number 2018YFD0900101 and CARS-47, respectively.

Conflicts of Interest

The authors declare no conflict of interest.

References

  1. Romero, M.F. Molecular pathophysiology of SLC4 bicarbonate transporters. Curr. Opin. Nephrol. Hypertens. 2005, 14, 495–501. [Google Scholar] [CrossRef] [PubMed]
  2. Romero, M.F.; Chen, A.P.; Parker, M.D.; Boron, W.F. The SLC4 family of bicarbonate (HCO3) transporters. Mol. Aspects Med. 2013, 34, 159–182. [Google Scholar] [CrossRef] [PubMed] [Green Version]
  3. Liu, Y.; Yang, J.; Chen, L.M. Structure and function of SLC4 family HCO3- transporters. Front. Physiol. 2015, 6, 355. [Google Scholar] [CrossRef] [PubMed] [Green Version]
  4. Alper, S.L. Molecular physiology and genetics of Na+-independent SLC4 anion exchangers. J. Exp. Biol. 2009, 212, 1672–1683. [Google Scholar] [CrossRef] [PubMed] [Green Version]
  5. Liu, Y.; Xu, J.Y.; Wang, D.K.; Wang, L.; Chen, L.M. Cloning and identification of two novel NBCe1 splice variants from mouse reproductive tract tissues: A comparative study of NCBT genes. Genomics 2011, 98, 112–119. [Google Scholar] [CrossRef] [PubMed] [Green Version]
  6. Tsuganezawa, H.; Kobayashi, K.; Iyori, M.; Araki, T.; Koizumi, A.; Watanabe, S.; Kaneko, A.; Fukao, T.; Monkawa, T.; Yoshida, T.; et al. A new member of the HCO3- transporter superfamily is an apical anion exchanger of β-intercalated cells in the kidney. J. Biol. Chem. 2001, 276, 8180–8189. [Google Scholar] [CrossRef] [Green Version]
  7. Pena-Munzenmayer, G.; George, A.T.; Shull, G.E.; Melvin, J.E.; Catalan, M.A. Catalan, Ae4 (Slc4a9) is an electroneutral monovalent cation-dependent Cl-/HCO3 exchanger. J. Gen. Physiol. 2016, 147, 423–436. [Google Scholar] [CrossRef] [Green Version]
  8. Catalán, M.A.; José Viveros, J.; Fernandez, F.; Flores, L.; Brauchi, S.; Peña-Münzenmayer, G. Exploring the transport mechanism of the human AE4 (SLC4A9) Cl-/HCO3 exchanger. Biophys. J. 2018, 114, 330a. [Google Scholar] [CrossRef]
  9. Pushkin, A.; Kurtz, I. SLC4 base (HCO3, CO32−) transporters: Classification, function, structure, genetic diseases, and knockout models. Am. J. Physiol. Renal Physiol. 2006, 290, 580–599. [Google Scholar] [CrossRef] [Green Version]
  10. Damkier, H.H.; Nielsen, S.; Praetorius, J. Molecular expression of SLC4-derived Na+-dependent anion transporters in selected human tissues. Am. J. Physiol. Regul. Integr. Comp. Physiol. 2007, 293, 2136–2146. [Google Scholar] [CrossRef] [Green Version]
  11. Parker, M.D. Mouse models of SLC4-linked disorders of HCO3-transporter dysfunction. Am. J. Physiol. Cell Physiol. 2018, 314, 569–588. [Google Scholar] [CrossRef] [PubMed] [Green Version]
  12. Shmukler, B.E.; Kurschat, C.E.; Ackermann, G.E.; Jiang, L.; Zhou, Y.; Barut, B.; Stuart-Tilley, A.K.; Zhao, J.; Zon, L.I.; Drummond, I.A.; et al. Zebrafish slc4a2/ae2 anion exchanger: cDNA cloning, mapping, functional characterization, and localization. Am. J. Physiol. Renal Physiol. 2005, 289, 835–849. [Google Scholar] [CrossRef] [PubMed] [Green Version]
  13. Ruiz-Jarabo, I.; Gregorio, S.F.; Gaetano, P.; Trischitta, F.; Fuentes, J. High rates of intestinal bicarbonate secretion in seawater tilapia (Oreochromis mossambicus). Comp. Biochem. Physiol. A Mol. Integr. Physiol. 2017, 207, 57–64. [Google Scholar] [CrossRef] [PubMed]
  14. Hwang, P.P. Ion uptake and acid secretion in zebrafish (Danio rerio). J. Exp. Biol. 2009, 212, 1745–1752. [Google Scholar] [CrossRef] [PubMed] [Green Version]
  15. Chang, Y.M.; Tang, R.; Dou, X.J.; Tao, R.; Sun, X.W.; Liang, L.Q. Transcriptome and expression profiling analysis of Leuciscus waleckii: An exploration of the alkali-adapted mechanisms of a freshwater teleost. Mol. Biosyst. 2014, 10, 491–504. [Google Scholar] [CrossRef] [PubMed]
  16. Gregorio, S.F.; Carvalho, E.S.; Encarnacao, S.; Wilson, J.M.; Power, D.M.; Canario, A.V.; Fuentes, J. Adaptation to different salinities exposes functional specialization in the intestine of the sea bream (Sparus aurata L.). J. Exp. Biol. 2013, 216, 470–479. [Google Scholar] [CrossRef] [PubMed] [Green Version]
  17. Kurita, Y.; Nakada, T.; Kato, A.; Doi, H.; Mistry, A.C.; Chang, M.H.; Romero, M.F.; Hirose, S. Identification of intestinal bicarbonate transporters involved in formation of carbonate precipitates to stimulate water absorption in marine teleost fish. Am. J. Physiol. Regul. Integr. Comp. Physiol. 2008, 294, 1402–1412. [Google Scholar] [CrossRef] [Green Version]
  18. An, H.S.; Kim, H.Y.; Kim, J.B.; Chang, D.S.; Park, K.D.; Lee, J.W.; Myeong, J.I.; An, C.M. Genetic characterization of hatchery populations of Korean spotted sea bass (Lateolabrax maculatus) using multiplex polymerase chain reaction assays. Genet. Mol. Res. 2014, 13, 6701–6715. [Google Scholar] [CrossRef]
  19. Tian, Y.; Wen, H.; Qi, X.; Mao, X.; Shi, Z.; Li, J.; He, F.; Yang, W.; Zhang, X.; Li, Y. Analysis of apolipoprotein multigene family in spotted sea bass (Lateolabrax maculatus) and their expression profiles in response to Vibrio harveyi infection. Fish Shellfish Immunol. 2019, 92, 111–118. [Google Scholar] [CrossRef]
  20. Tian, Y.; Wen, H.; Qi, X.; Zhang, X.; Li, Y. Identification of mapk gene family in Lateolabrax maculatus and their expression profiles in response to hypoxia and salinity challenges. Gene 2019, 684, 20–29. [Google Scholar] [CrossRef]
  21. Edgar, R.C. MUSCLE: Multiple sequence alignment with high accuracy and high throughput. Nucleic Acids Res. 2004, 32, 1792–1797. [Google Scholar] [CrossRef] [Green Version]
  22. Yang, L.; Jiang, H.; Wang, Y.; Lei, Y.; Chen, J.; Sun, N.; Lv, W.; Wang, C.; Near, T.J.; He, S. Expansion of vomeronasal receptor genes (OlfC) in the evolution of fright reaction in Ostariophysan fishes. Commun. Biol. 2019, 2, 235. [Google Scholar] [CrossRef] [PubMed]
  23. Anisimova, M.; Kosiol, C. Investigating protein-coding sequence evolution with probabilistic codon substitution models. Mol. Biol. Evol. 2009, 26, 255–271. [Google Scholar] [CrossRef] [Green Version]
  24. Wang, H.; Wen, H.; Li, Y.; Zhang, K.; Liu, Y. Evaluation of potential reference genes for quantitative RT-PCR analysis in spotted sea bass (Lateolabrax maculatus) under normal and salinity stress conditions. PeerJ 2018, 6, e5631. [Google Scholar] [CrossRef] [PubMed] [Green Version]
  25. Lee, Y.C.; Yan, J.J.; Cruz, S.A.; Horng, J.L.; Hwang, P.P. Anion exchanger 1b, but not sodium-bicarbonate cotransporter 1b, plays a role in transport functions of zebrafish H+-ATPase-rich cells. Am. J. Physiol. Cell Physiol. 2011, 300, 295–307. [Google Scholar] [CrossRef] [PubMed] [Green Version]
  26. Boron, W.F.; Chen, L.; Parker, M.D. Modular structure of sodium-coupled bicarbonate transporters. J. Exp. Biol. 2009, 212, 1697–1706. [Google Scholar] [CrossRef] [Green Version]
  27. Zhang, D.; Kiyatkin, A.; Bolin, J.T.; Low, P.S. Crystallographic structure and functional interpretation of the cytoplasmic domain of erythrocyte membrane band 3. Blood 2000, 96, 2925–2933. [Google Scholar] [CrossRef] [PubMed]
  28. Meyer, A.; Van de Peer, Y. From 2R to 3R: Evidence for a fish-specific genome duplication (FSGD). Bioessays 2005, 27, 937–945. [Google Scholar] [CrossRef] [PubMed] [Green Version]
  29. Glasauer, S.M.; Neuhauss, S.C. Whole-genome duplication in teleost fishes and its evolutionary consequences. Mol. Genet. Genom. 2014, 289, 1045–1060. [Google Scholar] [CrossRef] [Green Version]
  30. Li, Y.; Liu, S.; Qin, Z.; Yao, J.; Jiang, C.; Song, L.; Dunham, R.; Liu, Z. The serpin superfamily in channel catfish: Identification, phylogenetic analysis and expression profiling in mucosal tissues after bacterial infections. Dev. Comp. Immunol. 2015, 49, 267–277. [Google Scholar] [CrossRef]
  31. Fan, H.; Zhou, Y.; Wen, H.; Zhang, X.; Zhang, K.; Qi, X.; Xu, P.; Li, Y. Genome-wide identification and characterization of glucose transporter (glut) genes in spotted sea bass (Lateolabrax maculatus) and their regulated hepatic expression during short-term starvation. Comp. Biochem. Physiol. Part D Genom. Proteom. 2019, 30, 217–229. [Google Scholar] [CrossRef] [PubMed]
  32. Wu, D.D.; Wang, G.D.; Irwin, D.M.; Zhang, Y.P. A profound role for the expansion of trypsin-like serine protease family in the evolution of hematophagy in mosquito. Mol. Biol. Evol. 2009, 26, 2333–2341. [Google Scholar] [CrossRef] [PubMed] [Green Version]
  33. Sironi, M.; Cagliani, R.; Forni, D.; Clerici, M. Evolutionary insights into host-pathogen interactions from mammalian sequence data. Nat. Rev. Genet. 2015, 16, 224–236. [Google Scholar] [CrossRef] [PubMed]
  34. Evans, D.H.; Piermarini, P.M.; Choe, K.P. The multifunctional fish gill: Dominant site of gas exchange, osmoregulation, acid-base regulation, and excretion of nitrogenous waste. Physiol. Rev. 2005, 85, 97–177. [Google Scholar] [CrossRef]
  35. Liu, S.T.; Horng, J.L.; Chen, P.Y.; Hwang, P.P.; Lin, L.Y. Salt secretion is linked to acid-base regulation of ionocytes in seawater-acclimated medaka: New insights into the salt-secreting mechanism. Sci. Rep. 2016, 6, 31433. [Google Scholar] [CrossRef]
  36. Wilson, J.M.; Whiteley, N.M.; Randall, D.J. Ionoregulatory changes in the gill epithelia of coho salmon during seawater acclimation. Physiol. Biochem. Zool. 2002, 75, 237–249. [Google Scholar] [CrossRef]
  37. Tang, C.H.; Lee, T.H. The novel correlation of carbonic anhydrase II and anion exchanger 1 in gills of the spotted green pufferfish, Tetraodon nigrovirids. J. Exp. Zool. A Ecol. Genet. Physiol. 2007, 307, 411–418. [Google Scholar] [CrossRef]
  38. Shmukler, B.E.; Reimold, F.R.; Heneghan, J.F.; Chen, C.; Zhao, T.; Paw, B.H.; Alper, S.L. Molecular cloning and functional characterization of zebrafish Slc4a3/Ae3 anion exchanger. Pflugers Arch. 2014, 466, 1605–1618. [Google Scholar] [CrossRef]
  39. Aalkjaer, C.; Boedtkjer, E.; Choi, I.; Lee, S. Cation-coupled bicarbonate transporters. Compr. Physiol. 2014, 4, 1605–1637. [Google Scholar] [CrossRef] [Green Version]
  40. Ishiguro, H.; Steward, M.C.; Lindsay, A.R.; Case, R.M. Accumulation of intracellular HCO3 by Na+-HCO3 cotransport in interlobular ducts from guinea-pig pancreas. J. Physiol. 1996, 495, 169–178. [Google Scholar] [CrossRef]
  41. Romero, M.F.; Fulton, C.M.; Boron, W.F. The SLC4 family of HCO3- transporters. Pflugers Arch. 2004, 447, 495–509. [Google Scholar] [CrossRef] [PubMed]
  42. Chang, M.H.; Plata, C.; Kurita, Y.; Kato, A.; Hirose, S.; Romero, M.F. Euryhaline pufferfish NBCe1 differs from nonmarine species NBCe1 physiology. Am. J. Physiol. Cell Physiol. 2012, 302, 1083–1095. [Google Scholar] [CrossRef] [Green Version]
  43. Perry, S.F.; Furimsky, M.; Bayaa, M.; Georgalis, T.; Shahsavarani, A.; Nickerson, J.G.; Moon, T.W. Integrated responses of Na+/HCO3- cotransporters and V-type H+-ATPases in the fish gill and kidney during respiratory acidosis. Biochim. Biophys. Acta 2003, 1618, 175–184. [Google Scholar] [CrossRef] [PubMed] [Green Version]
  44. Alves, A.; Gregorio, S.F.; Egger, R.C.; Fuentes, J. Molecular and functional regionalization of bicarbonate secretion cascade in the intestine of the European sea bass (Dicentrarchus labrax). Comp. Biochem. Physiol. A Mol. Integr. Physiol. 2019, 233, 53–64. [Google Scholar] [CrossRef]
  45. Gregorio, S.F.; Ruiz-Jarabo, I.; Carvalho, E.M.; Fuentes, J. Increased intestinal carbonate precipitate abundance in the sea bream (Sparus aurata L.) in response to ocean acidification. PLoS ONE 2019, 14, e0218473. [Google Scholar] [CrossRef] [PubMed]
  46. Su, H.; Ma, D.; Zhu, H.; Liu, Z.; Gao, F. Transcriptomic response to three osmotic stresses in gills of hybrid tilapia (Oreochromis mossambicus female x O. urolepis hornorum male). BMC Genom. 2020, 21, 110. [Google Scholar] [CrossRef] [Green Version]
  47. Felder, R.A.; Jose, P.A.; Xu, P.; Gildea, J.J. The renal sodium bicarbonate cotransporter NBCe2: Is it a major contributor to sodium and pH homeostasis? Curr. Hypertens. Rep. 2016, 18, 71. [Google Scholar] [CrossRef]
  48. Park, M.; Li, Q.; Shcheynikov, N.; Zeng, W.; Muallem, S. NaBC1 is a ubiquitous electrogenic Na+ -coupled borate transporter essential for cellular boron homeostasis and cell growth and proliferation. Mol. Cell 2004, 16, 331–341. [Google Scholar] [CrossRef] [PubMed]
  49. Zhang, W.; Ogando, D.G.; Bonanno, J.A.; Obukhov, A.G. Human SLC4A11 is a novel NH3/H+ co-transporter. J. Biol. Chem. 2015, 290, 16894–16905. [Google Scholar] [CrossRef] [PubMed] [Green Version]
Figure 1. Phylogenetic relationships of slc4 genes in spotted sea bass and selected vertebrate species. The phylogenetic tree was constructed using MEGA 7.0 software based on the Neighbor-Joining method and Jones-Taylor-Thornton (JTT) model with 1000 replicates. This tree was mainly classified into three classes, including Cl/HCO3 exchangers, Na+/HCO3 cotransporter, and Na+/Borate cotransporter.
Genes 11 01271 g001
Figure 2. Syntenic analysis of slc4 genes in zebrafish, Nile tilapia, and spotted sea bass. (AI): slc4a1slc4a11. Full gene names are provided in Table S2.
Genes 11 01271 g002
Figure 3. Chromosomal locations and duplication modes among the slc4 genes of spotted sea bass. Genomic synteny is displayed in gray lines.
Genes 11 01271 g003
Figure 4. Schematic representation of gene structures of slc4 genes in spotted sea bass. The phylogenetic relationship was shown on the left. The boxes represented exons and lines were intron. The functional domains were marked with different colors.
Genes 11 01271 g004
Figure 5. Copy numbers of slc4 genes in 13 representative vertebrates. Branch shades represent the different groups: higher vertebrates were marked by orange shade and teleosts were shown in green. The copy number of three slc4 classes were represented by colored rectangle: Cl/HCO3 exchangers in red, Na+/HCO3 transporters in yellow and Na+/Borate transporters in blue.
Genes 11 01271 g005
Figure 6. Distribution of positive selection sites of the slc4 genes of spotted sea bass predicted by the branch-site models. Positively selected sites (p > 95%) in the predicted secondary structures of slc4a1b (A), slc4a8 (B), and slc4a10b (C) were labeled in red. The functional domains were marked with different colors.
Genes 11 01271 g006
Figure 7. Expression of slc4 genes in gill of spotted sea bass after alkalinity stress. (AM): slc4a1aslc4a11b. Significant differences (p < 0.05) were indicated with different letters.
Genes 11 01271 g007
Figure 8. Expression of slc4 genes in gill of spotted sea bass after freshwater-saltwater (FW-SW) and SW-FW transfer. (AM): slc4a1aslc4a11b. Fish were transferred from FW to SW or SW to FW as control at 0 h. Significant differences (p < 0.05) were indicated with different letters.
Genes 11 01271 g008
Table 1. Summary of characteristics of slc4 genes in spotted sea bass.
ClassificationGene NameCDS Length (bp)Predicted Protein Length (Amino Acid)Molecular Weight (kDa)Isoelectric Point (pI)Accession Number of NCBI
Cl/HCO3 exchangerslc4a1a2766921103.295.31MN909728
slc4a1b252384094.058.68MN909729
slc4a2a34171138126.825.99MN909730
slc4a2b36781225137.116.09MN909731
slc4a337021234139.715.85MN909732
Na+/HCO3 cotransporterslc4a432131070120.516.23MN909733
slc4a5a258686196.925.80MN909734
slc4a5b34231140129.036.63MN909735
slc4a7a2799932103.906.82MN909736
slc4a7b30151004111.266.66MN909737
slc4a833631120125.376.03MN909738
slc4a10a32611086122.586.18MN909739
slc4a10b40231340149.045.83MN909740
Na+/Borate cotransporterslc4a11a252984294.916.11MN909741
slc4a11b231677186.846.73MN909742
Table 2. The parameters and statistical significances of likelihood ratio tests for the branch-site models.
ModelnpLnLModels Compared2△LnLdfpPositively Selected Sites
Null model A—slc4a1a43−27215.89837MA vs. NMA0.0000011.00000
Model A—slc4a1a44−27215.89837
Null model A—slc4a1b43−27204.09798MA vs. NMA42.5251610.00000 138S * 141T ** 148N ** 152T ** 470V ** 471N **
Model A—slc4a1b44−27182.83540
Null model A—slc4a2a43−16901.01428MA vs. NMA2.0 × 10−510.99643
Model A—slc4a2a44−16901.01429
Null model A—slc4a2b43−16900.85034MA vs. NMA0.0000011.00000
Model A—slc4a2b44−16900.85034
Null model A—slc4a327−22702.55961MA vs. NMA2.6 × 10−410.4791
Model A—slc4a328−22702.55948
Null model A—slc4a443−27709.75538MA vs. NMA0.0000011.00000
Model A—slc4a444−27709.75538
Null model A—slc4a5a45−22011.18613MA vs. NMA0.0843210.77153
Model A—slc4a5a46−22011.14397
Null model A—slc4a5b45−22013.51479MA vs. NMA0.0000011.00000
Model A—slc4a5b46−22013.51479
Null model A—slc4a7a39−3957.77188MA vs. NMA0.0000011.00000
Model A—slc4a7a40−3957.77188
Null model A—slc4a7b39−3957.65280MA vs. NMA0.2381610.62554
Model A—slc4a7b40−3957.77188
Null model A—slc4a827−7554.82350MA vs. NMA7.7054410.00551 33L * 34S **
Model A—slc4a828−7550.97078
Null model A—slc4a10a43−27358.78420MA vs. NMA0.2810010.59605
Model A—slc4a10a44−27358.64370
Null model A—slc4a10b43−27346.85330MA vs. NMA31.1046610.00000 200S * 214S ** 215A ** 216T ** 349R *
Model A—slc4a10b44−27331.30097
Null model A—slc4a11a35−6835.90728MA vs. NMA0.0000011.00000
Model A—slc4a11a36−6835.90728
Null model A—slc4a11b35−6835.90728MA vs. NMA0.0000011.00000
Model A—slc4a11b36−6835.90728
LnL: The natural logarithm of the likelihood value; np: number of parameters; 2△LnL: twice the difference in LnL between the two models compared; sites inferred to be under positive selection at the 95% level are labeled with single asterisk (*) and those at the 99% level are labeled with two asterisks (**).
Publisher’s Note: MDPI stays neutral with regard to jurisdictional claims in published maps and institutional affiliations.

