Multigene Expression Assay for Assessment of the Immune Status of Atlantic Salmon


Abstract
:1. Introduction
2. Materials and Methods
2.1. Design of Multigene Expression Assay
2.2. Fish Material
2.3. Analyses
2.4. Statistics
3. Results
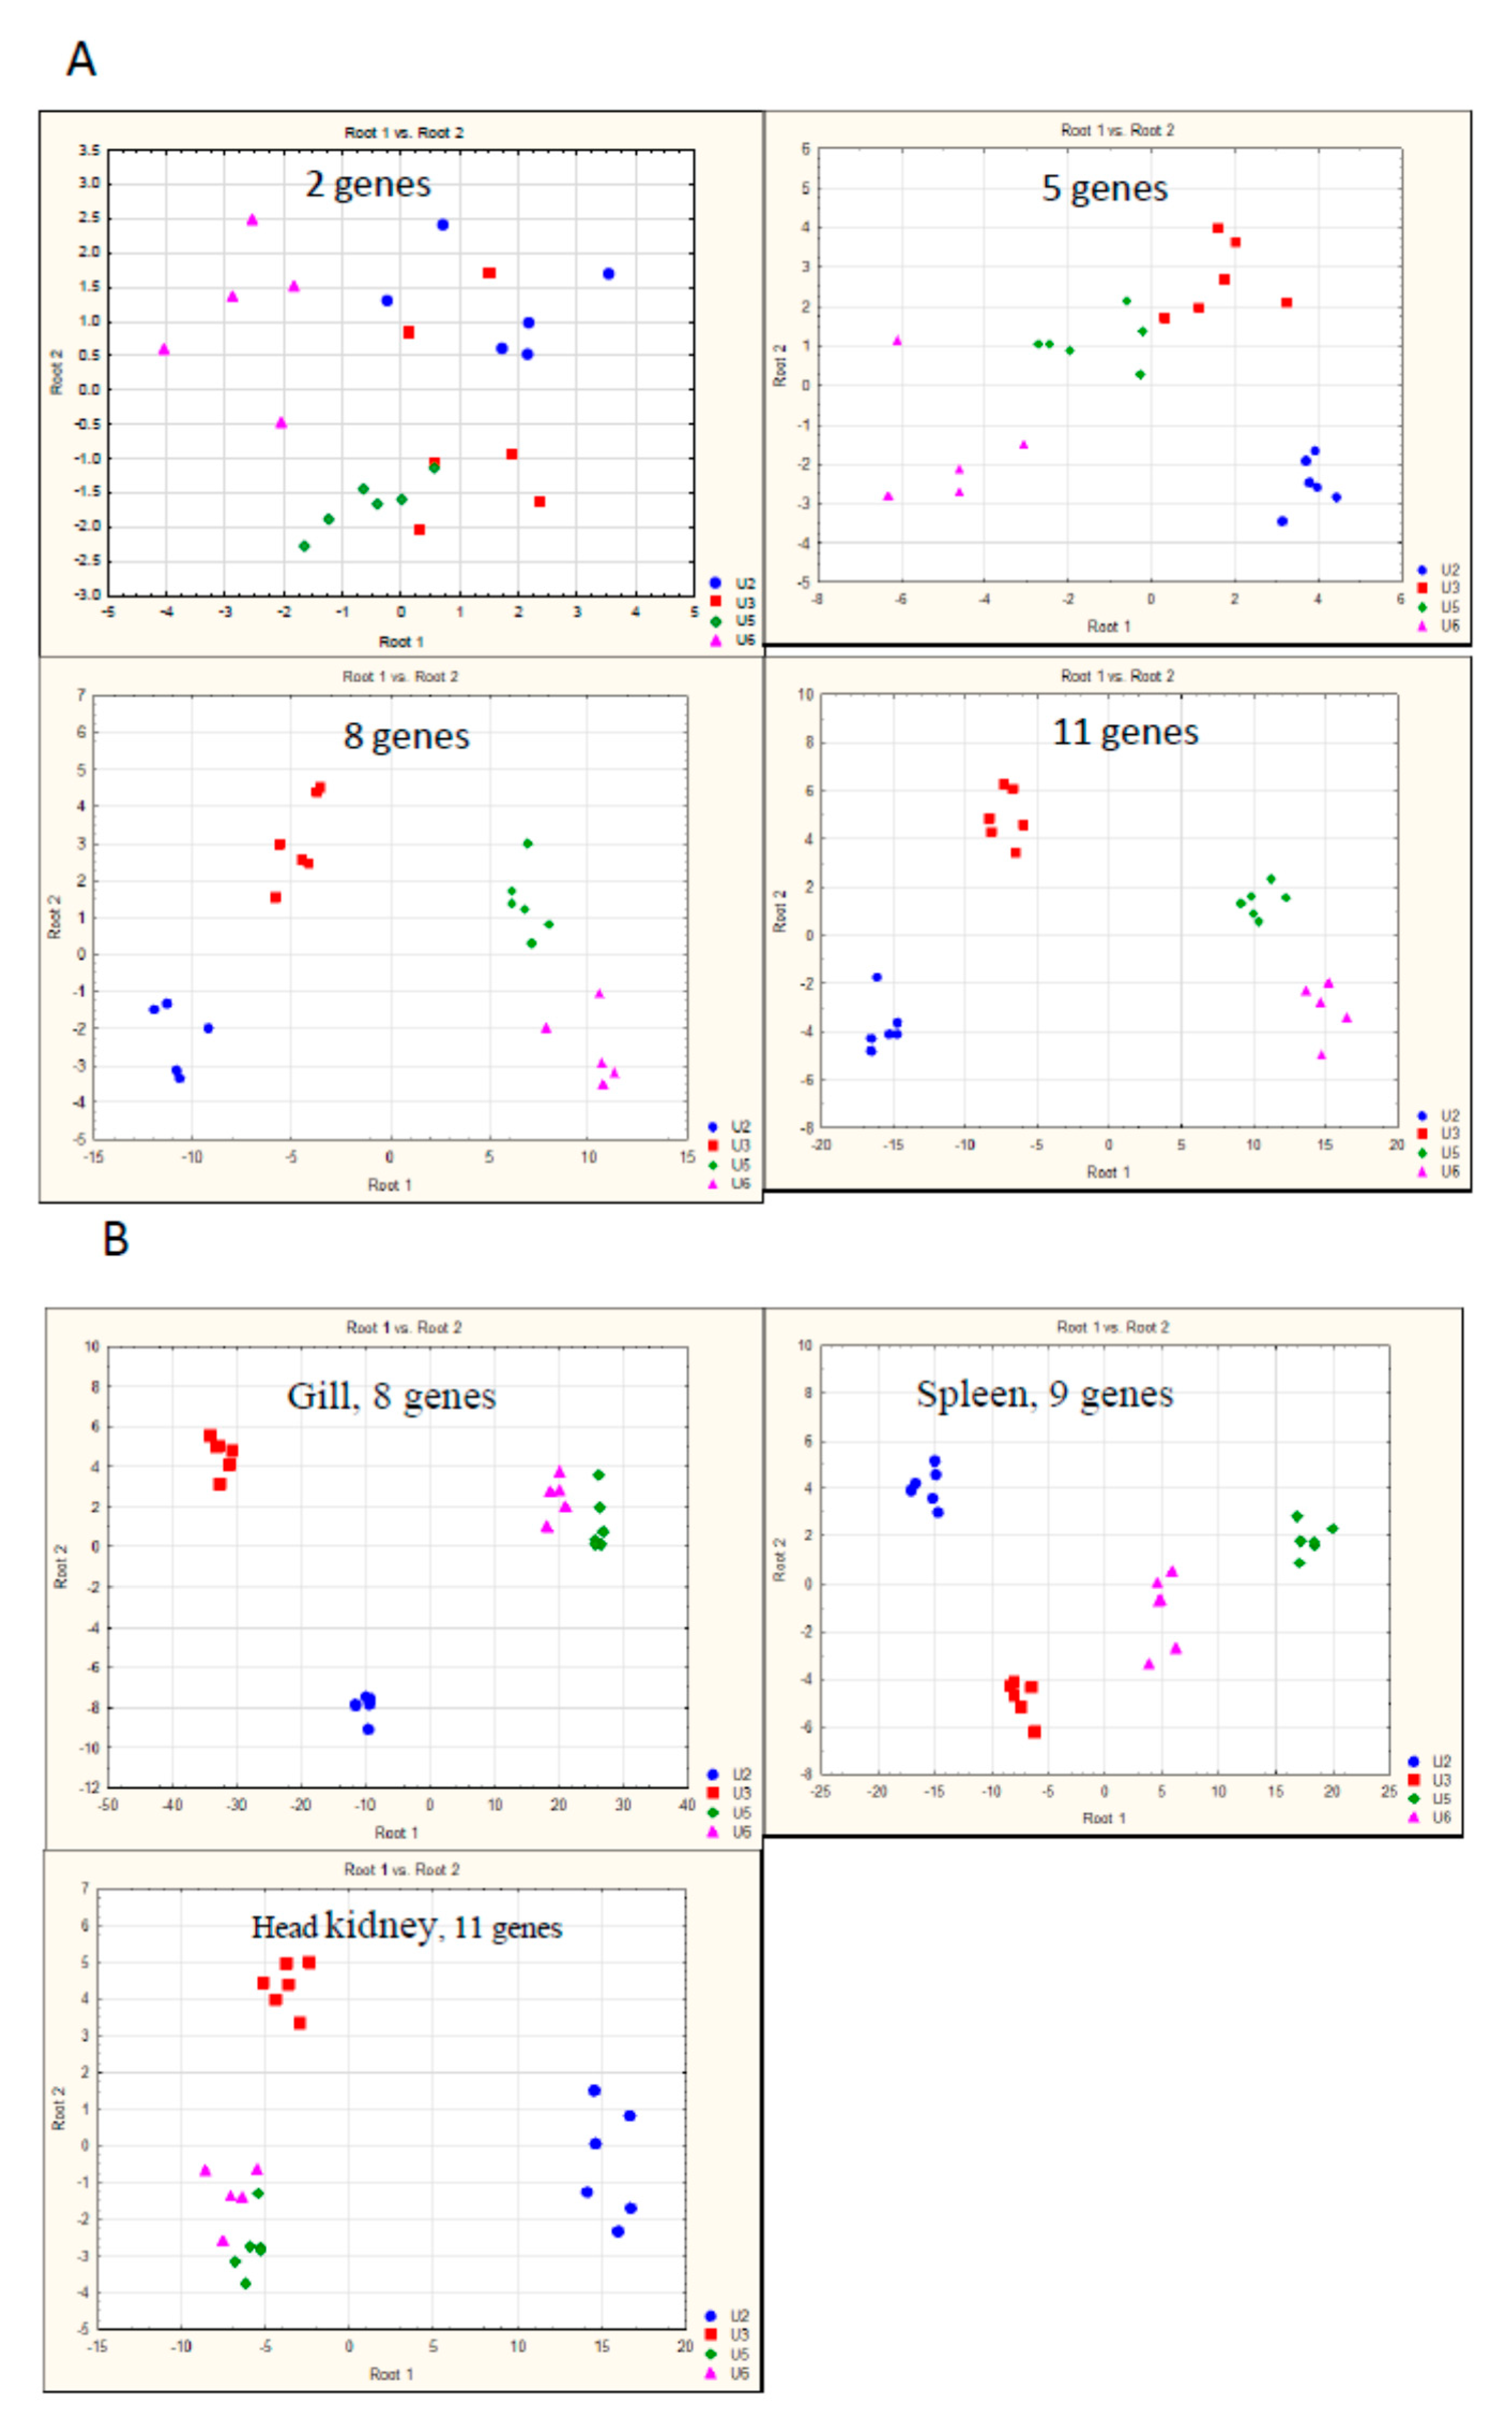
3.1. Gene Expression—Calibration
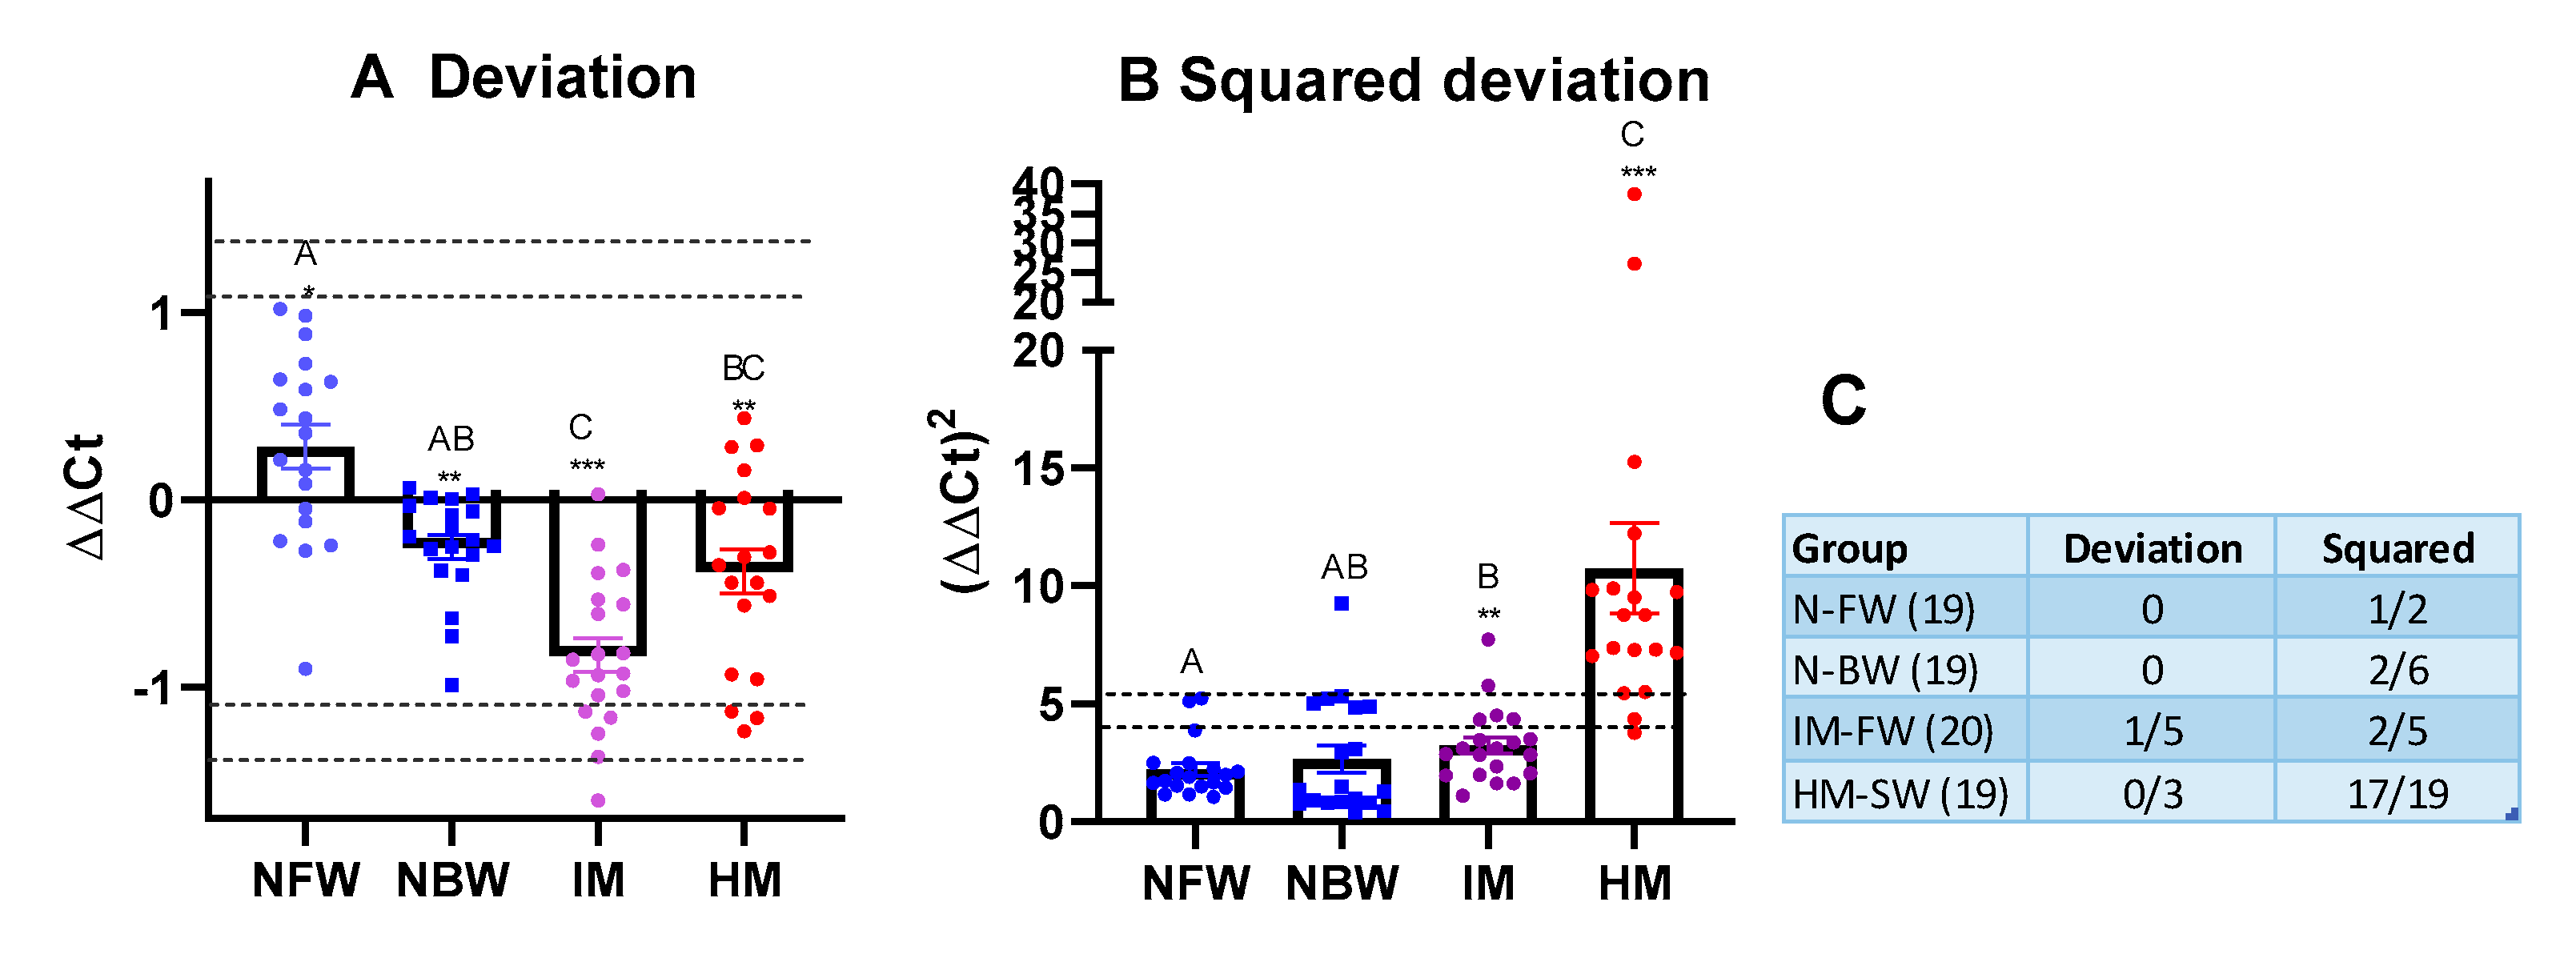
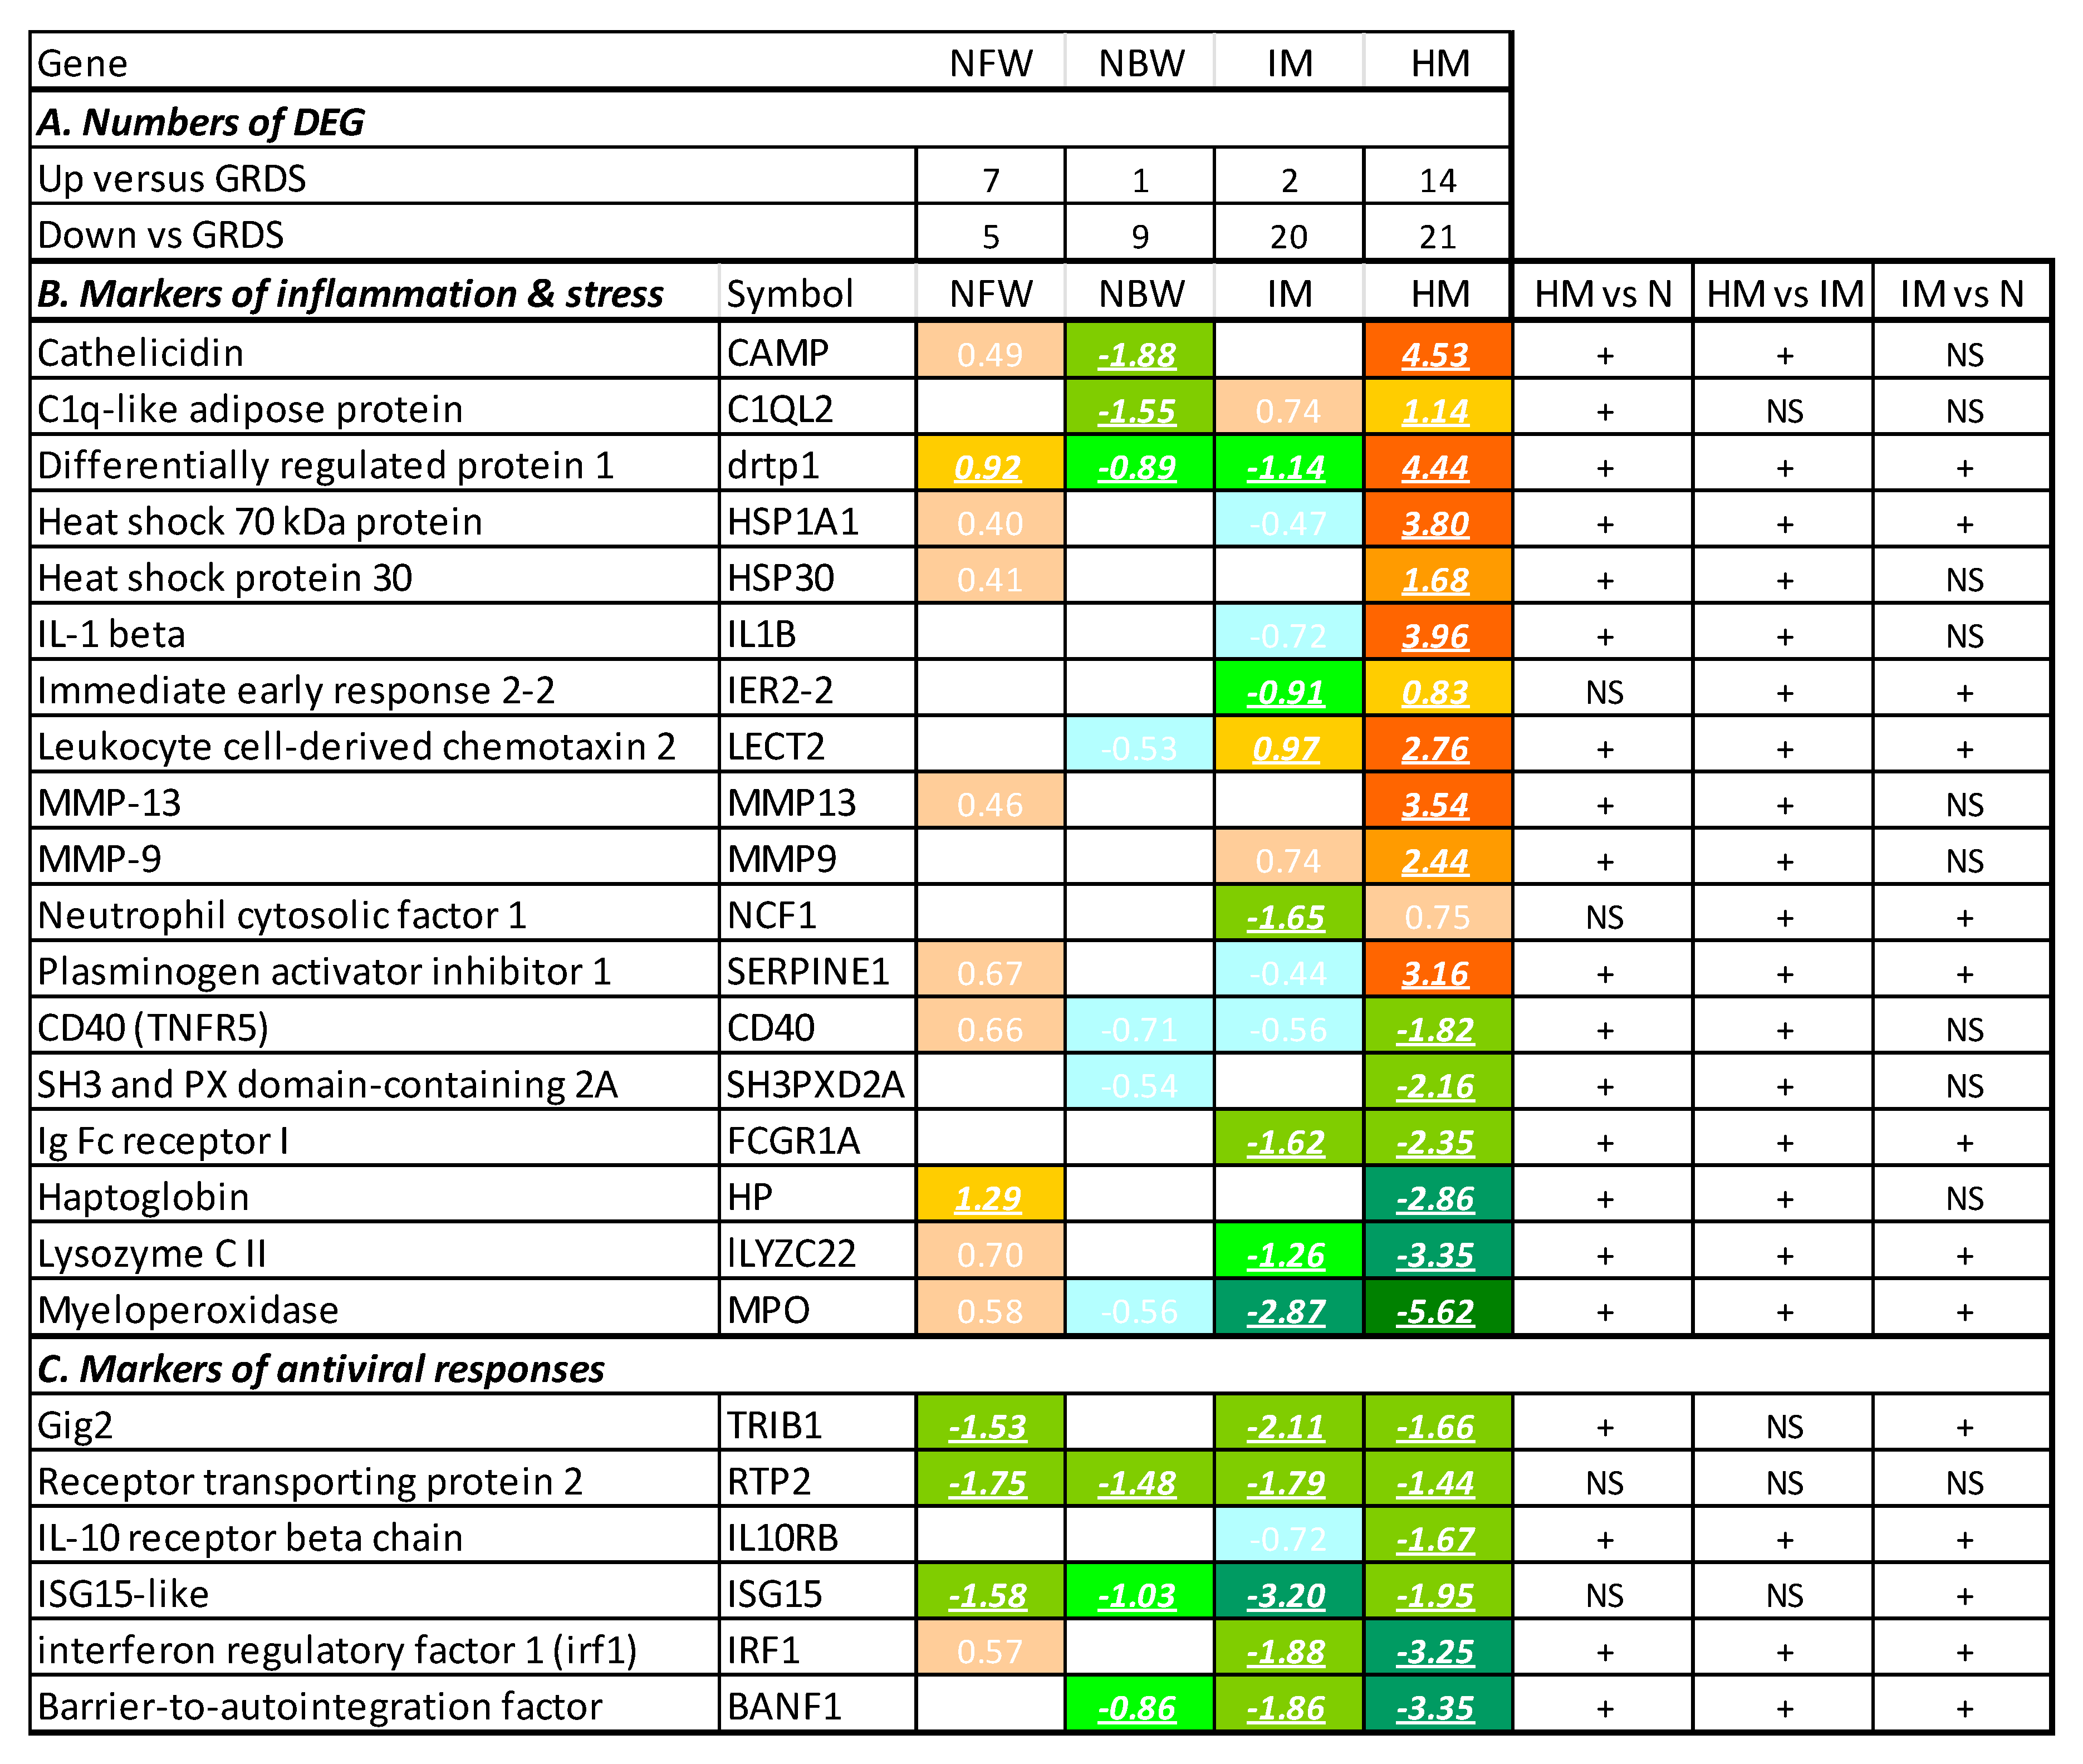
3.2. Reference Data Set and Assessment of Immune Status
4. Discussion
5. Conclusions
Supplementary Materials
Author Contributions
Funding
Acknowledgments
Conflicts of Interest
References
- Asche, F.; Roll, K.H. Determinants of inefficiency in Norwegian salmon aquaculture. Aquac. Econ. Manag. 2013, 17, 300–321. [Google Scholar] [CrossRef]
- Pettersen, J.M.; Osmundsen, T.; Aunsmo, A.; Mardones, F.O.; Rich, K.M. Controlling emerging infectious diseases in salmon aquaculture. Rev. Sci. Tech. 2015, 34, 923–938. [Google Scholar] [CrossRef] [PubMed] [Green Version]
- Johansson, L.H.; Timmerhaus, G.; Afanasyev, S.; Jørgensen, S.M.; Krasnov, A. Smoltification and seawater transfer of Atlantic salmon (Salmo salar L.) is associated with systemic repression of the immune transcriptome. Fish Shellfish Immunol. 2016, 58, 33–41. [Google Scholar] [CrossRef] [PubMed]
- Björnsson, B.T.; Stefansson, S.O.; McCormick, S.D. Environmental endocrinology of salmon smoltification. Gen. Comp. Endocrinol. 2011, 170, 290–298. [Google Scholar] [CrossRef] [PubMed]
- McCormick, S.D. Smolt physiology and endocrinology. In Fish Physiology; Elsevier: Amsterdam, The Netherlands, 2012; pp. 199–251. [Google Scholar]
- Karlsen, C.; Ytteborg, E.; Timmerhaus, G.; Høst, V.; Handeland, S.; Jørgensen, S.M.; Krasnov, A. Atlantic salmon skin barrier functions gradually enhance after seawater transfer. Sci. Rep. 2018, 8, 9510. [Google Scholar] [CrossRef] [PubMed]
- Krasnov, A.; Timmerhaus, G.; Afanasyev, S.; Jørgensen, S.M. Development and assessment of oligonucleotide microarrays for Atlantic salmon (Salmo salar L.). Comp. Biochem. Physiol. Part D Genom. Proteom. 2011, 6, 31–38. [Google Scholar] [CrossRef] [PubMed]
- Løvoll, M.; Austbø, L.; Jørgensen, J.B.; Rimstad, E.; Frost, P. Transcription of reference genes used for quantitative RT-PCR in Atlantic salmon is affected by viral infection. Vet. Res. 2011, 42, 8. [Google Scholar] [CrossRef] [PubMed] [Green Version]
- Rebl, A.; Rebl, H.; Verleih, M.; Haupt, S.; Köbis, J.M.; Goldammer, T.; Seyfert, H.M. At Least Two Genes Encode Many Variants of Irak3 in Rainbow Trout, but Neither the Full-Length Factor Nor Its Variants Interfere Directly With the TLR-Mediated Stimulation of Inflammation. Front. Immunol. 2019, 10, 2246. [Google Scholar] [CrossRef] [PubMed] [Green Version]
- Press, C.M.; Evensen, Ø. The morphology of the immune system in teleost fishes. Fish Shellfish Immunol. 1999, 9, 309–318. [Google Scholar] [CrossRef] [Green Version]
- Pettersen, E.F.; Bjerknes, R.; Wergeland, H.I. Studies of Atlantic salmon (Salmo salar L.) blood, spleen and head kidney leucocytes using specific monoclonal antibodies, immunohistochemistry and flow cytometry. Fish Shellfish Immunol. 2000, 10, 695–710. [Google Scholar] [CrossRef] [PubMed]
- Johansen, L.H.; Thim, H.L.; Jørgensen, S.M.; Afanasyev, S.; Strandskog, G.; Taksdal, T.; Fremmerlid, K.; McLoughlin, M.; Jørgensen, J.B.; Krasnov, A. Comparison of transcriptomic responses to pancreas disease (PD) and heart and skeletal muscle inflammation (HSMI) in heart of Atlantic salmon (Salmo salar L.). Fish Shellfish Immunol. 2015, 46, 612–623. [Google Scholar] [CrossRef] [PubMed]
- Tadiso, T.M.; Krasnov, A.; Skugor, S.; Afanasyev, S.; Hordvik, I.; Nilsen, F. Gene expression analyses of immune responses in Atlantic salmon during early stages of infection by salmon louse (Lepeophtheirus salmonis) revealed bi-phasic responses coinciding with the copepod-chalimus transition. BMC Genom. 2011, 12, 141. [Google Scholar] [CrossRef] [PubMed] [Green Version]
- Krasnov, A.; Timmerhaus, G.; Schiøtz, B.L.; Torgersen, J.; Afanasyev, S.; Iliev, D.; Jørgensen, J.; Takle, H.; Jørgensen, S.M. Genomic survey of early responses to viruses in Atlantic salmon, Salmo salar L. Mol. Immunol. 2011, 49, 163–174. [Google Scholar] [CrossRef] [PubMed]
- Król, E.; Noguera, P.; Shaw, S.; Costelloe, E.; Gajardo, K.; Valdenegro, V.; Bickerdike, R.; Douglas, A.; Martin, S.A. Integration of Transcriptome, Gross Morphology and Histopathology in the Gill of Sea Farmed Atlantic Salmon (Salmo salar): Lessons From Multi-Site Sampling. Front. Genet. 2020, 11, 610. [Google Scholar] [CrossRef] [PubMed]
- Miller, K.M.; Günther, O.P.; Li, S.; Kaukinen, K.H.; Ming, T.J. Molecular indices of viral disease development in wild migrating salmon. Conserv. Physiol. 2017, 5, cox036. [Google Scholar] [CrossRef] [PubMed]
- Tucker, S.; Li, S.; Kaukinen, K.H.; Patterson, D.A.; Miller, K.M. Distinct seasonal infectious agent profiles in life-history variants of juvenile Fraser River Chinook salmon: An application of high-throughput genomic screening. PLoS ONE 2018, 13, e0195472. [Google Scholar] [CrossRef] [Green Version]


| Type | Experiments | Contrasts |
|---|---|---|
| All | 115 | 560 |
| Immune | 54 | 274 |
| Bacteria | 11 | 54 |
| Viruses | 24 | 102 |
| Parasites | 12 | 50 |
| Vaccines | 6 | 26 |
| Stress | 11 | 76 |
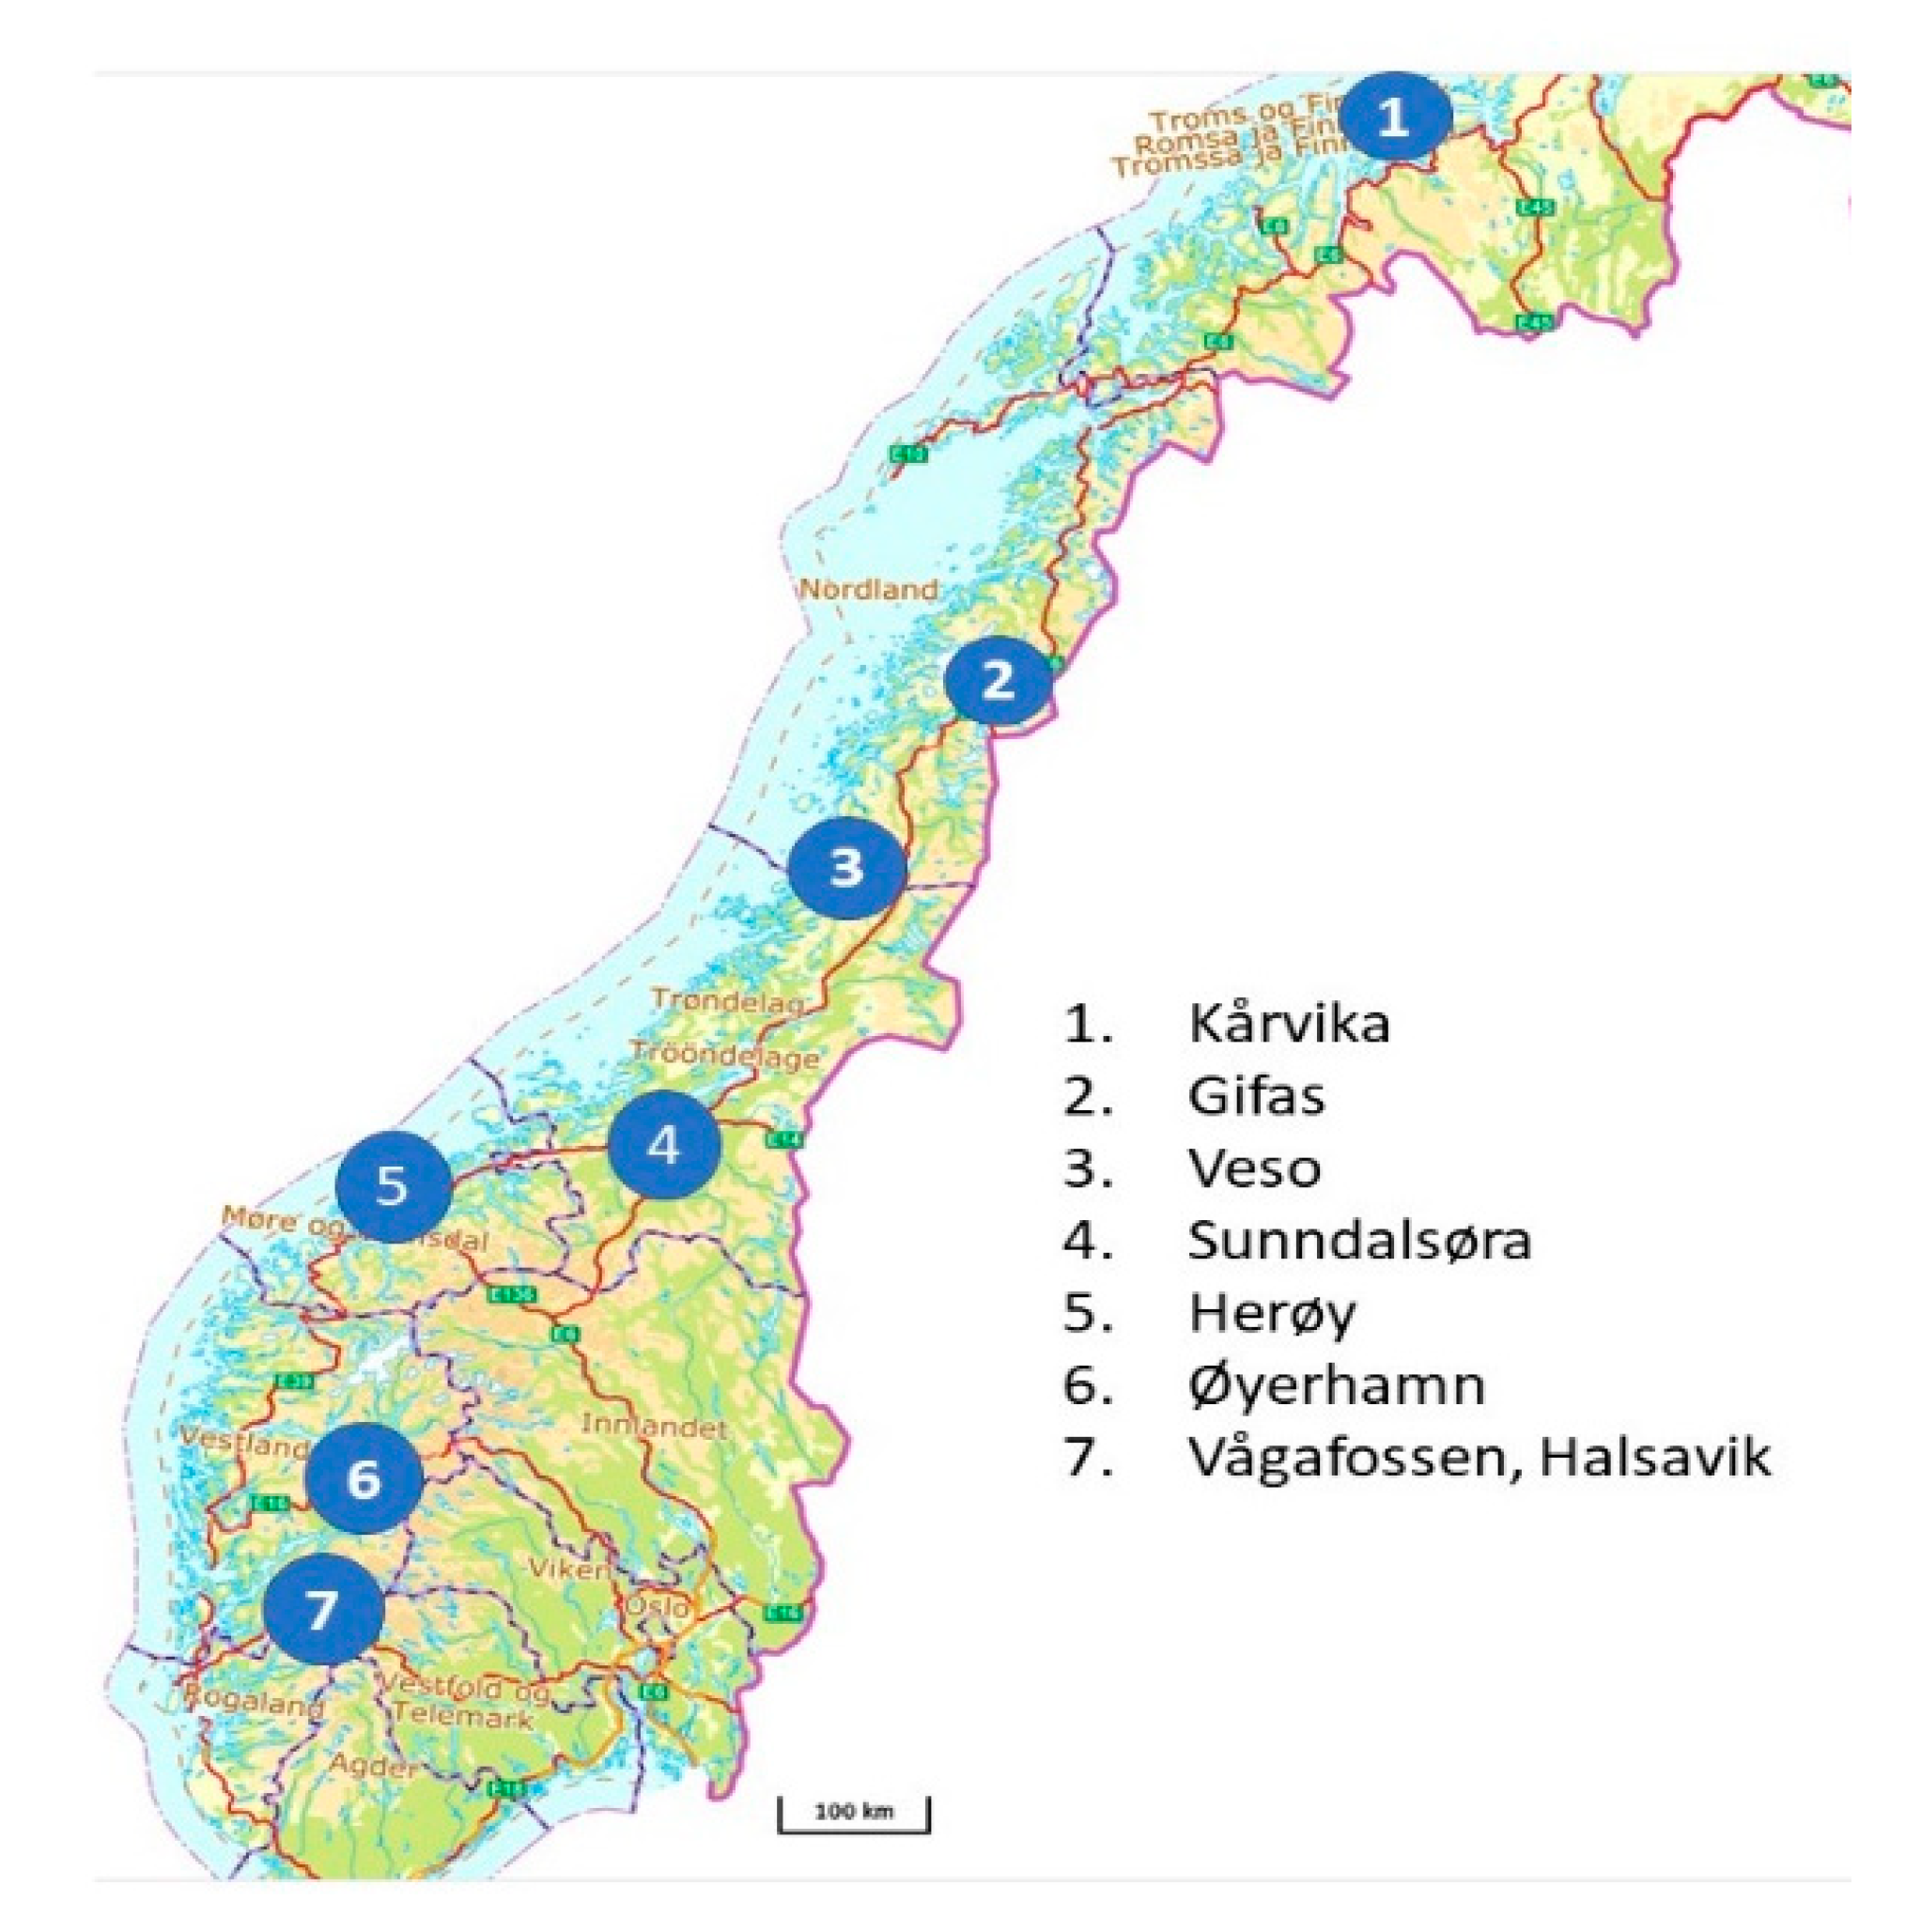
| Project | Site | Time Points | Format | Age | Facility | Tissue | No. of Samples |
|---|---|---|---|---|---|---|---|
| Korssting | Sunndalsøra | 1 | 96 | Smolt | Land FT 1 | Fin, gill, head, kidney, spleen | 24 |
| Gifas | 3 | 96 | Postsmolt | Sea cages | Fin, gill, head kidney, spleen | 72 | |
| Progress | Kårvika | 3 | 96 | Parr, smolt | Land FT | Head kidney, spleen, gill | 96 |
| ImCom: Animal Health | Veso | 3 | 96 | Parr, smolt | Land FT | Heart, spleen | 160 |
| ImCom: Mowi | Vågafossen | 2 | 96 | Parr, smolt | Land RAS 2 | Fin, gill, spleen | 72 |
| Herøy | 2 | 96 | Postsmolt | Sea cages | Fin, gill, spleen | 72 | |
| Øyerhamn | 2 | 96 | Parr, smolt | Land FT | Fin, gill, spleen | 72 | |
| Halsavik | 2 | 96 | Postsmolt | Sea cages | Fin, gill, spleen | 72 | |
| Benchmark | Sunndalsøra | 4 | 48 | Parr, smolt | Land FT, RAS | Gill | 194 |
| Gifas | 1 | 48 | Postsmolt | Sea cages | Gill | 160 | |
| Farmwell | Sunndalsøra | 1 | 96 | Smolt | Land FT, RAS | Gill | 72 |
| Pharmaq Analytiq | Various | 1 | 48 | Gill | 80 |
Publisher’s Note: MDPI stays neutral with regard to jurisdictional claims in published maps and institutional affiliations. |
© 2020 by the authors. Licensee MDPI, Basel, Switzerland. This article is an open access article distributed under the terms and conditions of the Creative Commons Attribution (CC BY) license (http://creativecommons.org/licenses/by/4.0/).
Share and Cite
Krasnov, A.; Afanasyev, S.; Nylund, S.; Rebl, A. Multigene Expression Assay for Assessment of the Immune Status of Atlantic Salmon. Genes 2020, 11, 1236. https://doi.org/10.3390/genes11111236
Krasnov A, Afanasyev S, Nylund S, Rebl A. Multigene Expression Assay for Assessment of the Immune Status of Atlantic Salmon. Genes. 2020; 11(11):1236. https://doi.org/10.3390/genes11111236
Chicago/Turabian StyleKrasnov, Aleksei, Sergey Afanasyev, Stian Nylund, and Alexander Rebl. 2020. "Multigene Expression Assay for Assessment of the Immune Status of Atlantic Salmon" Genes 11, no. 11: 1236. https://doi.org/10.3390/genes11111236