1. Introduction
Food allergens are among the most pressing concerns regarding global public health. Exposure to low doses of an allergen can provoke a severe response in sensitive persons, and the only effective way to prevent this is to avoid food items that may contain such allergens. The most recent European Directive concerning food safety (No. 1169/2011) lists 14 main allergenic food ingredients. Food producers and manufacturers have to be sure of the absence of these compounds and declare products as safe on the label [
1]. It is important to highlight that unintentional “cross-contact” between different food ingredients with allergens can occur not only in raw materials but also during processing, in reworked products, or due to allergen carry-over from the use of shared equipment or production plants [
2]. To prevent cross-contamination in terms of allergenic substances between food products, many food manufacturers put in place very strict allergen-control measures, such as the use of dedicated facilities or production lines.
Although there are legal indications on how to declare allergens in food, globalization has certainly increased the number of proteins that can be found in foods and are able to cause allergic reactions in sensitive subjects [
3]. Therefore, food safety strategies demand innovative analytical methods to control raw materials and processed food products to verify the absence of known and unknown contaminants. Omics technologies offer a suitable solution [
4]. Proteomics arguably represent the best option to identify new allergenic proteins and, in combination with immunoassays, they offer the opportunity of detecting allergenic compounds. On the other hand, DNA-based methods have been developed over recent decades to identify and quantify allergenic food components [
5]. Polymerase Chain Reaction techniques (PCR) and related approaches have also been applied to the detection of genome fragments encoding allergenic food proteins, and have progressively been implemented in routine analyses for semi-quantitative/quantitative analyses of food allergens [
5,
6].
Among the PCR-based methods, DNA barcoding has largely been used to identify the taxonomic identity of raw and transformed food materials [
7,
8]. This technique, which is based on the amplification and sequencing of universal genome region(s), shows several important advantages. First of all, due to the availability of comprehensive reference sequence libraries (e.g., the barcode of life database BOLD and NCBI GenBank), the DNA barcoding approach is able to identify any kind of organism (even those not listed on a putative label) occurring in the analyzed food item. Moreover, it is a relatively easy and low-cost analytical method, suitable for routine analysis in industrial food companies. The success of DNA barcoding has progressively been recognized by governmental authorities, which proposed its official adoption for the authentication of some food categories, as was the case of fish-based products by the US FDA [
9]. Moreover, new regulatory directives concerning food labeling, such as the European Regulation No. 1169/2011 [
1] on the provision of food information to consumers, will inevitably drive national institutions towards the use of molecular DNA-based tools to address the issues of food authenticity and safety. Several papers suggest the efficacy of the DNA barcoding approach in complementing food quality and safety control activities [
7,
10]. In general, this tool has a higher efficacy when the investigated species show a great interspecific divergence and a smaller intraspecific one. This is strictly related to the phylogenetic relationships between the contaminant taxa and the declared food ingredient species [
11,
12]. For example, Federici and co-workers [
11] showed that DNA barcoding does not distinguish between some cryptic taxa of Lamiaceae (e.g., Thymus) due to their low phylogenetic structure or to introgression events among different morphospecies. Conversely, other studies supported a clear gap between the two sources of genetic variability (i.e., intraspecific vs. interspecific) that were able to distinguish both animal and plant food raw materials [
12].
In this study we investigated common wheat flour (
Triticum aestivum L.) contamination by species belonging to the Brassicaceae family (e.g., radish, various types of cabbage, broccoli, turnip, rapeseed, and many others). Most of these contain allergenic elements [
13]; specifically, we focused on those plants related to mustard, i.e.,
Sinapis alba L. (yellow mustard, or white mustard),
Brassica juncea L. Czern. (also called brown mustard or Indian mustard), and
Brassica nigra L. (Black mustard). These species contain the allergenic 2S albumin, which can produce serious health reactions in sensitive subjects [
14]. Therefore, the European Regulation 1169/2011 established that producers have to declare the presence of such compounds on the label of their products. Currently, laboratories working in the food sector often adopt an ELISA approach [
15] to detect possible food contamination by mustard species. However, this approach could give false positive results due to the frequent cross reactivity with other non-allergenic species such as
Brassica napus L. (rapeseed) [
16]. Moreover, allergic reactions to rapeseed have never been described in mustard-allergic patients [
17]. In addition,
B. napus is the second most important oilseed crop of the world and, in agricultural production, a very suitable complement for rotations with cereals like wheat [
18].
The work here presented aims to set up a reliable DNA-based tool to detect mustard allergenic species which is able to meet food companies’ needs. The DNA test should be able to identify mustard species and exclude the false positivity with B. napus in wheat flour, avoiding erroneous food allergen labeling, and the loss or discarding of food products.
2. Materials and Methods
2.1. Reference Plant Dataset
To assess the efficacy of a DNA-based approach to identify the allergenic taxa belonging to the Brassicaceae family, three geographically different seed batches of the most allergenic mustard species (i.e.,
S. alba,
B. juncea, and
B. nigra) and the non-allergenic
B. napus were sourced from the Centre of Genetic Resources (CGN, Wageningen, The Netherlands) (
Table S1). Additionally, DNA of
T. aestivum was obtained from uncontaminated wheat flour.
2.2. Reference Common Wheat Flour Matrices Preparation
Starting from a 20 kg batch of common Italian grains (i.e., T. aestivum), a homogeneous wheat flour was obtained in a pilot plant, according to common milling procedure. Water was added to the wheat and the mixture was left at room temperature for 36 h in order to let the bran separate from the grain of wheat. This step allowed the moisture level to reach 16.50% (starting from 11.30%), improving the division of husks from wheat during grinding. A Bona mill (Bona S.r.L., Italy) with a capacity of 1–4 kg/h was used. This lab scale mill can simulate the industrial milling process and separate the different parts of the durum wheat kernel: the external bran, the intermediate layers (aleurone cells layer) and the inner endosperm (rich in starch) called ‘semolina’. The kernels are broken in three steps, i.e., passing through rifled cylinders, break rolls and reducing rolls, which are like the industrial ones and rotate with different speeds. Finally, the yielded parts are separated by sieves and sorted into three categories: the external bran layer, aleurone cells (a mix of intermediate bran layers and endosperms) and 58% of semolina (the kernel endosperm). Rapeseed and mustard seeds were smashed in different disposable tubes by Precellys Evolution Homogenizer (Bertin Technologies, France) and a greasy powder was obtained from these samples. This technology is able to lysate and homogenize different hard samples thanks to a 3D bead-beating movement that gives the same efficiency to each tube. Samples were homogenized three times for 30 s at 9000 rpm. Twenty seconds elapsed between one run of grinding and the next to prevent overheating the samples. To avoid cross-contamination from field of mustard and rapeseed, the selected common grain came from Italy, where these cultivations are absent. The purity of obtained flour was tested by an external laboratory with ELISA (RIDASCREEN® FAST Senf/Mustard) and PCR assay for mustard and rapeseed identification. Reference matrices were prepared by using a round homemade mixing container with a 1070 cm3 capacity. First, flour was inserted inside the container as a bulk and the correct amount of powdered seeds was added to obtain two different levels of fortification: 0.1% and 0.002%. The resulting flours were then left rotating for 8 h.
2.3. DNA Markers Selection
Preliminary bioinformatic analysis was conducted to evaluate the most variable DNA barcoding regions that are useful for distinguishing mustard species. Nucleotide sequences of
B. nigra,
B. juncea,
B. napus, and
S. alba were obtained from NCBI Nucleotide for
rbcL,
matK,
psbA-trnH, and ITS2 regions (
www.ncbi.nlm.nih.gov/nucleotide/). Kimura two-parameters K2P distances for all markers were evaluated with MEGA software (Version 10.0.5) [
19]. The average K2P distance, range of K2P variation and standard error for each tested marker are shown in
Table S2. To have a marker of positive control for the occurrence of Brassicaceae, the
matK locus was selected, since it has conserved regions shared among the tested Brassicaceae species that are different for
T. aestivum (
Table 1). The nuclear ITS2 region was identified as a possible candidate DNA barcode region to distinguish
S. alba from the other three Brassica species (i.e.,
B. nigra,
B. juncea, and
B. napus).
Unfortunately, the genetic distances between some mustard species (i.e.,
B. juncea and
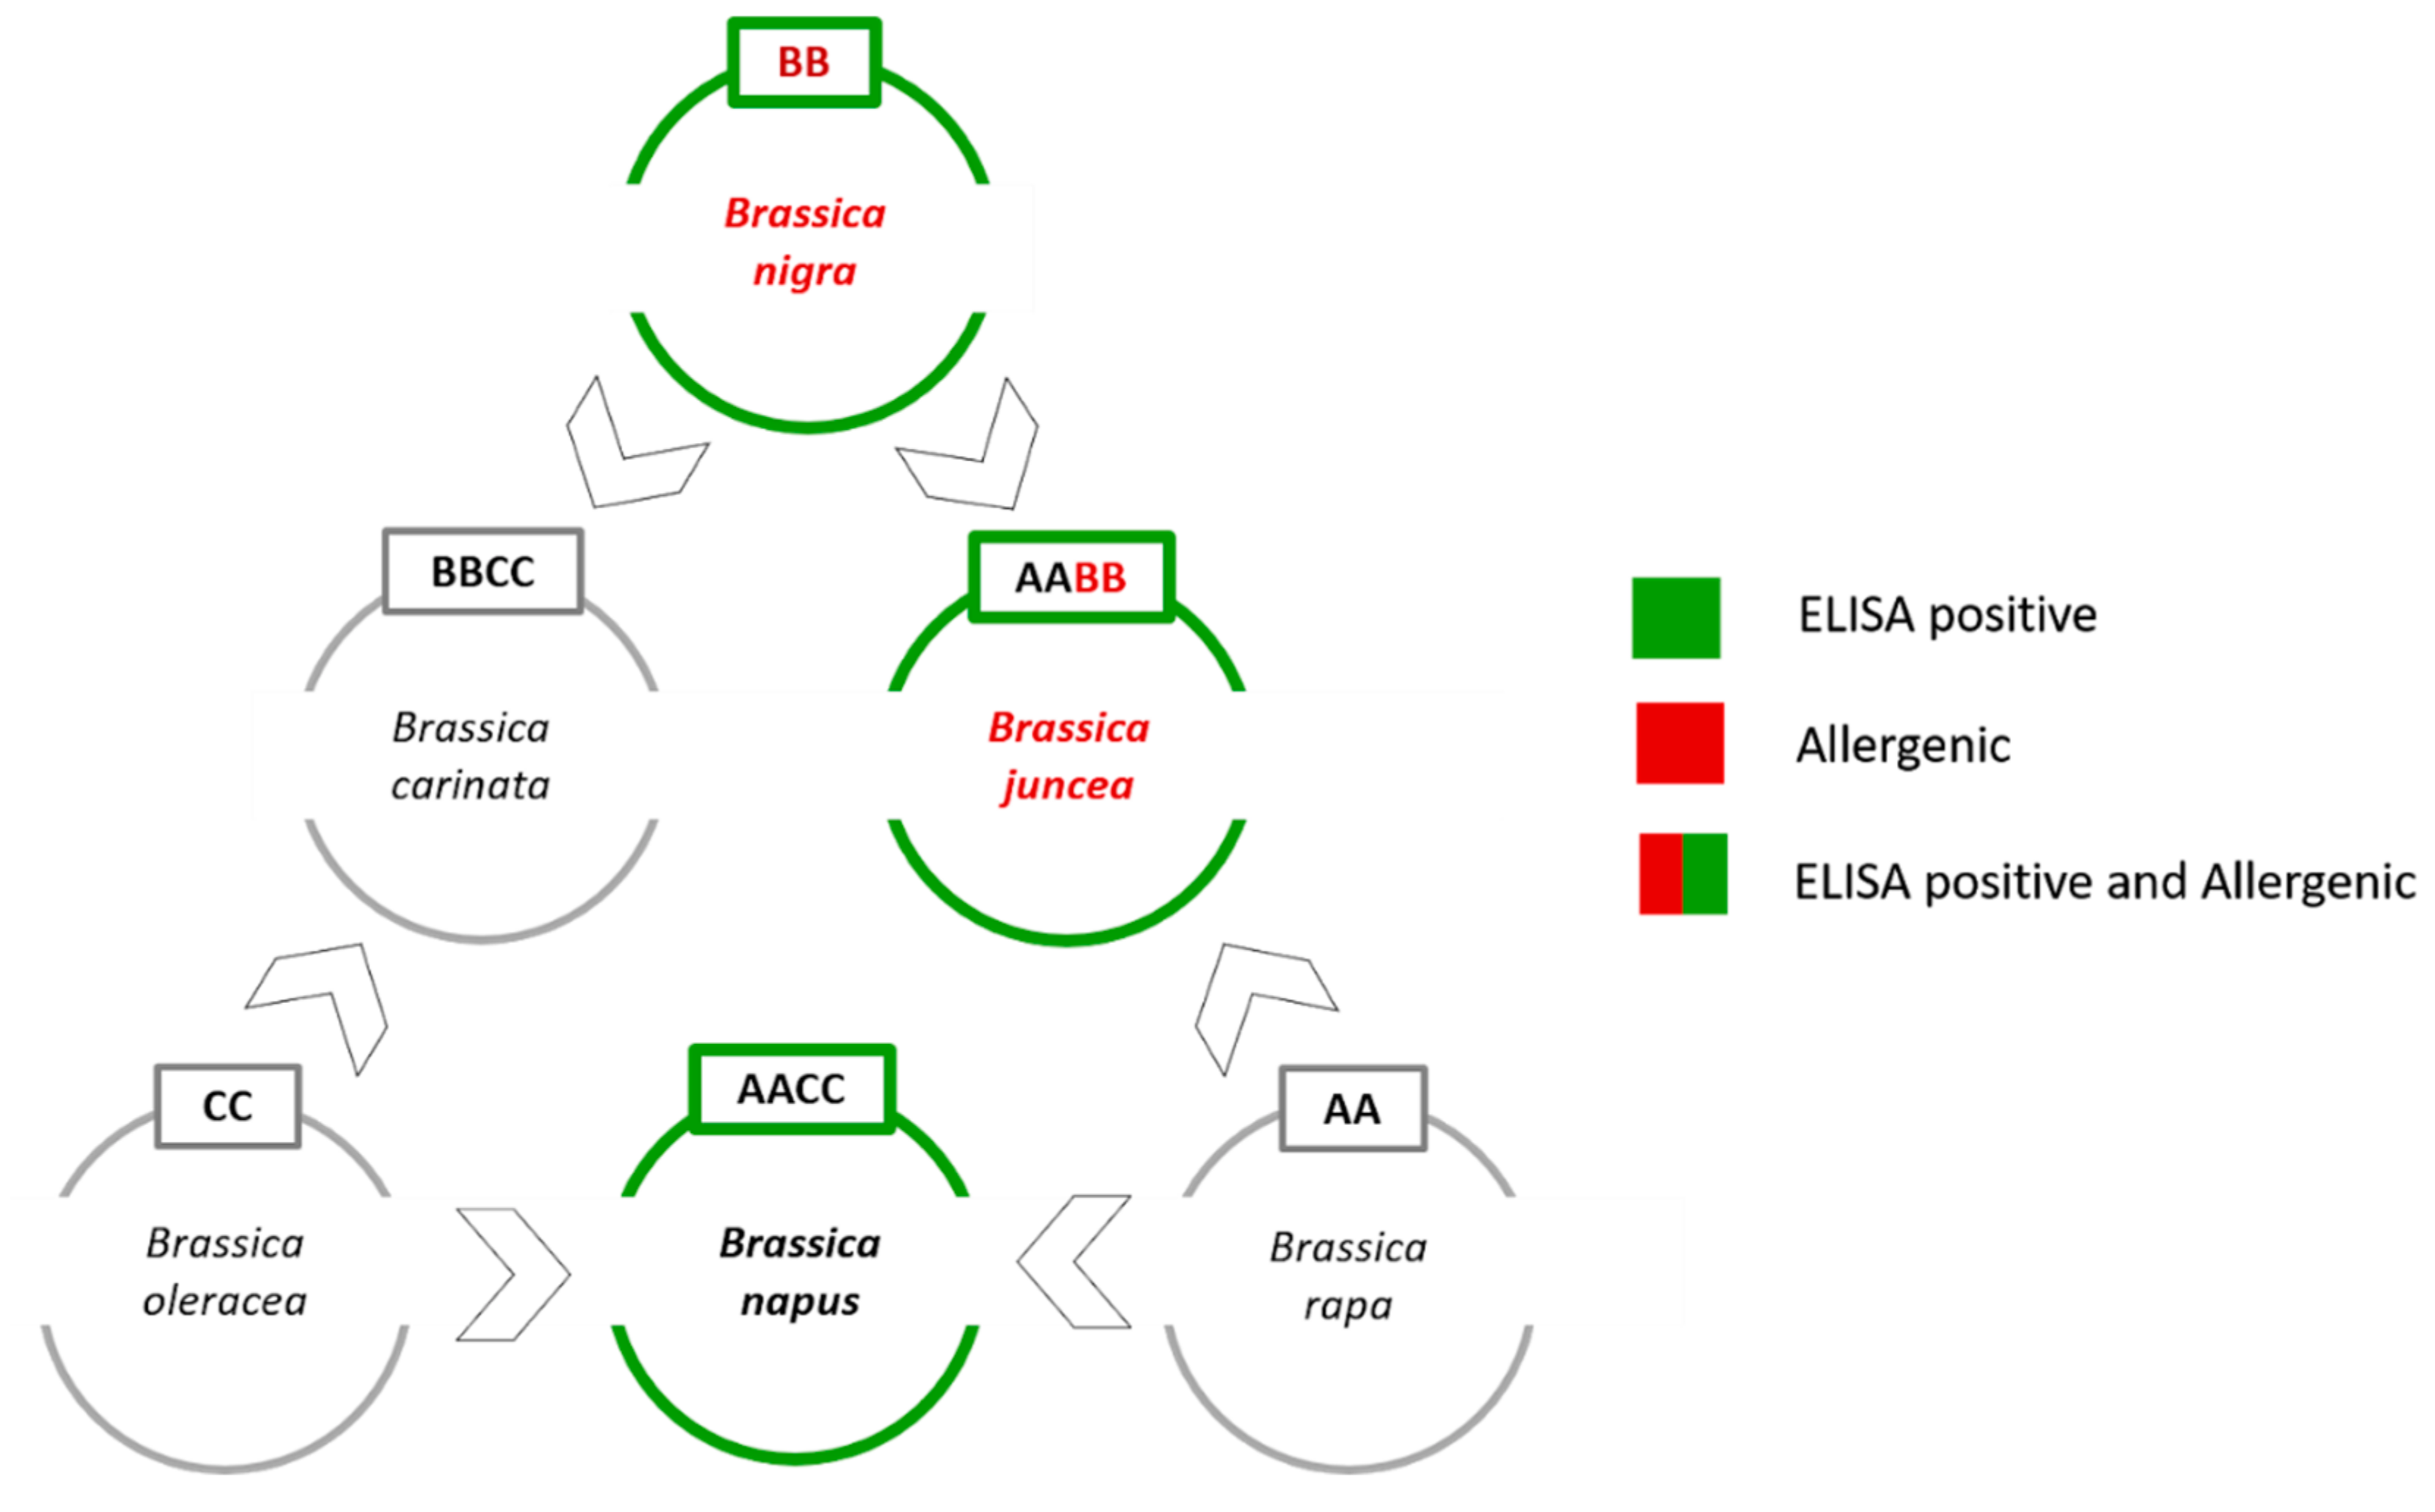
B. nigra) are very small since they are members of the six species forming the so called “Brassica U’s triangle” (
Figure 1) [
22].
The angles of the U’s triangle are formed by three species with their own elementary genome: B. rapa (A-genome), B. nigra (B-genome), and B. oleracea (C-genome). The sides consist of three amphiploid species formed by the elementary genomes, B. juncea (AB), B. napus (AC), and B. carinata (BC). In this work, the main issue was to develop a tool to distinguish the allergenic mustard species (i.e., B. nigra and B. juncea) from the non-allergenic rapeseed (i.e., B. napus) that shows cross-reactivity with the commercial ELISA assays.
B. napus grows in crop rotation systems, and in an ideal and frequently applied rotation system, rapeseed will follow a cereal crop [
23]. For this reason, rapeseed contamination in wheat crops can occur rather frequently. Conversely,
B. rapa,
B. oleracea and
B. carinata grow in a different typology of fields, so the risk of contamination is low. For this reason, rapeseed is the only U’s triangle non-allergenic species that has been considered in this study.
In order to selectively distinguish each mustard species, three species-specific DNA regions were also considered (i.e., Bra019579 (Chromosome A6, 220 bp) specific for
B. juncea and
B. napus, pBNBH35 (Chromosome B, 280 bp) specific for
B. juncea and
B. nigra and Bo1g016520 (Chromosome C1, 130 bp) specific for
B. napus). These regions were previously identified by Koh et al. [
20] and Schelfhout et al. [
21]. All the primer pairs used in this study are reported in
Table 1.
2.4. Primer Design
Primer pairs listed in
Table 1 were identified by bioinformatic analysis. Nucleotide sequences of
matK region obtained from NCBI Nucleotide were aligned using ClustalW2 software (
www.ebi.ac.uk/Tools/msa/clustalw2/), and a universal primer pair for Brassicaceae was de novo designed on the regions of the
matK barcode locus mostly conserved among all the considered species and Brassicaceae family (
Table 1).
Similarly, nucleotide sequences of the nuclear ITS2 locus belonging to
S. alba,
B. nigra,
B. juncea and
B. napus retrieved from Genbank NCBI were aligned using ClustalW2 and used to design a species-specific primer pair only for
S. alba (
Table 1). Both
matK and ITS2 regions were tested with Primer–Blast tool available from NCBI (
www.ncbi.nlm.nih.gov/tools/primer-blast/) to verify their specificity (i.e., Brassicaceae genus for
matK and
S. alba for ITS2). Similarly, primer pairs for A6, B and C1 Brassicaceae chromosomes (i.e.,
B. juncea and
B. napus for A6,
B. juncea and
B. nigra for B and
B. napus for C1) were tested.
2.5. DNA Extraction and Amplification
For
T. aestivum and the mustard and rapeseed species (
Table S1), purified gDNA was obtained starting from 20 mg of seeds for each accession by using the EuroGOLD Plant DNA Mini Kit (Euroclone, Pero, Italy) following manufacturer’s instructions. Purified DNA was checked for concentration and purity by using NanoDrop™ One/OneC Microvolume UV-Vis Spectrophotometer (Thermo Fisher Scientific™, Waltham, Massachusetts, USA).
In order to evaluate the efficiency of the developed molecular tool and to guarantee its reproducibility, flour samples were analyzed following two different DNA extraction protocols. The first was the NucleoSpin® Food (Macherey-Nagel GmbH, Düren, Germany), starting at 250 mg flour samples; the second was the Maxwell®RSC PureFood GMO and Authentication Kit (Promega, Madison, Wisconsin, USA) starting at 200 mg flour samples. For both extraction protocols, the manufacturers’ instructions were followed.
A standard PCR amplification of the selected DNA barcoding loci (
matK and ITS2) was performed using puReTaq Ready-To-Go PCR beads (GE Healthcare Life Sciences, Italy) following the manufacturer’s instructions in a 25 μL reaction containing 1 μL 10 mM of each primer and 50 ng of gDNA. PCR cycles consisted of an initial denaturation step for 5 min at 95 °C, followed by 35 cycles of denaturation (45 s at 95 °C), annealing (45 s at different temperatures; see
Table 1) and extension (1 min at 72 °C), and, hence, a final extension at 72 °C for 7 min.
For the species-specific regions (A6, B and C1) PCR was performed with the same conditions, but 2% of DMSO was added to the mix to increase the stringency of the reaction. We developed a touchdown PCR that consisted of an initial denaturation step for 5 min at 95 °C, followed by 15 denaturation cycles (45 s at 95 °C), annealing (30 s at 70 °C, this temperature is reduced by 0.7 °C every successive cycle) and extension (1 min at 72 °C), and by 14 cycles of denaturation (45 s at 95 °C), annealing (30 s at 66 °C) and extension (1 min at 72 °C) hence, a final extension at 72 °C for 7 min.
The results were interpreted as amplicons presence or absence, and were visualized using the Qiaxcel Automatic electrophoresis system (QIAGEN, Hilden, Germany). Amplicon length was measured by comparison against QX DNA Size Marker 50–800 bp v2.0. Purified amplicons were bidirectionally sequenced using an ABI 3730XL automated sequencing machine at Eurofins Genomics (Ebersberg, Germany). The 3′ and 5′ terminal portions of each sequence were clipped to generate consensus sequences for each sample. The obtained sequences were manually edited, primers were removed and were aligned pairwise. The obtained sequences were submitted to the international GenBank through the EMBL platform (see
Table S1,
Supplementary Materials for accession numbers). The reliability of the tested marker was assessed by adopting a standard comparison approach against a GenBank database with BLASTn (
https://blast.ncbi.nlm.nih.gov/Blast.cgi) [
24]. Each barcode sequence was taxonomically assigned to the plant species with the nearest matches (maximum identity > 99% and query coverage of 100%).
2.6. Enzyme-Linked Immunosorbent (ELISA) Assay
Common wheat flour reference materials were also analyzed by ELISA method (RIDASCREEN® FAST Senf/Mustard). This sandwich enzyme immunoassay uses antibodies specific for detecting all kinds of mustard (yellow, white, brown, black mustard). The kit declares a cross-reactivity approximately 67% with rapeseed, because of the close phylogenetic relationship. The LOD and LOQ are respectively 0.22 mg/kg and 0.5 mg/kg of mustard; the analytical workflow has been carried out in agreement with the supplier’s protocol.
4. Discussion and Conclusions
In this study, the usefulness of DNA barcoding as a tool to verify the possible contamination of wheat flours by mustard was investigated. This is one of the cases known as “hidden allergens” [
25], because these inadvertently added contaminants are not mentioned on packaging, and most consumers may not be aware of being allergic to these products. In the case of mustard species, the 2S albumin stored in the seeds show a high allergenic power [
26,
27]. This is a high heat-resistance protein, and as such, it could remain in its intact form during high temperature industrial processes [
28]. The DNA barcoding analysis confirmed that
T. aestivum is clearly recognizable from the members belonging to Brassicaceae investigated in this study (i.e.,
S. alba, B. nigra, B. juncea, and
B. napus) at both the chloroplast barcode
matK and the nuclear ITS2 markers. The first important result of this work is the identification of two specific primer pairs targeting the two DNA barcoding loci able to distinguish the common wheat flour from the contaminated one, by non-allergenic compound (i.e., rapeseed from the field) and allergenic compound (i.e. mustard).
Concerning mustard contaminants,
S. alba can be easily distinguished from
B. nigra,
B. juncea, and
B. napus using the ITS2 DNA barcoding species-specific primer pair. However, neither of the DNA barcoding regions (i.e.,
matK and ITS2) were able to distinguish
B. napus from the allergenic species
B. juncea; therefore, the primer pair for the B locus is necessary to better distinguish the allergenic species from the non-allergenic
B. napus. It is important to highlight that the main criticism of this diagnostic system is related to the phylogenetic position of the considered taxa [
22]. Therefore, the B primer pairs on B genome of triangle were selected to detect
B. juncea and
B. nigra and exclude
B. napus.
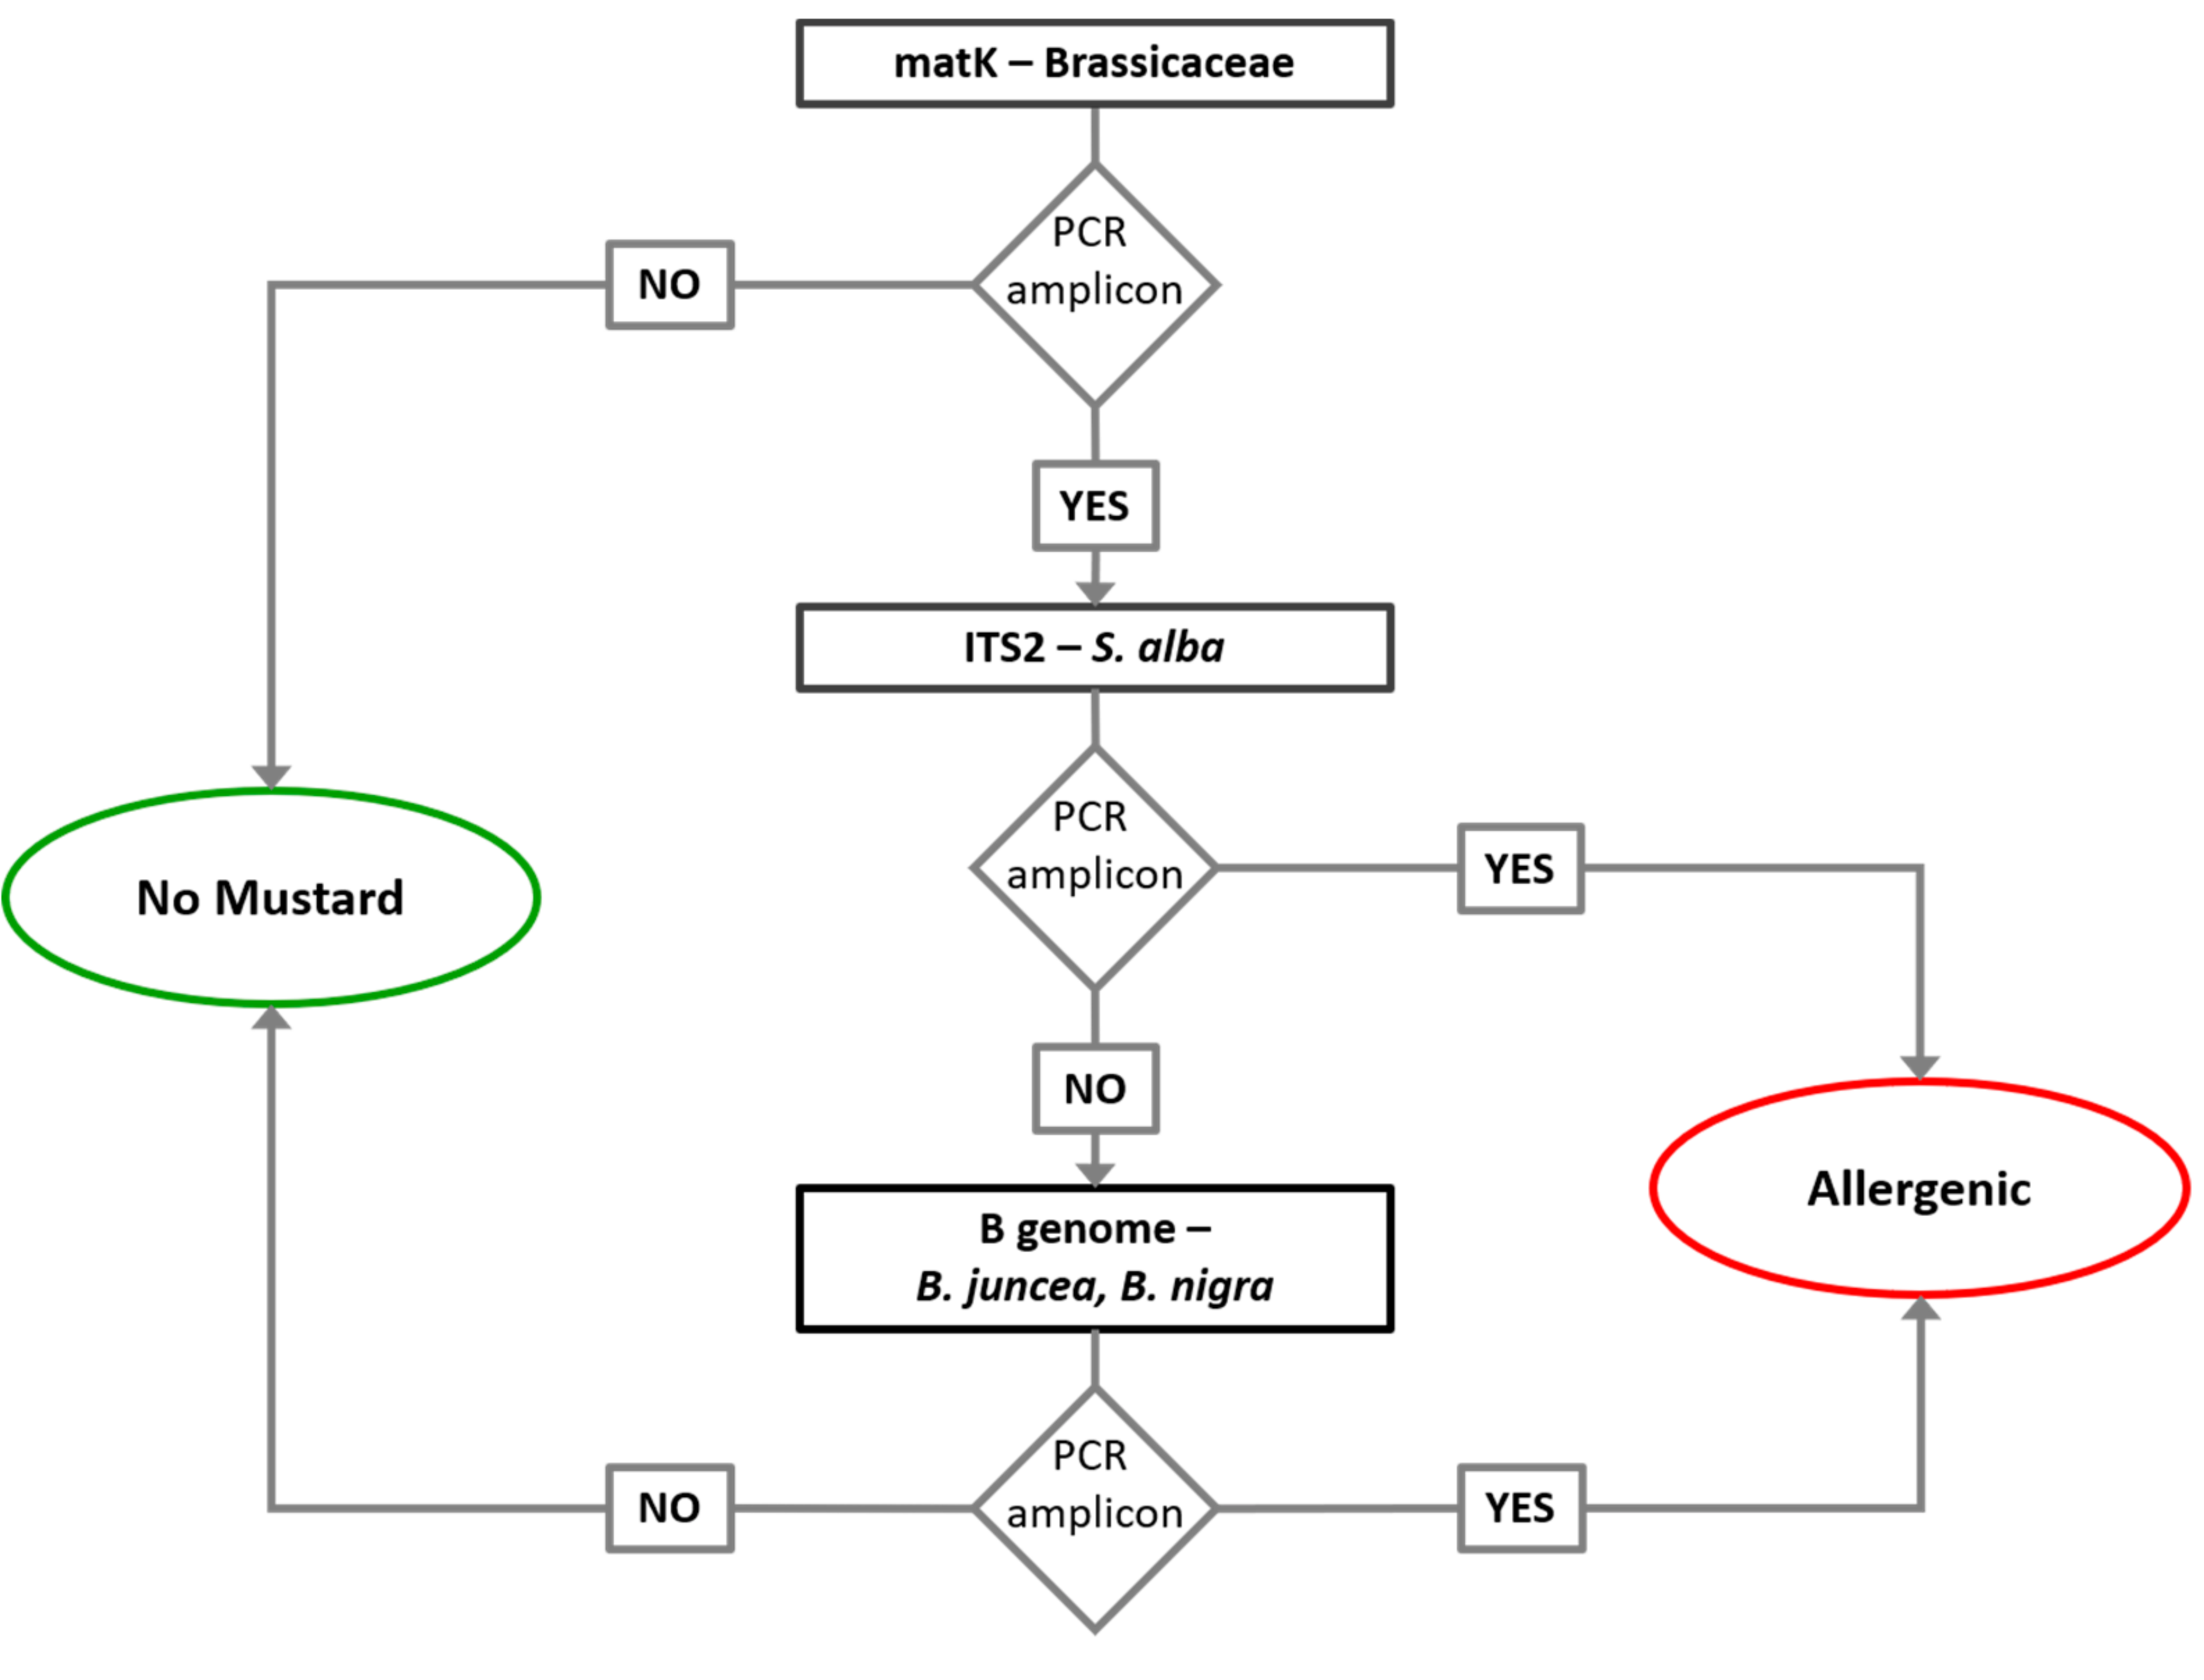
Based on the obtained results, a short analytical pipeline to perform quality control on wheat flours was developed. A simplified DNA analytical process (
Figure 2) consisting of the
matK DNA barcoding amplification with specific primers to identify the occurrence of Brassicaceae DNA in flour and ITS2 amplification with specific primer to identify possible contamination with
S. alba was proposed. In the case of the positive result for
matK, to exclude the
B. napus contamination, B analysis was also performed. The amplification of this locus is sufficient to verify the occurrence of allergenic
Brassica spp. characterized by B genome. The developed tests on DNA markers showed high sensitivity when compared to ELISA immunoassay and could be routinely adopted to integrate the conventional ELISA and to exclude the false positive cases of this due to cross-reactions with
B. napus.
In conclusion, one of the main goals of molecular diagnostics is the simplification of analytical systems, and DNA barcoding offered this opportunity. Several authors propose screening species-specific loci to detect black mustard or brown mustard in food items [
29]. However, each of these loci provides the identification of a specific marker for only one species, and this involves several analyses for each food product. Conversely, the analytical approach proposed here relies on a universal system to clarify the purity of a food matrix or to identify non-allergenic contaminating species. Only in case of positivity for allergenic species will it be possible to characterize specific DNA loci to precisely identify the occurring allergenic species.
Another advantage of the DNA barcoding approach is that it is more versatile than other diagnostic tools, and its adoption could open opportunities for a precise screening not only for specialized laboratories, but also, in the near future, to consumers. In a previous work, Valentini and co-workers developed NanoTracer [
30], a rapid molecular authentication tool based on a simple PCR reaction of the barcode or genome-specific loci that displays high interspecies genetic divergence. Species-specific primers can be easily coupled with the high sensitivity of nanotechnologies to provide rapid and user-friendly colorimetric systems to achieve food authentication [
30]. These kinds of innovations will make molecular-based identification affordable to non-specialized personnel, such as small companies where high-tech laboratory facilities are not available.

 ,
, 

