Using High-Content Screening to Generate Single-Cell Gene-Corrected Patient-Derived iPS Clones Reveals Excess Alpha-Synuclein with Familial Parkinson’s Disease Point Mutation A30P

 , ,
, ,
Abstract
: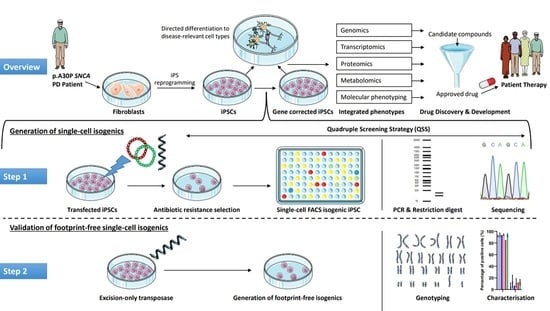
1. Introduction
2. Materials and Methods
2.1. Cell Line and Ethical Approval
2.2. Maintenance of iPSCs
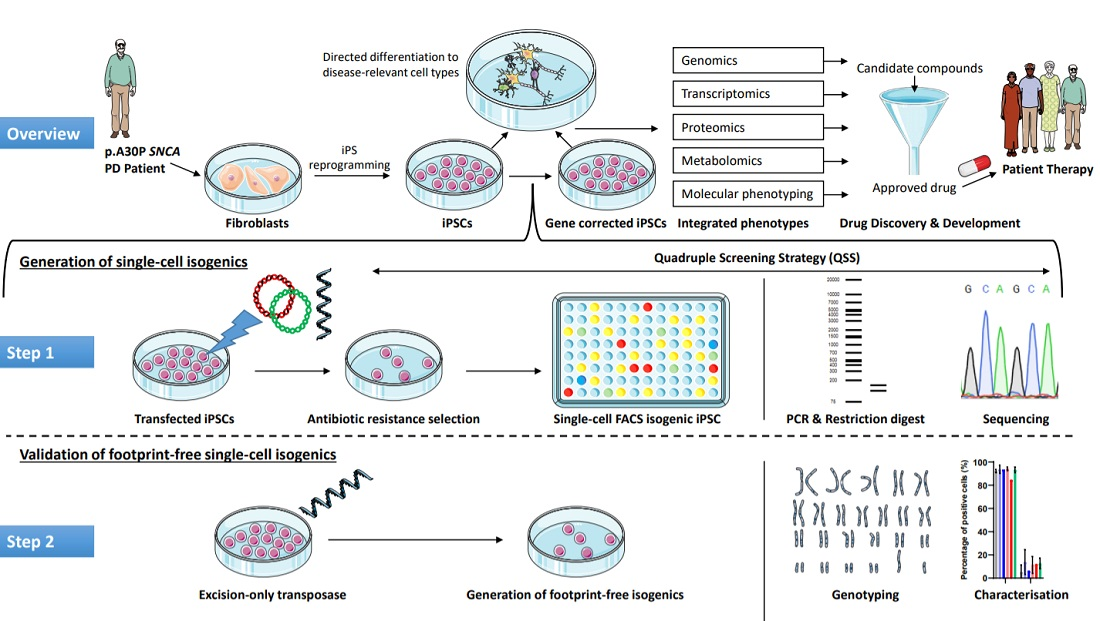
2.3. Generation of Isogenic Cell Lines—Insertion of Fluorescent Constructs
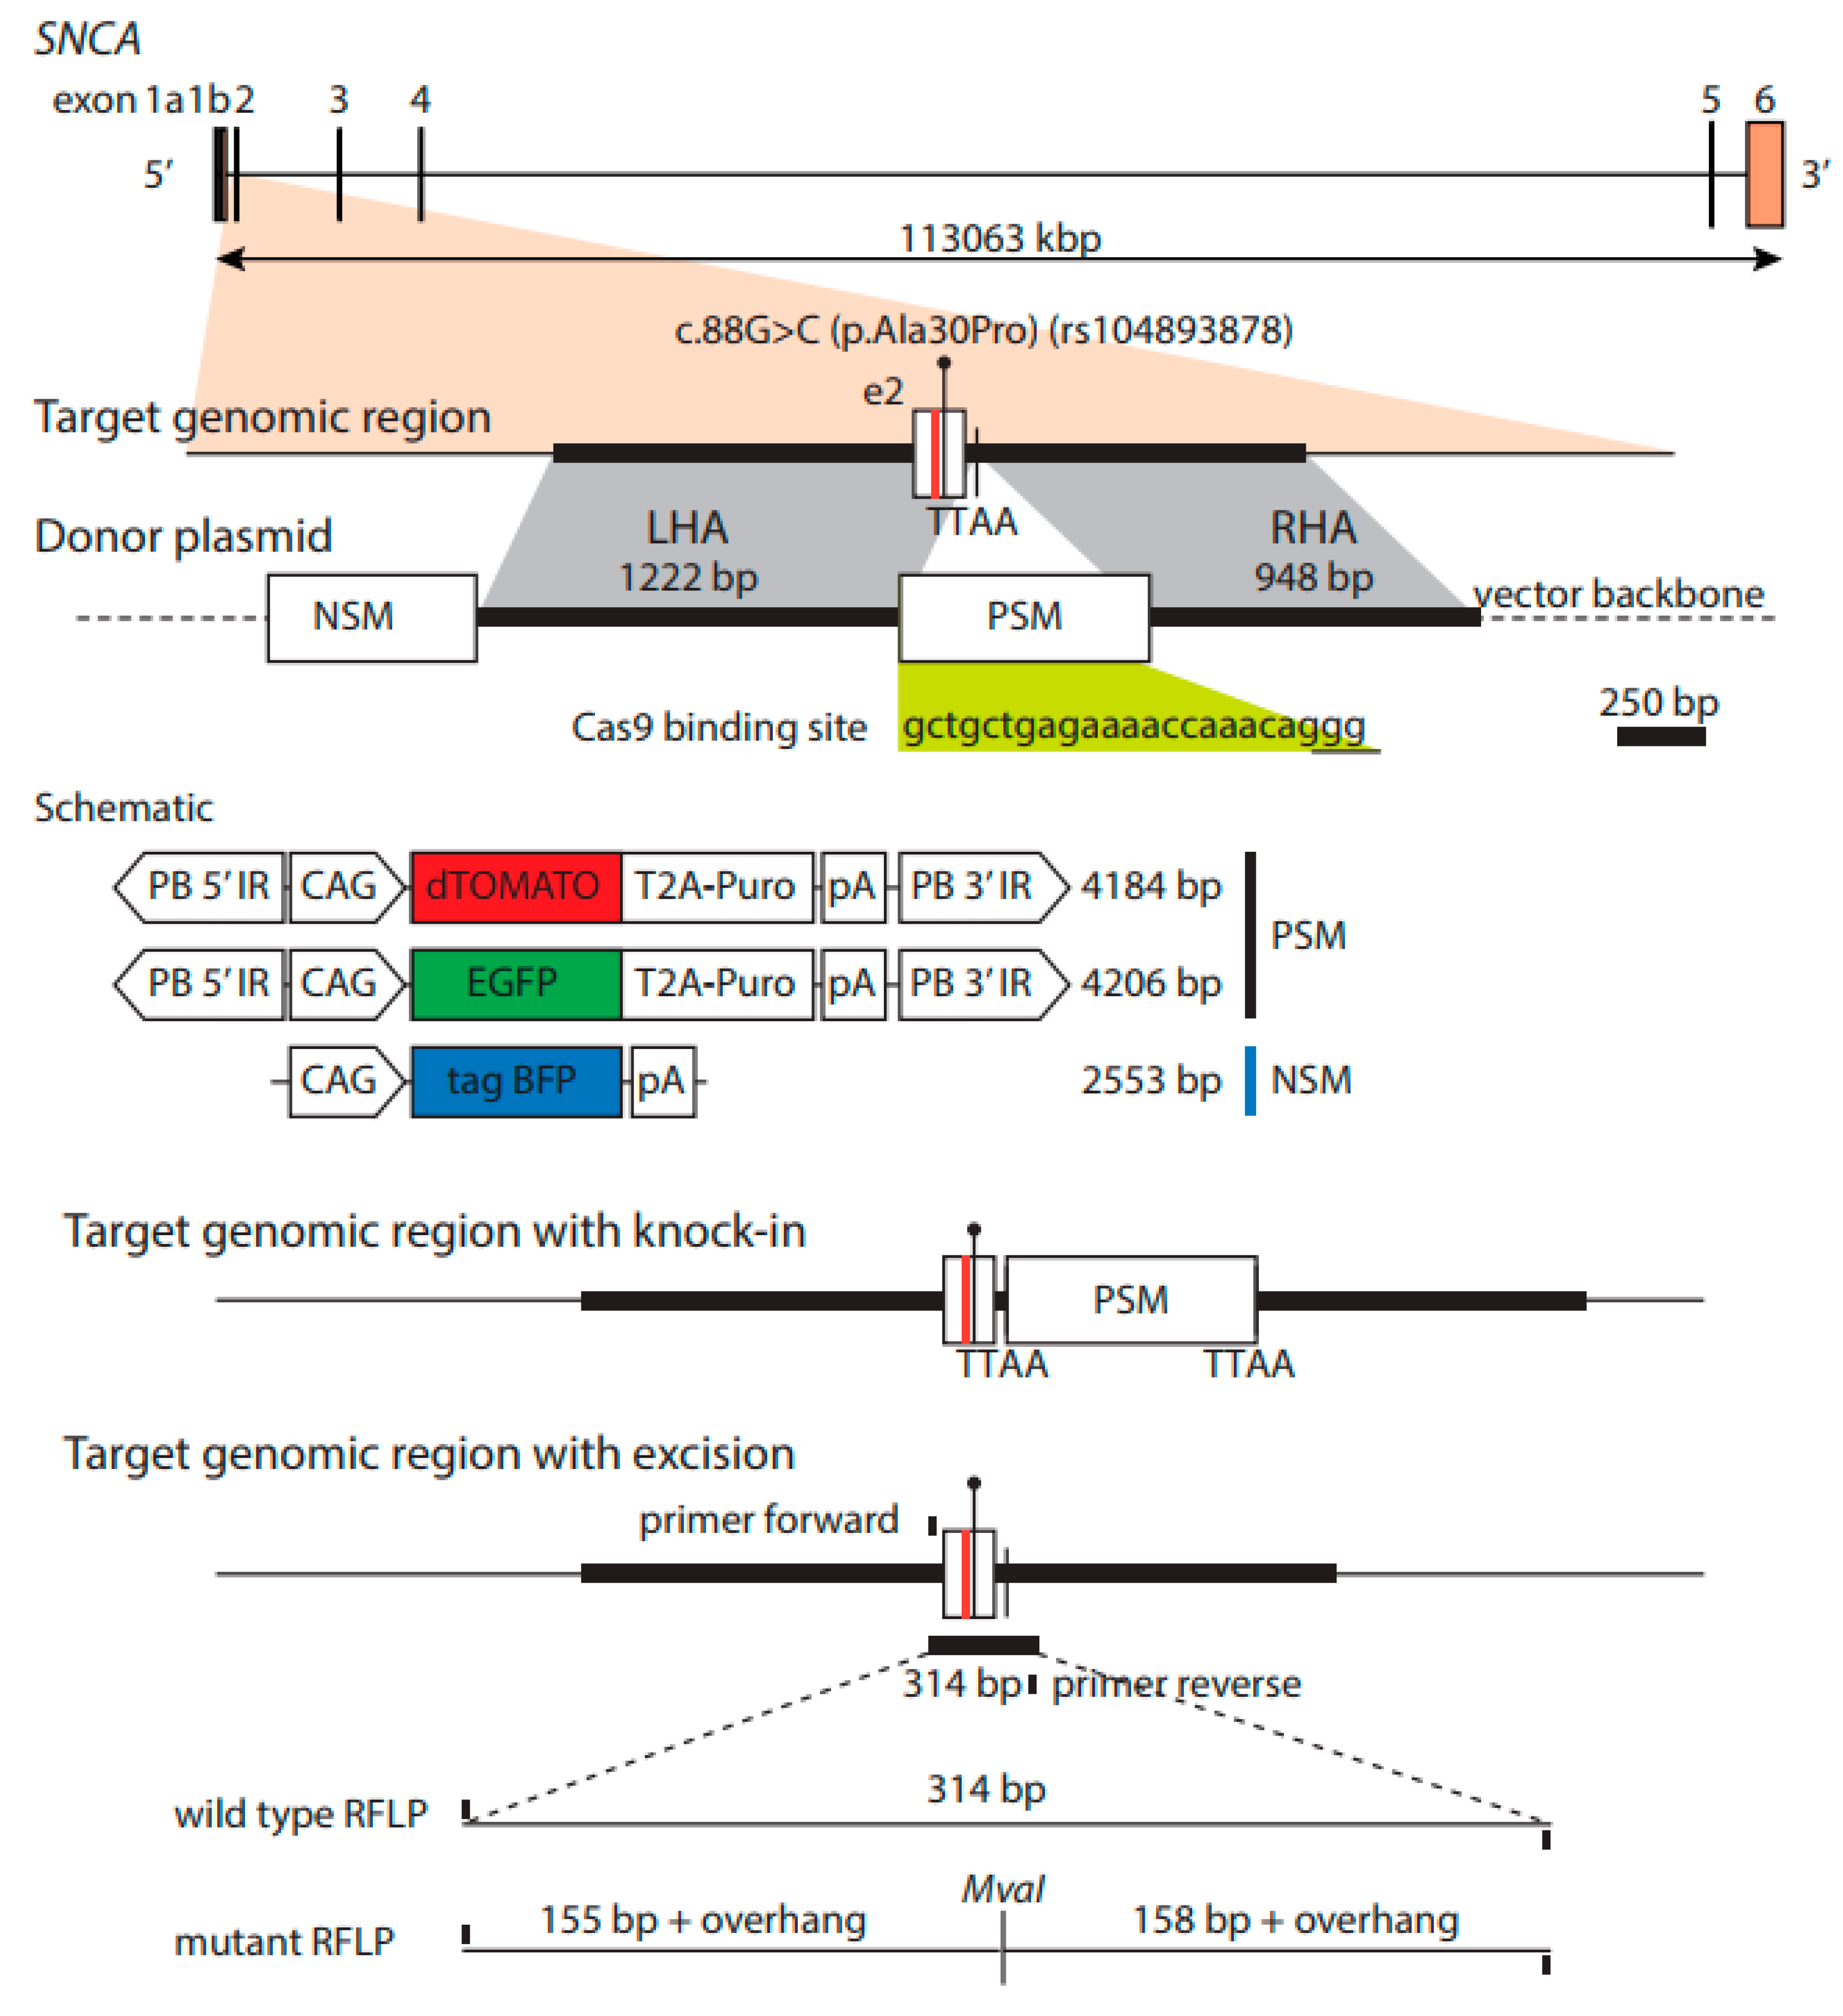
2.4. Generation of Isogenic Cell Lines—Sorting Single-Cell iPSCs
2.5. Generation of Isogenic Cell Lines—Expansion of the Single-Cell Clones
2.6. PCR Restriction Digest Mediated Clonal Selection
2.7. Transposase-Mediated Generation of Footprint-Free Isogenic Cell Lines
2.8. Trilineage Directed Differentiation
2.9. Neuronal Differentiation
2.10. Immunocytochemistry
2.11. Flow Cytometry
2.12. Protein Immunoblotting
2.13. RT-qPCR
2.14. Chromosomal Analysis
2.15. Computer Code, Software and Licensing
3. Results
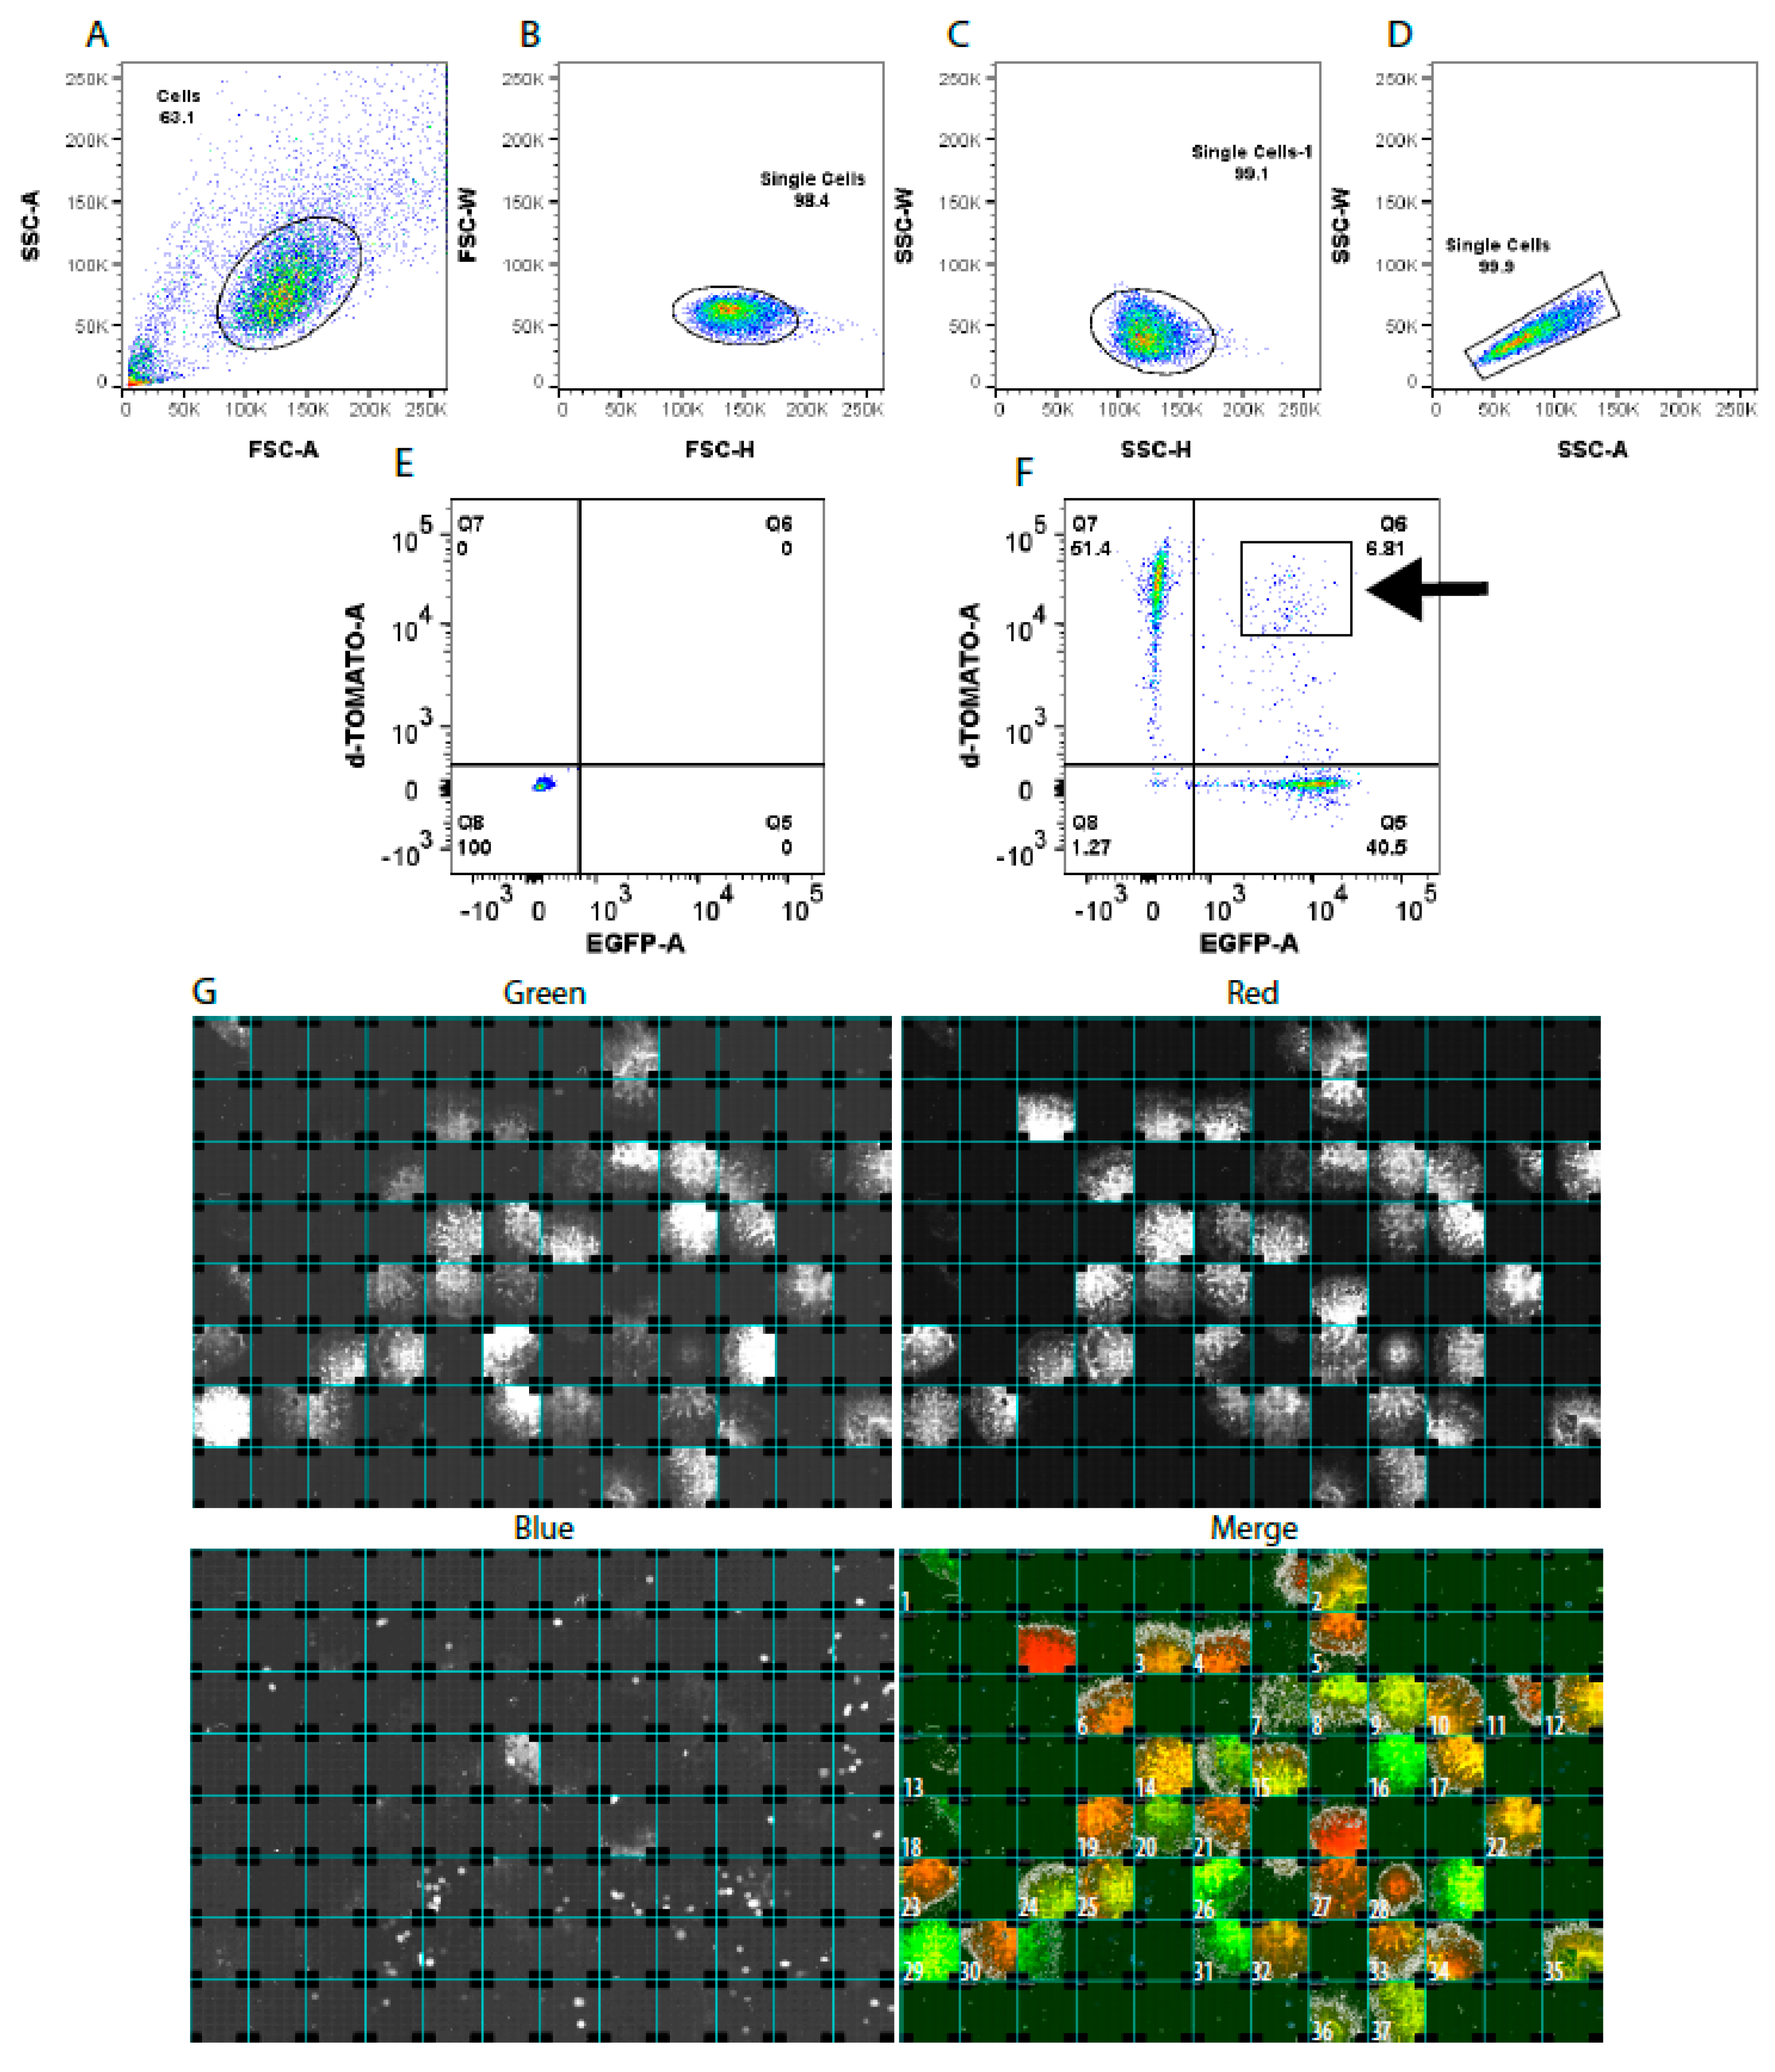
3.1. Single-Cell Sorting of Gene-Edited iPSC Clones
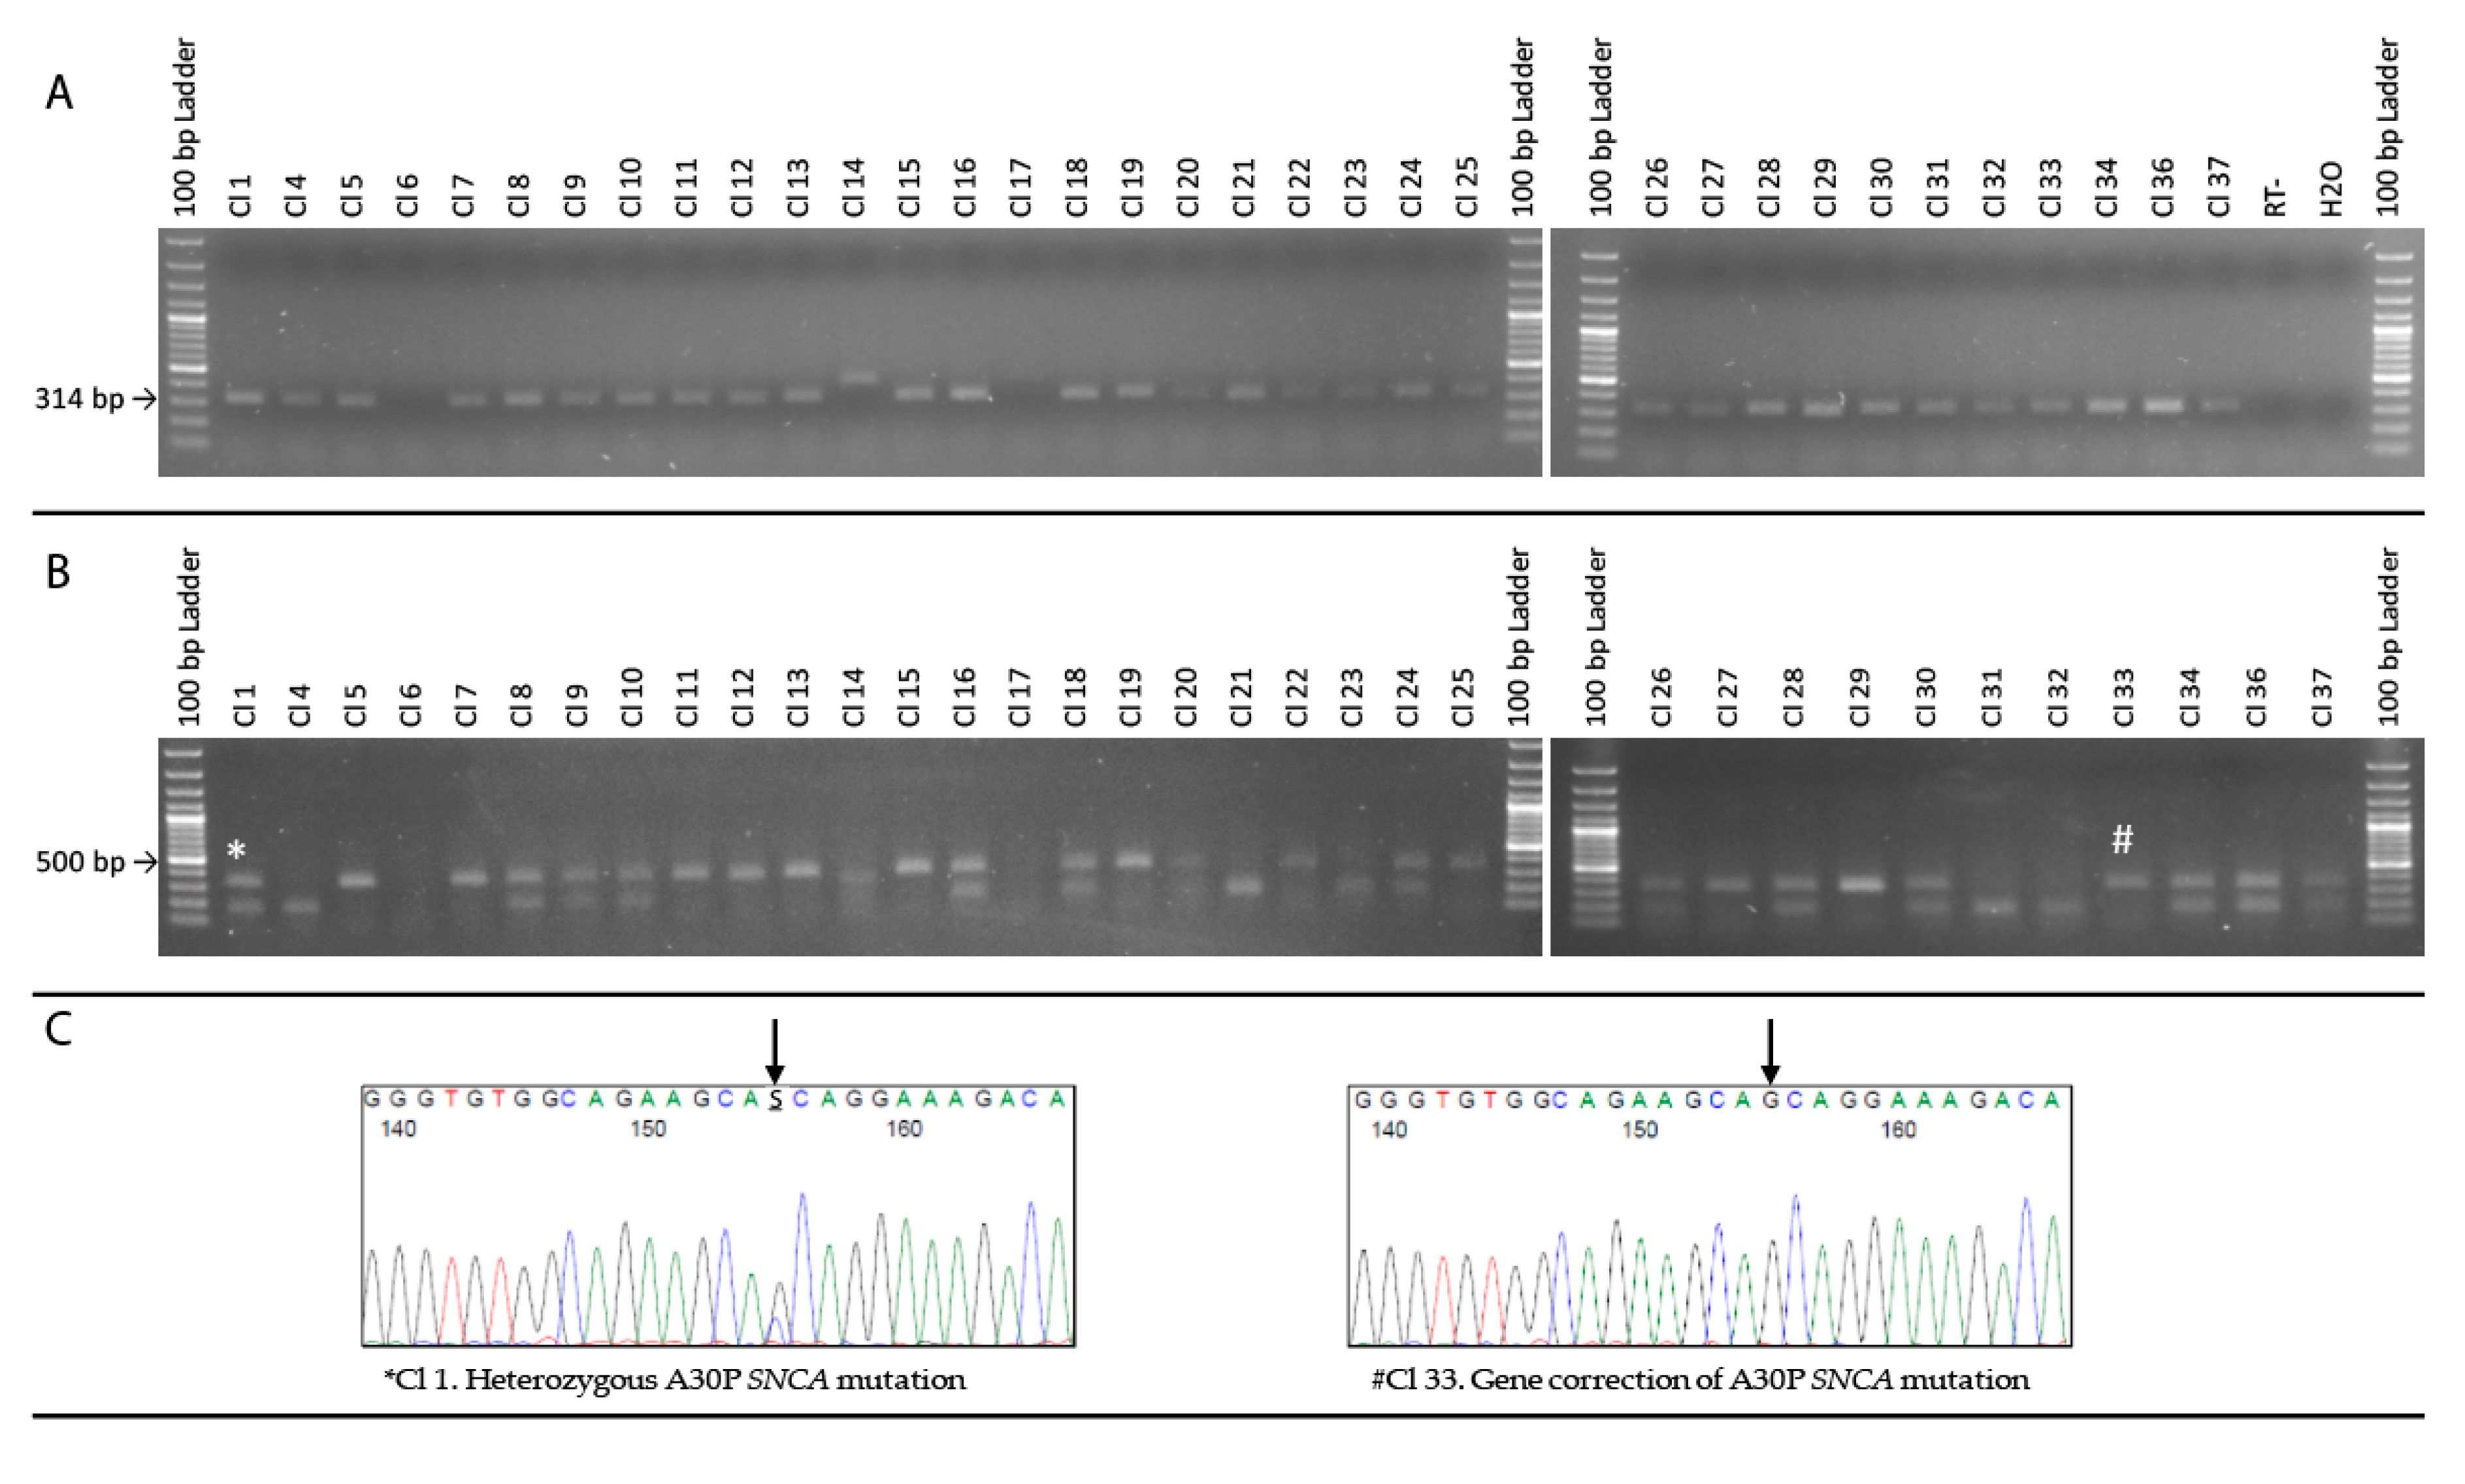
3.2. Restriction-Digest Mediated Selection of Single-Cell Lines
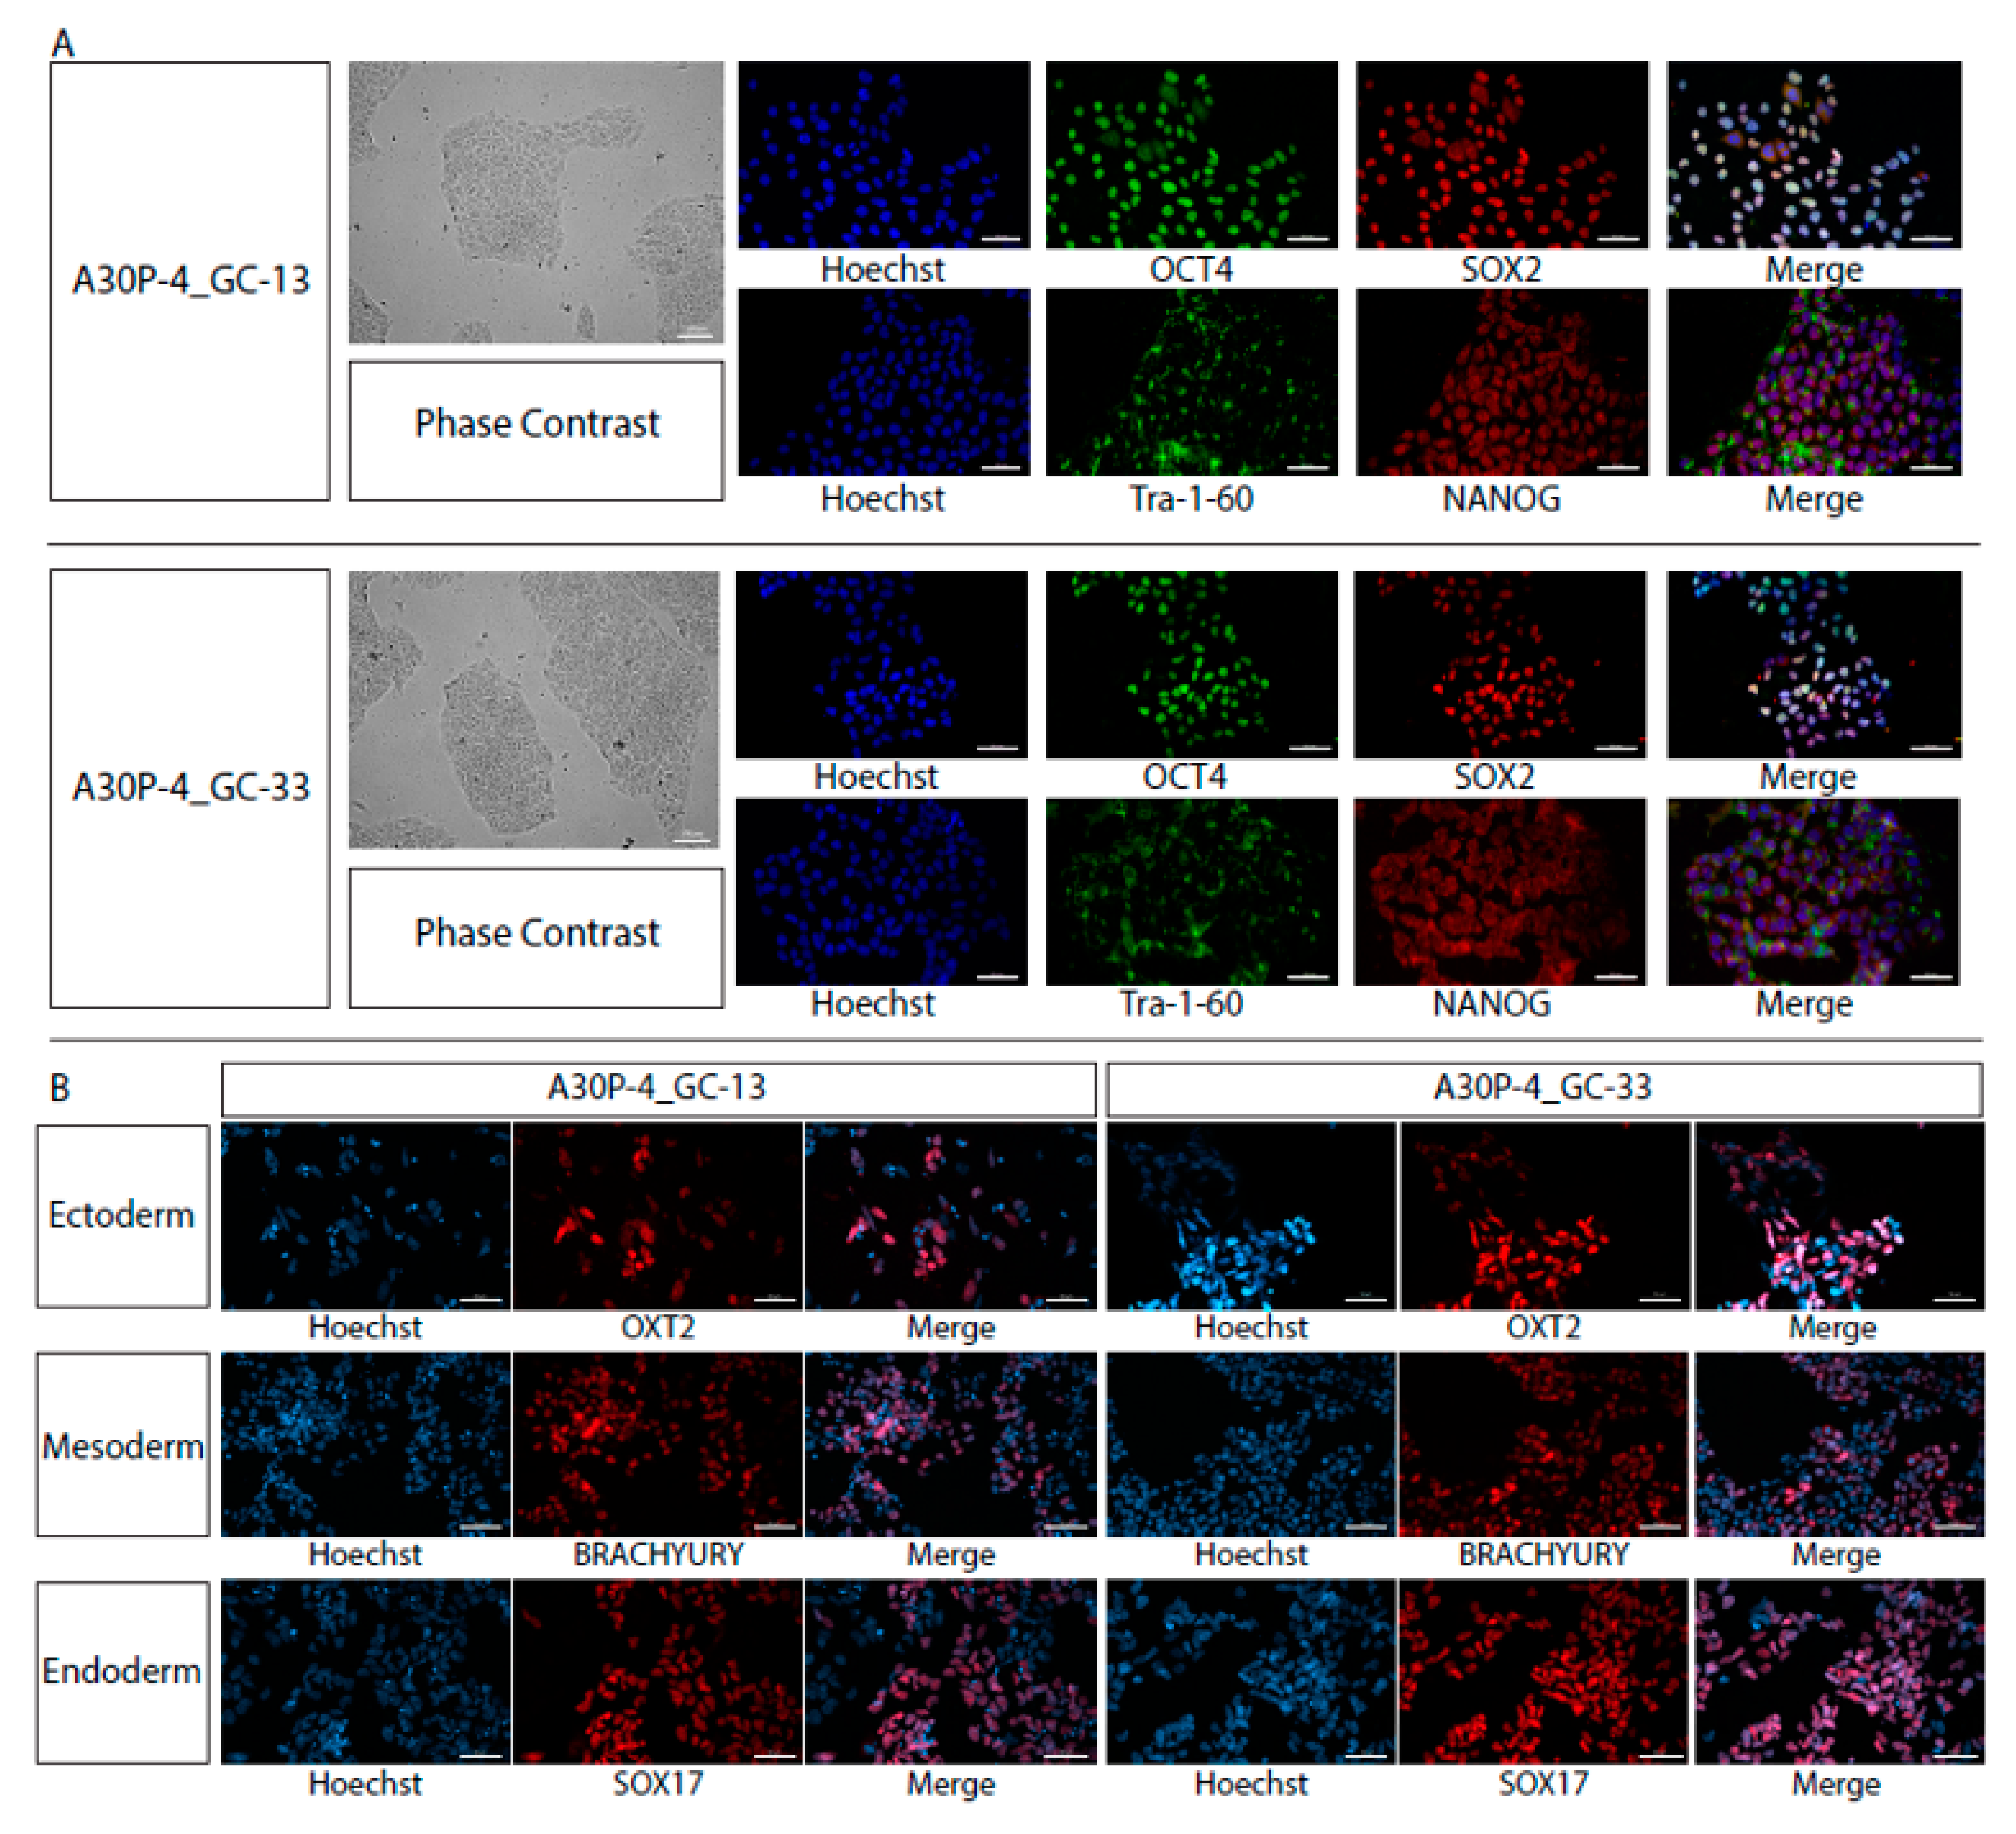
3.3. Characterization of Single Cell Clones
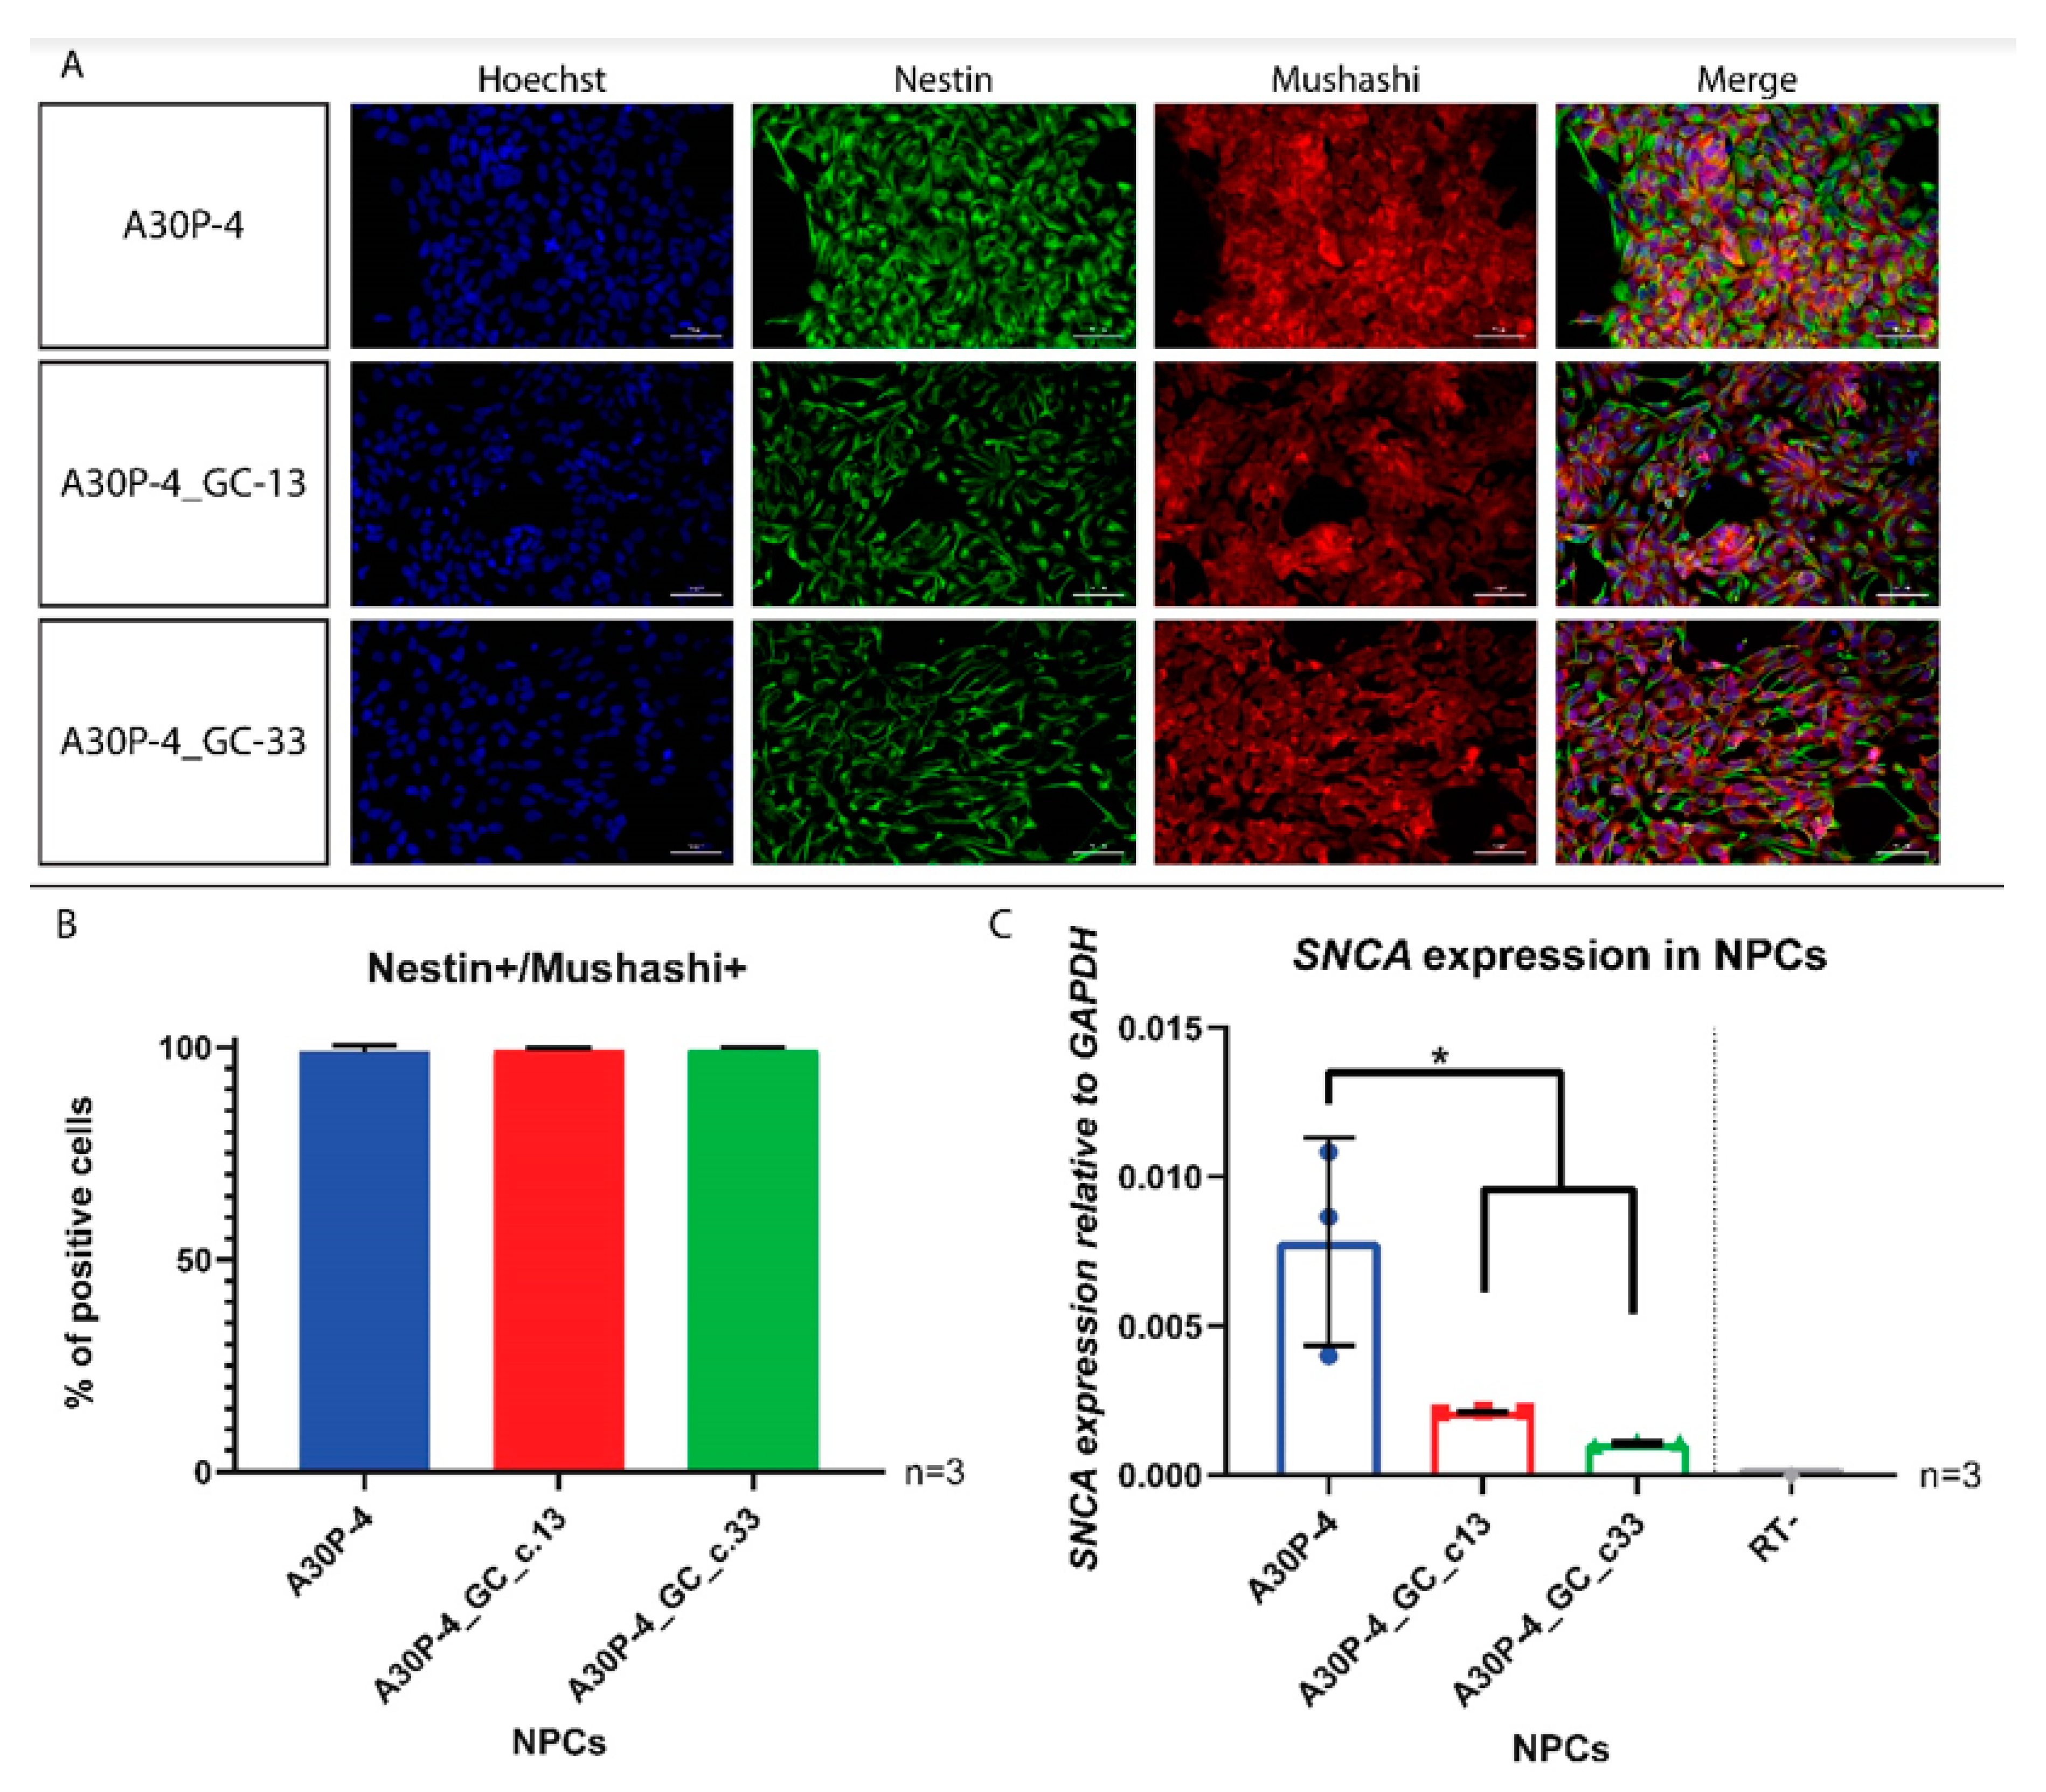
3.4. Generation and Characterization of Neural Precursor Cells Reveals Reduced SNCA Expression in the Gene-Corrected Control NPCs
3.5. Directed Differentiation and Characterization of Midbrain Dopaminergic Neurons Reveals Reduced SNCA Expression and Alpha-Synuclein Level in the Gene-Corrected Control Neurons
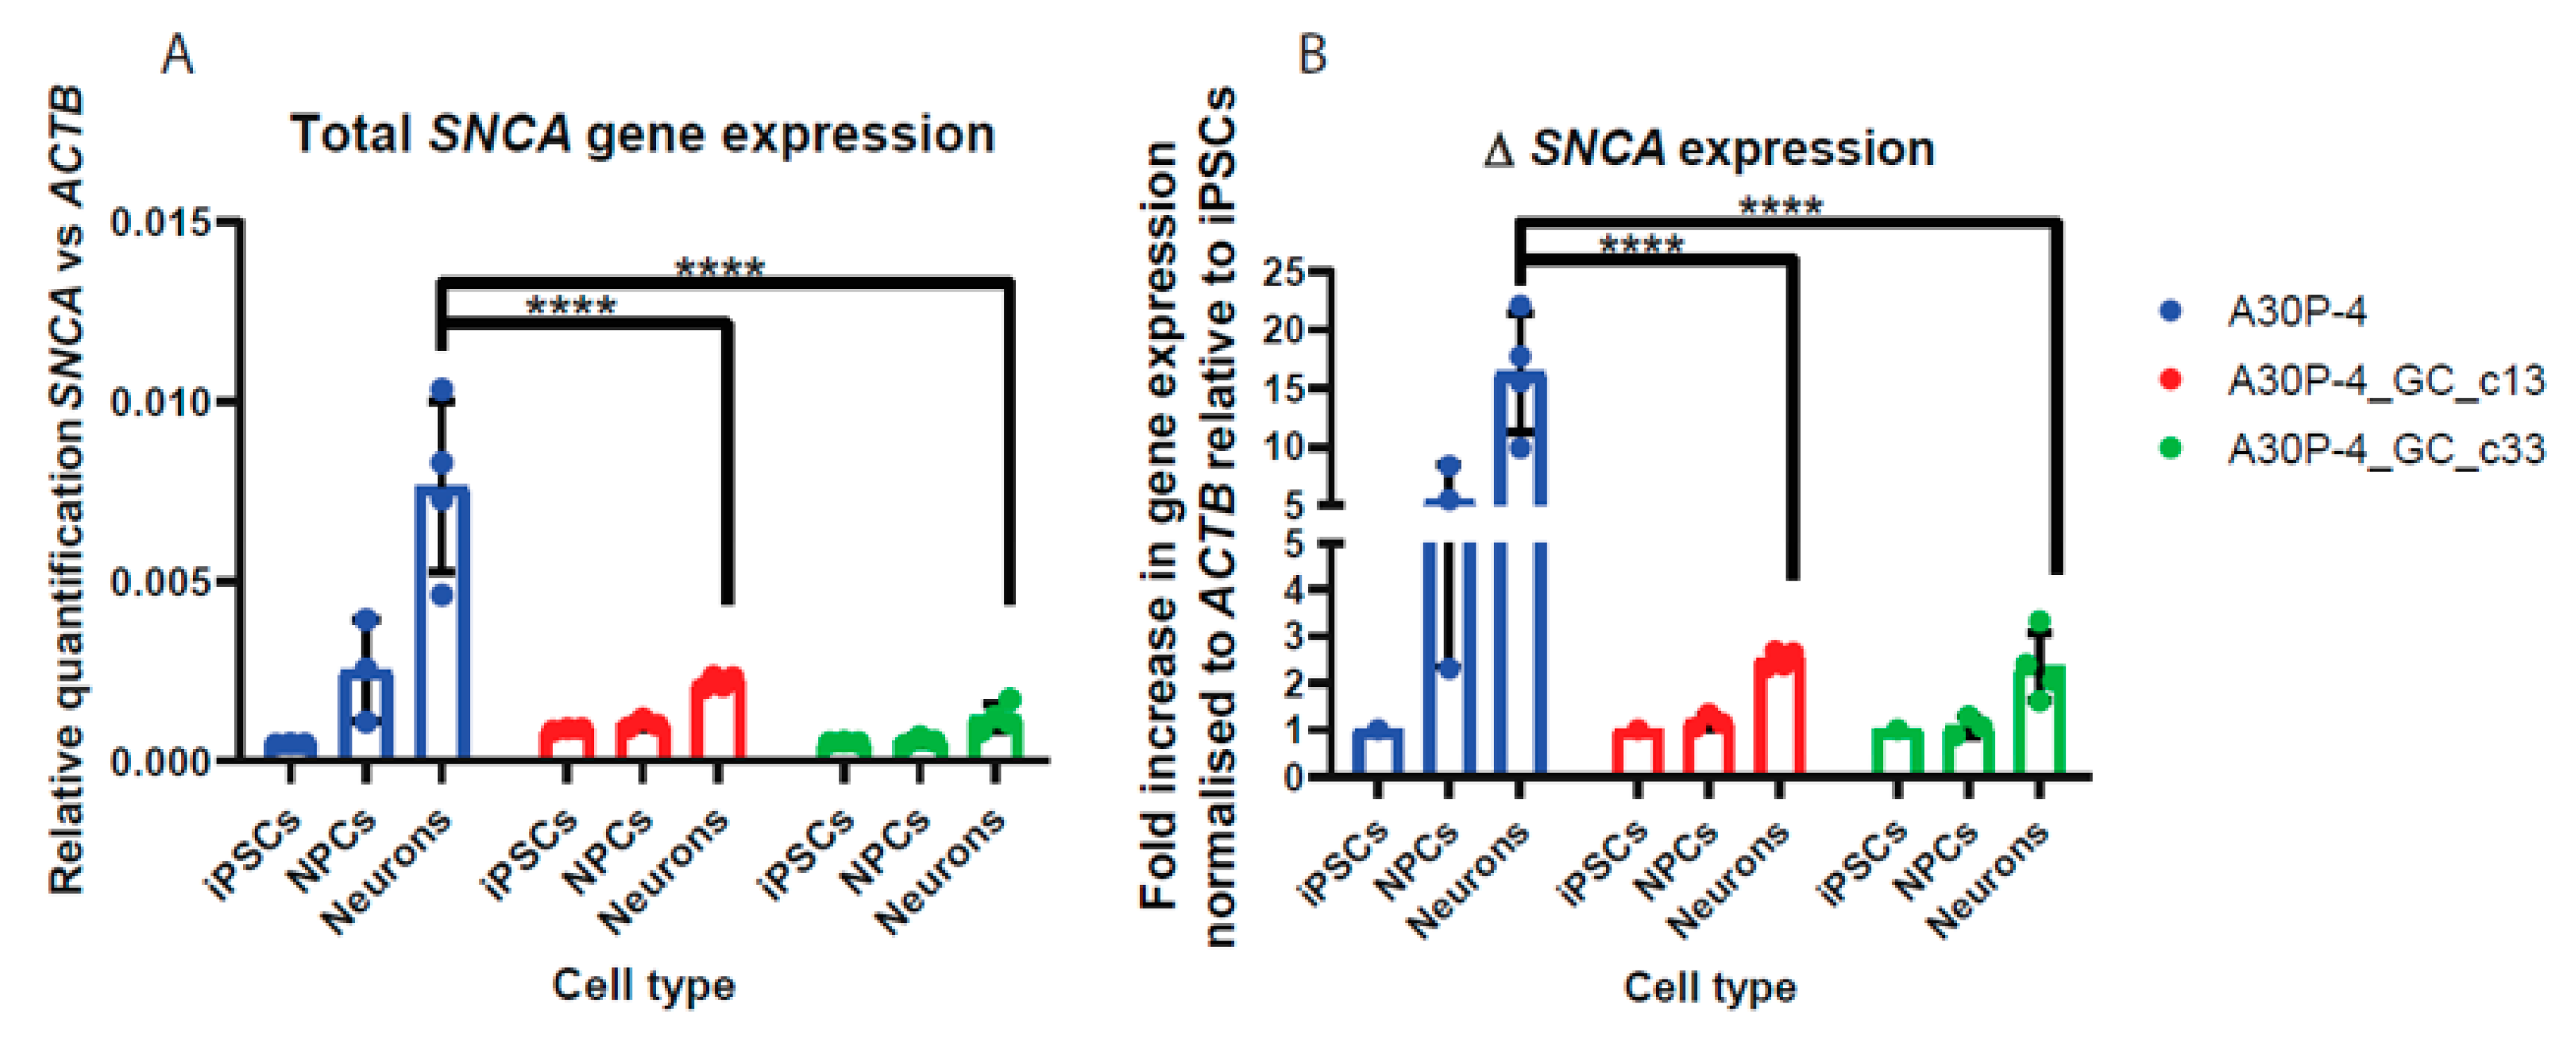
3.6. Relative Quantification across Cell Types Reveal Reduced SNCA Gene Expression in the Gene-Corrected Controls
4. Discussion
5. Conclusions
Supplementary Materials
Author Contributions
Funding
Acknowledgments
Conflicts of Interest
References
- Dorsey, E.R.; Elbaz, A.; Nichols, E.; Abd-Allah, F.; Abdelalim, A.; Adsuar, J.C.; Ansha, M.G.; Brayne, C.; Choi, J.Y.J.; Collado-Mateo, D.; et al. Global, regional, and national burden of Parkinson’s disease, 1990–2016: A systematic analysis for the Global Burden of Disease Study 2016. Lancet Neurol. 2018, 17, 939–953. [Google Scholar] [CrossRef] [Green Version]
- Spillantini, M.G.; Crowther, R.A.; Jakes, R.; Hasegawa, M.; Goedert, M. α-Synuclein in filamentous inclusions of Lewy bodies from Parkinson’s disease and dementia with Lewy bodies. Proc. Natl. Acad. Sci. USA 1998, 95, 6469–6473. [Google Scholar] [CrossRef] [PubMed] [Green Version]
- Polymeropoulos, M.H. Mutation in the α-Synuclein Gene Identified in Families with Parkinson’s Disease. Science 1997, 276, 2045–2047. [Google Scholar] [CrossRef] [PubMed] [Green Version]
- Krüger, R.; Kuhn, W.; Müller, T.; Woitalla, D.; Graeber, M.; Kösel, S.; Przuntek, H.; Epplen, J.T.; Schöls, L.; Riess, O. Ala30Pro mutation in the gene encoding alpha-synuclein in Parkinson’s disease. Nat. Genet. 1998, 18, 106–108. [Google Scholar] [CrossRef] [PubMed]
- Zarranz, J.J.; Alegre, J.; Gómez-Esteban, J.C.; Lezcano, E.; Ros, R.; Ampuero, I.; Vidal, L.; Hoenicka, J.; Rodriguez, O.; Atarés, B.; et al. The new mutation, E46K, of α-synuclein causes Parkinson and Lewy body dementia. Ann. Neurol. 2003, 55, 164–173. [Google Scholar] [CrossRef] [PubMed]
- Lesage, S.; Anheim, M.; Letournel, F.; Bousset, L.; Honoré, A.; Rozas, N.; Pieri, L.; Madiona, K.; Durr, A.; Melki, R.; et al. G51D α-synuclein mutation causes a novel Parkinsonian-pyramidal syndrome. Ann. Neurol. 2013, 73, 459–471. [Google Scholar] [CrossRef] [PubMed]
- Pasanen, P.; Myllykangas, L.; Siitonen, M.; Raunio, A.; Kaakkola, S.; Lyytinen, J.; Tienari, P.J.; Pöyhönen, M.; Paetau, A. A novel α-synuclein mutation A53E associated with atypical multiple system atrophy and Parkinson’s disease-type pathology. Neurobiol. Aging 2014, 35, 2180.e1–2180.e5. [Google Scholar] [CrossRef]
- Chartier-Harlin, M.C.; Kachergus, J.; Roumier, C.; Mouroux, V.; Douay, X.; Lincoln, S.; Levecque, C.; Larvor, L.; Andrieux, J.; Hulihan, M.; et al. Alpha-synuclein locus duplication as a cause of familial Parkinson’s disease. Lancet (Lond. Engl.) 2004, 364, 1167–1169. [Google Scholar] [CrossRef]
- Ibáñez, P.; Bonnet, A.-M.; Débarges, B.; Lohmann, E.; Tison, F.; Agid, Y.; Durr, A.; Brice, A.; Pollak, P. Causal relation between α-synuclein locus duplication as a cause of familial Parkinson’s disease. Lancet 2004, 364, 1169–1171. [Google Scholar] [CrossRef]
- Singleton, A.B. α-Synuclein Locus Triplication Causes Parkinson’s Disease. Science 2003, 302, 841. [Google Scholar] [CrossRef] [Green Version]
- Nishioka, K.; Ross, O.A.; Hattori, N. SNCA Gene Multiplication: A Model Mechanism of Parkinson Disease. Gene Duplic. 2011, 20. [Google Scholar] [CrossRef] [Green Version]
- Chiba-Falek, O.; Lopez, G.J.; Nussbaum, R.L. Levels of alpha-synuclein mRNA in sporadic Parkinson disease patients. Mov. Disord. 2006, 21, 1703–1708. [Google Scholar] [CrossRef] [PubMed]
- Campêlo, C.L.D.C.; Silva, R.H. Genetic Variants in SNCA and the Risk of Sporadic Parkinson’s Disease and Clinical Outcomes: A Review. Park. Dis. 2017, 2017, 1–11. [Google Scholar] [CrossRef] [PubMed]
- Edwards, T.L.; Scott, W.K.; Almonte, C.; Burt, A.; Powell, E.H.; Beecham, G.W.; Wang, L.; Züchner, S.; Konidari, I.; Wang, G.; et al. Genome-wide association study confirms SNPs in SNCA and the MAPT region as common risk factors for Parkinson disease. Ann. Hum. Genet. 2010, 74, 97–109. [Google Scholar] [CrossRef] [Green Version]
- Pihlstrøm, L.; Blauwendraat, C.; Cappelletti, C. A comprehensive analysis of SNCA-related genetic risk in sporadic parkinson disease. Ann. Neurol. 2018, 84, 117–129. [Google Scholar] [CrossRef] [PubMed]
- North American Brain Expression Consortium; Singleton, A.B.; Nalls, M.A.; Toft, M. A comprehensive analysis of SNCA-related genetic risk in sporadic parkinson disease. Ann. Neurol. 2018, 84, 117–129. [Google Scholar] [CrossRef]
- Mali, P.; Yang, L.; Esvelt, K.M.; Aach, J.; Güell, M.; Dicarlo, J.E.; Norville, J.E.; Church, G.M. RNA-Guided Human Genome Engineering via Cas9. Science 2013, 339, 823–826. [Google Scholar] [CrossRef] [Green Version]
- Ran, F.A.; Hsu, P.D.; Wright, J.; Agarwala, V.A.; Scott, D.; Zhang, F. Genome engineering using the CRISPR-Cas9 system. Nat. Protoc. 2013, 8, 2281–2308. [Google Scholar] [CrossRef] [Green Version]
- Grobarczyk, B.; Franco, B.; Hanon, K.; Malgrange, B. Generation of Isogenic Human iPS Cell Line Precisely Corrected by Genome Editing Using the CRISPR/Cas9 System. Stem Cell Rev. Rep. 2015, 11, 774–787. [Google Scholar] [CrossRef]
- Flynn, R.; Grundmann, A.; Renz, P.; Haenseler, W.; James, W.; Cowley, S.A.; Moore, M.D. CRISPR-mediated genotypic and phenotypic correction of a chronic granulomatous disease mutation in human iPS cells. Exp. Hematol. 2015, 43, 838–848.e3. [Google Scholar] [CrossRef] [Green Version]
- Arias-Fuenzalida, J.; Jarazo, J.; Qing, X.; Walter, J.; Gomez-Giro, G.; Nickels, S.L.; Zaehres, H.; Schöler, H.R.; Schwamborn, J.C. FACS-Assisted CRISPR-Cas9 Genome Editing Facilitates Parkinson’s Disease Modeling. Stem Cell Rep. 2017, 9, 1423–1431. [Google Scholar] [CrossRef] [PubMed] [Green Version]
- Gomez-Giro, G.; Arias-Fuenzalida, J.; Jarazo, J.; Zeuschner, D.; Ali, M.; Possemis, N.; Bolognin, S.; Halder, R.; Jäger, C.; Kuper, W.F.E.; et al. Synapse alterations precede neuronal damage and storage pathology in a human cerebral organoid model of CLN3-juvenile neuronal ceroid lipofuscinosis. Acta Neuropathol. Commun. 2019, 7, 1–19. [Google Scholar] [CrossRef] [PubMed] [Green Version]
- Hanss, Z.; Boussaad, I.; Jarazo, J.; Schwamborn, J.C.; Krüger, R. Quality Control Strategy for CRISPR-Cas9-Based Gene Editing Complicated by a Pseudogene. Front. Genet. 2020, 10. [Google Scholar] [CrossRef]
- Shalem, O.; Sanjana, N.E.; Hartenian, E.; Shi, X.; Scott, D.A.; Mikkelsen, T.S.; Heckl, D.; Ebert, B.L.; Root, D.E.; Doench, J.G.; et al. Genome-Scale CRISPR-Cas9 Knockout Screening in Human Cells. Science 2013, 343, 84–87. [Google Scholar] [CrossRef] [Green Version]
- Soldner, F.; Laganière, J.; Cheng, A.W.; Hockemeyer, D.; Gao, Q.; Alagappan, R.; Khurana, V.; Golbe, L.I.; Myers, R.H.; Lindquist, S.; et al. Generation of Isogenic Pluripotent Stem Cells Differing Exclusively at Two Early Onset Parkinson Point Mutations. Cell 2011, 146, 318–331. [Google Scholar] [CrossRef] [Green Version]
- Wang, G.; Yang, L.; Grishin, D.; Rios, X.; Ye, L.Y.; Hu, Y.; Li, K.; Zhang, D.; Church, G.M.; Pu, W.T. Efficient, footprint-free human iPSC genome editing by consolidation of Cas9/CRISPR and piggyBac technologies. Nat. Protoc. 2017, 12, 88–103. [Google Scholar] [CrossRef]
- Kruger, R.; Kuhn, W.; Leenders, K.; Sprengelmeyer, R.; Muller, T.; Woitalla, D.; Portman, A.; Maguire, R.; Veenma, L.; Schroder, U.; et al. Familial parkinsonism with synuclein pathology: Clinical and PET studies of A30P mutation carriers. Neurology 2001, 56, 1355–1362. [Google Scholar] [CrossRef]
- Barbuti, P.A.; Santos, B.F.; Dording, C.M.; Cruciani, G.; Massart, F.; Hummel, A.; Krüger, R. Generation of two iPS cell lines (HIHDNDi001-A and HIHDNDi001-B) from a Parkinson’s disease patient carrying the heterozygous p.A30P mutation in SNCA. Stem Cell Res. 2020, 48, 101951. [Google Scholar] [CrossRef]
- Chen, G.; Gulbranson, D.R.; Hou, Z.; Bolin, J.M.; Ruotti, V.; Probasco, M.D.; Smuga-Otto, K.; Howden, S.E.; Diol, N.R.; Propson, N.E.; et al. Chemically defined conditions for human iPSC derivation and culture. Nat. Methods 2011, 8, 424–429. [Google Scholar] [CrossRef] [Green Version]
- Reinhardt, P.; Glatza, M.; Hemmer, K.; Tsytsyura, Y.; Thiel, C.S.; Höing, S.; Moritz, S.; Parga, J.A.; Wagner, L.; Bruder, J.M.; et al. Derivation and Expansion Using Only Small Molecules of Human Neural Progenitors for Neurodegenerative Disease Modeling. PLoS ONE 2013, 8, e59252. [Google Scholar] [CrossRef]
- Crompton, L.A.; Byrne, M.L.; Taylor, H.; Kerrigan, T.L.; Bru-Mercier, G.; Badger, J.L.A.; Barbuti, P.; Jo, J.; Tyler, S.J.; Allen, S.; et al. Stepwise, non-adherent differentiation of human pluripotent stem cells to generate basal forebrain cholinergic neurons via hedgehog signaling. Stem Cell Res. 2013, 11, 1206–1221. [Google Scholar] [CrossRef] [Green Version]
- Schneider, C.A.; Rasband, W.S.; Eliceiri, K.W. NIH Image to ImageJ: 25 years of image analysis. Nat. Methods 2012, 9, 671–675. [Google Scholar] [CrossRef] [PubMed]
- Peiffer, D.A.; Le, J.M.; Steemers, F.J.; Chang, W.; Jenniges, T.; García, F.; Haden, K.; Li, J.; Shaw, C.A.; Belmont, J.W.; et al. High-resolution genomic profiling of chromosomal aberrations using Infinium whole-genome genotyping. Genome Res. 2006, 16, 1136–1148. [Google Scholar] [CrossRef] [PubMed] [Green Version]
- Li, X.; Burnight, E.R.; Cooney, A.L.; Malani, N.; Brady, T.; Sander, J.D.; Staber, J.; Wheelan, S.J.; Joung, J.K.; McCray, P.B.; et al. piggyBac transposase tools for genome engineering. Proc. Natl. Acad. Sci. USA 2013, 110, E2279–E2287. [Google Scholar] [CrossRef] [PubMed] [Green Version]
- Heilker, R.; Traub, S.; Reinhardt, P.; Schöler, H.R.; Sterneckert, J. iPS cell derived neuronal cells for drug discovery. Trends Pharmacol. Sci. 2014, 35, 510–519. [Google Scholar] [CrossRef] [PubMed]
- Abo-Rady, M.; Bellmann, J.; Glatza, M.; Marrone, L.; Reinhardt, L.; Tena, S.; Sterneckert, J. Phenotypic Screening Using Mouse and Human Stem Cell-Based Models of Neuroinflammation and Gene Expression Analysis to Study Drug Responses. Adv. Struct. Saf. Stud. 2018, 1888, 21–43. [Google Scholar] [CrossRef]
- Sgodda, M.; Cantz, T. Small but significant: Inter- and intrapatient variations in iPS cell-based disease modeling. Mol. Ther. 2013, 21, 5–7. [Google Scholar] [CrossRef] [Green Version]
- Thatava, T.; Kudva, Y.C.; Edukulla, R.; Squillace, K.; De Lamo, J.G.; Khan, Y.K.; Sakuma, T.; Ohmine, S.; Terzic, A.; Ikeda, Y. Intrapatient Variations in Type 1 Diabetes-specific iPS Cell Differentiation Into Insulin-producing Cells. Mol. Ther. 2012, 21, 228–239. [Google Scholar] [CrossRef] [Green Version]
- Gantner, M.L.; Hazen, J.; Lo Sardo, V.; Eade, K.; Prins, M.; Westenskow, P.D.; Barnett, A.; Johnson, A.; Baldwin, K.; Friedlander, M. Implications for iPS-based disease modeling: Significant variability is observed in RPE cells differentiated from identical sources. Invest. Ophthalmol. Vis. Sci. 2016, 57, 60–61. [Google Scholar]
- Ryan, S.; Dolatabadi, N.; Chan, S.F.; Zhang, X.; Akhtar, M.W.; Parker, J.; Soldner, F.; Sunico, C.R.; Nagar, S.; Talantova, M.; et al. Isogenic Human iPSC Parkinson’s Model Shows Nitrosative Stress-Induced Dysfunction in MEF2-PGC1α Transcription. Cell 2013, 155, 1351–1364. [Google Scholar] [CrossRef] [Green Version]
- Heman-Ackah, S.M.; Manzano, R.; Hoozemans, J.J.M.; Scheper, W.; Flynn, R.; Haerty, W.; Cowley, S.A.; Bassett, A.; Wood, M. Alpha-synuclein induces the unfolded protein response in Parkinson’s disease SNCA triplication iPSC-derived neurons. Hum. Mol. Genet. 2017, 26, 4441–4450. [Google Scholar] [CrossRef] [PubMed] [Green Version]
- Peterson, S.E.; Loring, J.F. Genomic Instability in Pluripotent Stem Cells: Implications for Clinical Applications. J. Boil. Chem. 2013, 289, 4578–4584. [Google Scholar] [CrossRef] [PubMed] [Green Version]
- Bai, Q.; Ramirez, J.-M.; Becker, F.; Pantesco, V.; Lavabre-Bertrand, T.; Hovatta, O.; Lemaitre, J.-M.; Pellestor, F.; De Vos, J. Temporal Analysis of Genome Alterations Induced by Single-Cell Passaging in Human Embryonic Stem Cells. Stem Cells Dev. 2014, 24, 653–662. [Google Scholar] [CrossRef] [PubMed] [Green Version]
- Mayshar, Y.; Ben-David, U.; Lavon, N.; Biancotti, J.C.; Yakir, B.; Clark, A.T.; Plath, K.; Lowry, W.E.; Benvenisty, N. Identification and Classification of Chromosomal Aberrations in Human Induced Pluripotent Stem Cells. Cell Stem Cell 2010, 7, 521–531. [Google Scholar] [CrossRef] [PubMed] [Green Version]
- Pavlou, M.A.S.; Colombo, N.; Fuertes-Alvarez, S.; Nicklas, S.; Cano, L.G.; Marín, M.C.; Goncalves, J.; Schwamborn, J.C. Expression of the Parkinson’s Disease-Associated Gene Alpha-Synuclein is Regulated by the Neuronal Cell Fate Determinant TRIM32. Mol. Neurobiol. 2016, 54, 4257–4270. [Google Scholar] [CrossRef]
- Oliveira, L.M.; Falomir-Lockhart, L.J.; Botelho, M.G.; Lin, K.-H.; Wales, P.; Koch, J.C.; Gerhardt, E.; Taschenberger, H.; Outeiro, T.F.; Lingor, P.; et al. Elevated α-synuclein caused by SNCA gene triplication impairs neuronal differentiation and maturation in Parkinson’s patient-derived induced pluripotent stem cells. Cell Death Dis. 2015, 6, e1994. [Google Scholar] [CrossRef] [Green Version]
- Junn, E.; Mouradian, M.M. Human α-Synuclein over-expression increases intracellular reactive oxygen species levels and susceptibility to dopamine. Neurosci. Lett. 2002, 320, 146–150. [Google Scholar] [CrossRef]
- Flagmeier, P.; Meisl, G.; Vendruscolo, M.; Knowles, T.P.J.; Dobson, C.M.; Buell, A.K.; Galvagnion, C. Mutations associated with familial Parkinson’s disease alter the initiation and amplification steps of α-synuclein aggregation. Proc. Natl. Acad. Sci. USA 2016, 113, 10328–10333. [Google Scholar] [CrossRef] [Green Version]
- Meade, R.M.; Fairlie, D.P.; Mason, J.M. Alpha-synuclein structure and Parkinson’s disease—lessons and emerging principles. Mol. Neurodegener. 2019, 14, 29. [Google Scholar] [CrossRef] [Green Version]
- Li, W.; Lesuisse, C.; Xu, Y.; Troncoso, J.C.; Price, D.L.; Lee, M.K. Stabilization of α-Synuclein Protein with Aging and Familial Parkinson’s Disease-Linked A53T Mutation. J. Neurosci. 2004, 24, 7400–7409. [Google Scholar] [CrossRef] [Green Version]
- Kobayashi, H.; Krüger, R.; Markopoulou, K.; Wszolek, Z.; Chase, B.; Taka, H.; Mineki, R.; Murayama, K.; Riess, O.; Mizuno, Y.; et al. Haploinsufficiency at the α-synuclein gene underlies phenotypic severity in familial Parkinson’s disease. Brain 2003, 126, 32–42. [Google Scholar] [CrossRef] [PubMed]
- Markopoulou, K.; Wszolek, Z.K.; Pfeiffer, R.F.; Chase, B.A. Reduced expression of the G209A α-synuclein allele in familial parkinsonism. Ann. Neurol. 1999, 46, 374–381. [Google Scholar] [CrossRef]
- Fuchs, J.; Tichopad, A.; Golub, Y.; Munz, M.; Schweitzer, K.J.; Wolf, B.; Berg, D.; Mueller, J.C.; Gasser, T. Genetic variability in the SNCA gene influences α-synuclein levels in the blood and brain. FASEB J. 2007, 22, 1327–1334. [Google Scholar] [CrossRef] [PubMed]


| Expanded Single Cell Clones 1 | PCR Test | Mva1 Test Digest | Sanger Sequencing | Construct Excision and Karyotyping |
|---|---|---|---|---|
| A30P-4 edited clone 1 | 314 bp | Digested: Double-band | Not Performed | |
| A30P-4 edited clone 4 | 314 bp | Digested: Lower bp product | Not Performed | |
| A30P-4 edited clone 5 | 314 bp | Undigested: 314 bp product | Isogenic: Gene-corrected p.A30P mutation | Chr 4: Deletion |
| A30P-4 edited clone 6 | No product | No product | Not Performed | |
| A30P-4 edited clone 7 | 314 bp | Undigested: 314 bp product | Not Performed | |
| A30P-4 edited clone 8 | 314 bp | Digested: Double-band | Not Performed | |
| A30P-4 edited clone 9 | 314 bp | Digested: Double-band | Not Performed | |
| A30P-4 edited clone 10 | 314 bp | Digested: Double-band | Not Performed | |
| A30P-4 edited clone 11 | 314 bp | Undigested: 314 bp product | Not Performed | |
| A30P-4 edited clone 12 | 314 bp | Undigested: 314 bp product | Not Performed | |
| A30P-4 edited clone 13 | 314 bp | Undigested: 314 bp product | Isogenic: Gene-corrected p.A30P mutation | Normal karyotype |
| A30P-4 edited clone 14 | 416 bp | Digested | 102 bp insertion error | |
| A30P-4 edited clone 15 | 314 bp | Undigested: 314 bp product | Not Performed | |
| A30P-4 edited clone 16 | 314 bp | Digested: Double-band | Not Performed | |
| A30P-4 edited clone 17 | No product | No product | 102 bp insertion error | |
| A30P-4 edited clone 18 | 314 bp | Digested: Double-band | Not Performed | |
| A30P-4 edited clone 19 | 314 bp | Undigested: 314 bp product | Isogenic: Gene-corrected p.A30P mutation | |
| A30P-4 edited clone 20 | 314 bp | Digested: Double-band | Not edited: Heterozygous p.A30P SNCA mutation | |
| A30P-4 edited clone 21 | 314 bp | Digested: Lower bp product | Not Performed | |
| A30P-4 edited clone 22 | 314 bp | Undigested: 314 bp product | Not Performed | |
| A30P-4 edited clone 23 | 314 bp | Digested: Lower bp product | Not Performed | |
| A30P-4 edited clone 24 | 314 bp | Digested: Double-band | Not Performed | |
| A30P-4 edited clone 25 | 314 bp | Undigested: 314 bp product | Not Performed | |
| A30P-4 edited clone 26 | 314 bp | Digested: Double-band | Not Performed | |
| A30P-4 edited clone 27 | 314 bp | Undigested: 314 bp product | Not Performed | |
| A30P-4 edited clone 28 | 314 bp | Digested: Double-band | Not Performed | |
| A30P-4 edited clone 29 | 314 bp | Undigested: 314 bp product | Isogenic: Gene-corrected p.A30P mutation | |
| A30P-4 edited clone 30 | 314 bp | Digested: Double-band | Not Performed | |
| A30P-4 edited clone 31 | 314 bp | Digested: Lower bp product | Not Performed | |
| A30P-4 edited clone 32 | 314 bp | Digested: Lower bp product | Not Performed | |
| A30P-4 edited clone 33 | 314 bp | Undigested: 314 bp product | Isogenic: Gene-corrected p.A30P mutation | Normal karyotype |
| A30P-4 edited clone 34 | 314 bp | Digested: Double-band | Not Performed | |
| A30P-4 edited clone 36 | 314 bp | Digested: Double-band | Not Performed | |
| A30P-4 edited clone 37 | 314 bp | Digested: Double-band | Not Performed |
| Sorted Single-Cell Clones 1 | Expanded Single-Cell Clones | PCR Amplification | Mva1 Undigested | Sequenced 2 | Normal Genotype 3 | |
|---|---|---|---|---|---|---|
| Absolute numbers | 37/192 | 34/37 | 31/34 | 12/34 | 5/5 | 2/3 |
| Efficiency | 19.27% | 91.89% | 91.18% | 35.30% | 100% | 66.67% |
© 2020 by the authors. Licensee MDPI, Basel, Switzerland. This article is an open access article distributed under the terms and conditions of the Creative Commons Attribution (CC BY) license (http://creativecommons.org/licenses/by/4.0/).
Share and Cite
Barbuti, P.; Antony, P.; Santos, B.; Massart, F.; Cruciani, G.; Dording, C.; Arias, J.; Schwamborn, J.; Krüger, R. Using High-Content Screening to Generate Single-Cell Gene-Corrected Patient-Derived iPS Clones Reveals Excess Alpha-Synuclein with Familial Parkinson’s Disease Point Mutation A30P. Cells 2020, 9, 2065. https://doi.org/10.3390/cells9092065
Barbuti P, Antony P, Santos B, Massart F, Cruciani G, Dording C, Arias J, Schwamborn J, Krüger R. Using High-Content Screening to Generate Single-Cell Gene-Corrected Patient-Derived iPS Clones Reveals Excess Alpha-Synuclein with Familial Parkinson’s Disease Point Mutation A30P. Cells. 2020; 9(9):2065. https://doi.org/10.3390/cells9092065
Chicago/Turabian StyleBarbuti, Peter, Paul Antony, Bruno Santos, François Massart, Gérald Cruciani, Claire Dording, Jonathan Arias, Jens Schwamborn, and Rejko Krüger. 2020. "Using High-Content Screening to Generate Single-Cell Gene-Corrected Patient-Derived iPS Clones Reveals Excess Alpha-Synuclein with Familial Parkinson’s Disease Point Mutation A30P" Cells 9, no. 9: 2065. https://doi.org/10.3390/cells9092065