Article

Qualifying Osteogenic Potency Assay Metrics for Human Multipotent Stromal Cells: TGF-β2 a Telling Eligible Biomarker

1
Faculty of Medical Engineering, University Politehnica of Bucharest, Gh Polizu 1-7, 011061 Bucharest, Romania
2
Faculty of Applied Chemistry and Materials Science, University Politehnica of Bucharest, Gh Polizu 1-7, 011061 Bucharest, Romania
3
“Aurel Ardelean” Institute of Life Sciences, Vasile Goldis Western University of Arad, 86 Rebreanu, 310414 Arad, Romania
4
Department of Life Sciences and Biotechnology, University of Ferrara, 44121 Ferrara, Italy
*
Authors to whom correspondence should be addressed.
Cells 2020, 9(12), 2559; https://doi.org/10.3390/cells9122559
Submission received: 27 October 2020 / Revised: 18 November 2020 / Accepted: 24 November 2020 / Published: 29 November 2020
(This article belongs to the Collection Stem Cells in Tissue Engineering and Regeneration)

Abstract

:
Potency assays are critical for regenerative medicine, addressing the known challenge of functional heterogeneity among human multipotent stromal cells (hMSC). Necessary laboratory cell expansion allows analysis before implantation in the patient. Levels of induction of five signature gene biomarkers, ALPL, COL1A2, DCN, ELN and RUNX2, constituted a previously reported proof-of-principle osteogenic potency assay. We tested assay modification to enhance reproducibility using six consistent bone marrow derived hBM-MSC and explored applicability to three adipose tissue derived hAT-MSC. Using a potent proprietary osteogenic induction factor, the GUSB/YWAHZ reference gene pair provided real time PCR consistency. The novel assay conditions supported the concept that genes encoding extracellular matrix proteins one week after osteogenic induction were informative. Nonetheless, relatively low induction of COL1A2 and ELN encouraged search for additional biomarkers. TGFB2 mRNA induction, important for osteogenic commitment, was readily quantifiable in both hBM-MSC and hAT-MSC. Combined with DCN, TGFB2 mRNA induction data provided discriminatory power for resolving donor-specific heterogeneity. Histomorphometric decorin and TGF-β2 protein expression patterns in eight-week heterotopic bone implants also discriminated the two non-bone-forming hMSC. We highlight progress towards prompt osteogenic potency assays, needed by current clinical trials to accelerate improved intervention with enhanced stem cell therapy for serious bone fractures.

Graphical Abstract

1. Introduction

Seeking to ameliorate an enormous healthcare burden from bone morbidities through tissue engineering [1], use of autologous culture-expanded osteoprogenitor cells grown on porous bioceramic scaffolds could substantially improve the repair of large defects in long bones [2]. This approach has been supported by positive outcomes from early stage clinical trials [3] including use of bone marrow derived human Multipotent Stromal Cells (hMSC) as advanced therapy medicinal products (ATMP) for non-union bone fractures [4]. Nonetheless, donor-related hMSC heterogeneity [5] can hinder therapeutic efficacy [6] and a consensus view recommends rigorous and thorough supportive protocols [7]. This is particularly relevant for a cell-based osteogenic potency assay to confirm appropriate biological activity of the specific therapeutic cells, a required release criterion before final marketing authorization of the patient treatment. International Conference on Harmonization guidelines (ICH 6QB) endorsed by the European Medical Agency (EMA) stipulated a quantitative measure of biological activity linked to the relevant biological properties based on the intended biological effect, ideally related to the clinical response [8].
An implemented timeline of 21 days for Good Manufacturing Practice (cGMP) cell expansion in the two-step protocol for osteogenic cell therapy [9] highlighted need for a prompt potency assay method to test biological function. Human MSC can be differentiated in vitro by supplementing a growth maintenance medium with osteogenic induction factors [10] that stimulate a chronological series of long-appreciated stepwise cellular changes: a reduced proliferation, extracellular matrix (ECM) maturation and subsequent mineralization [10,11,12]. Although extensively researched, the complex series of molecular mechanisms governing these differentiation pathway processes remain to be fully understood. Nonetheless, live monitoring of hMSC differentiation with mRNA-based probes revealed changes in the ratio of master transcription factors Runx2/Sox9 correlated with induction of osteogenic differentiation [13]. Stepwise changes in ECM are fundamental for bone formation [14] and ECM from early stages of osteogenic differentiation promoted in vitro osteogenic differentiation [15]. Cellular models comparing telomerized hBM-MSC subclones of contrasting heterotopic bone-forming capacity indicated that ECM biomarkers were important for prospective identification of bone formation [16].
Among several potency assay approaches [17], a survey of candidate early inducible biomarkers identified a set of five indicative “signature genes”—differentiation-induced expression of the transcription factor runt related transcription factor 2 (RUNX2) and of four genes encoding ECM proteins; tissue-nonspecific alkaline phosphatase (ALPL); collagen type I alpha 2 chain (COL1A2); decorin (DCN); and elastin (ELN)—that together provided a one-week osteogenic induction assay that clustered donor-specific primary cGMP cultures of hBM-MSC according to their bone-forming potential [18].
Progress in the material sciences favoring development of dedicated biosensors [19] has raised emphasis on standardization for robust and scalable potency assay conditions. Consequently, we qualified the above-mentioned signature gene potency assay, performing a cross-laboratory comparison using the same previously described bone marrow derived cGMP-hBM-MSC populations (Donors #1–#6) [16]. Given interest in enhancing bone formation using more readily sourced multipotent stromal cells derived from adipose tissue (AT) [20,21,22,23,24,25], we extended the study to also include three hAT-MSC populations (Donors #7–#9) grown under the same cGMP culture conditions.
Potency assay standardization may be improved through careful choice of suitable polymerase chain reaction (PCR) normalization reference genes [26] and use of effective scalable reagents for osteogenic induction. Thus, we tested reference genes for glucuronidase beta (GUSB) and the gene encoding 14-3-3 protein zeta/delta (YWAHZ), reported to be appropriate for hMSC differentiation-related gene expression [27] in comparison to the previously used actin beta (ACTB) [18]. A proprietary medium, specifically formulated for prompt hMSC differentiation [28,29], was a suitable induction reagent for a rapid osteogenic potency assay. Using the updated potency assay conditions of a qualified reference gene pair and potent osteogenic induction medium, we found the signature gene biomarkers segregated by having high (ALPL and DCN) or low (COL1A2, ELN, RUNX2) levels of induction. Since biomarkers induced by only low levels may prove problematic for biosensor development, we sought an additional biomarker.
A bioinformatic protein interaction network between the potency assay signature gene products and the transforming growth factor beta1 (TGF-β1) pathway [18] was consistent with the latter’s importance in fracture healing [30] and osteoblastic differentiation [31]. Recent studies of osteogenic or adipogenic differentiation have also implicated the transforming growth factor beta family member TGF-β 2 in hMSC osteogenic lineage commitment [32]. Thus, we examined the induction profile concerning the relatively less-studied TGF-β2 isoform as a novel signature gene candidate.
TGFB2 gene induction levels were similar to robust profiles for ALPL and DCN. Providing new qualities to the signature gene repertoire, the timing of TGFB2 induction was uniquely capable of distinguishing hBM-MSC from hAT-MSC. Our cross-laboratory osteogenic potency assay comparison highlighted the complex nature of hMSC, the usefulness of ECM biomarkers in early phases of osteogenic differentiation and introduced a novel signature gene candidate as a biomarker with broad implications for biosensor and ATMP development.

2. Materials and Methods

2.1. Cell Culture

Bone marrow derived human Multipotent Stromal Cell (hBM-MSC) populations, independently derived from six donors, designated #1 to #6, and adipose tissue derived human Multipotent Stromal Cell (hAT-MSC) populations derived from three donors, designated #7 to #9, were kindly provided by the University Hospital of Modena and Reggio Emilia (UNIMORE). Cell isolation using previously described methods for hBM-MSC from the iliac crest [33] or hAT-MSC from lipoaspirates [34] followed written informed consent from the donors within the EU FP7-Health REBORNE project, with ethics approval as published [4]. Our experimental procedures were first approved by the Ethics and Academic Integrity Committee of University Politehnica of Bucharest (Approval no. 22083/07.11.2017).
Thawed cryopreserved cells were seeded at 6 × 10³ cells/cm2 in T75 flasks (U-Shaped Canted Neck Cell Culture Flask with Vent Cap, Corning, NY, USA), with maintenance medium (MM), Alpha Modified Minimum Essential Medium Eagle (αMEM), (M4526, Sigma Aldrich, St. Louis, MO, USA), supplemented with 5% platelet lysate (PLTMax), (Human Platelet Lysate, SCM141, Sigma Aldrich), 1% Glutamax (Glutamax I, 200 mM, Thermo Fisher Scientific, Boston, MA, USA), 2 IU/mL Heparin Sodium Salt (H3149, Sigma Aldrich) and 10 μg/mL Ciprofloxacin (PHR1044, Sigma Aldrich). Cultures were maintained in humidified cell culture incubators (Steri-cycle i160, Thermo Fisher Scientific, Boston, MA, USA) at 37 °C, 5% CO2 with medium replenishment every 2–3 days. At 80% confluence, the cells were detached with TrypLE Express 1X (12563011, Gibco™, Invitrogen, Belgium) and counted using an automated cell counter, Scepter 2.0 (Merck, NJ, USA), with 60 μM sensors.
The calculus for the population doubling number (PD) was based on the formula:
P D = log 10 ( C / H ) / log 10 2 ,
where (C) is number of cells seeded and (H) is the number of cells harvested.
Cumulative population doubling (CPD) was calculated using the formula:
C P D = i = 1 n PD i ,
where (n) is the last passage number.

2.2. Induction of Ex Vivo Osteogenic Differentiation

Cells for total RNA extraction were seeded at a density of 3 × 10⁴/cm2 in T25 cell culture flasks (Rectangular Canted Neck Cell Culture Flask with Vent Cap, Corning, NY, USA), using standard MM. Upon reaching 80–90% confluence (usually 2–3 days), the medium was replaced with proprietary osteogenic medium (OM), (OsteoMAX-XF™, SCM121, Sigma Aldrich), supplemented with 4% PLTMax. The cultures were maintained for one and two weeks, renewing the medium every 2–3 days and extracted total RNA was used to generate the corresponding cDNA library.
For monitoring matrix mineralization, hMSC were seeded in 24-well flat bottom culture plates (Gibco™, Invitrogen, Belgium), at a density of 3 × 10⁴ cells/well, maintained in standard culture conditions for 24 h in MM, than the medium was replaced with OM supplemented with 4% PLTMax. Parallel control samples were cultured in MM. Confluent monolayers cultures in plates were fixed and stained with Alizarin Red S and Von Kossa at 7, 14 and 21 days post osteogenic induction, in order to assess the extent of matrix mineralization.

2.3. Matrix Mineralization Assays

Two methods, namely, Alizarin Red S (ALZ) for direct staining of calcium deposits [35] and Von Kossa (VK) for indirect staining of calcium phosphate [36], were used to determine the extent of ECM mineralization during osteoblastic differentiation. The biomineralization process was monitored at 7, 14 and 21 days in OM culture conditions. For ALZ stain, cells were washed with phosphate buffer saline (PBS), (PBS 1X, -Ca2+/-Mg2+, Gibco™, Invitrogen, Belgium), fixed with ice-cold 10% formalin (F-5554-4L, Sigma Aldrich) for 10 min at room temperature (RT), washed with ultrapure distilled water (Gibco™, Invitrogen, Belgium) and stained with 1.5%, pH 4.2 aqueous solution of Alizarin Red S (A5533, Sigma Aldrich) for 10 min. Stained wells were rinsed twice with ultrapure distilled water and completely dried in an air flow-hood, before sample visualization with an inverted phase contrast microscope (DMIL LED Fluo model with DFC450-C capture system, Leica, Germany). For quantification of total mineralization of the cell monolayer, the ALZ dye was eluted by adding 500 μL/well of hexadecylpyridinium chloride monohydrate 10% w/w (C9002, Sigma Aldrich). After 15 min, the eluted dye was quantified using an UV-Vis spectrophotometer, DeNovix DS-11 (DeNovix, Wilmington, DE, USA), at 562 nm.
VK staining was performed at the same experimental time points as ALZ. Cells were washed with PBS, fixed with 10% formalin for 10 min and rinsed with ultrapure distilled water. The plates were incubated for 30 min with 2.5% aqueous solution of silver nitrate (85193, Sigma Aldrich) under UV light, rinsed twice with ultrapure water and treated for 10 min with 5% sodium thiosulfate and allowed to completely dry. The staining was evaluated by bright field optical microscopy, under 50× magnification.

2.4. RNA Extraction and Relative Quantification by Real-Time PCR

Total RNA extraction with TRIzol reagent was performed as described [37], for three time points; the moment of osteogenic induction (T1), after 7 days (T2) and 14 days (T3) of osteogenic induction. Total RNA was stored in TE buffer supplemented with 5 U/µL RNase inhibitor (EO0381, Thermo Fisher Scientific, Boston, MA, USA), under liquid nitrogen.
Single-stranded cDNA libraries for all hMSC, were obtained from 5–15 µg of total RNA for each sample, using a reverse transcription system (High-Capacity cDNA Reverse Transcription Kit, Applied Biosystems™, Waltham, MA, USA), according to manufacturer protocol. ARN and cDNA were quantified using a DeNovix NanoDrop spectrophotometer.
Gene expression levels of ALPL, COL1A2, DCN, RUNX2, ELN and TGFΒ2 were measured using SYBR™ Green (SYBR) with confirmation of the original five signature genes using a TaqMan™ (Taqman) approach, for an inter-assay estimation of reproductibility. Both methods were performed using a Real-Time Quantum Studio™ 5 PCR thermocycler from Applied Biosystems (Thermo Fisher Scientific, Boston, MA, USA).
SYBR Green reaction mix for real-time PCR amplification/detection used a ready-mix (PowerUp™ SYBR™ Green Master Mix, Applied Biosystems), with 30 ng/µL specific cDNA and 2µM of each specific set of primers (Integrated DNA Technologies IDT, Inc, Coralville, Iowa, USA) (Table 1). Cycling was done with the sequence 50 °C for 2 min, 95 °C for 10 min, 40 × (95 °C 2 min, 51 °C 20 s, 72 °C 13 s), ended by a standard dissociation protocol for checking the specificity of the amplifications.
The TaqMan used a commercial ready-mix (TaqMan Fast Advanced Master Mix, 4444557, Thermo Fisher Scientific, Boston, MA, USA) with 10 ng/µL cDNA and primers/probes (TaqMan Gene Expression Custom Assays, Thermo Fisher Scientific, Boston, MA, USA) (Table 2). The PCR cycling protocol was 50 °C 2 min, 95 °C 2 min for polymerase system activation, and 40 × (95 °C 15 s, 60 °C 60 s).
For both SYBR Green and TaqMan methods, we tested three reference genes (ACTB, GUSB and YWHAZ). The PCR amplification efficiency was assessed for each target and reference gene using the calibration dilution curve and slope calculation from an equivalent mass ratio mixture of all cDNA samples in the library. For both methods we performed two separate experimental set-ups with triplicate samples for each testing parameter (cell line and induction time). Measurements from triplicate determination for both methods were statistically significant (p < 0.05) and the final fold-increase value per gene was the average between two parallel experiments. The relative gene expression for each sample was normalized to each of the three endogenous references using the 2−ΔΔCt method and fold-increase for treated samples was calculated according to the Pfaffl algorithm [38].
The fold-increase gene expression for treated samples with a normalized function of two or three reference genes was calculated by determining the geometric average values for multiple internal control genes [39].

2.5. Median Absolute Dispersion (MAD) Analyses for Household Genes Selection

We used a Median Absolute Dispersion (MAD) analysis, in order to assess the best reference gene pair for the nine donor-specific hMSC populations. Deviation from the median for each possible combination of one to three candidate reference genes was calculated as the absolute value of differences between the gene fold-increase and median value of the dataset. For each reference gene combination, we analyzed the biomarker fold-increase gene induction values, comparing the original five signature genes with both SYBR Green and TaqMan methodology, and, subsequently, TGFB2 with the SYBR Green method. A median absolute deviation score for each data set was calculated for one and two weeks of osteoinduction. The favoured reference gene and reference gene pair were those producing the smallest average MAD values among the nine donor-specific hMSC populations.

2.6. Hierarchical Cluster Analysis

Inter-donor similarity according to biomarker gene expression patterns in hBM-MSC and hAT-MSC treated with OM was determined using open-source versatile matrix visualization and analysis software Morpheus (Morpheus, https://software.broadinstitute.org/morpheus). Cluster algorithms for continuous variables were determined using the Euclidian distance and single linkage algorithm. Euclidian distance was appropriate for continuous variables sharing the same scale, taking the magnitude of changes into account to more comprehensively assimilate the gene expression data. The means for none-treated samples were set to zero, since our gene expression values represented a fold-increase in mRNA levels above a reference state determined by the control samples.

2.7. In Vivo Heterotopic Bone Formation

Adult immunodefficient mice NOD.CB17-Prkdc scid/J were used for in vivo testing of osteogenic potency. Mice handling was carried out in accordance with the EU Directive 2010/63/EU and national legislation (Law no.43/2014). All experimental procedures were previously approved by the Ethics Committee for Research of Vasile Goldis Western University of Arad (Approval no. 131/12.13.2018). Animals were housed in individually vented cages, with ad libitum access to food/water, standard conditions of temperature/relative humidity and a light/dark cycle of 12/12 h.
The MBCP+® scaffold (Biomatlante, Vigneux de Bretagne, France), composed of a 20:80 ratio of hydroxyapatite (HA)/beta-tricalcium phosphate (β-TCP) by weight, was exposed for 2 h under UV light for sterilization. Serologic sterile syringes of 1 mL were cut at the apical part, filled with 70 mg of sterile material, and capped with sterile 1.5 mL centrifuge tubes. The scaffolds inside the syringes were washed twice using PBS (37 °C), for 10 min, followed by incubation at 37 °C, 5% CO2, with fresh PBS, overnight. The PBS was then replaced with MSCs suspension in αMEM. A total of 1.6 × 10⁶ hMSC from each donor were added in top of 40 mg (±5%, 40 granules) of 1–2 mm MBCP+®, granules. The syringes, loosely capped with inverted eppendorf tubes to allow gas exchange, were placed in the incubator in standard culture conditions for 24 h, then used for in vivo implantation. For the negative controls of each donor hMSCs, the scaffold was not seeded with cells and treated in the same conditions as positive samples. Visual inspection by inversed phase microscope of positive control samples of each donor-specific hMSC population showed adherent cells in the scaffolds.
The animals were anesthetized with ketamine/xylazine, and the dorsal skin of the mice was shaved and disinfected. Incisions of 1 cm were made in the upper and lower dorsal flank of each mouse. Blunt skin dissection formed a 3-cm-long pocket for subcutaneous graft implantation in the upper and lower dorsal flank of each mouse, as described [40].
Eight weeks after implantation, mice were euthanatized under anaesthesia and the explants were removed and collected for further histological analysis.

2.8. Histology and Immunohistochemistry

Ex vivo explants were fixed for 48 h in 4% paraformaldehyde, decalcified in 4% paraformaldehyde solution in PBS for one week, embedded in paraffin and cut in 5.0 μm thick sections. For morphological analysis of the new tissue, samples were stained with a Gomori’s trichrome kit (Leica Biosystems, Nussloch, Germany) to highlight collagen synthesis and osteoid deposition. Microscopic sections were analyzed with a BX43 microscope (Olympus Europa SE & Co, Hamburg, Germany).
Immunohistochemical staining was performed with recombinant rabbit monoclonal anti-mouse Runx-2 antibody (Abcam, ab192256, dilution 1:200), rabbit monoclonal anti-human osteopontin (Opn) (Abcam, ab63856, dilution 1:100), rabbit polyclonal anti-human TGF-β2 (Abcam, ab53778, dilution 1:100) and rabbit polyclonal anti-human decorin (DCN) IgG (Abcam, ab151988, dilution 1:200) primary antibodies. For visualization, Novocastra Peroxidase/DAB kit (Leica Biosystems, Nussloch, Germany) was utilized according to the manufacturers’ instructions.

3. Results

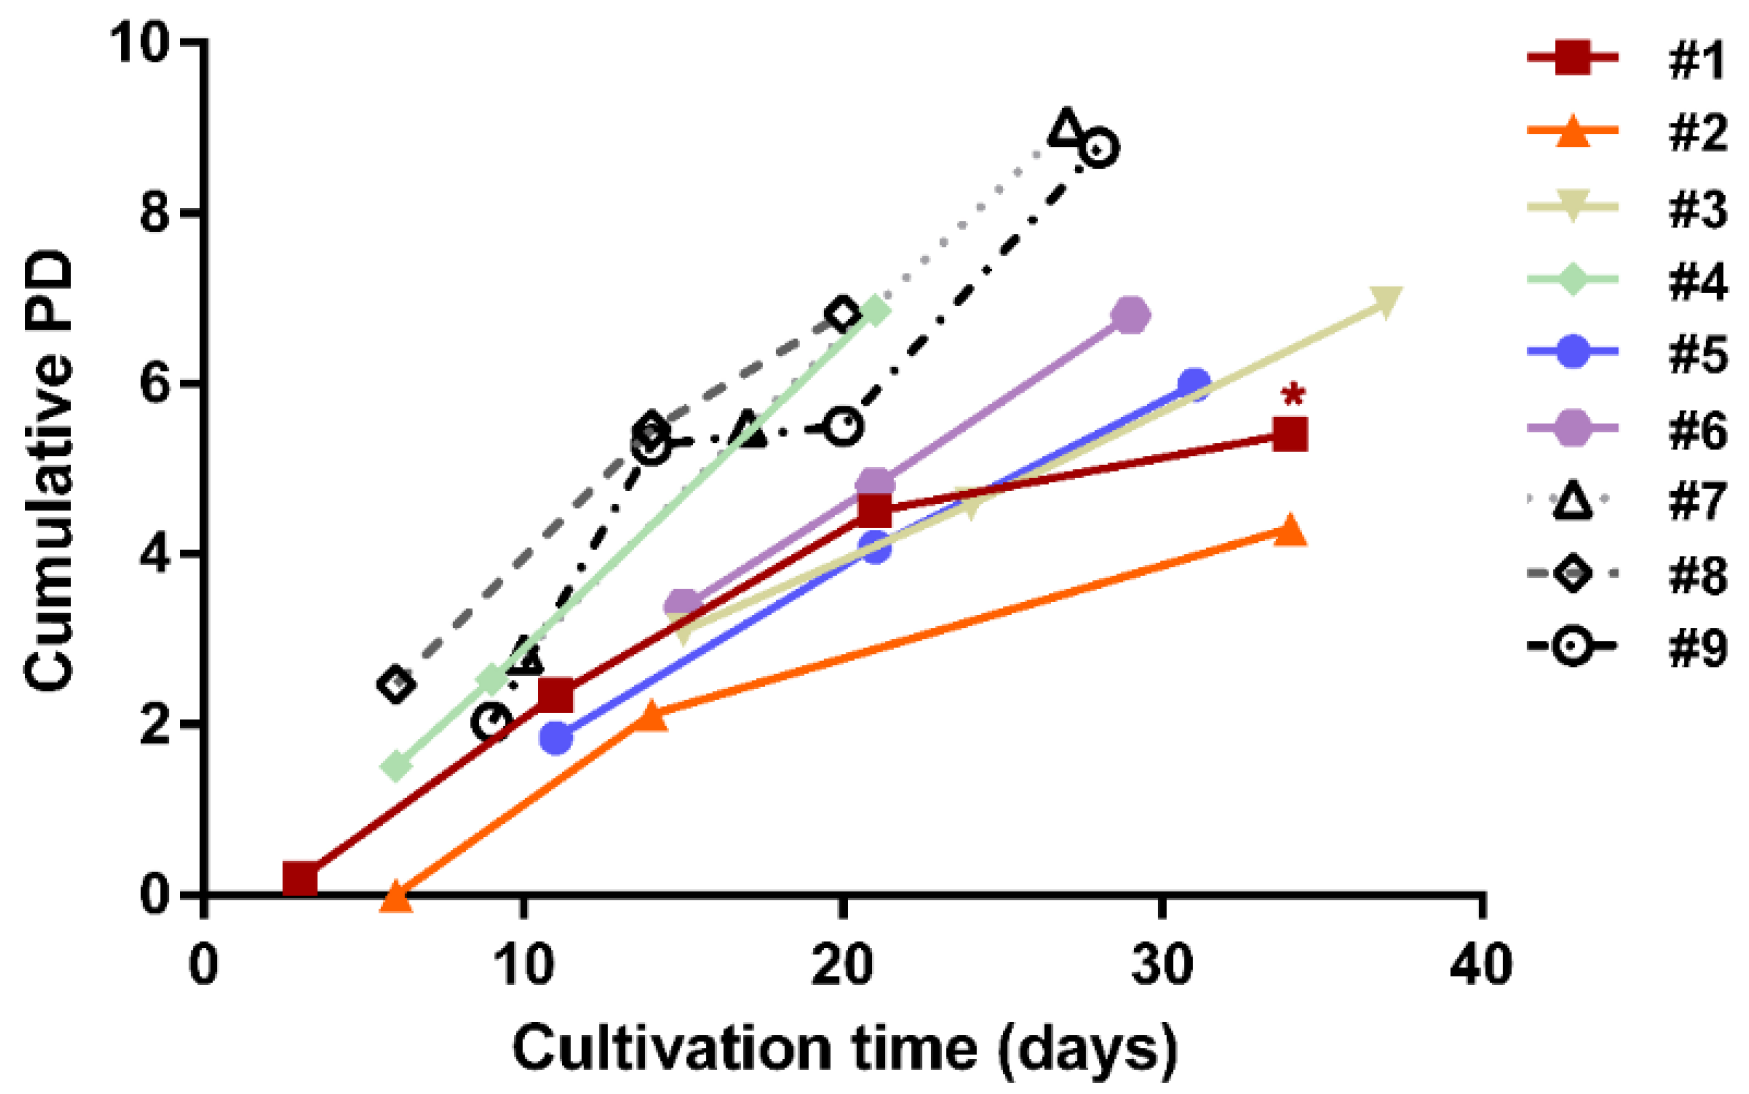
3.1. Establishment of hBM-MSC and hAT-MSC Expansion in Culture

hBM-MSC and hAT-MSC stored in cryotubes under liquid nitrogen at early passage (n), were carefully thawed from frozen vials and expanded in culture under cGMP-like growth conditions similar to corresponding protocols adopted for clinical trials (Figure 1A). Culture procedures for each donor-specific culture followed a specific protocol (Figure 1B) so that cells underwent only one freeze-thaw cycle and a near-equivalent number (n) of passage transfers (P) before concordant evaluation of in vitro osteogenic differentiation (P = n) or in vivo bone formation (P = n + 1). For all nine donor-specific hMSC populations, sufficient cells for experimentation were attained within 10 cumulative population doublings.
Given that a finite growth potential may impinge upon cell function, the growth rate was monitored for each donor-specific MSC population. For 8/10 donor-specific cultures, an exponential growth rate was maintained to the point of experimentation, with hAT-MSC from donors #7, #8, #9 showing doubling times of 3, 4.4 and 2.4 days, respectively (Figure 2).
Although the population doubling time for hBM-MSC from donor #2 slowed from an initial 2.1 days to 4.3 days, the cells remained competent bone formers (Table 3). However, donor #1 cells showed a markedly slowed growth rate, with population doubling times of 21 days at passage 7 and 34 days at passage 8, likely to reflect the onset of proliferative senescence (not tested). Consistent with hAT-MSC having greater proliferative potential than hBM-MSC [41] the median growth rate of our three hAT-MSC cultures at harvest was 3.0 days (range 2.4–4.4 days), whereas for the six hBM-MSC cultures it was 5.4 days (range 2.9–14.3 days). Nonetheless, for 5/6 cases, the previously reported bone-forming potential of the hBM-MSC was confirmed with the exception of donor #1, for which in vivo bone-forming potential was not determined (ND) (Table 3).

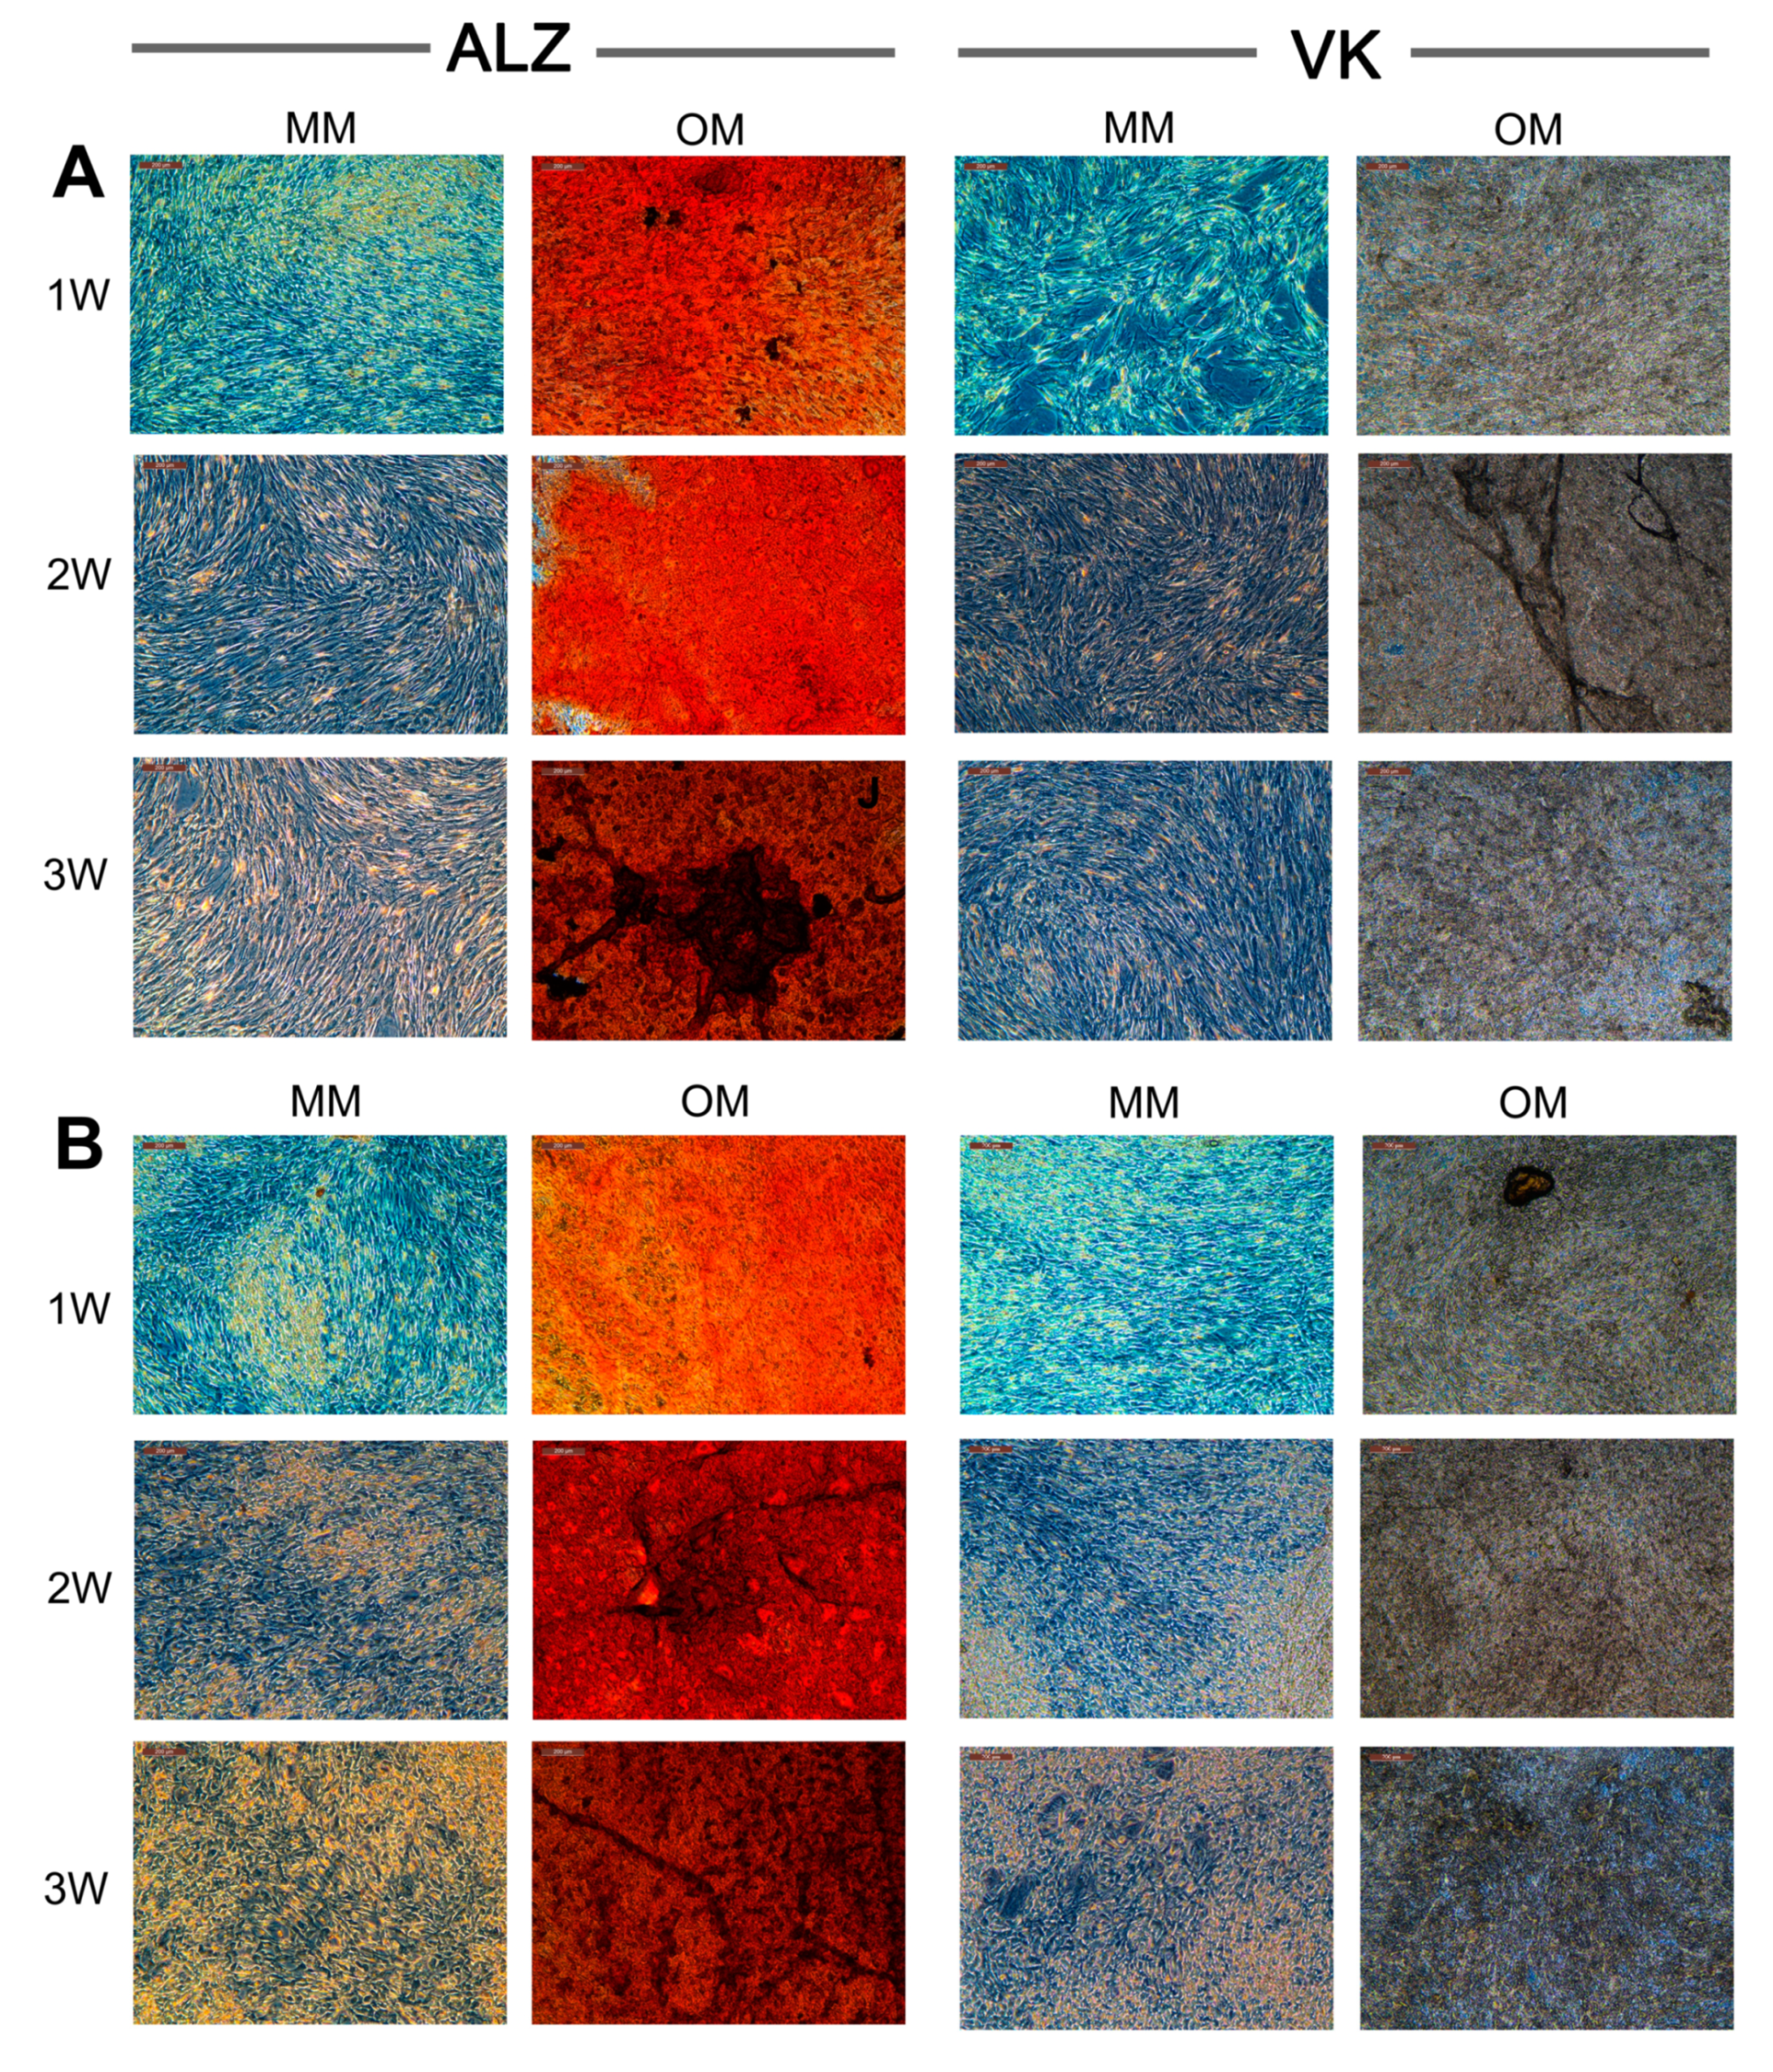
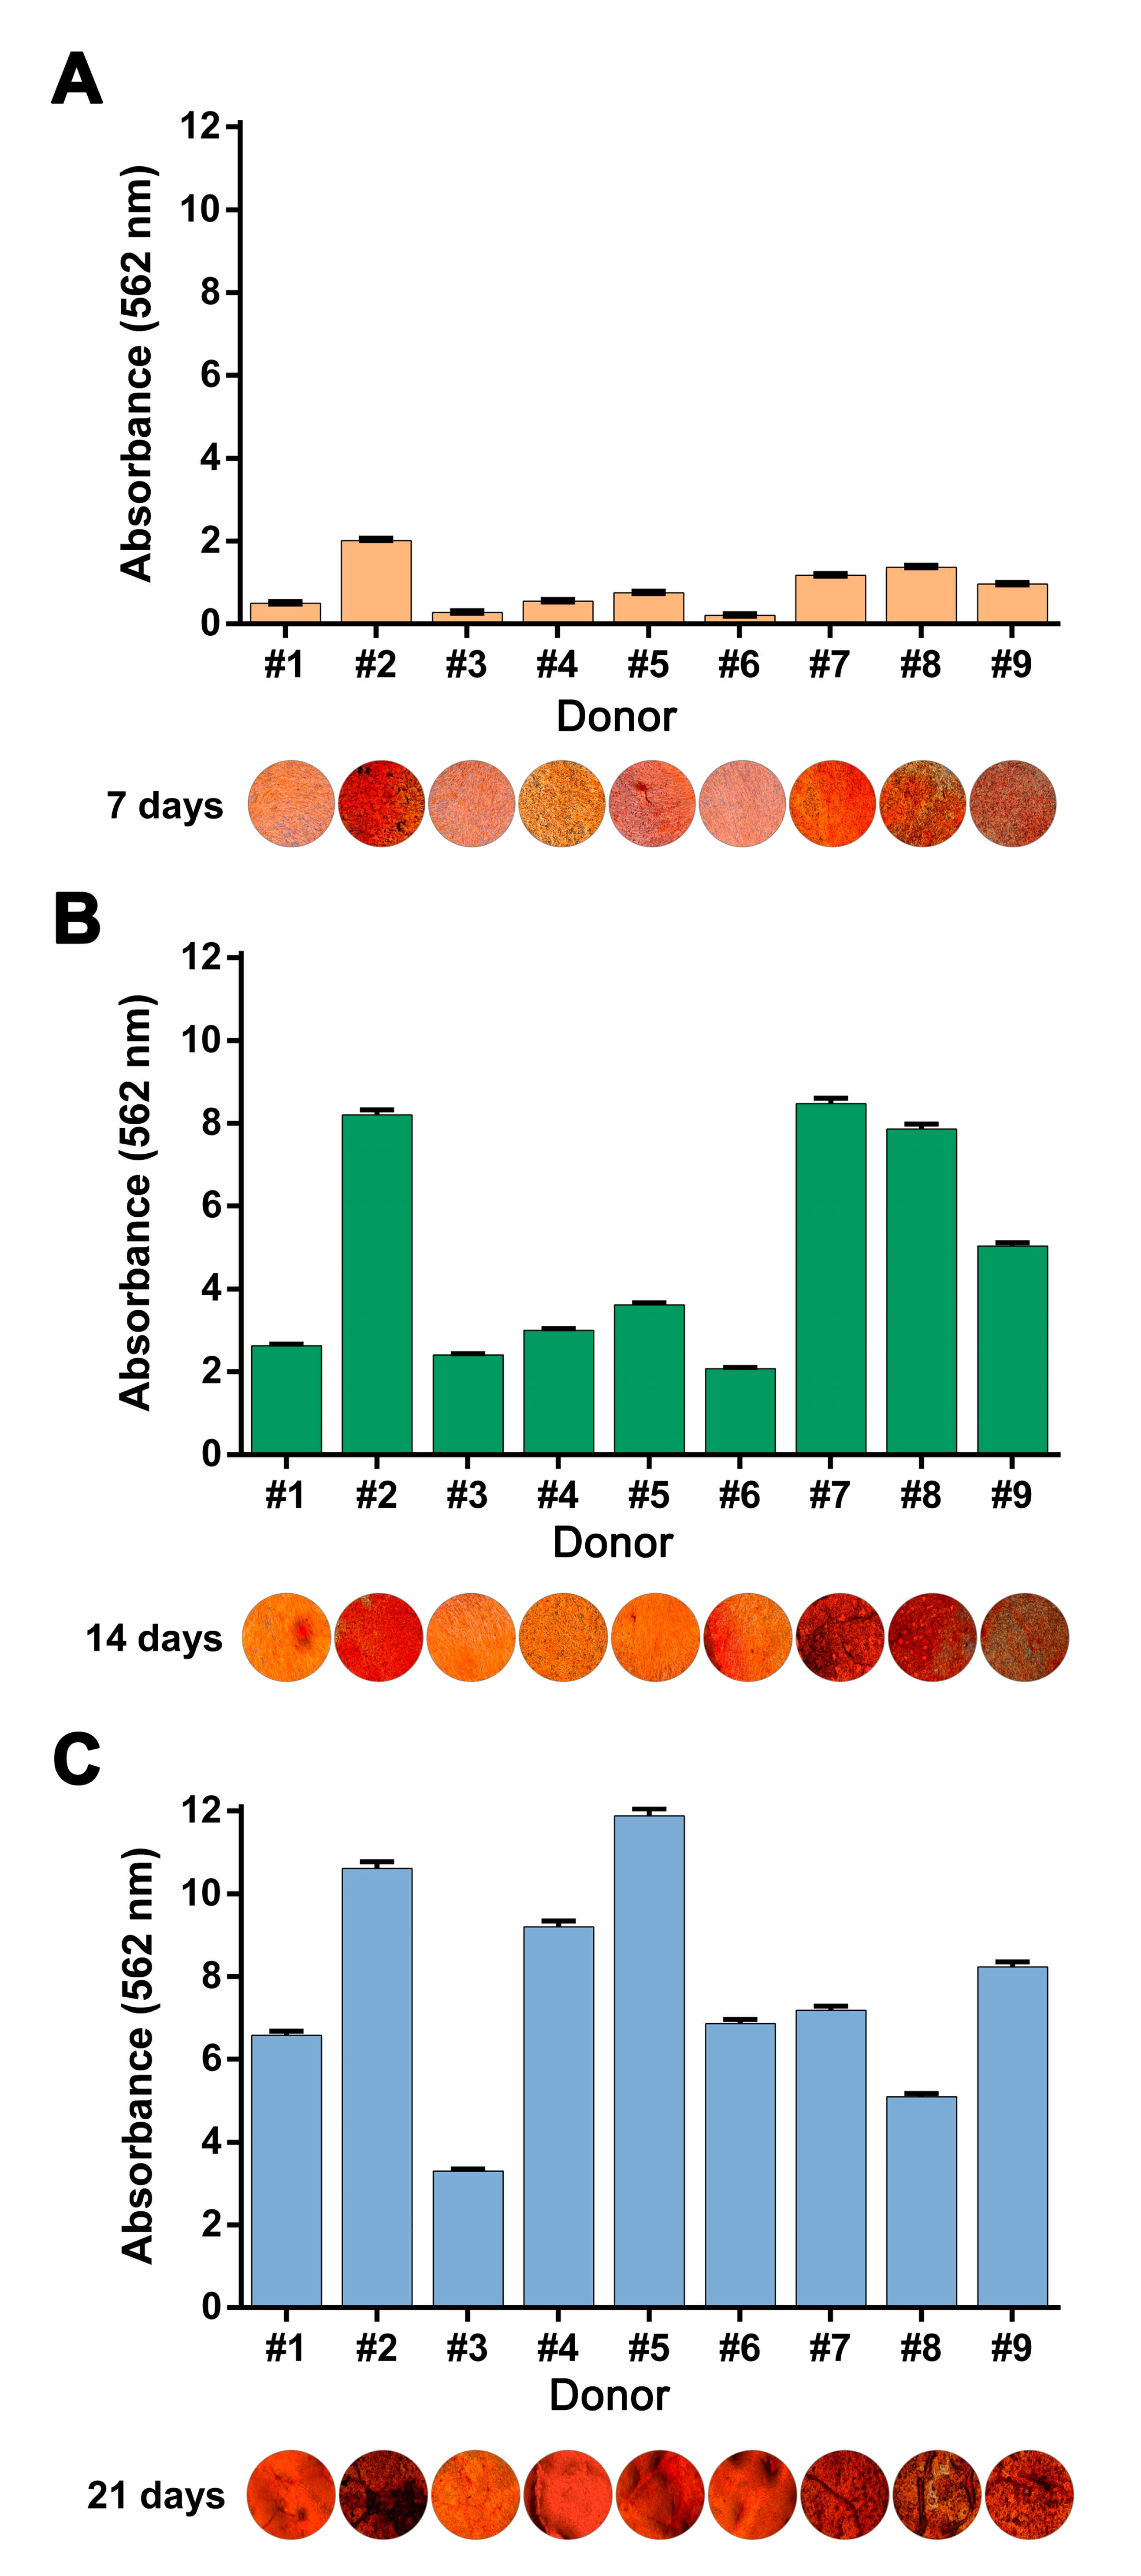
3.2. Osteogenic Medium Promptly Induced hBM-MSC and hAT-MSC Collagen Matrix Biomineralization

In agreement with the claimed efficacy of OsteoMAX-XF™, induction of a biomineralized extracellular collagen matrix shown by positive ALZ and VK staining, was consistently observed for all the hBM-MSC and hAT-MSC tested (Figure 3). For cells derived from donors #5 and #6 in particular, this was more robust that the mineralization previously observed for these hBM-MSC populations when using a proprietary osteogenic induction medium [18].
Quantification of mineralization detected by Alizarin Red S showed incremental accumulation of extracellular matrix mineralization over a three-week time course for both hBM-MSC and hAT-MSC (Figure 4).

3.3. The Real-Time PCR Reference Gene Pair of Lowest Median Absolute Dispersion (MAD) Was GUSB/YWAHZ

The osteogenic potency assay’s key quantitative parameter was the relative mRNA induction of signature gene biomarkers normalized to an internal reference control. Normalization was a principal concern for reliable quantitative comparisons because it controls for variations in extraction yield and efficacy of amplification, improving the comparison between different samples. Experimental validation of internal reference genes allowed more accurate reporting of the RNA concentration ratios of the genes of interest. We sought to determine the most stably expressed reference genes also having an abundance correlated to the total amounts of mRNA for the target genes. Consistent with previous reports of reliable reference genes when performing quantitative real-time PCR in hMSC undergoing differentiation [27], we observed lower average median absolute dispersion scores for GUSB (3.99) and YWAHZ (6.64) than for ACTB (10.75). Notably, ACTB was the least stable reference gene in a study that evaluated hAT-MSC in platelet lysate growth conditions [42]. Following recommendation for use of two internal control genes, we found the combination of GUSB and YWAHZ constituted the gene pair with lowest MAD when using SYBR Green methodology. This gene pair combination also provided the best representative average value when comparing the three gene pair combinations of ACTB/GUSB or ACTB/YWAHZ or GUSB/YWAHZ using TaqMan methodology (Table 4). Therefore, the GUSB/YWAHZ gene pair was chosen for donor-specific comparison of signature gene expression.

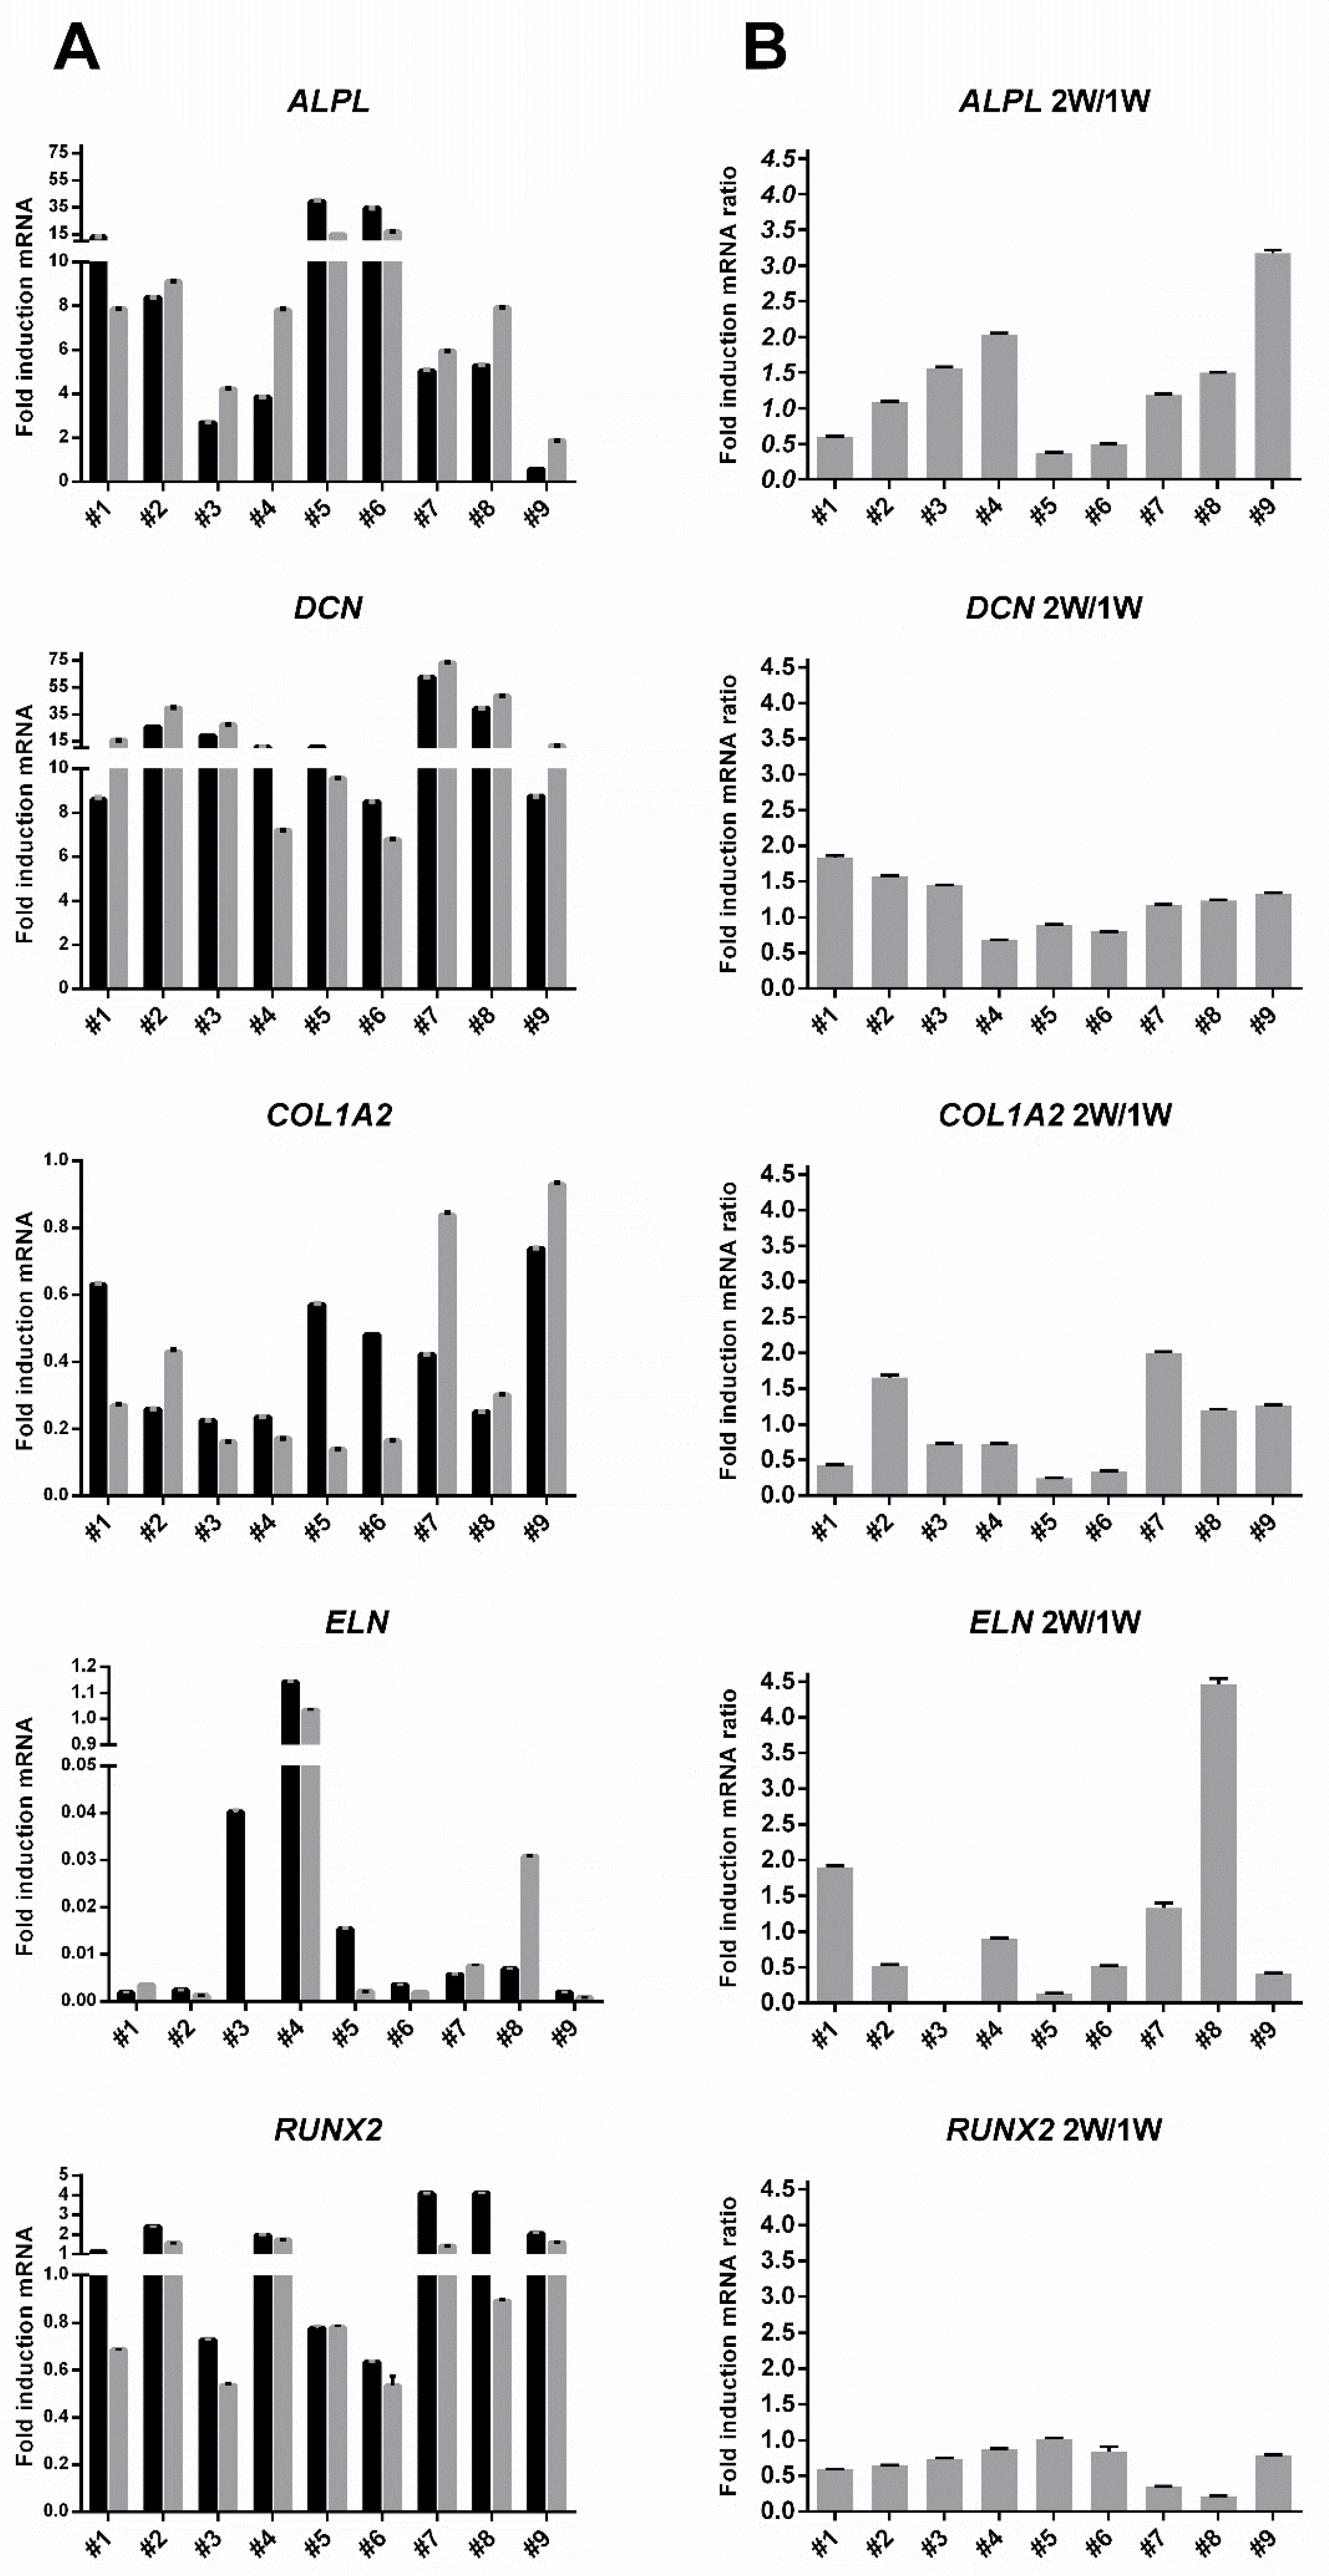
3.4. Inter-Donor Heterogeneity for Osteogenic Potency Signature Gene Induction in hBM-MSC and hAT-MSC

With reassuring similarity to our previous study concerning osteogenic potency assay biomarkers using five signature genes, individual hBM-MSC and now also hAT-MSC populations showed striking donor-specific gene expression patterns for ALPL, COL1A2, DCN, ELN and RUNX2 gene induction after treatment with osteogenic medium (Figure 5 column A). As previously reported, ALPL induction was most elevated in hBM-MSC from donors #5 and #6, and there was close parity with data obtained from cells differentiated for two weeks as opposed to just one week (Figure 5 column B). Among the similarities and differences in the cross-laboratory donor-specific clustering outcomes, hBM-MSC from poor-bone-forming donor #5 and outlier donor #6 [18] were still classified as distinct from the bone-forming donors. However, in contrast to previous analysis of these genes in hBM-MSC [18], there were no examples where a signature gene showed extreme induction levels (>100-fold) and the levels of induction of COL1A2, ELN and RUNX2 were minimal. After 1 week of osteogenic induction, only RUNX2 showed up to about 2-fold induction in hBM-MSC donors #2 and #4 and up to about 4-fold in hAT-MSC donors #7 and #8. More consistently, ALPL (typically ≥ 5-fold) and DCN (typically ≥ 10-fold) showed readily measurable levels of induction. These cross-laboratory differences might reflect the following: (i) use of different real-time PCR apparatus and formats (a 96-well as opposed to 24-well system), (ii) that the hBM-MSC were analyzed after they had undergone additional freeze-thaw cycles and passage in culture, (iii) different growth conditions from use of an alternative commercial platelet lysate and osteogenic induction formulation, and (iv) use of alternative real-time PCR reference genes; a GUSB/YWAHZ pair as opposed to ACTB alone.

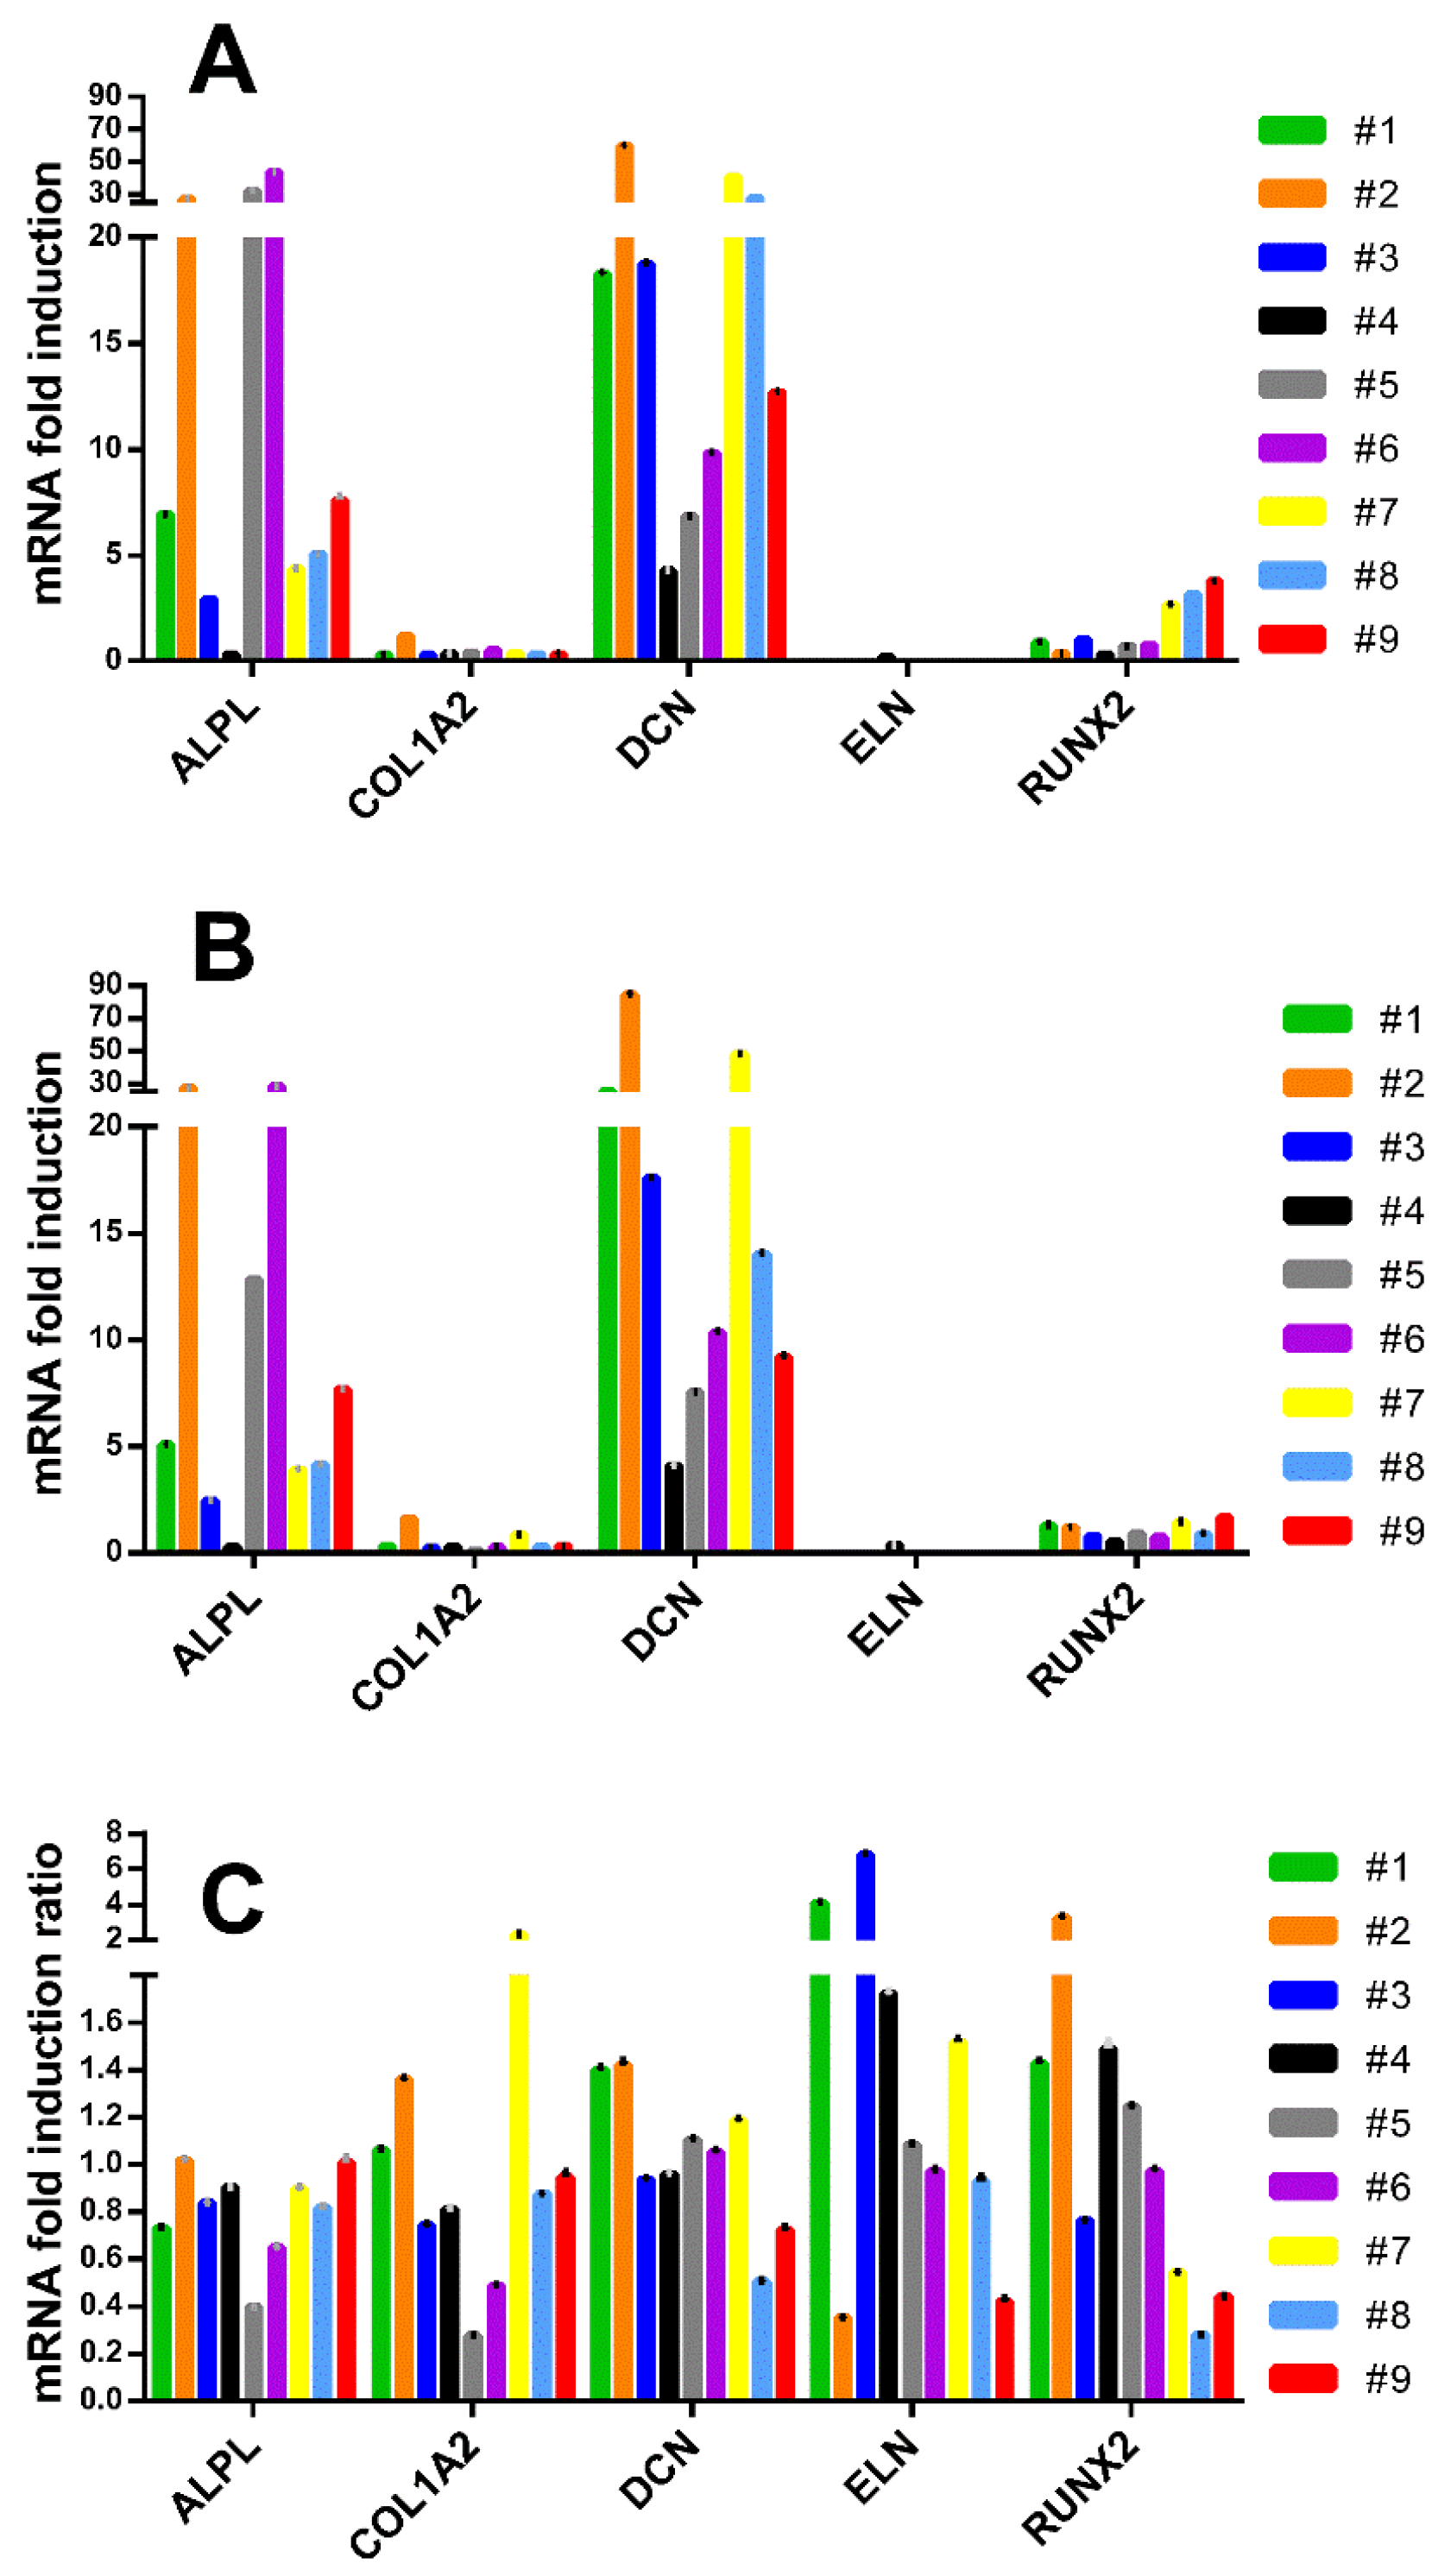
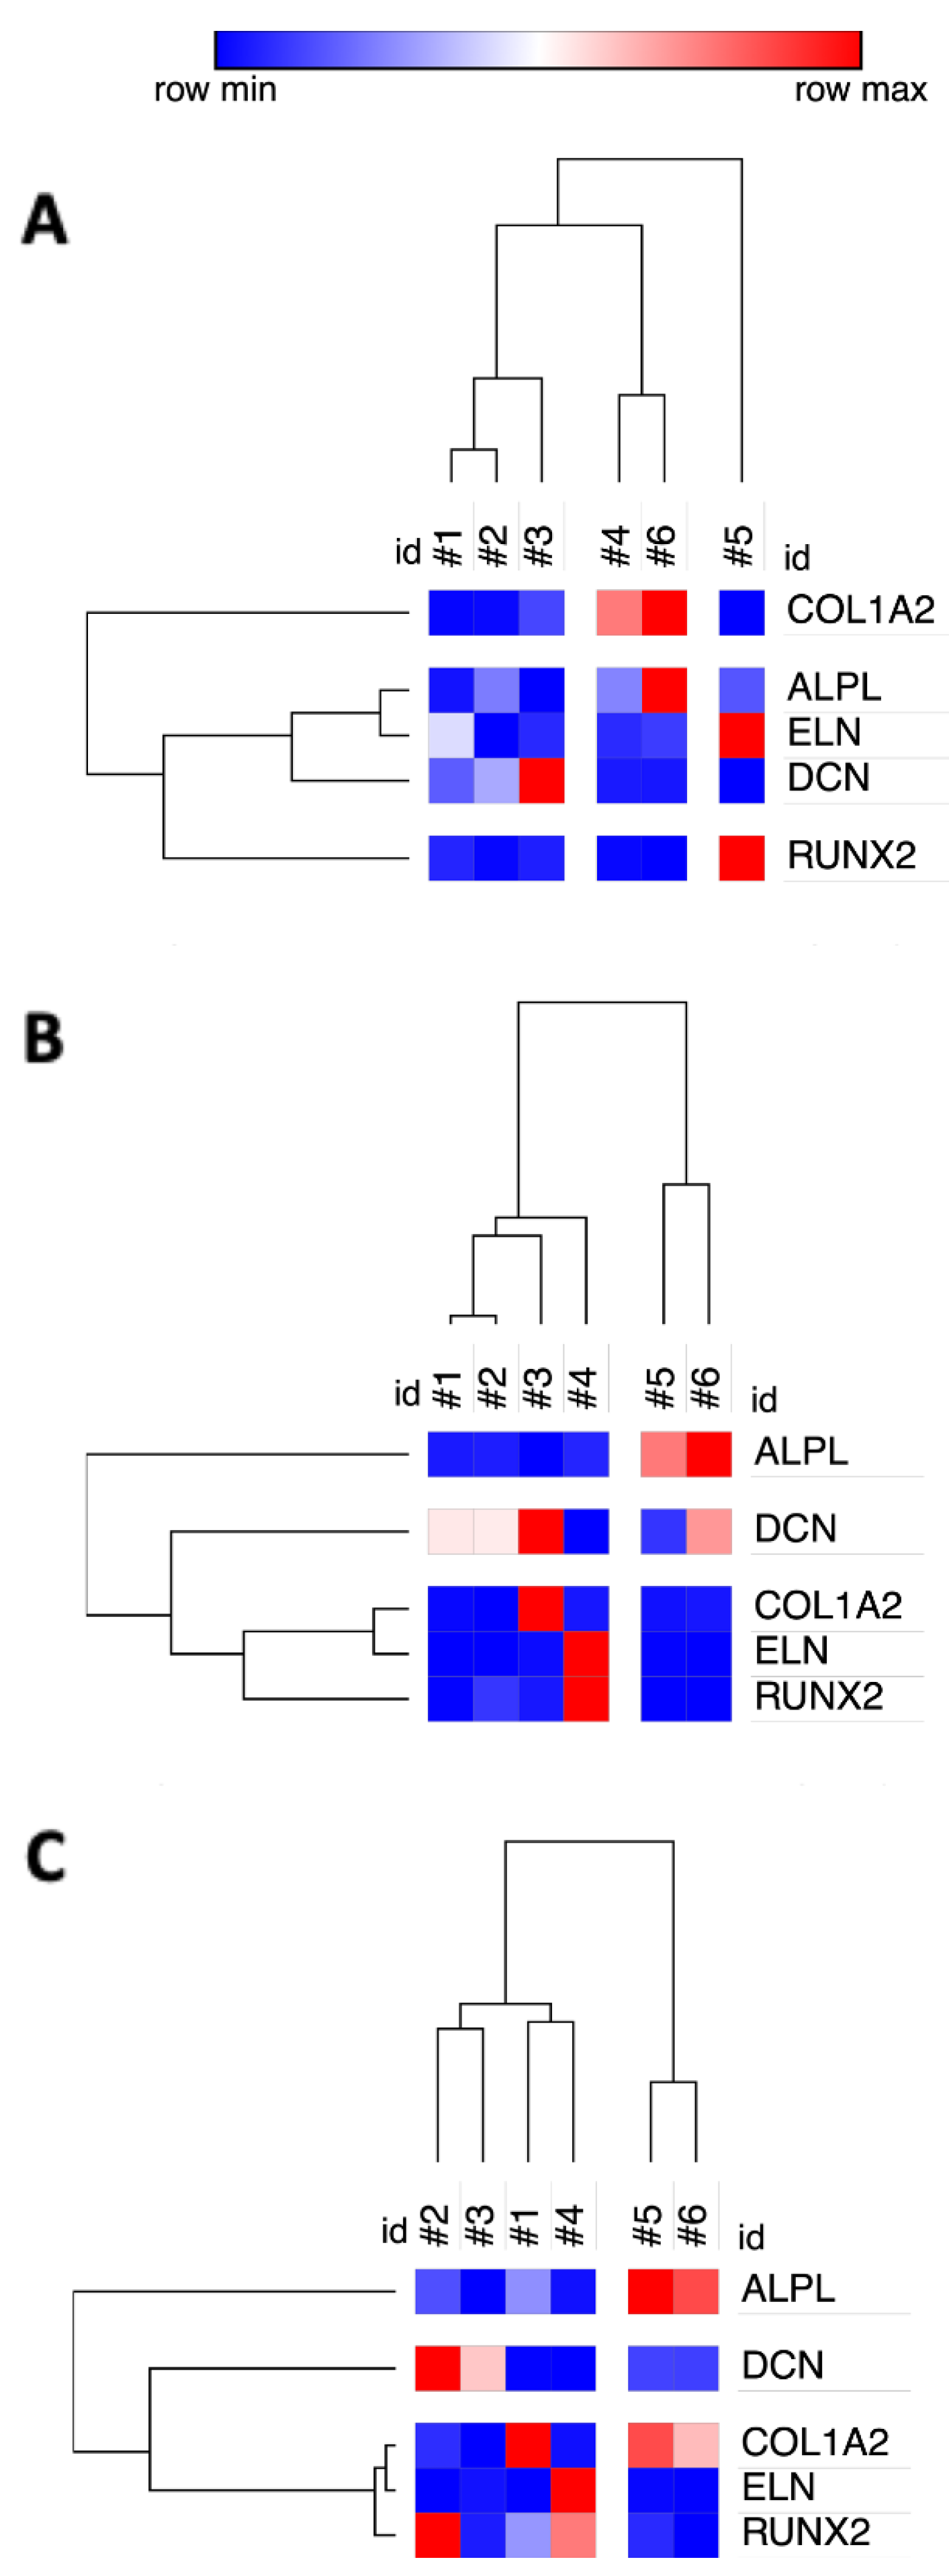
3.5. TaqMan Real-Time PCR Confirmed Low Induction of COL1A2, ELN and RUNX2 Genes

To test whether strikingly different overall results in signature gene induction levels compared to our previous studies did not simply reflect SYBR Green related technical discrepancies, we repeated the analysis using TaqMan real-time PCR technology (Figure 6).
Again, as for SYBR Green based PCR, TaqMan analysis indicated that induction of ALPL and DCN was notably greater than for the other signature genes COL1A2, ELN and RUNX2. Indeed the reproducibility with our SYBR Green data was very high, confirming previous reports that use of high performance primers and careful protocols rendered similar performance from both SYBR Green and TaqMan methods [43]. COL1A2 and ELN were barely induced and RUNX2 expression at 1 week was induced closer to 4-fold in hAT-MSC than hBM-MSC. Low induction of a signature gene did not necessarily indicate low constitutive levels of its expression, yet it has recently been observed that COL1A2 gene silencing did not necessarily compromise murine embryo fibroblast in vitro mineralization or collagen matrix formation in vivo [44].

3.6. Cross-Laboratory Comparison of Potency Assay Cluster Analysis

The open access versatile matrix visualization software hosted by the Broad Institute, Cambridge, MA, US, provided a convenient platform for visualizing the inter-relationship of the different donors according to the gene expression profile of their derived hBM-MSC. Morpheus software cluster analysis of prior signature gene mRNA expression data produced a dendrogram diagram matching that previously obtained open source software Cluster 3.0 (ENCODE Project) [18].
Given differences in experimental parameters and gene induction patterns from the previous comparative study [18], it was not surprising that the current derived cluster analysis was not identical (Figure 7A). Nonetheless, directly comparing the results retaining the same reference gene ACTB and some salient consistent features remained. The bone-forming hBM-MSC group constituted by donors #1, #2 and #3 remained clustered (Figure 7B), yet this group now also became associated with the non-bone-forming donor #4 cells. In the previous study, the non-bone-forming donor #4 cells were associated with donor #6 cells that had an outlier phenotype of being poor for matrix mineralization in vitro, yet forming bone in vivo. In our study, donor #6 cells were grouped with the poor-bone-forming donor #5 hBM-MSC, largely on the basis of both having distinctively high induction of ALPL. A main difference between the two studies was the different grouping of the signature genes, previously COL1A2 had shown high levels of induction, whereas now COL1A2 was clustered with ELN and RUNX2 reflecting relatively low induction levels, observed when cluster analysis was performed from either SYBR Green or Taqman data (Figure 7C).

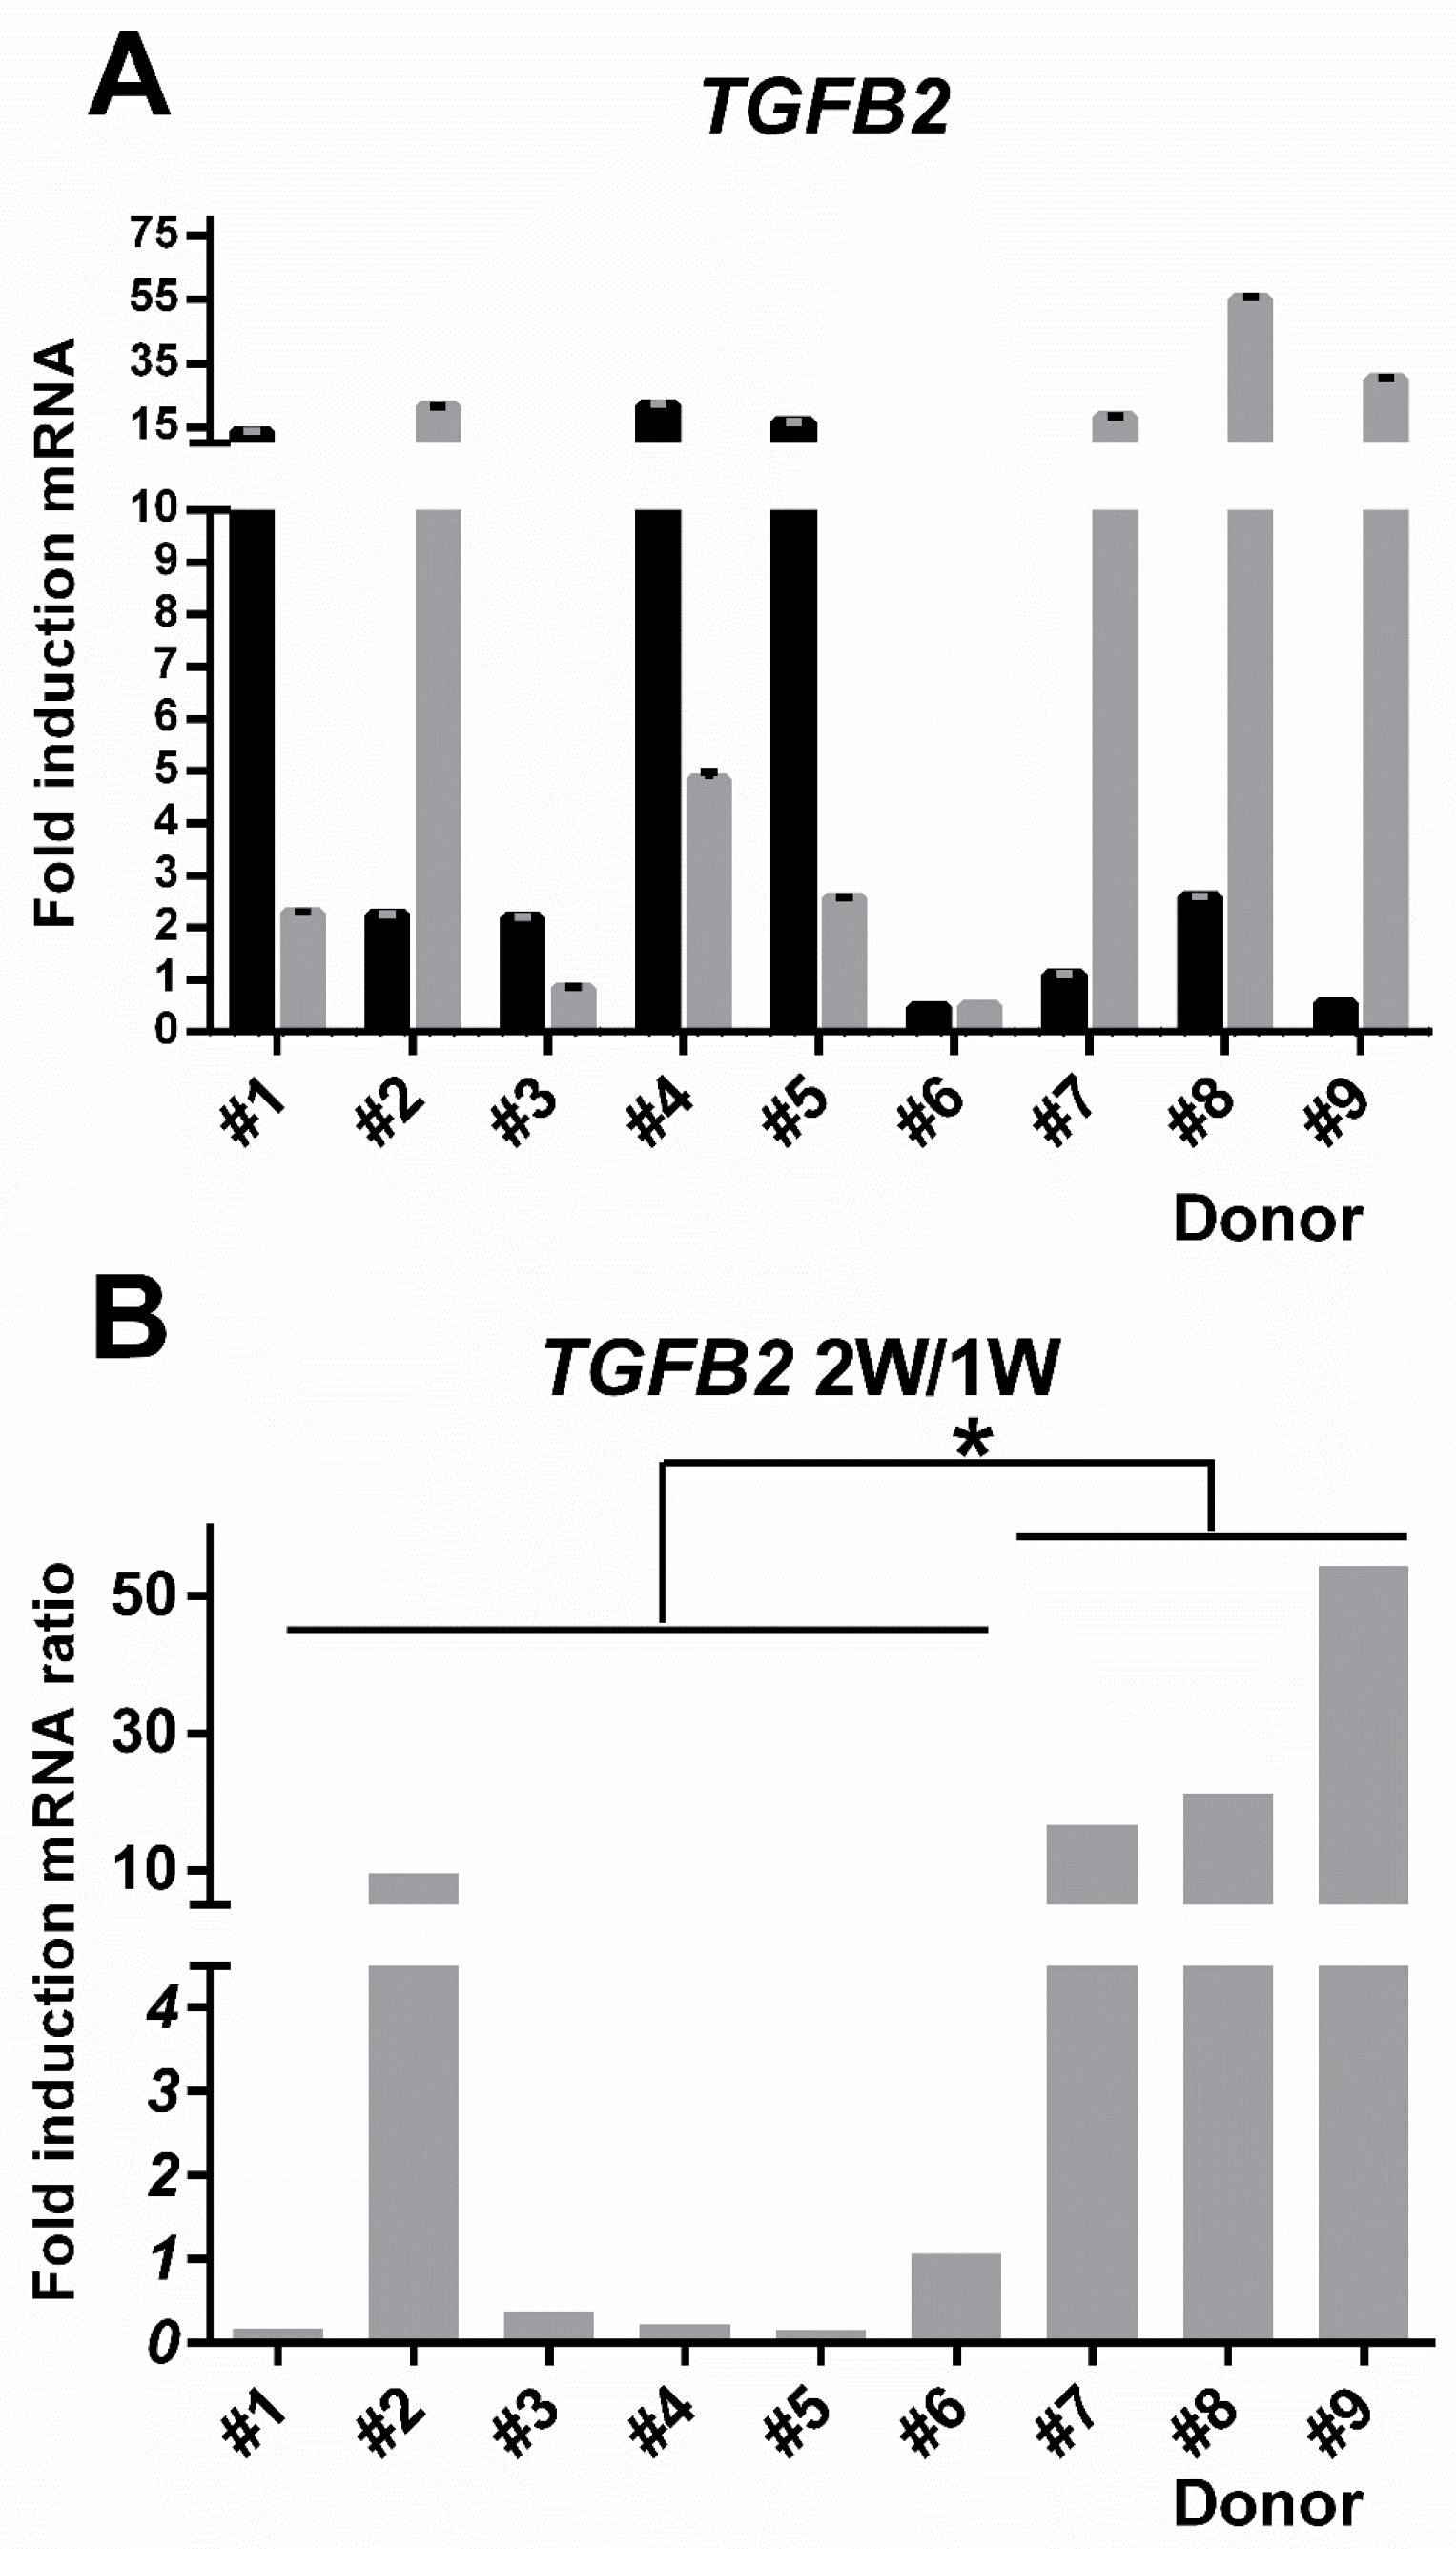
3.7. TGFB2 Gene Induction Was Distinct for hBM-MSC Versus hAT-MSC

With concern that under the new, more standardized assay conditions, the performance of the potency assay might be compromised by low levels of COL1A2 and ELN gene induction, we sought to test the suitability of TGFB2 gene induction. More aligned with the well-expressed biomarkers ALPL and DCN, the levels of TGFB2 induction at one week reached over 10-fold for half of the donor-specific hBM-MSC (Figure 8A). Moreover, the parity for gene induction at one week and two weeks was now different to all the previous potency assay signature genes, because there was clear discrimination between hBM-MSC and hAT-MSC (Figure 8B). The chronology of TGFB2 gene induction for hAT-MSC was distinctly low at week one, but much higher at week two, an incremental induction that was less prevalent among the hBM-MSC and only seen to a lesser extent in hBM-MSC derived from donor #2. Notably, unlike ALPL or DCN, the overall pattern for TGFB2 induction was more transient, a characteristic of in vivo relevance, noted in studies of TGF-β1 eliciting a pro-chondrogenic response to BMPs in early limb skeletogenesis [45].

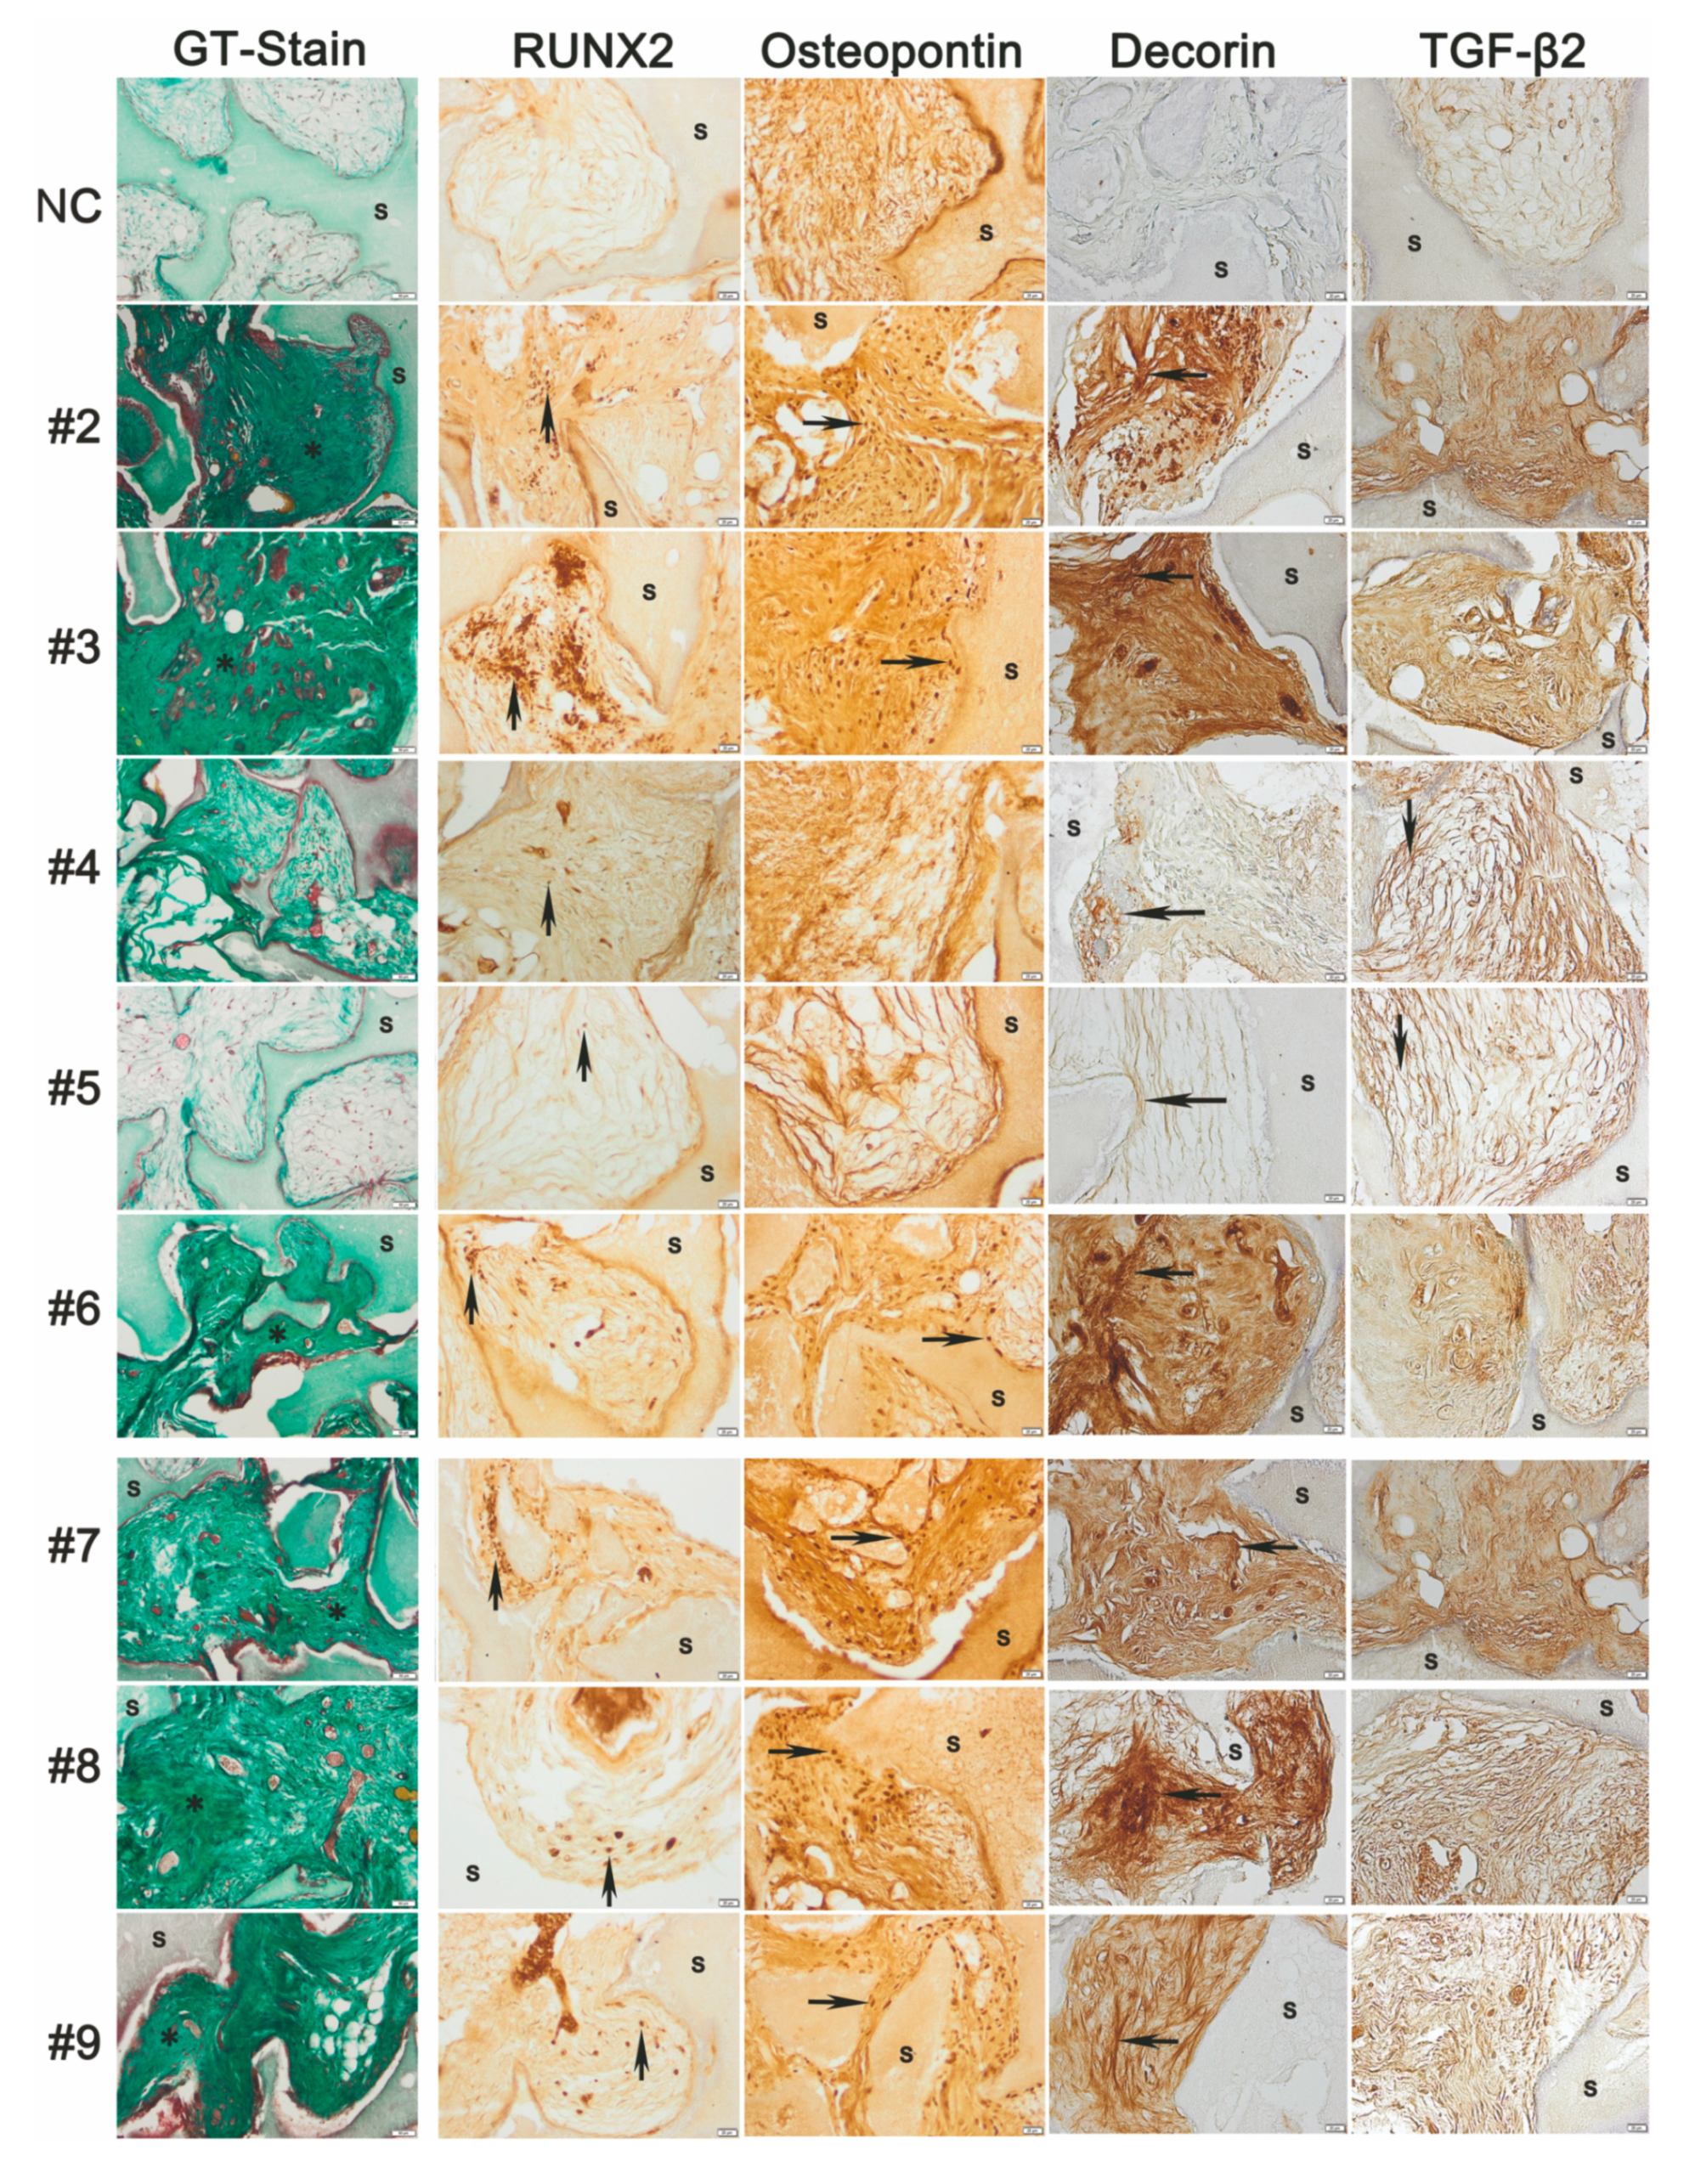
3.8. Donor-Dependent Bone Formation by hBM-MSC and hAT-MSC with Distinct Decorin and TGF-β2 Immunohistology

Histological analysis of heterotopic implants of hMSC from donors #2–#9 with osteoconductive scaffolds revealed inter-donor heterogeneity in vivo (Figure 9).
Notably, the hBM-MSC potential to form bone-like osteoid was consistent with previous studies [18]; here, we extended analysis of bone-forming potential per se to include immunohistochemical detection of Runx2 and Decorin as well as the extracellular matrix bone remodelling protein osteopontin and the novel candidate potency biomarker TGF-β2. Meeting the aim that the potency assay in vitro should have relevance for in vivo bone formation, we observed close correlation between the staining patterns of decorin and the propensity for the hBM-MSC to form bone. For sections belonging to donors #4 and #5, whose hBM-MSC did not form heterotopic bone, staining with the human-specific anti-decorin antibody was much weaker than for all other hBM-MSC and hAT-MSC that had a strongly positive staining pattern consistent with a dense osteoid matrix indicative of bone-forming potential. Moreover, the TGF-β2 staining pattern in sections from donors #4 and #5 displayed a more reticular pattern in contrast to a more diffuse staining pattern seen in the other hBM-MSC sections. Together, the histological staining patterns for the decorin and TGF-β2 proteins distinguished the sections from donors #4 and #5 as distinct; indeed, this correlated perfectly with the bone-forming potential of the hBM-MSC.

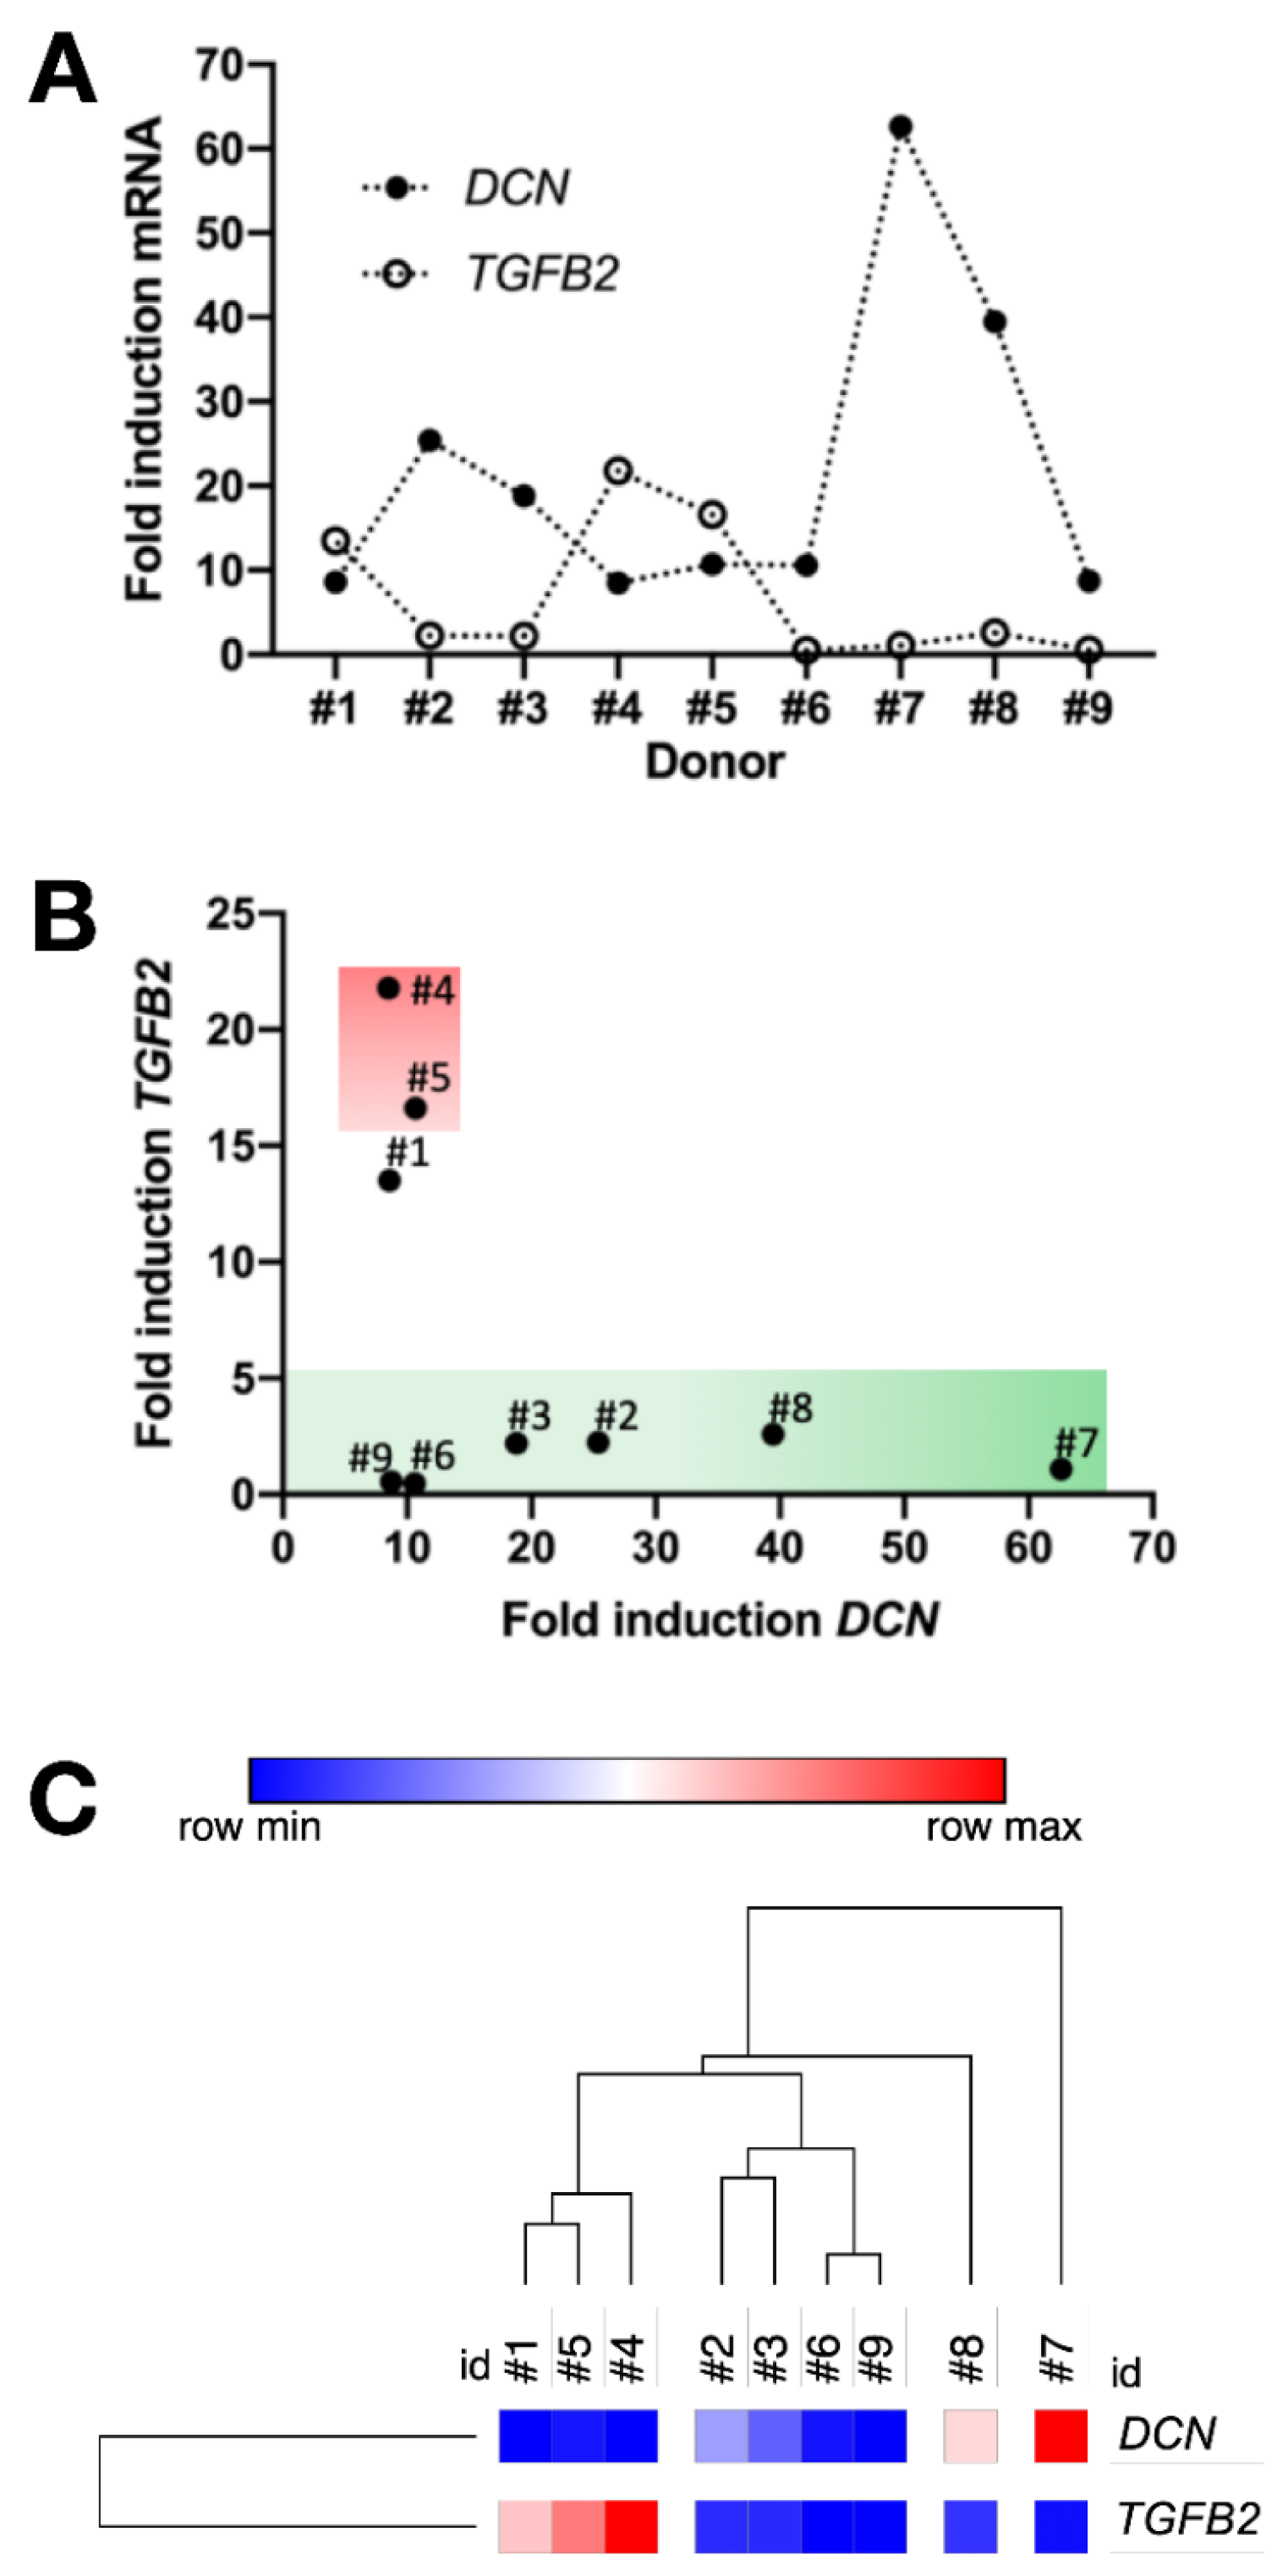
3.9. Inversely Correlated TGFB2 and DCN Gene Induction and Prospective Recognition of hMSC Bone-Forming Potential In Vivo

Tracing induction of DCN and TGFB2 genes one week after cell treatment with osteogenic medium across the different hBM-MSC samples revealed an inverse relationship (Figure 10A) that was particularly evident for donors #1 to #5 (Spearman correlation, p < 0.05). A less precise correlation was observed for the hAT-MSC; nonetheless, it could be maintained that if decorin induction was relatively high, TGFB2 induction was very low.
Strikingly, the plot of fold-induction at one week for TGFB2 mRNA versus that for DCN mRNA revealed a donor-specific distribution pattern on the scatter graph that correlated extremely well with bone-forming potential, such that a “green zone” for donors displaying good bone-forming potential was clearly distinct to a “red zone” for hBM-MSC from donors #4 and #5 that did not form bone (Figure 10B).
The donor-specific clustering obtained using just the DCN and TGFB2 induction data (Figure 10C) highlighted that the non-bone-forming hBM-MSC were distinct from the bone-forming hBM-MSC with further discrimination of hAT-MSC derived from donors #7 and #8.

4. Discussion

Heterogeneity among the cells of multipotent differentiation potential derived from connective tissues, generally referred to as “mesenchymal stromal/stem cells” [46], a contested nomenclature [47], can reflect choices of tissue source, detection method, isolation protocols, purification [48] and/or unique characteristics pertaining to the donor [49]. The heterogeneity in bone-forming potential, most readily demonstrable at the clonal level, can remain apparent in donor-specific hMSC cultures where pragmatic cell isolation using plastic culture adherence fails to discriminate functionality among morphologically similar fibroblastic cell types from various connective tissues [50]. Challenges presented by hMSC heterogeneity for clinical development [51], beckon assays measuring a quantifiable functional phenotype forecasting donor-dependent bone-forming potential for accurate control of therapeutic application.
Prior experimental analysis of 18 potential osteogenic biomarkers in six donor-specific hBM-MSC populations induced osteogenically for one week, resulted in selection of five significantly induced genes. These “signature genes” provided a collective expression pattern that helped cluster hBM-MSC in accordance with an in vivo heterotopic bone formation assay [18]. The eligibility of these functional biomarkers was supported by numerous studies: Tissue-nonspecific alkaline phosphatase (ALPL/TNAP), a homotetrameric glycophosphatidylinositol-anchored ectoenzyme, located to osteoblast cell surfaces at skeletal tissue calcification sites. ALPL was induced early during stem cell transit towards an osteoblast phenotype and could regulate osteogenic differentiation either by influencing RUNX2 gene expression or by increasing the extracellular inorganic phosphate (Pi) concentration by hydrolysis of inorganic pyrophosphate (PPi) [52,53]. Often used to assess osteogenic differentiation, though not always correlated with bone formation [16], ALPL was induced in about 70% of independently examined hBM-MSC [54]. The COLIA2 gene product combined with COL1A1-derived procollagen forms the collagen type 1 heterotrimer fibrils, (two alpha1(I) chains and one alpha2(I) chain), the principal matrix component of bone. Mutations in either procollagen gene were found in osteogenesis imperfecta patients, suggesting a fundamental role in bone development [55]. Nonetheless, in a murine COL1A2 silenced model, osteoblasts could still form mineralizable collagen alpha1(I) homotrimers [44]. Decorin (DCN), one of several secreted glycosaminoglycan (GAG) noncollagenous proteins of bone, was characterized in bone as a leucine-rich repeat core protein covalently attached to chondroitin sulphate as opposed to a dermatan sulphate chain in soft connective tissues [56]. It binds and “decorates” collagen fibrils, dramatically influencing collagen fibril assembly and mechanical properties. Electron microscopy indicates decorin is decreased in more calcified fused collagen fibrils [57]. Elastin (ELN) microfibrils make essential cross-linked protein structures in the ECM that can increase bone remodelling in a defect area [49,50] and also modulate TGF-β availability [58]. Notably, hBM-MSC, selected for the CD271+ biomarker proposed to indicate functional competence, had a molecular signature involving enhanced expression of ECM proteins, including elastin [59]. RUNX2 a key bone development transcription factor essential for osteoblast differentiation, induces progenitor cell commitment to osteoblast lineage cells [60], regulating their proliferation and differentiation via reciprocal regulation with the hedgehog signalling pathway. RUNX2 DNA-binding sequences occupy the promoters of almost all bone-specific genes [61]. Yet, RUNX2 expression is not exclusively confined to differentiating cells and whether its induction predicted osteogenic potency in human cells was debatable [16].
Concerted effort from different laboratories to support qualification of biomarkers has been recommended [62]. We aimed to develop a robust, broadly applicable assay, suitable for biosensor development, to promote consistency across multi-centric trials, providing improved uniformity and scalability. Recapitulating a previously described potency assay [18], we paid special attention to stability, use of scalable reagents and scope for applicability to MSC from adipose as well as bone marrow tissue sources.
Cell proliferation and differentiation results supported the view that cryopreserved hMSC regained functional potency soon after acclimatization [63] and that platelet lysate provided excellent supportive growth medium for the culture of both hBM-MSC [64] and AT-MSC [65], confirming an expectation that hAT-MSC would grow faster than hBM-MSC [25]. With one possible exception (hBM-MSC from donor #1), the primary hMSC underwent four to eight cumulative population doublings without morphological changes or a growth rate plateau suggesting the onset of senescence [66]. Donor-specific differences in bone-forming potential in vivo, consistent with earlier studies, further verified that the cells were suitable for testing the quantitative potency assay.
We used the induction reagent OsteoMax-XF™, originally derived by screening about 3500 combinations of serum and xeno-free medium to obtain an efficient, fully defined reproducible medium for scalable hMSC osteoblast differentiation assessed by ALZ staining. Favorably compared to other osteogenic media, OsteoMax-XF™ induced rapid ECM calcification in dental pulp stem cells [29] and even human primary fibroblasts [28]. Notably, donor #6 hBM-MSC, previously staining ALZ negative unless the osteogenic induction medium was modified [18], were here ALZ positive.
Real-time PCR, the principal quantitative assessment method for our osteogenic potency assay, provided advantages of sensitivity, large dynamic range, accurate quantification and potential for automation. Heeding concern that ACTB may be inadequate for normalization of hMSC differentiation studies [27,67], we confirmed reports that GUSB [68] and YWHAZ [69] were more stable reference genes. We actually found ACTB to be acceptably stable for hBM-MSC but less consistent for hAT-MSC. We did not agree that GUSB was a poor reference gene for hAT-MSC [70], perhaps reflecting our use of FBS-free culture media. The MIQE guidelines discouraged large discrepancies in transcript abundance between reference and target genes and recommend more than one reference gene [71]. GUSB, the gene with the smallest average median absolute dispersion, had an average threshold cycle level suitable for measurement of ALPL, DCN and TGFB2 levels of transcription, whereas YWAHZ mRNA levels matched the more weakly expressed RUNX2 gene. Thus, the GUSB/YWAHZ reference gene pair provided a transcript abundance range suited to the target genes.
Numerous laboratories addressing therapeutic translation of heterogeneous, nonclonal mixtures of hMSC have yet to derive a comprehensive unequivocal quantitative potency assay that predicts bone-forming potential [72,73,74]. Considerable variability for hMSC biomarker mRNA levels between biological samples was a common observation [75]. Since microenvironmental factors readily influence readout variability, it was not surprising that we did not obtain an identical clustering outcome when using our modified version of the previously reported potency assay. Nonetheless, salient aspects were preserved. Firstly, the donor-specific hBM-MSC heterogeneity regarding bone-forming potential in the heterotopic immunocompromised mouse model remained consistent. Consistent donor-specific heterogeneity persisted despite opportunity for phenotypic drift during in vitro expansion of the hBM-MSC, as reported during prolonged growth of hMSC from bone marrow [76] and other tissue sources [77]. We confirmed prompt induction of osteogenic differentiation, with cell aggregation and ALZ-positive calcified ECM after just one week of treatment with osteogenic medium. This likely reflected use of platelet lysate instead of fetal bovine serum in the maintenance medium [78] and was also consistent with the reported effectiveness of OsteoMax-XF™.
Variability in signature gene mRNA induction allowed cluster analysis to discriminate a non-bone-forming hBM-MSC population as clearly distinct from the bone-forming hBM-MSC populations. In contrast to previous data, our COL1A2 induction levels were lower than those previously reported [16,18]. Nonetheless, others found that collagen I barely showed any induction in hBM-MSC-TERT+Bone cells [16] or expressed early at day 5 in murine BM-MSC was down-regulated through osteogenic differentiation, although still transcribed at a suitable level for protein synthesis [79]. DCN induction may not be a feature of osteogenic differentiation in every context [80] yet we provide the third cross-laboratory example of its robust induction in bone-forming hBM-MSC grown in monolayer [16,18] or 3D culture conditions [68]. Our relatively low ELN induction levels may reflect inhibitory components of the proprietary induction medium; for instance, bFGF can down-regulate ELN expression [81], or high levels of inorganic phosphate in the ECM [82] from strong ALPL induction. Nonetheless, consistent low ELN induction levels among all our hMSC indicated attainment of advantageously stable potency assay conditions. Appropriate for a key osteogenic transcription factor [83] RUNX2 was induced, although only weakly. This was consistent with reports that primary human osteoblastic differentiation was associated primarily with post-translational changes in RUNX2 protein activity rather than a significant change in mRNA or protein levels [84].
Under our particular potency assay conditions, several biomarkers (especially ELN, COL1A2) showed relatively low (typically < 2-fold) induction levels. To strengthen the assay, we sought a further biomarker and focused on the TGF-β pathway, of notable interactive relevance to the set of five signature genes [18]. Of the three members of the TGF-β cytokine family (TGF-β 1–3), only TGFB2 gene deletion induced defects in endochondral bone formation [85] supporting gene expression profile studies indicating a specific role in commitment to osteogenesis [32]. Though similar, mRNA and protein expression of TGF-B2 showed distinct patterns of expression to TGF-β1 in human bone samples [86]. We were encouraged to find that TGFB2 induction was very detectable in hBM-MSC after one week of osteogenic treatment and intrigued that this was not the case for hAD-MSC. Extending the assay revealed that, in compensation, TGFB2 was strongly induced in hAD-MSC, at a later two-week time point, consistent with the concept that hAD-MSC differentiation in vitro may lag that of hBM-MSC [87]. Despite many similarities, tissue-origin-specific differences between hBM-MSC and hAT-MSC may be revealed at the mRNA level [22,88], a point worthy of further investigation and consideration for the timing of tailored potency assay measurements.
Independent evidence supported the view that the gene expression data we obtained one week post osteogenic induction had good in vivo relevance. RNA expressed for diverse time points during in vitro osteogenic differentiation of ten hBM-MSC donors between passages 2 and 5 has been compared with primary cultures of normal osteoblasts isolated from hipbone, using microarray analysis of almost 30,000 genes. It was concluded that hBM-MSC on day 7 of their osteogenic differentiation were most similar to the non-mineralized primary human osteoblasts [89]. The authors highlighted that in vitro analysis of the osteogenic differentiation pathway demonstrated three developmental phases of proliferation, matrix maturation and mineralization with activation of the SMAD signalling pathways by members of the bone maturation protein (BMP) family and TGFB2.
Across the hMSC samples, we observed an apparent inverse correlation between the induction of TGFB2 and DCN. Notably, among a wide network of protein interactions [90], decorin can interact directly with TGF-β proteins [91] and, when immobilized on collagen fibrils, decorin modulated TGF-β availability and activity [92]. Dynamic decorin and TGF-β inhibitory interactions modulated extracellular matrix organization significantly [93] and influenced cell migration [94]. All bone-forming hMSC showed TGFB2 and DCN mRNA induction at one week within ≈5- and ≈75-fold, respectively, in contrast to relatively high TGFB2 induction (>15-fold) and relatively low DCN induction (<15-fold) in non-bone-forming hBM-MSC populations from donors #4 and #5. The latter matched relatively low decorin detection in the histological sections the heterotopic implants belonging to donors #4 and #5. Conversely, relatively high TGFB2 induction in vitro did not directly correspond to high TGF-β2 detection in histological sections. This apparent paradox may likely reflect complex post-trancriptional regulation of TGFB2 protein expression, including a sequestrating interaction with decorin [95]. Consistent complexity was found in a transgenic mouse model of osteoporosis; TGF-β2 functioned as a local positive regulator of bone remodeling, yet osteoblast-specific overexpression of this protein resulted in progressive bone loss [96].
The hBM-MSC derived from donor #1 demonstrated a unique relationship between TGFB2 induction at one week and bone formation. Previous studies indicated the cells formed bone, yet here they showed relatively high TGFB2 expression. Compared to the other hMSC samples, the growth curve for hBM-MSC donor #1 cells indicated the slowest growth rate before implantation, likely reflecting early onset of asynchronous replicative senescence associated with functional attrition [97,98]. Notably, TGF-β2 [99] but not TGF-β1 [100] could accelerate hBM-MSC senescence, a phenotype also imparted by TGF-β 2 in vivo during inner ear development [101]. In vitro senescence was not the focus of our study and these observations need further experimental verification. Nonetheless, senescence biomarkers are of interest for quality control of therapeutic cell preparation [102] and may complement the osteogenic biomarkers presented here [103].
We advance previous potency assay studies with confirmation that measurement of bone extracellular matrix metabolism in hMSC can provide strong deterministic indications regarding bone-forming potential. Unlike an orthotopic microenvironment, the subcutaneous murine model offered a relatively consistent and stringent donor-specific surrogate test of bone-forming potential [104] lacking stimulation from nearby bone cytokines and cell-cell interaction with host bone-forming cells. Despite a limited relevance of small animal studies to the human therapeutic context [105] the assay provided controlled in vivo experimental bone formation. Potency assays can be considered multiparametric “works in progress,” to be continuously updated and improved according to advances in protocols and multifaceted target knowledge [106]. Co-regulated gene indexes are likely to prove advantageous for future studies testing further novel osteogenic potency assay biomarkers. Genome-wide weighted gene Pearson correlation network analysis between pairs of genes has revealed highly-correlated novel biomarkers with consistent profiles across samples, relevant to early phase hMSC differentiation [107]. A novel genomic biomarker, characterized by loss of the gene-encoding glutathione S-transferase theta 1 (GSTT1) correlated with enhanced hMSC culturability [108]. Together with further enhanced culture methods [109], such potency biomarkers provide excellent prospects for improving the broad applicability of hMSC therapeutics.
TGFB2 may be considered fully eligible as an osteogenic potency signature gene biomarker of high biological relevance to bone formation. Future studies may be proposed to explore whether it can also be indicative of hMSC growth potential. Under carefully standardized assay conditions, its mRNA induction could be readily quantified in both hBM-MSC and hAD-MSC and, combined with DCN induction, TGFB2 discriminated hMSC according to their prospective bone-forming potential. Analysis of decorin and TGF-β2 protein expression in heterotopic bone implants also revealed distinct histomorphological patterns in non-bone-forming explants. Measurement of TGFB2 mRNA induction enhanced the osteogenic potency assay’s discriminatory power for prompt prospective identification of non-bone-forming hMSC populations to improve regenerative medicine effectiveness.

Author Contributions

Conceptualization, A.M.O. and J.S.B.; methodology, A.M.O., D.F.B. and A.H.; validation A.M.O., D.F.B. and A.H.; formal analysis, A.M.O. and J.S.B.; investigation, A.M.O., D.F.B., S.G., C.B., H.H., B.M. and A.H.; data curation, A.M.O., D.F.B., A.H. and J.S.B.; writing—original draft preparation, A.M.O., D.F.B. and J.S.B.; writing—review and editing, A.M.O., D.F.B., M.I., A.H. and J.S.B.; supervision, M.I. and J.S.B.; project administration, M.I.; funding acquisition, M.I. and J.S.B. All authors have read and agreed to the published version of the manuscript.

Funding

This research was funded by the Ministry of Research and Innovation (RO), Operational Program Competitiveness Axis 1 Section E, Program co-financed from European Regional Development Fund “Investments for your future” under the project number 154/25.11.2016, P_37_221/2015, “A novel graphene biosensor testing osteogenic potency; capturing best stem cell performance for regenerative medicine” (GRABTOP).

Acknowledgments

We would like to thank Massimo Dominici and Alba Murgia from University Hospital of Modena and Reggio Emilia (UNIMORE), for kindly providing the hMSC described in this study.

Conflicts of Interest

The authors declare no conflict of interest. The funders had no role in the design of the study; in the collection, analysis, or interpretation of data; in the writing of the manuscript, or in the decision to publish the results.

References

  1. Lin, H.; Sohn, J.; Shen, H.; Langhans, M.T.; Tuan, R.S. Bone marrow mesenchymal stem cells: Aging and tissue engineering applications to enhance bone healing. Biomaterials 2019, 203, 96–110. [Google Scholar] [CrossRef] [PubMed]
  2. Quarto, R.; Mastrogiacomo, M.; Cancedda, R.; Kutepov, S.M.; Mukhachev, V.; Lavroukov, A.; Kon, E.; Marcacci, M. Repair of large bone defects with the use of autologous bone marrow stromal cells. N. Engl. J. Med. 2001, 344, 385–386. [Google Scholar] [CrossRef] [PubMed]
  3. Imam, M.A.; Holton, J.; Ernstbrunner, L.; Pepke, W.; Grubhofer, F.; Narvani, A.; Snow, M. A systematic review of the clinical applications and complications of bone marrow aspirate concentrate in management of bone defects and nonunions. Int. Orthop. 2017, 41, 2213–2220. [Google Scholar] [CrossRef] [PubMed]
  4. Gómez-Barrena, E.; Padilla-Eguiluz, N.; Rosset, P.; Gebhard, F.; Hernigou, P.; Baldini, N.; Rouard, H.; Sensebé, L.; Gonzalo-Daganzo, R.-M.; Giordano, R.; et al. Early efficacy evaluation of mesenchymal stromal cells (MSC) combined to biomaterials to treat long bone non-unions. Injury 2020, 51 (Suppl. 1), S63–S73. [Google Scholar] [CrossRef] [PubMed] [Green Version]
  5. Siddappa, R.; Licht, R.; van Blitterswijk, C.; de Boer, J. Donor variation and loss of multipotency during in vitro expansion of human mesenchymal stem cells for bone tissue engineering. J. Orthop. Res. 2007, 25, 1029–1041. [Google Scholar] [CrossRef] [PubMed]
  6. Costa, L.A.; Eiro, N.; Fraile, M.; Gonzalez, L.O.; Saá, J.; Garcia-Portabella, P.; Vega, B.; Schneider, J.; Vizoso, F.J. Functional heterogeneity of mesenchymal stem cells from natural niches to culture conditions: Implications for further clinical uses. Cell Mol. Life Sci. 2020. [Google Scholar] [CrossRef]
  7. O’Keefe, R.J.; Tuan, R.S.; Lane, N.E.; Awad, H.; Barry, F.; Bunnell, B.A.; Colnot, C.; Drake, M.T.; Drissi, H.; A Dyment, N.; et al. American Society for Bone and Mineral Research-Orthopaedic Research Society Joint Task Force Report on Cell-Based Therapies. J. Bone Min. Res. 2020, 35, 3–17. [Google Scholar] [CrossRef]
  8. Pimpaneau, V.; Gianelli, F.; Trouvin, J.-H.; Poiseau, A.D. The challenges of potency assay development for cell-based medicinal products in Europe. Regul. Rapp. 2015, 12, 5–10. [Google Scholar]
  9. Gómez-Barrena, E.; Rosset, P.; Gebhard, F.; Hernigou, P.; Baldini, N.; Rouard, H.; Sensebé, L.; Gonzalo-Daganzo, R.M.; Giordano, R.; Padilla-Eguiluz, N.; et al. Feasibility and safety of treating non-unions in tibia, femur and humerus with autologous, expanded, bone marrow-derived mesenchymal stromal cells associated with biphasic calcium phosphate biomaterials in a multicentric, non-comparative trial. Biomaterials 2019, 196, 100–108. [Google Scholar] [CrossRef]
  10. Fiorentini, E.; Granchi, D.; Leonardi, E.; Baldini, N.; Ciapetti, G. Effects of Osteogenic Differentiation Inducers on in Vitro Expanded Adult Mesenchymal Stromal Cells. Int. J. Artif. Organs 2011, 34, 998–1011. [Google Scholar] [CrossRef]
  11. Lian, J.B.; Stein, G.S. Concepts of osteoblast growth and differentiation: Basis for modulation of bone cell development and tissue formation. Crit. Rev. Oral Biol. Med. 1992, 3, 269–305. [Google Scholar] [CrossRef] [PubMed] [Green Version]
  12. Rutkovskiy, A.; Stensløkken, K.O.; Vaage, I.J. Osteoblast Differentiation at a Glance. Med. Sci. Monit. Basic Res. 2016, 22, 95–106. [Google Scholar] [CrossRef] [PubMed] [Green Version]
  13. Li, B.; Menzel, U.; Loebel, C.; Schmal, H.; Alini, M.; Stoddart, M.J. Monitoring live human mesenchymal stromal cell differentiation and subsequent selection using fluorescent RNA-based probes. Sci. Rep. 2016, 6, 26014. [Google Scholar] [CrossRef] [Green Version]
  14. Lin, X.; Patil, S.; Gao, Y.-G.; Qian, A. The Bone Extracellular Matrix in Bone Formation and Regeneration. Front. Pharmacol. 2020, 11, 757. [Google Scholar] [CrossRef] [PubMed]
  15. Hoshiba, T.; Kawazoe, N.; Tateishi, T.; Chen, G. Development of stepwise osteogenesis-mimicking matrices for the regulation of mesenchymal stem cell functions. J. Biol. Chem. 2009, 284, 31164–31173. [Google Scholar] [CrossRef] [PubMed] [Green Version]
  16. Larsen, K.H.; Frederiksen, C.M.; Burns, J.S.; Abdallah, B.M.; Kassem, M. Identifying a molecular phenotype for bone marrow stromal cells with in vivo bone-forming capacity. J. Bone Min. Res. 2010, 25, 796–808. [Google Scholar]
  17. Zupan, J.; Tang, D.; Oreffo, R.O.C.; Redl, H.; Presen, D.M. Cell Engineering and Regeneration; Springer International Publishing: Berlin/Heidelberg, Germany, 2020; p. 139. [Google Scholar]
  18. Murgia, A.; Veronesi, E.; Candini, O.; Caselli, A.; D’Souza, N.; Rasini, V.; Giorgini, A.; Catani, F.; Iughetti, L.; Dominici, M.; et al. Potency Biomarker Signature Genes from Multiparametric Osteogenesis Assays: Will cGMP Human Bone Marrow Mesenchymal Stromal Cells Make Bone. PLoS ONE 2016, 11, e0163629. [Google Scholar] [CrossRef] [PubMed]
  19. Amărandi, R.M.; Becheru, D.F.; Vlăsceanu, G.M.; Ioniță, M.; Burns, J.S. Advantages of Graphene Biosensors for Human Stem Cell Therapy Potency Assays. Biomed. Res. Int. 2018, 2018, 1676851. [Google Scholar] [CrossRef]
  20. Halvorsen, Y.C.; Wilkison, W.O.; Gimble, J.M. Adipose-derived stromal cells—Their utility and potential in bone formation. Int. J. Obes. 2000, 24, S41–S44. [Google Scholar] [CrossRef] [Green Version]
  21. Shafiee, A.; Seyedjafari, E.; Soleimani, M.; Ahmadbeigi, N.; Dinarvand, P.; Ghaemi, N. A comparison between osteogenic differentiation of human unrestricted somatic stem cells and mesenchymal stem cells from bone marrow and adipose tissue. Biotechnol. Lett. 2011, 33, 1257–1264. [Google Scholar] [CrossRef]
  22. Strioga, M.; Viswanathan, S.; Darinskas, A.; Slaby, O.; Michalek, J. Same or not the same? Comparison of adipose tissue-derived versus bone marrow-derived mesenchymal stem and stromal cells. Stem Cells Dev. 2012, 21, 2724–2752. [Google Scholar] [CrossRef] [PubMed]
  23. Ciuffi, S.; Zonefrati, R.; Brandi, M.L. Adipose stem cells for bone tissue repair. Clin. Cases Miner. Bone Metab. 2017, 14, 217. [Google Scholar] [CrossRef] [PubMed]
  24. Alonso-Goulart, V.; Ferreira, L.B.; Duarte, C.A.; de Lima, I.L.; Ferreira, E.R.; de Oliveira, B.C.; Vargas, L.N.; de Moraes, D.D.; Silva, I.B.B.; de Oliveira Faria, R. Mesenchymal stem cells from human adipose tissue and bone repair: A literature review. Biotechnol. Res. Innov. 2018, 2, 74–80. [Google Scholar] [CrossRef]
  25. Mohamed-Ahmed, S.; Fristad, I.; Lie, S.A.; Suliman, S.; Mustafa, K.; Vindenes, H.; Idris, S.B. Adipose-derived and bone marrow mesenchymal stem cells: A donor-matched comparison. Stem Cell Res. 2018, 9, 168. [Google Scholar] [CrossRef]
  26. González-Bermúdez, L.; Anglada, T.; Genescà, A.; Martín, M.; Terradas, M. Identification of reference genes for RT-qPCR data normalisation in aging studies. Sci. Rep. 2019, 9, 13970. [Google Scholar] [CrossRef] [Green Version]
  27. Ragni, E.; Viganò, M.; Rebulla, P.; Giordano, R.; Lazzari, L. What is beyond a qRT-PCR study on mesenchymal stem cell differentiation properties: How to choose the most reliable housekeeping genes. J. Cell Mol. Med. 2013, 17, 168–180. [Google Scholar] [CrossRef]
  28. Christy, B.A.; Herzig, M.C.; Delavan, C.; Cantu, C.; Salgado, C.; Bynum, J.A.; Cap, A.P. Human primary fibroblasts perform similarly to MSCs in assays used to evaluate MSC safety and potency. Transfusion 2019, 59, 1593–1600. [Google Scholar] [CrossRef] [Green Version]
  29. Okajcekova, T.; Strnadel, J.; Pokusa, M.; Zahumenska, R.; Janickova, M.; Halasova, E.; Skovierova, H. A Comparative In Vitro Analysis of the Osteogenic Potential of Human Dental Pulp Stem Cells Using Various Differentiation Conditions. Int. J. Mol. Sci. 2020, 21, 2280. [Google Scholar] [CrossRef] [Green Version]
  30. Poniatowski, Ł.A.; Wojdasiewicz, P.; Gasik, R.; Szukiewicz, D. Transforming growth factor Beta family: Insight into the role of growth factors in regulation of fracture healing biology and potential clinical applications. Mediat. Inflamm. 2015, 2015, 137823. [Google Scholar] [CrossRef] [Green Version]
  31. Wu, M.; Chen, G.; Li, Y.P. TGF-β and BMP signaling in osteoblast, skeletal development, and bone formation, homeostasis and disease. Bone Res. 2016, 4, 16009. [Google Scholar] [CrossRef]
  32. Elsafadi, M.; Manikandan, M.; Almalki, S.; Mobarak, M.; Atteya, M.; Iqbal, Z.; Hashmi, J.A.; Shaheen, S.; Alajez, N.M.; Alfayez, M.; et al. TGFβ1-Induced Differentiation of Human Bone Marrow-Derived MSCs Is Mediated by Changes to the Actin Cytoskeleton. Stem Cells Int. 2018, 2018, 6913594. [Google Scholar] [CrossRef] [PubMed] [Green Version]
  33. Brennan, M.Á.; Renaud, A.; Amiaud, J.; Rojewski, M.T.; Schrezenmeier, H.; Heymann, D.; Trichet, V.; Layrolle, P. Pre-clinical studies of bone regeneration with human bone marrow stromal cells and biphasic calcium phosphate. Stem Cell Res. Ther. 2014, 5, 114. [Google Scholar] [CrossRef] [PubMed] [Green Version]
  34. Zuk, P.A.; Zhu, M.; Ashjian, P.; De Ugarte, D.A.; Huang, J.I.; Mizuno, H.; Alfonso, Z.C.; Fraser, J.K.; Benhaim, P.; Hedrick, M.H. Human adipose tissue is a source of multipotent stem cells. Mol. Biol. Cell 2002, 13, 4279–4295. [Google Scholar] [CrossRef] [PubMed]
  35. Puchtler, H.; Meloan, S.N.; Terry, M.S. On the history and mechanism of alizarin and alizarin red S stains for calcium. J. Histochem. Cytochem. 1969, 17, 110–124. [Google Scholar] [CrossRef]
  36. Meloan, S.N.; Puchtler, H. Chemical Mechanisms of Staining Methods: Von Kossa’s Technique: What von Kossa Really Wrote and a Modified Reaction for Selective Demonstration of Inorganic Phosphates. J. Histotechnol. 1985, 8, 11–13. [Google Scholar] [CrossRef]
  37. Chomczynski, P. A reagent for the single-step simultaneous isolation of RNA, DNA and proteins from cell and tissue samples. Biotechniques 1993, 15, 532–534; 536–537. [Google Scholar]
  38. Pfaffl, M.W.; Tichopad, A.; Prgomet, C.; Neuvians, T.P. Determination of stable housekeeping genes, differentially regulated target genes and sample integrity: BestKeeper--Excel-based tool using pair-wise correlations. Biotechnol. Lett. 2004, 26, 509–515. [Google Scholar] [CrossRef]
  39. Vandesompele, J.; De Preter, K.; Pattyn, F.; Poppe, B.; Van Roy, N.; De Paepe, A.; Speleman, F. Accurate normalization of real-time quantitative RT-PCR data by geometric averaging of multiple internal control genes. Genome. Biol. 2002, 3, RESEARCH0034. [Google Scholar] [CrossRef] [Green Version]
  40. Abdallah, B.M.; Ditzel, N.; Kassem, M. Assessment of bone formation capacity using in vivo transplantation assays: Procedure and tissue analysis. Methods Mol. Biol. 2008, 455, 89–100. [Google Scholar]
  41. Burrow, K.L.; Hoyland, J.A.; Richardson, S.M. Human adipose-derived stem cells exhibit enhanced proliferative capacity and retain multipotency longer than donor-matched bone marrow mesenchymal stem cells during expansion in vitro. Stem Cells Int. 2017, 2017, 1–15. [Google Scholar] [CrossRef]
  42. Amable, P.R.; Teixeira, M.V.; Carias, R.B.; Granjeiro, J.M.; Borojevic, R. Identification of appropriate reference genes for human mesenchymal cells during expansion and differentiation. PLoS ONE 2013, 8, e73792. [Google Scholar] [CrossRef] [PubMed] [Green Version]
  43. Tajadini, M.; Panjehpour, M.; Javanmard, S.H. Comparison of SYBR Green and TaqMan methods in quantitative real-time polymerase chain reaction analysis of four adenosine receptor subtypes. Adv. Biomed. Res. 2014, 3, 85. [Google Scholar] [CrossRef] [PubMed]
  44. Maruelli, S.; Besio, R.; Rousseau, J.; Garibaldi, N.; Amiaud, J.; Brulin, B.; Layrolle, P.; Escriou, V.; Rossi, A.; Trichet, V.; et al. Osteoblasts mineralization and collagen matrix are conserved upon specific Col1a2 silencing. Matrix Biol. Plus 2020, 6–7, 100028. [Google Scholar] [CrossRef]
  45. Karamboulas, K.; Dranse, H.J.; Underhill, T.M. Regulation of BMP-dependent chondrogenesis in early limb mesenchyme by TGFbeta signals. J. Cell Sci. 2010, 123, 2068–2076. [Google Scholar] [CrossRef] [PubMed] [Green Version]
  46. Patrikoski, M.; Mannerström, B.; Miettinen, S. Perspectives for Clinical Translation of Adipose Stromal/Stem Cells. Stem Cells Int. 2019, 2019, 5858247. [Google Scholar] [CrossRef] [Green Version]
  47. Ntege, E.H.; Sunami, H.; Shimizu, Y. Advances in regenerative therapy: A review of the literature and future directions. Regen. Ther. 2020, 14, 136–153. [Google Scholar] [CrossRef]
  48. Liu, S.; De Castro, L.F.; Jin, P.; Civini, S.; Ren, J.; Reems, J.-A.; Cancelas, J.; Nayak, R.; Shaw, G.; O’Brien, T.; et al. Manufacturing Differences Affect Human Bone Marrow Stromal Cell Characteristics and Function: Comparison of Production Methods and Products from Multiple Centers. Sci. Rep. 2017, 7, 46731. [Google Scholar] [CrossRef]
  49. Phinney, D.G.; Kopen, G.; Righter, W.; Webster, S.; Tremain, N.; Prockop, D.J. Donor variation in the growth properties and osteogenic potential of human marrow stromal cells. J. Cell Biochem. 1999, 75, 424–436. [Google Scholar] [CrossRef]
  50. Ambrosi, T.H.; Longaker, M.T.; Chan, C.K.F. A Revised Perspective of Skeletal Stem Cell Biology. Front. Cell Dev. Biol. 2019, 7, 189. [Google Scholar] [CrossRef] [Green Version]
  51. Mastrolia, I.; Foppiani, E.M.; Murgia, A.; Candini, O.; Samarelli, A.V.; Grisendi, G.; Veronesi, E.; Horwitz, E.M.; Dominici, M. Challenges in Clinical Development of Mesenchymal Stromal/Stem Cells: Concise Review. Stem Cells Transl. Med. 2019, 8, 1135–1148. [Google Scholar] [CrossRef] [Green Version]
  52. Nakamura, T.; Nakamura-Takahashi, A.; Kasahara, M.; Yamaguchi, A.; Azuma, T. Tissue-nonspecific alkaline phosphatase promotes the osteogenic differentiation of osteoprogenitor cells. Biochem. Biophys. Res. Commun. 2020, 524, 702–709. [Google Scholar] [CrossRef] [PubMed]
  53. Vimalraj, S. Alkaline phosphatase: Structure, expression and its function in bone mineralization. Gene 2020, 754, 144855. [Google Scholar] [CrossRef] [PubMed]
  54. Hempel, U.; Müller, K.; Preissler, C.; Noack, C.; Boxberger, S.; Dieter, P.; Bornhäuser, M.; Wobus, M. Human Bone Marrow Stromal Cells: A Reliable, Challenging Tool for In Vitro Osteogenesis and Bone Tissue Engineering Approaches. Stem Cells Int. 2016, 2016, 7842191. [Google Scholar] [CrossRef] [PubMed] [Green Version]
  55. Augusciak-Duma, A.; Witecka, J.; Sieron, A.L.; Janeczko, M.; Pietrzyk, J.J.; Ochman, K.; Galicka, A.; Borszewska-Kornacka, M.K.; Pilch, J.; Jakubowska-Pietkiewicz, E. Mutations in the COL1A1 and COL1A2 genes associated with osteogenesis imperfecta (OI) types I or III. Acta Biochim. Pol. 2018, 65, 79–86. [Google Scholar] [CrossRef] [PubMed] [Green Version]
  56. Gorski, J.P.; Hankenson, K.D. Principles of Bone Biology; Elsevier: Amsterdam, The Netherlands, 2020; p. 359. [Google Scholar]
  57. Hoshi, K.; Kemmotsu, S.; Takeuchi, Y.; Amizuka, N.; Ozawa, H. The primary calcification in bones follows removal of decorin and fusion of collagen fibrils. J. Bone Min. Res. 1999, 14, 273–280. [Google Scholar] [CrossRef]
  58. Horiguchi, M.; Ota, M.; Rifkin, D.B. Matrix control of transforming growth factor-β function. J. Biochem. 2012, 152, 321–329. [Google Scholar] [CrossRef] [Green Version]
  59. Kuçi, S.; Kuçi, Z.; Schäfer, R.; Spohn, G.; Winter, S.; Schwab, M.; Salzmann-Manrique, E.; Klingebiel, T.; Bader, P. Molecular signature of human bone marrow-derived mesenchymal stromal cell subsets. Sci. Rep. 2019, 9, 1774. [Google Scholar] [CrossRef] [Green Version]
  60. Thiagarajan, L.; Abu-Awwad, H.A.-D.M.; Dixon, J.E. Osteogenic Programming of Human Mesenchymal Stem Cells with Highly Efficient Intracellular Delivery of RUNX2. Stem Cells Transl. Med. 2017, 6, 2146–2159. [Google Scholar] [CrossRef]
  61. Komori, T. Regulation of Proliferation, Differentiation and Functions of Osteoblasts by Runx2. Int. J. Mol. Sci. 2019, 20, 1694. [Google Scholar] [CrossRef] [Green Version]
  62. Boxall, S.A.; Jones, E. Markers for characterization of bone marrow multipotential stromal cells. Stem Cells Int. 2012, 2012, 1–12. [Google Scholar] [CrossRef] [Green Version]
  63. Antebi, B.; Asher, A.M.; Rodriguez, L.A.; Moore, R.K.; Mohammadipoor, A.; Cancio, L.C. Cryopreserved mesenchymal stem cells regain functional potency following a 24-h acclimation period. J. Transl. Med. 2019, 17, 1–13. [Google Scholar] [CrossRef] [PubMed] [Green Version]
  64. Chevallier, N.; Anagnostou, F.; Zilber, S.; Bodivit, G.; Maurin, S.; Barrault, A.; Bierling, P.; Hernigou, P.; Layrolle, P.; Rouard, H. Osteoblastic differentiation of human mesenchymal stem cells with platelet lysate. Biomaterials 2010, 31, 270–278. [Google Scholar] [CrossRef] [PubMed]
  65. Shansky, Y.D.; Sergeeva, N.S.; Sviridova, I.K.; Karalkin, P.A.; Kirsanova, V.A.; Akhmedova, S.A.; Fomicheva, K.A.; Shkurnikov, M.Y.; Portyannikova, A.Y.; Kaprin, A.D. Human Platelet Lysate Sustains the Osteogenic/Adipogenic Differentiation Potential of Adipose-Derived Mesenchymal Stromal Cells and Maintains Their DNA Integrity in vitro. Cells Tissues Organs 2019, 207, 149–164. [Google Scholar] [CrossRef] [PubMed]
  66. Turinetto, V.; Vitale, E.; Giachino, C. Senescence in Human Mesenchymal Stem Cells: Functional Changes and Implications in Stem Cell-Based Therapy. Int. J. Mol. Sci. 2016, 17, 1164. [Google Scholar] [CrossRef]
  67. Li, X.; Yang, Q.; Bai, J.; Xuan, Y.; Wang, Y. Identification of appropriate reference genes for human mesenchymal stem cell analysis by quantitative real-time PCR. Biotechnol. Lett. 2015, 37, 67–73. [Google Scholar] [CrossRef] [Green Version]
  68. Burns, J.S.; Rasmussen, P.L.; Larsen, K.H.; Schroder, H.D.; Kassem, M. Parameters in three-dimensional osteospheroids of telomerized human mesenchymal (stromal) stem cells grown on osteoconductive scaffolds that predict in vivo bone-forming potential. Tissue Eng. Part A 2010, 16, 2331–2342. [Google Scholar] [CrossRef]
  69. Jeon, R.H.; Lee, W.J.; Son, Y.B.; Bharti, D.; Shivakumar, S.B.; Lee, S.L.; Rho, G.J. PPIA, HPRT1, and YWHAZ Genes Are Suitable for Normalization of mRNA Expression in Long-Term Expanded Human Mesenchymal Stem Cells. Biomed. Res. Int. 2019, 2019, 3093545. [Google Scholar] [CrossRef]
  70. Ayanoğlu, F.B.; Elçin, A.E.; Elçin, Y.M. Evaluation of the stability of standard reference genes of adipose-derived mesenchymal stem cells during in vitro proliferation and differentiation. Mol. Biol. Rep. 2020, 47, 2109–2122. [Google Scholar] [CrossRef]
  71. Bustin, S.A.; Benes, V.; Garson, J.; Hellemans, J.; Huggett, J.F.; Kubista, M.; Mueller, R.; Nolan, T.; Pfaffl, M.W.; Shipley, G.L.; et al. The MIQE guidelines: Minimum information for publication of quantitative real-time PCR experiments. Clin. Chem. 2009, 55, 611–622. [Google Scholar] [CrossRef] [Green Version]
  72. Kowal, J.M.; Schmal, H.; Halekoh, U.; Hjelmborg, J.B.; Kassem, M. Single-cell high content imaging parameters predict functional phenotype of cultured human bone marrow stromal stem cells. Stem Cells Transl. Med. 2019, 9, 189–202. [Google Scholar] [CrossRef] [Green Version]
  73. Robb, K.P.; Fitzgerald, J.C.; Barry, F.; Viswanathan, S. Mesenchymal stromal cell therapy: Progress in manufacturing and assessments of potency. Cytotherapy 2019, 21, 289–306. [Google Scholar] [CrossRef] [PubMed]
  74. Christy, B.A.; Herzig, M.C.; Delavan, C.P.; Abaasah, I.; Cantu, C.; Salgado, C.; Lovelace, S.; Garcia, L.; Jensen, K.; Montgomery, R.; et al. Use of multiple potency assays to evaluate human mesenchymal stromal cells. J. Trauma Acute Care Surg. 2020, 89, S109–S117. [Google Scholar] [CrossRef] [PubMed]
  75. Rebelatto, C.K.; Aguiar, A.M.; Moretão, M.P.; Senegaglia, A.C.; Hansen, P.; Barchiki, F.; Oliveira, J.M.; Martins, J.; Kuligovski, C.; Mansur, F.; et al. Dissimilar differentiation of mesenchymal stem cells from bone marrow, umbilical cord blood, and adipose tissue. Exp. Biol. Med. 2008, 233, 901–913. [Google Scholar] [CrossRef] [PubMed]
  76. Yang, Y.-H.K.; Ogando, C.R.; Wang See, C.; Chang, T.-Y.; Barabino, G.A. Changes in phenotype and differentiation potential of human mesenchymal stem cells aging in vitro. Stem Cell Res. Ther. 2018, 9, 1–14. [Google Scholar] [CrossRef] [Green Version]
  77. Christodoulou, I.; Kolisis, F.N.; Papaevangeliou, D.; Zoumpourlis, V. Comparative evaluation of human mesenchymal stem cells of fetal (Wharton’s jelly) and adult (adipose tissue) origin during prolonged in vitro expansion: Considerations for cytotherapy. Stem Cells Int. 2013, 2013, 1–12. [Google Scholar] [CrossRef] [Green Version]
  78. Prins, H.J.; Rozemuller, H.; Vonk-Griffioen, S.; Verweij, V.G.; Dhert, W.J.; Slaper-Cortenbach, I.C.; Martens, A.C. Bone-forming capacity of mesenchymal stromal cells when cultured in the presence of human platelet lysate as substitute for fetal bovine serum. Tissue Eng. Part A 2009, 15, 3741–3751. [Google Scholar] [CrossRef]
  79. Ahmed, E.; Ziada, H.; Soliman, M.; El-Mezayen, H.; Hamed, S. Comparing the osteogenic potency of mesenchymal stem cells derived from bone marrow and adipose tissue. Stem Cell Adv. Res. Ther. 2020. [Google Scholar] [CrossRef]
  80. Janicki, P.; Boeuf, S.; Steck, E.; Egermann, M.; Kasten, P.; Richter, W. Prediction of in vivo bone forming potency of bone marrow-derived human mesenchymal stem cells. Eur. Cell Mater. 2011, 21, 488–507. [Google Scholar] [CrossRef]
  81. Sproul, E.P.; Argraves, W.S. A cytokine axis regulates elastin formation and degradation. Matrix Biol. 2013, 32, 86–94. [Google Scholar] [CrossRef]
  82. Sudo, R.; Sato, F.; Azechi, T.; Wachi, H. MiR-29-mediated elastin down-regulation contributes to inorganic phosphorus-induced osteoblastic differentiation in vascular smooth muscle cells. Genes Cells 2015, 20, 1077–1087. [Google Scholar] [CrossRef] [Green Version]
  83. Lee, S.J.; Kang, S.W.; Do, H.J.; Han, I.; Shin, D.A.; Kim, J.H.; Lee, S.H. Enhancement of bone regeneration by gene delivery of BMP2/Runx2 bicistronic vector into adipose-derived stromal cells. Biomaterials 2010, 31, 5652–5659. [Google Scholar] [CrossRef] [PubMed]
  84. Shui, C.; Spelsberg, T.C.; Riggs, B.L.; Khosla, S. Changes in Runx2/Cbfa1 expression and activity during osteoblastic differentiation of human bone marrow stromal cells. J. Bone Miner. Res. 2003, 18, 213–221. [Google Scholar] [CrossRef] [PubMed]
  85. Sanford, L.P.; Ormsby, I.; Gittenberger-de Groot, A.C.; Sariola, H.; Friedman, R.; Boivin, G.P.; Cardell, E.L.; Doetschman, T. TGFbeta2 knockout mice have multiple developmental defects that are non-overlapping with other TGFbeta knockout phenotypes. Development 1997, 124, 2659–2670. [Google Scholar] [PubMed]
  86. Hering, S.; Isken, E.; Knabbe, C.; Janott, J.; Jost, C.; Pommer, A.; Muhr, G.; Schatz, H.; Pfeiffer, A.F. TGFbeta1 and TGFbeta2 mRNA and protein expression in human bone samples. Exp. Clin. Endocrinol. Diabetes 2001, 109, 217–226. [Google Scholar] [CrossRef] [PubMed]
  87. Kazimierczak, P.; Syta, E.; Przekora, A.; Ginalska, G. Comparison of osteogenic differentiation ability between bone marrow-derived mesenchymal stem cells and adipose tissue-derived mesenchymal stem cells. Med. Ogólna Nauk. Zdrowiu 2018, 24, 101–106. [Google Scholar] [CrossRef]
  88. Noël, D.; Caton, D.; Roche, S.; Bony, C.; Lehmann, S.; Casteilla, L.; Jorgensen, C.; Cousin, B. Cell specific differences between human adipose-derived and mesenchymal-stromal cells despite similar differentiation potentials. Exp. Cell Res. 2008, 314, 1575–1584. [Google Scholar] [CrossRef]
  89. Kulterer, B.; Friedl, G.; Jandrositz, A.; Sanchez-Cabo, F.; Prokesch, A.; Paar, C.; Scheideler, M.; Windhager, R.; Preisegger, K.H.; Trajanoski, Z. Gene expression profiling of human mesenchymal stem cells derived from bone marrow during expansion and osteoblast differentiation. BMC Genom. 2007, 8, 70. [Google Scholar] [CrossRef] [Green Version]
  90. Gubbiotti, M.A.; Vallet, S.D.; Ricard-Blum, S.; Iozzo, R.V. Decorin interacting network: A comprehensive analysis of decorin-binding partners and their versatile functions. Matrix Biol. 2016, 55, 7–21. [Google Scholar] [CrossRef]
  91. Hildebrand, A.; Romarís, M.; Rasmussen, L.M.; Heinegård, D.; Twardzik, D.R.; Border, W.A.; Ruoslahti, E. Interaction of the small interstitial proteoglycans biglycan, decorin and fibromodulin with transforming growth factor beta. Biochem. J. 1994, 302, 527–534. [Google Scholar] [CrossRef]
  92. Markmann, A.; Hausser, H.; Schönherr, E.; Kresse, H. Influence of decorin expression on transforming growth factor-beta-mediated collagen gel retraction and biglycan induction. Matrix Biol. 2000, 19, 631–636. [Google Scholar] [CrossRef]
  93. Ferdous, Z.; Wei, V.M.; Iozzo, R.; Höök, M.; Grande-Allen, K.J. Decorin-transforming growth factor- interaction regulates matrix organization and mechanical characteristics of three-dimensional collagen matrices. J. Biol. Chem. 2007, 282, 35887–35898. [Google Scholar] [CrossRef] [PubMed] [Green Version]
  94. Goetsch, K.P.; Niesler, C.U. The extracellular matrix regulates the effect of decorin and transforming growth factor beta-2 (TGF-β2) on myoblast migration. Biochem. Biophys. Res. Commun. 2016, 479, 351–357. [Google Scholar] [CrossRef] [PubMed]
  95. Schönherr, E.; Broszat, M.; Brandan, E.; Bruckner, P.; Kresse, H. Decorin core protein fragment Leu155-Val260 interacts with TGF-β but does not compete for decorin binding to type I collagen. Arch. Biochem. Biophys. 1998, 355, 241–248. [Google Scholar] [CrossRef]
  96. Erlebacher, A.; Derynck, R. Increased expression of TGF-beta 2 in osteoblasts results in an osteoporosis-like phenotype. J. Cell Biol. 1996, 132, 195–210. [Google Scholar] [CrossRef] [PubMed] [Green Version]
  97. Banfi, A.; Muraglia, A.; Dozin, B.; Mastrogiacomo, M.; Cancedda, R.; Quarto, R. Proliferation kinetics and differentiation potential of ex vivo expanded human bone marrow stromal cells: Implications for their use in cell therapy. Exp. Hematol. 2000, 28, 707–715. [Google Scholar] [CrossRef]
  98. Liu, J.; Ding, Y.; Liu, Z.; Liang, X. Senescence in Mesenchymal Stem Cells: Functional Alterations, Molecular Mechanisms, and Rejuvenation Strategies. Front. Cell Dev. Biol. 2020, 8, 258. [Google Scholar] [CrossRef] [PubMed]
  99. Kawamura, H.; Nakatsuka, R.; Matsuoka, Y.; Sumide, K.; Fujioka, T.; Asano, H.; Iida, H.; Sonoda, Y. TGF-β Signaling Accelerates Senescence of Human Bone-Derived CD271 and SSEA-4 Double-Positive Mesenchymal Stromal Cells. Stem Cell Rep. 2018, 10, 920–932. [Google Scholar] [CrossRef] [Green Version]
  100. Walenda, G.; Abnaof, K.; Joussen, S.; Meurer, S.; Smeets, H.; Rath, B.; Hoffmann, K.; Fröhlich, H.; Zenke, M.; Weiskirchen, R.; et al. TGF-beta1 does not induce senescence of multipotent mesenchymal stromal cells and has similar effects in early and late passages. PLoS ONE 2013, 8, e77656. [Google Scholar] [CrossRef] [Green Version]
  101. Gibaja, A.; Aburto, M.R.; Pulido, S.; Collado, M.; Hurle, J.M.; Varela-Nieto, I.; Magariños, M. TGFβ2-induced senescence during early inner ear development. Sci. Rep. 2019, 9, 5912. [Google Scholar] [CrossRef] [Green Version]
  102. Schellenberg, A.; Mauen, S.; Koch, C.M.; Jans, R.; de Waele, P.; Wagner, W. Proof of principle: Quality control of therapeutic cell preparations using senescence-associated DNA-methylation changes. BMC Res. Notes 2014, 7, 254. [Google Scholar] [CrossRef] [Green Version]
  103. de Almeida, D.C.; Ferreira, M.R.; Franzen, J.; Weidner, C.I.; Frobel, J.; Zenke, M.; Costa, I.G.; Wagner, W. Epigenetic Classification of Human Mesenchymal Stromal Cells. Stem Cell Rep. 2016, 6, 168–175. [Google Scholar] [CrossRef] [PubMed] [Green Version]
  104. Mankani, M.H.; Kuznetsov, S.A.; Marshall, G.W.; Robey, P.G. Creation of new bone by the percutaneous injection of human bone marrow stromal cell and HA/TCP suspensions. Tissue Eng. Part A 2008, 14, 1949–1958. [Google Scholar] [CrossRef] [PubMed]
  105. Haffner-Luntzer, M.; Kovtun, A.; Rapp, A.E.; Ignatius, A. Mouse Models in Bone Fracture Healing Research. Curr. Mol. Biol. Rep. 2016, 2, 101–111. [Google Scholar] [CrossRef] [Green Version]
  106. Samsonraj, R.M.; Rai, B.; Sathiyanathan, P.; Puan, K.J.; Rötzschke, O.; Hui, J.H.; Raghunath, M.; Stanton, L.W.; Nurcombe, V.; Cool, S.M. Establishing criteria for human mesenchymal stem cell potency. Stem Cells 2015, 33, 1878–1891. [Google Scholar] [CrossRef]
  107. Xiao, B.; Wang, G.; Li, W. Weighted gene correlation network analysis reveals novel biomarkers associated with mesenchymal stromal cell differentiation in early phase. PeerJ 2020, 8, e8907. [Google Scholar] [CrossRef] [Green Version]
  108. Sathiyanathan, P.; Samsonraj, R.M.; Tan, C.L.L.; Ling, L.; Lezhava, A.; Nurcombe, V.; Stanton, L.W.; Cool, S.M. A genomic biomarker that identifies human bone marrow-derived mesenchymal stem cells with high scalability. Stem Cells 2020. [Google Scholar] [CrossRef]
  109. Tsai, A.-C.; Jeske, R.; Chen, X.; Yuan, X.; Li, Y. Influence of Microenvironment on Mesenchymal Stem Cell Therapeutic Potency: From Planar Culture to Microcarriers. Front. Bioeng. Biotechnol. 2020, 8, 640. [Google Scholar] [CrossRef]
Figure 1. Schematic diagrams of: (A) A therapeutic approach for non-union bone fractures applying autologous bone marrow (BM) derived human multipotent stromal cells (hMSC) derived and expanded in culture for 3 weeks under current Good Manufacturing Practice (cGMP). Expanded cell cultures reaching a therapeutic dose were combined with osteogenic scaffold granules at point of care, with a view to promoting hBM-MSC osteogenic differentiation and improved bone fracture healing. (B) Our preclinical stage studies involved expansion of bone marrow derived (hBM-MSC) and adipose tissue derived (hAT-MSC) from frozen primary cell stocks, seeded in monolayer culture flasks, maintained in grow medium until near-confluence before serial passage into flasks. Since off-site in vivo experiments required frozen vial transport, congruence was maintained by introducing a cell freezing step before transferring cells to multi-well plates for treatment with osteogenic induction medium. Osteogenic differentiation was assessed by Alizarin Red S (ALZ) and Von Kossa (VK) staining to detect biomineralization at 7, 14 and 21 days, whilst parallel cultures were in osteogenic induction medium for 1 and 2 weeks before harvesting mRNA for quantified real-time PCR analysis of osteogenic signature gene induction relative to non-induced control cells.
Cells 09 02559 g001
Figure 2. Growth curve of hBM-MSC and hAT-MSC expansion in culture showing cumulative population doubling (PD) between successive passages before experimental analysis. Donor #1 cells showed late-stage slow growth (* p < 0.05).
Cells 09 02559 g002
Figure 3. Representative photomicrographs of (A) hBM-MSC and (B) hAT-MSC grown in maintenance medium (MM) or treated with osteogenic medium (OM) to induce extracellular matrix biomineralization, detected using Alizarin Red S (ALZ) or Von Kossa (VK) stains at 1-, 2- and 3-week time points.
Cells 09 02559 g003
Figure 4. Inter-donor heterogeneity of quantified Alizarin red S staining of hMSC derived from donors #1–#9 treated with osteogenic medium for (A) 7, (B) 14 or (C) 21 days.
Cells 09 02559 g004
Figure 5. Inter-donor heterogeneity for fold increase in osteogenic signature gene induction against corresponding non-induced hMSC derived from donors #1–#9 detected by the SYBR Green method. Histograms of column (A) indicate the level of named gene upregulation in response to osteogenic medium treatment for 7 days (black bars) or 14 days (grey bars). Histograms of column (B) indicates the ratio between fold increase values at two weeks (2W) and one week (1W). Interpolation used GUSB/YWAHZ reference genes. Inter-assay variability is shown by error bars indicating the pooled coefficient of variation (p < 0.05).
Cells 09 02559 g005
Figure 6. Inter-donor heterogeneity for fold increase in osteogenic signature gene induction against corresponding non-induced hMSC derived from donors #1–#9 detected by the TaqMan™ method measured at (A) 1 week and (B) 2 weeks. (C) Close parity for gene induction at the 1- and 2-week time points resulted in most gene induction ratios being close to one. Interpolation used GUSB/YWAHZ reference genes. Inter-assay variability is shown by error bars indicating the pooled coefficient of variation.
Cells 09 02559 g006
Figure 7. Cross-laboratory comparison of dendrograms from cluster analysis restricted to the five named osteogenic signature genes derived from (A) data from Murgia et al., 2016, using an ACTB reference gene, (B) our data using an ACTB reference gene or (C) our data using the GUSB/YWAHZ reference gene pair.
Cells 09 02559 g007
Figure 8. Inter-donor heterogeneity for fold increase in TGFB2 gene induction versus corresponding non-induced hMSC control cells derived from donors #1–#9. (A) Gene upregulation in response to osteogenic medium treatment for one week (1 W) (black bars) or two weeks (2 W) (grey bars). Error bars indicate the pooled coefficient of variation. (B) The fold-induction ratio for values at one or two weeks post induction. Interpolation used the GUSB/YWAHZ reference gene pair. Independent t-test between hBM-MSC and hAT-MSC groups * p < 0.05.
Cells 09 02559 g008
Figure 9. Histological analysis of inter-donor heterogeneity for in vivo osteogenic differentiation of hMSC derived from hBM-MSC donors #2–#6 and hAT-MSC donors #7–#9 implanted for 8 weeks with HA/βTCP scaffold (s) stained for osteoid/bone (*) with GT (Gomori’s trichrome stain). Negative control (NC) sections involved scaffold implants without human cells. Peroxidase immunohistochemical staining (brown) detected cells positive for the nuclear transcription factor RUNX2 (up arrow), Osteopontin (right arrow), human-specific decorin that densely stained cells from bone-forming donors (left arrow) and TGF-β2 protein that was diffusely present in the extracellular matrix of bone-forming cells and more distinctly stained the matrix of non-bone-forming (down arrow).
Cells 09 02559 g009
Figure 10. Prospective identification of osteogenic potency derived from (A) the inter-donor heterogeneity for fold-induction of gene expression for DCN and TGFB2 after one week of osteoinduction, tracing an inverse correlation expression pattern across the hMSC derived from donors #1 to #9, allowing (B) a correlative plot between these two genes discriminating non-bone-forming hMSC (red zone) versus bone-forming hMSC (green zone). (C) Dendrogram of Euclidian cluster analysis for all donors using gene induction data from DCN and TGFB2.
Cells 09 02559 g010
Table 1. Primer sequences for SYBR Green real-time PCR.
Gene NamePrimer SequenceAmplified Length (bp)
Alkaline phosphatase (ALPL)5’-GATGTGGAGTATGAGAGTGACG-3’ (sense)
5’-GGTCAAGGGTCAGGAGTTC-3’ (antisense)
142
Collagen type I, alpha 1 (COL1A2)5’-AGGACAAGAAACACGTCTGG-3’ (sense)
5’-GGTGATGTTCTGAGAGGCATAG-3’ (antisense)
146
Decorin (DCN)5’-AAAATGCCCAAAACTCTTCAGG-3’ (sense)
5’-GCCCCATTTTCAATTCCTGAG-3’ (antisense)
146
Elastin (ELN)5’-CCTGGCTTCGGATTGTCTC-3’ (sense)
5’-CAAAGGGTTTACATTCTCCACC-3’ (antisense)
148
Runt related transcription factor 2 (RUNX2)5’-TTCACCTTGACCATAACCGTC-3’ (sense)
5’-GGCGGTCAGAGAACAAACTAG-3’ (antisense)
148
Transforming growth factor beta 2 (TGFB2)5’-CAAAATAGACATGCCGCCCTTC-3’ (sense)
5’-GAAGGGCGGCATGTCTATTTTG-3’ (antisense)
150
Actin beta (ACTB)5’-ACCTTCTACAATGAGCTGCG-3’ (sense)
5’-CCTGGATAGCAACGTACATGG-3’ (antisense)
148
Glucuronidase beta (GUSB)5’-CCAAGGGTTACTTTGTCCAGA-3’ (sense)
5’-TAATTCACCAGCCCACTGTC-3’ (antisense)
151
Tyrosine 3 monooxygenase/tryptophan 5-monooxygenase activation protein zeta (YWHAZ)5’-TGACAAGAAAGGGATTGTCGAT-3’ (sense)
5’-TCTGGGGAGTTCAGAATCTCAT-3’ (antisense)
150
Table 2. TaqMan Real-Time qPCR Gene expression assays details.
Gene NameProtein Function/Gene GroupTaqMan Assay
Alkaline phosphatase (ALPL)Phosphatase (bone marker, gene of interest)Hs01029144_m1
Collagen type I, alpha 1 (COL1A2)Extracellular matrix structural protein (bone marker, gene of interest)Hs01028956_m1
Decorin (DCN)Collagen associated proteoglycan (bone marker, gene of interest)Hs00370385_m1
Elastin (ELN)Extracellular matrix structural protein (bone marker, gene of interest)Hs00355783_m1
Runt related transcription factor 2 (RUNX2)Transcription factor (bone marker, gene of interest)Hs01047973_m1
Actin beta (ACTB)Structural protein (housekeeping gene/control)Hs99999903_m1
Glucuronidase beta (GUSB)Lysosomal enzyme (housekeeping gene/control)Hs00939627_m1
Tyrosine 3-monooxygenase/tryptophan 5-monooxygenase activation protein zeta (YWHAZ)Signalling pathway protein (housekeeping gene/control)Hs00237047_m1
Table 3. Overview of the number of hMSC passages in vitro and osteogenesis in vivo.
DonorMSC SourcePassage of Cryopreserved hMSC (n)Passage
Number for In Vitro
mRNA Harvest
Passage Number before In Vivo
Heterotopic Implantation
Previously Quantified In Vivo Heterotopic Osteoid/Bone (%)
([18])
Bone Formation
In Vivo
(Present Study)
#1BM58915.3ND †
#2BM47818.8yes
#3BM47818.1yes
#4BM3670.1no
#5BM1565.4no
#6BM36715.3yes
#7AT145NDyes
#8AT589NDyes
#9AT478NDyes
† Not Determined.
Table 4. Comparative Median Absolute Dispersion (MAD) analysis of reference genes ACTB, GUSB, YWAHZ.
SYBRMAD 1WA/G/YA/GA/YG/YAGY
ALPL4.5464.7516.0076.0077.1841.5083.412
COL1A26.9446.8546.7786.9736.7036.9977.127
DCN13.8259.34314.5233.28431.2502.79212.863
ELN7.3917.3927.3907.3895.7465.7496.934
RUNX25.1985.6615.1465.4069.8371.7594.441
TGFΒ26.3646.5086.4386.2993.7545.1255.087
AVERAGE MAD7.3786.7527.7145.89310.7463.9886.644
MAD 2WA/G/YA/GA/YG/YAGY
ALPL5.2648.5233.3514.1125.3880.8284.661
COL1A211.57511.62311.46411.64111.16711.38311.640
DCN21.2859.01822.6875.13229.0624.57615.944
ELN11.90811.90811.90611.9099.4909.49511.452
RUNX210.71711.06510.06911.0207.5477.69710.116
TGFΒ28.9669.05010.5419.6338.1347.26110.001
AVERAGE MAD11.61910.19811.6708.90811.7986.87410.636
TaqManMAD 1WA/G/YA/GA/YG/YAGY
ALPL2.8793.5533.5533.5535.1354.1133.899
COL1A25.5305.5465.5465.5985.3015.6845.490
DCN13.71011.98411.98412.32220.3116.78219.807
ELN5.9615.9625.9625.9625.9635.9645.960
RUNX24.5644.6164.6165.0544.2765.3554.765
AVERAGE MAD6.5296.3326.3326.4988.1975.5807.984
MAD 2WA/G/YA/GA/YG/YAGY
ALPL3.4792.8173.1924.2495.9864.5744.527
COL1A26.3646.3746.2476.4096.0066.5156.305
DCN9.4468.63614.3527.31621.3724.21710.651
ELN6.7036.7046.7026.7046.7056.7066.704
RUNX25.6705.2675.2435.8134.7775.9885.379
AVERAGE MAD6.3325.9597.1476.0988.9695.6006.713
Publisher’s Note: MDPI stays neutral with regard to jurisdictional claims in published maps and institutional affiliations.

