
Development of a Laser Microdissection-Coupled Quantitative Shotgun Lipidomic Method to Uncover Spatial Heterogeneity
 , , , and
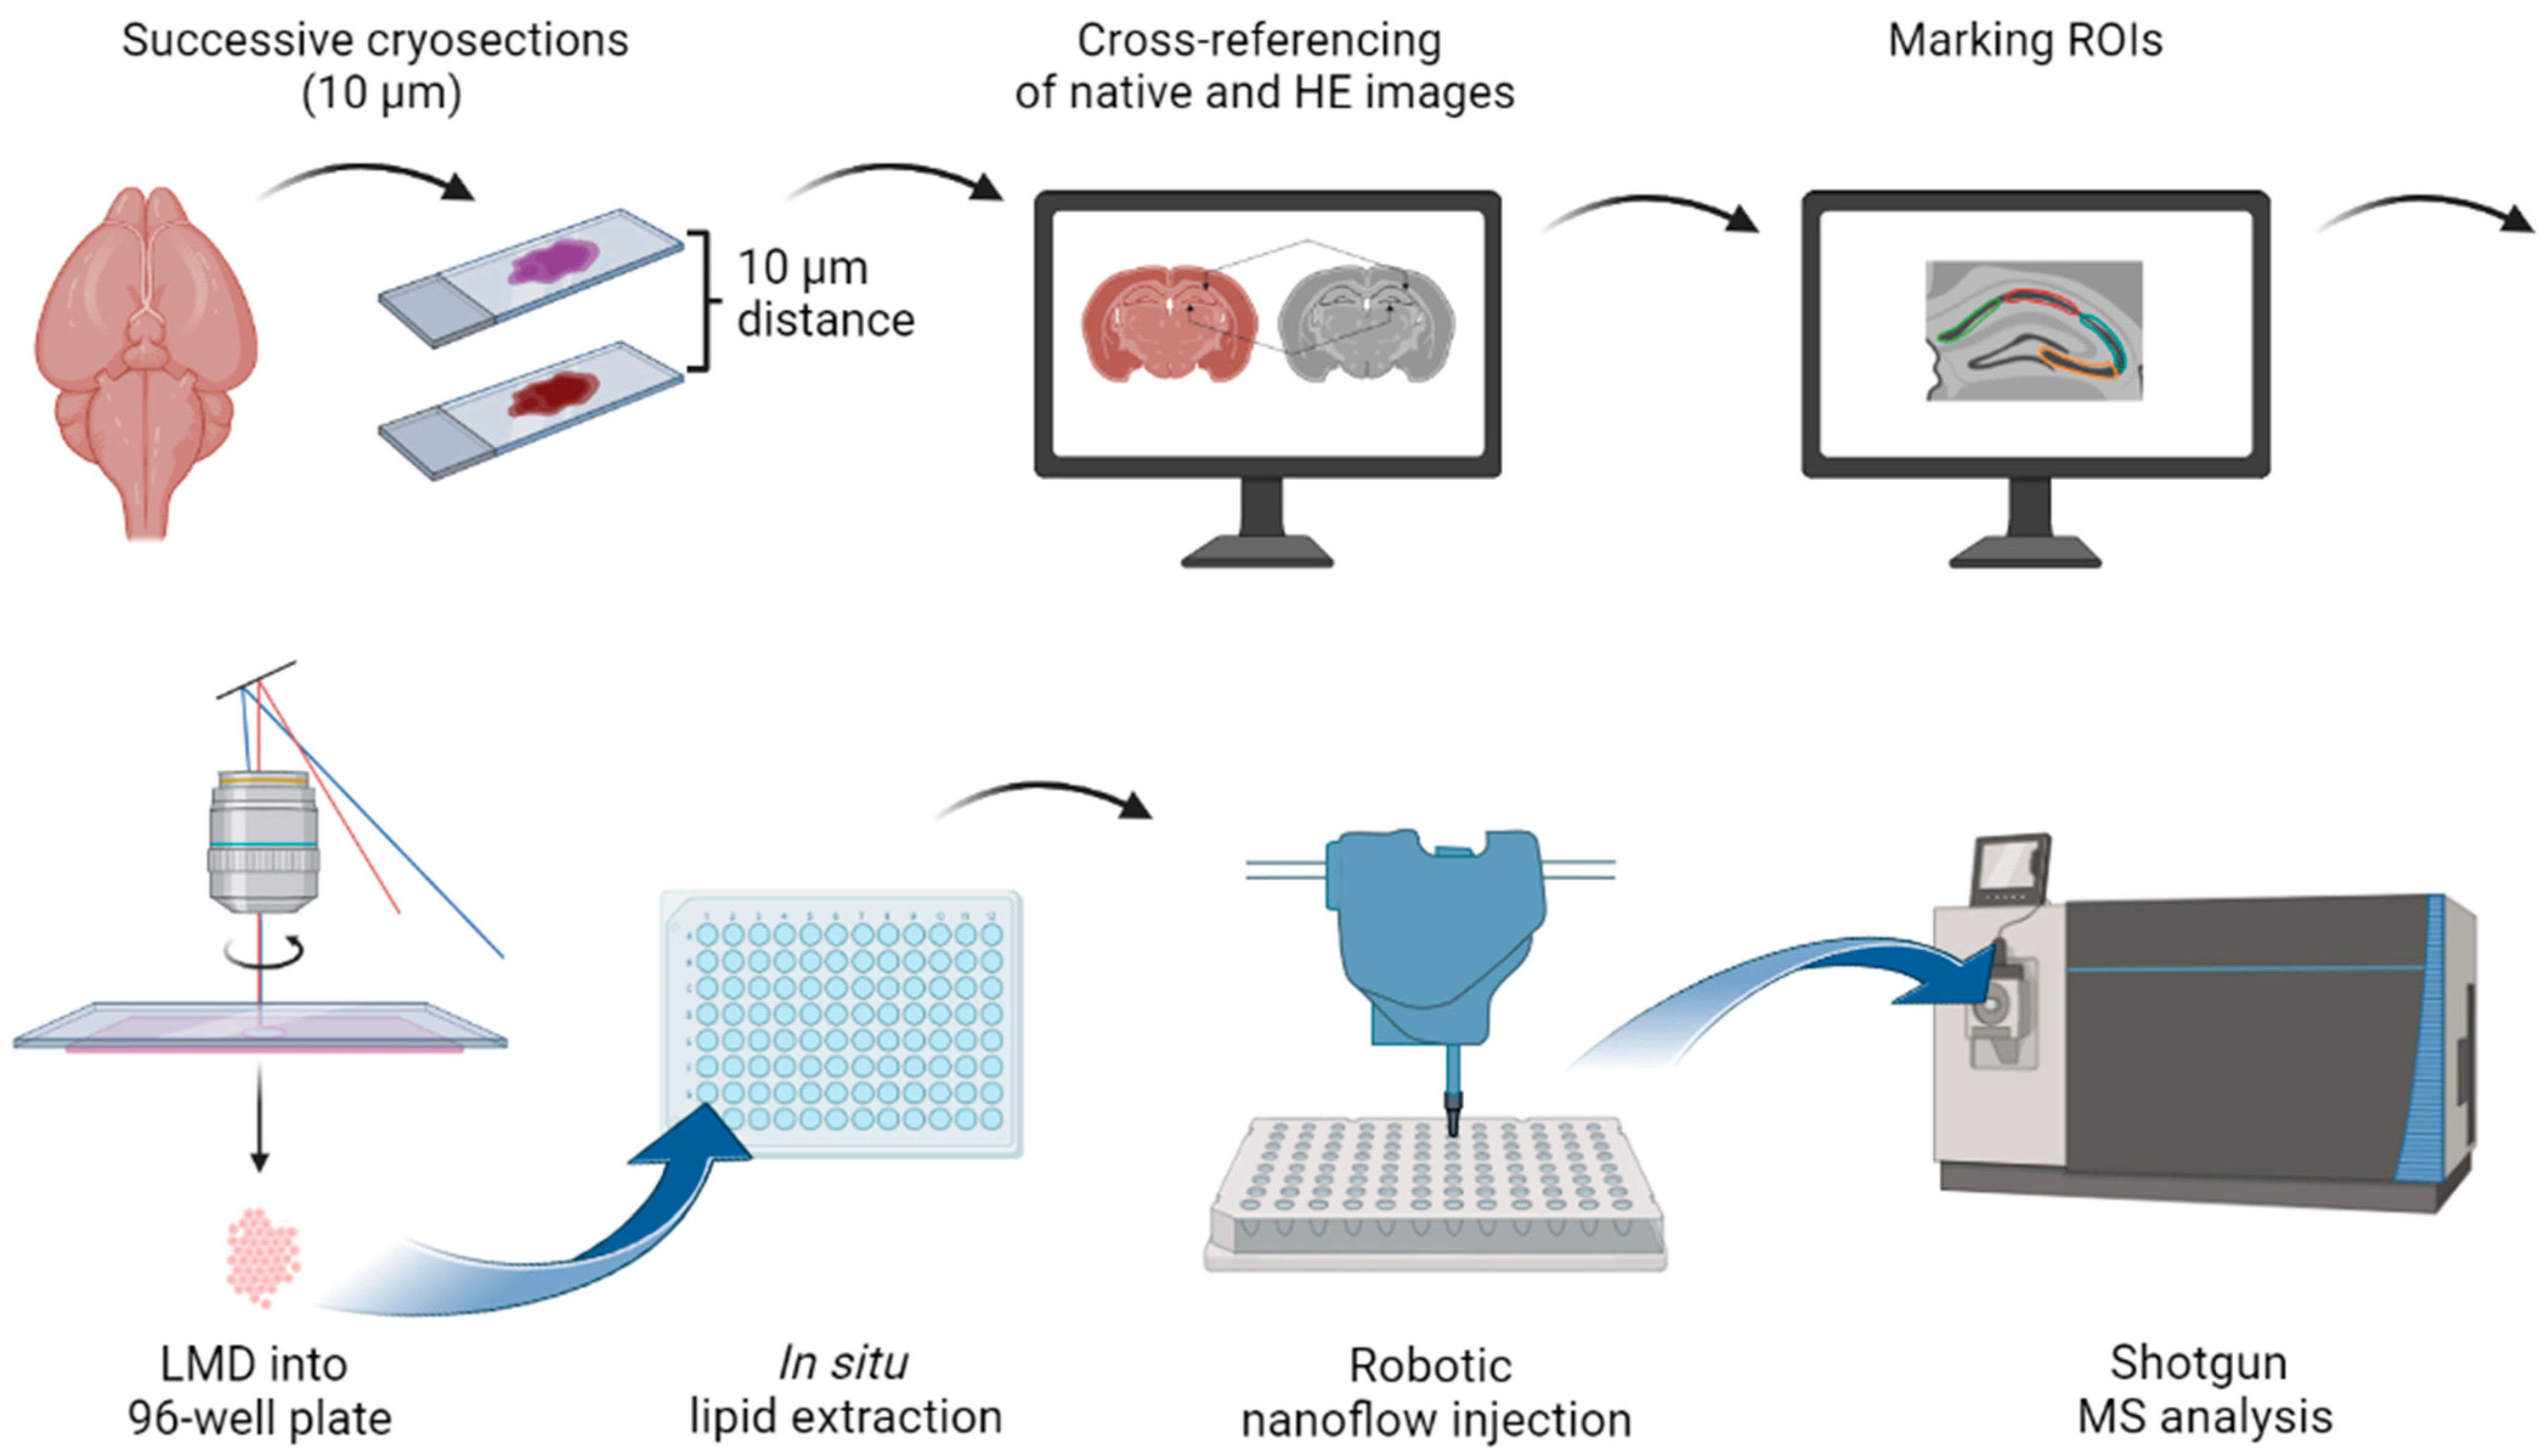
Abstract
:1. Introduction
2. Materials and Methods
2.1. LMD-Coupled Shotgun Lipidomic Platform Overview
2.2. Samples
2.2.1. Mouse Tissue Samples
2.2.2. HeLa-Kyoto 2D Cell Culture
2.3. Cryosectioning
2.4. Hematoxylin-Eosin Staining
2.5. High-Resolution Microscopy and Marking Regions of Interest (ROIs)
2.6. Automated Laser Microdissection (LMD)
2.7. In Situ Lipid Extraction
2.8. Shotgun Mass Spectrometry
2.9. Mass Spectrometry Data Analysis
3. Results and Discussion
3.1. Method Overview
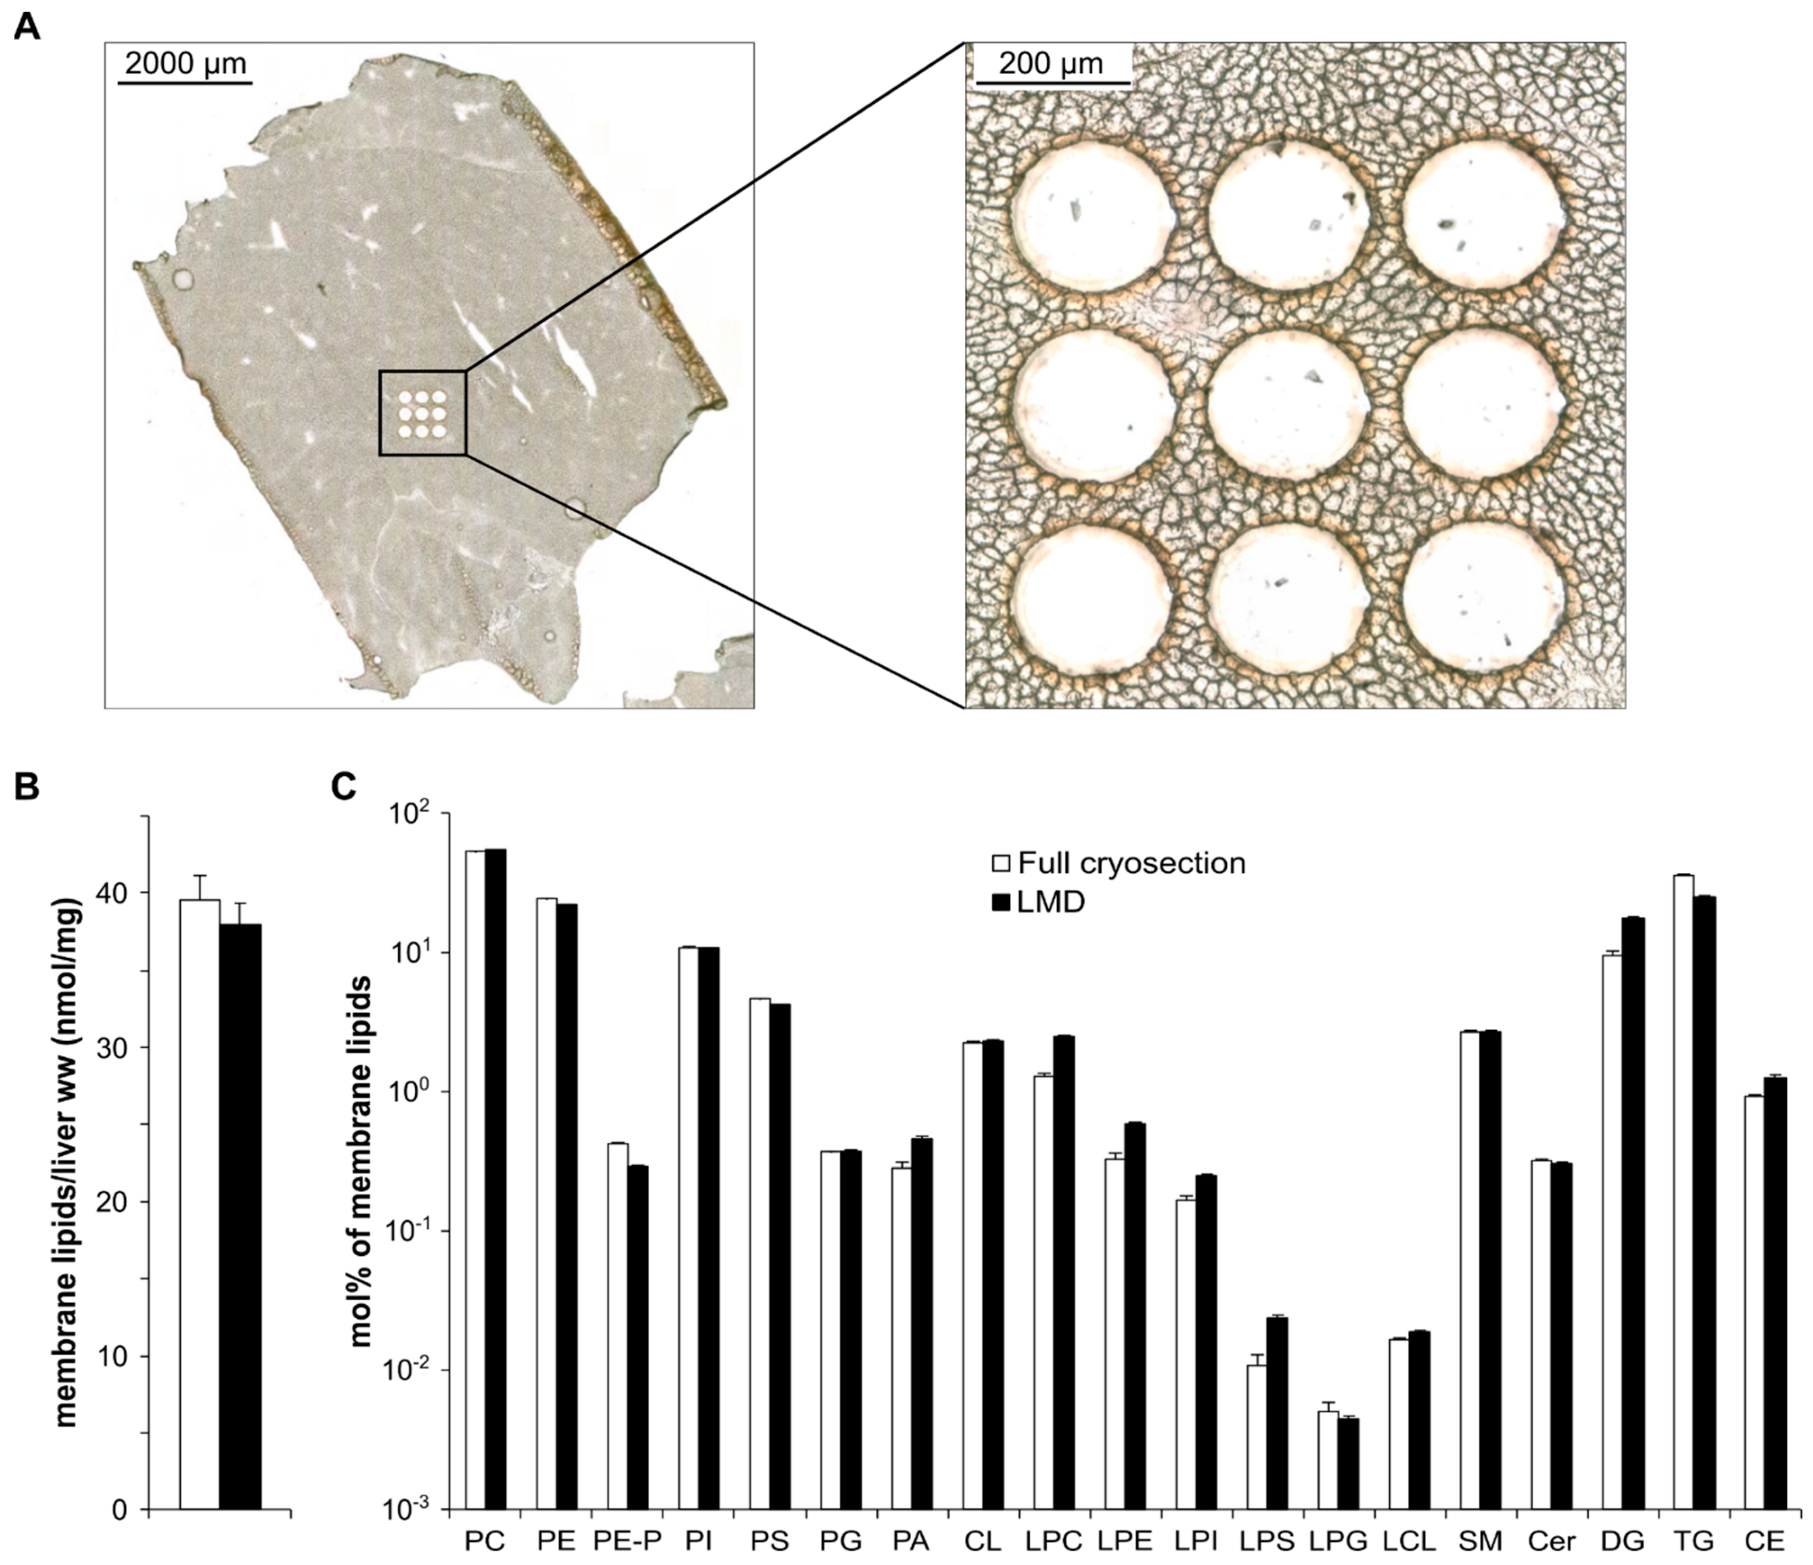
3.2. Method Validation—Reproducibility and Extraction Efficiency
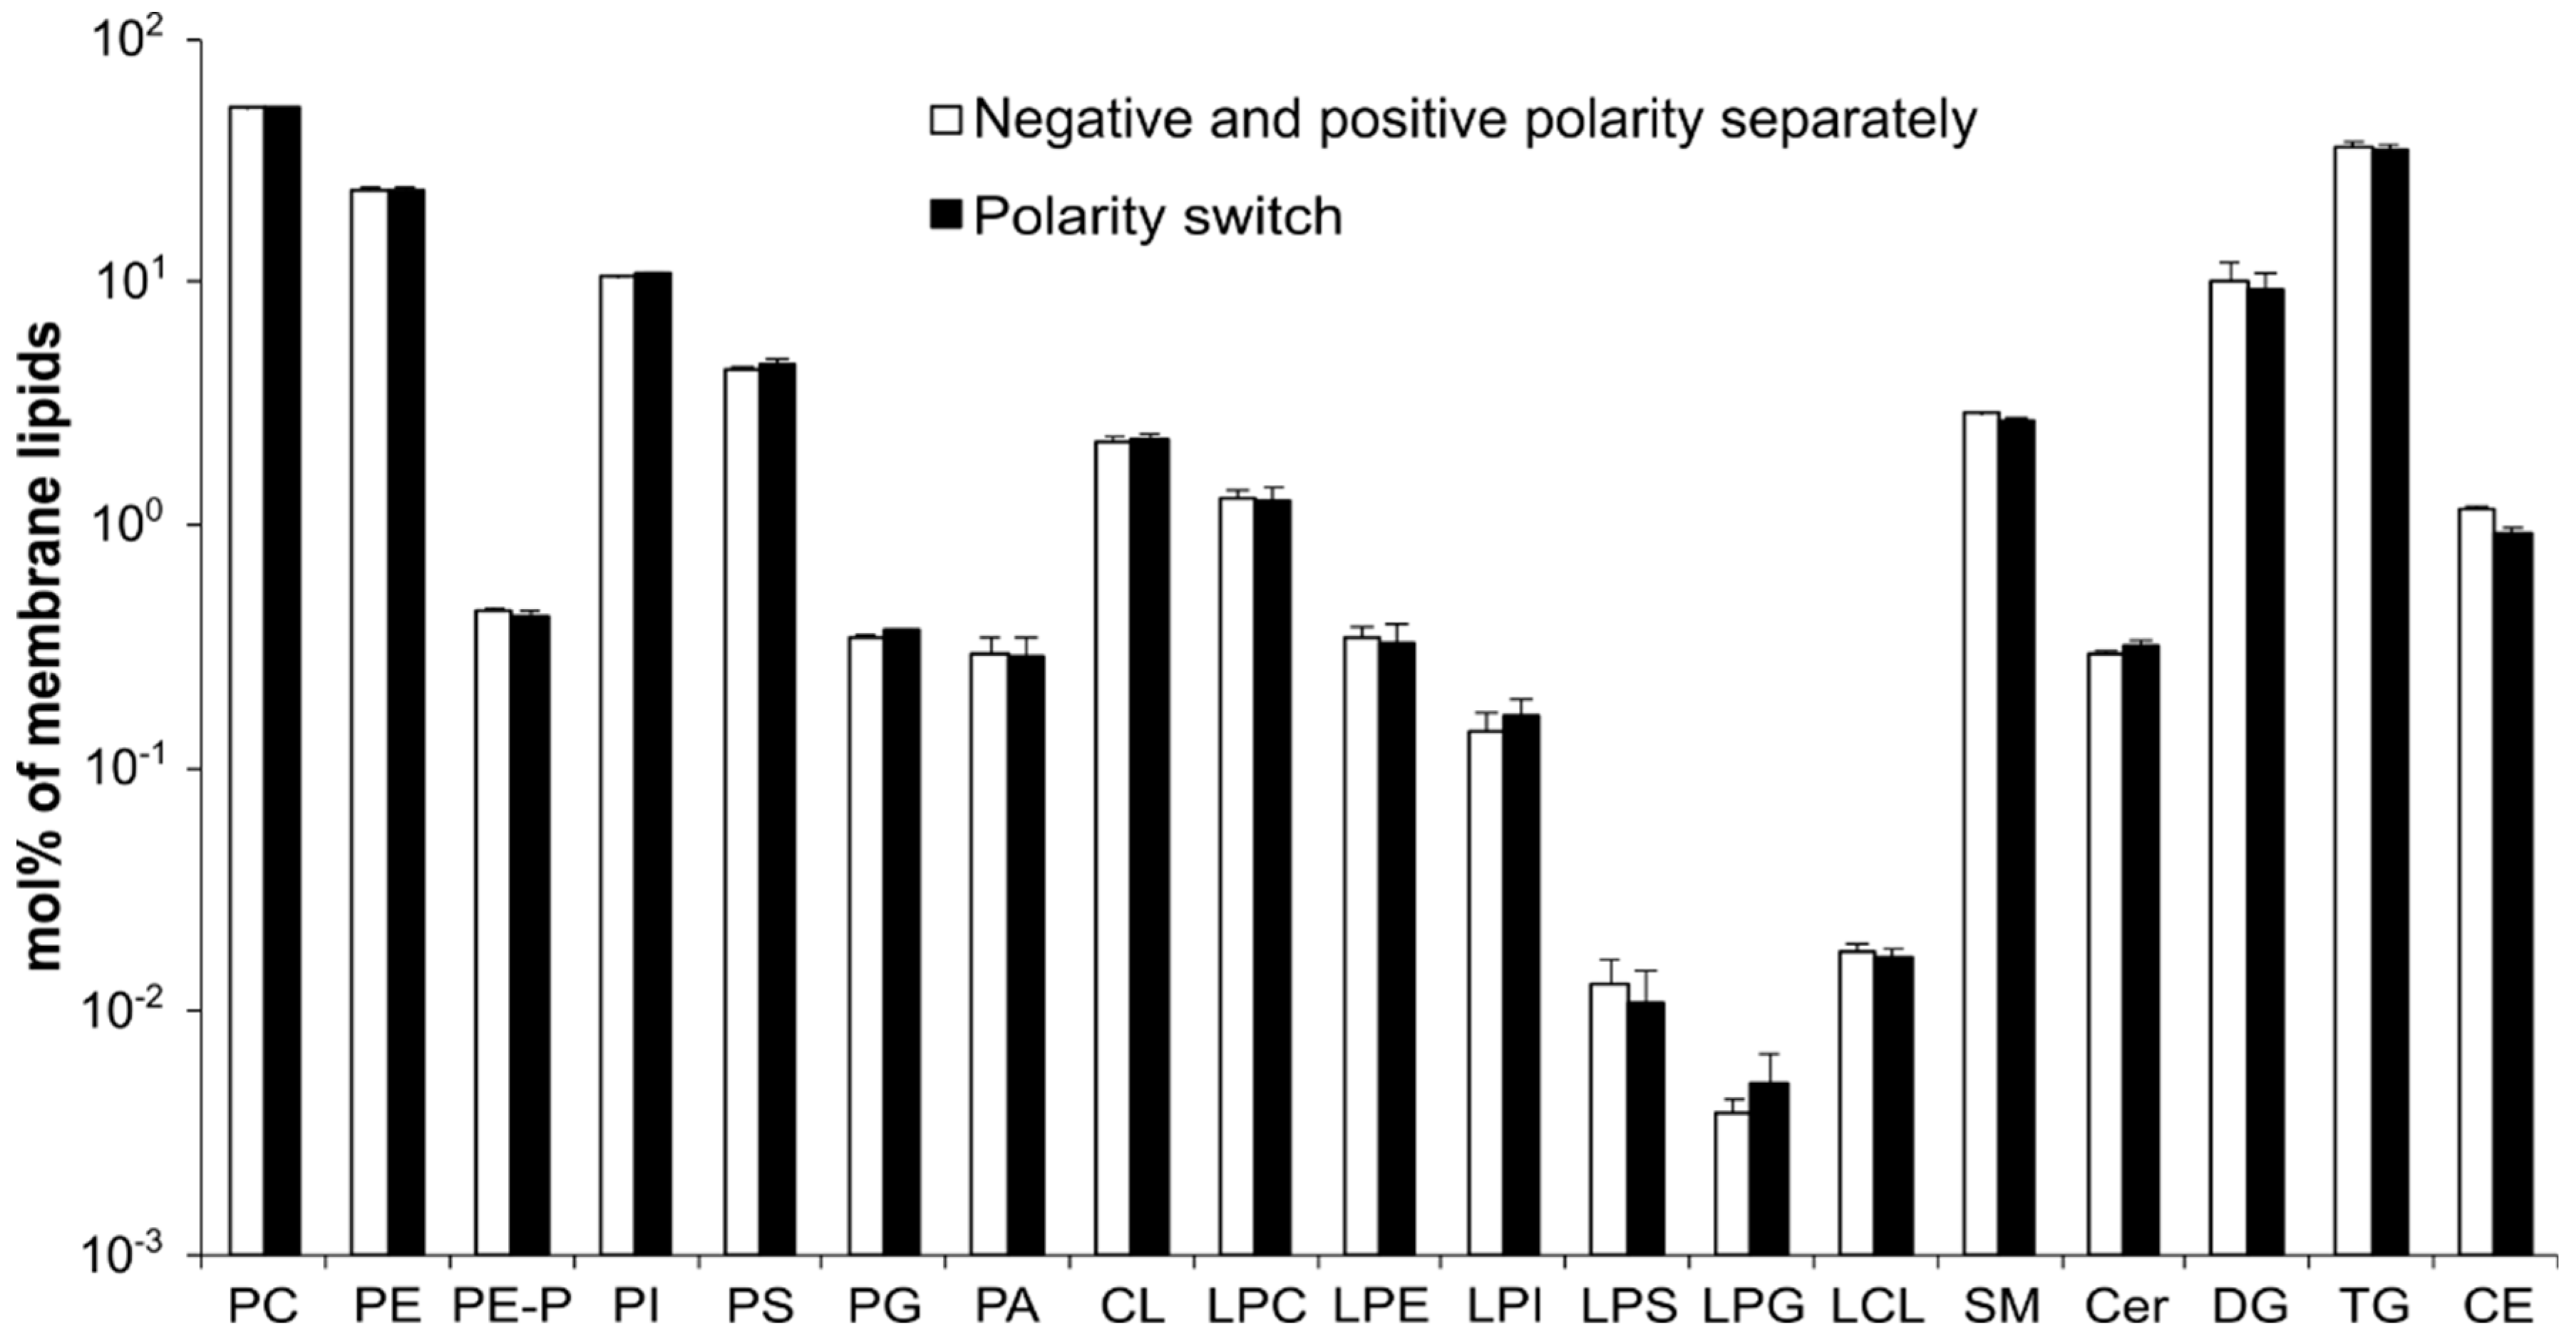
3.3. Method Validation—MS Acquisition with Polarity Switching
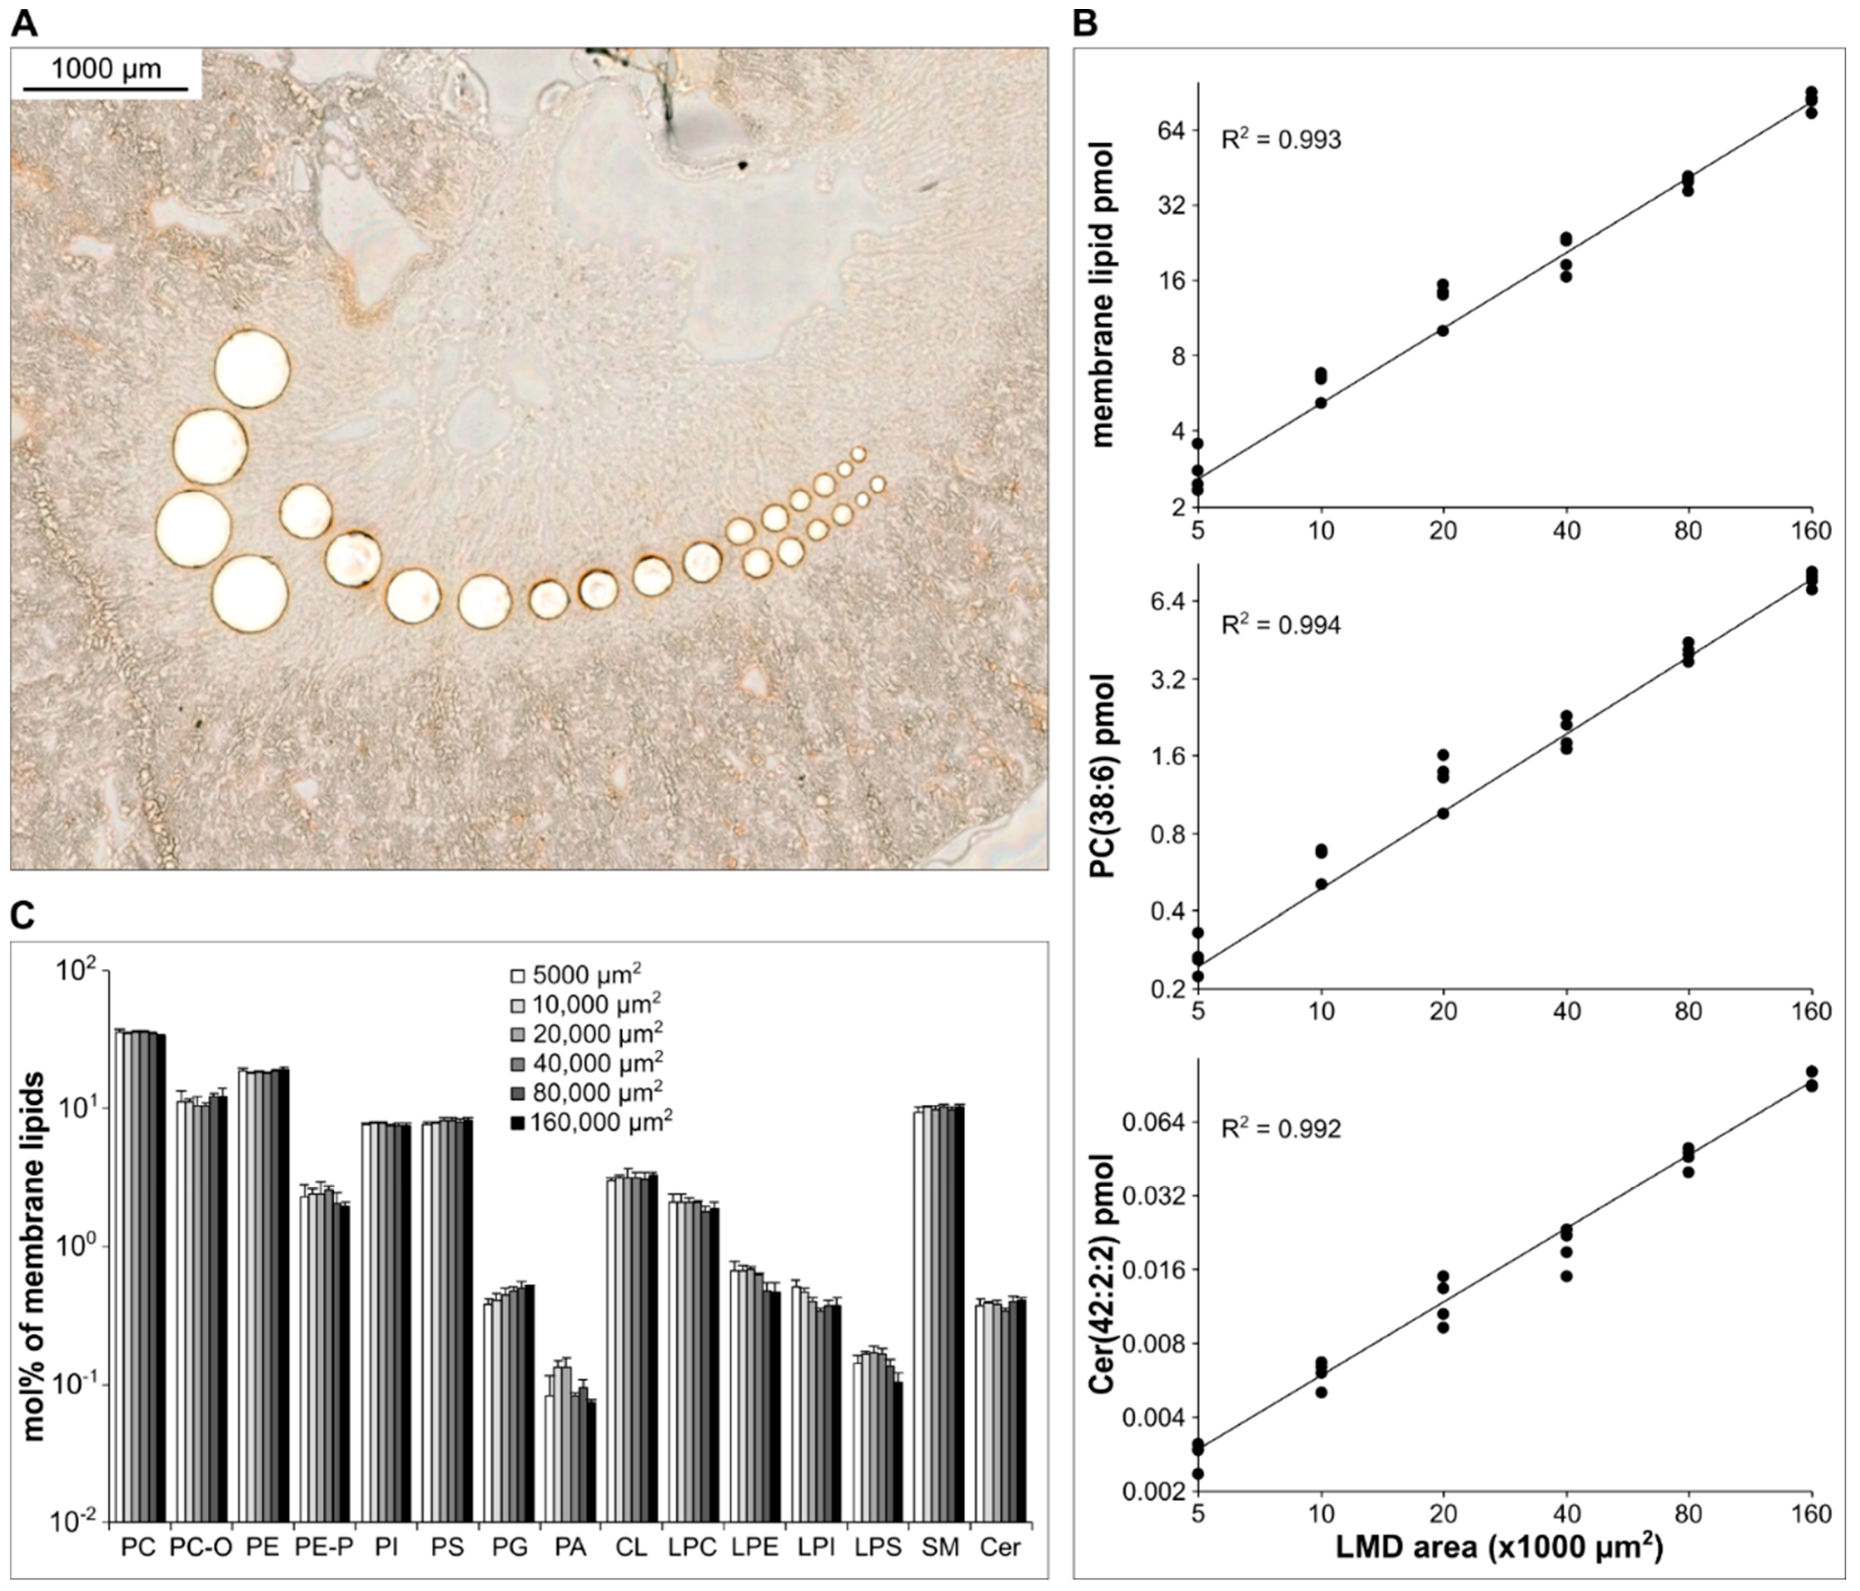
3.4. Method Validation—Linearity of Quantification
3.4.1. Kidney Cryosections
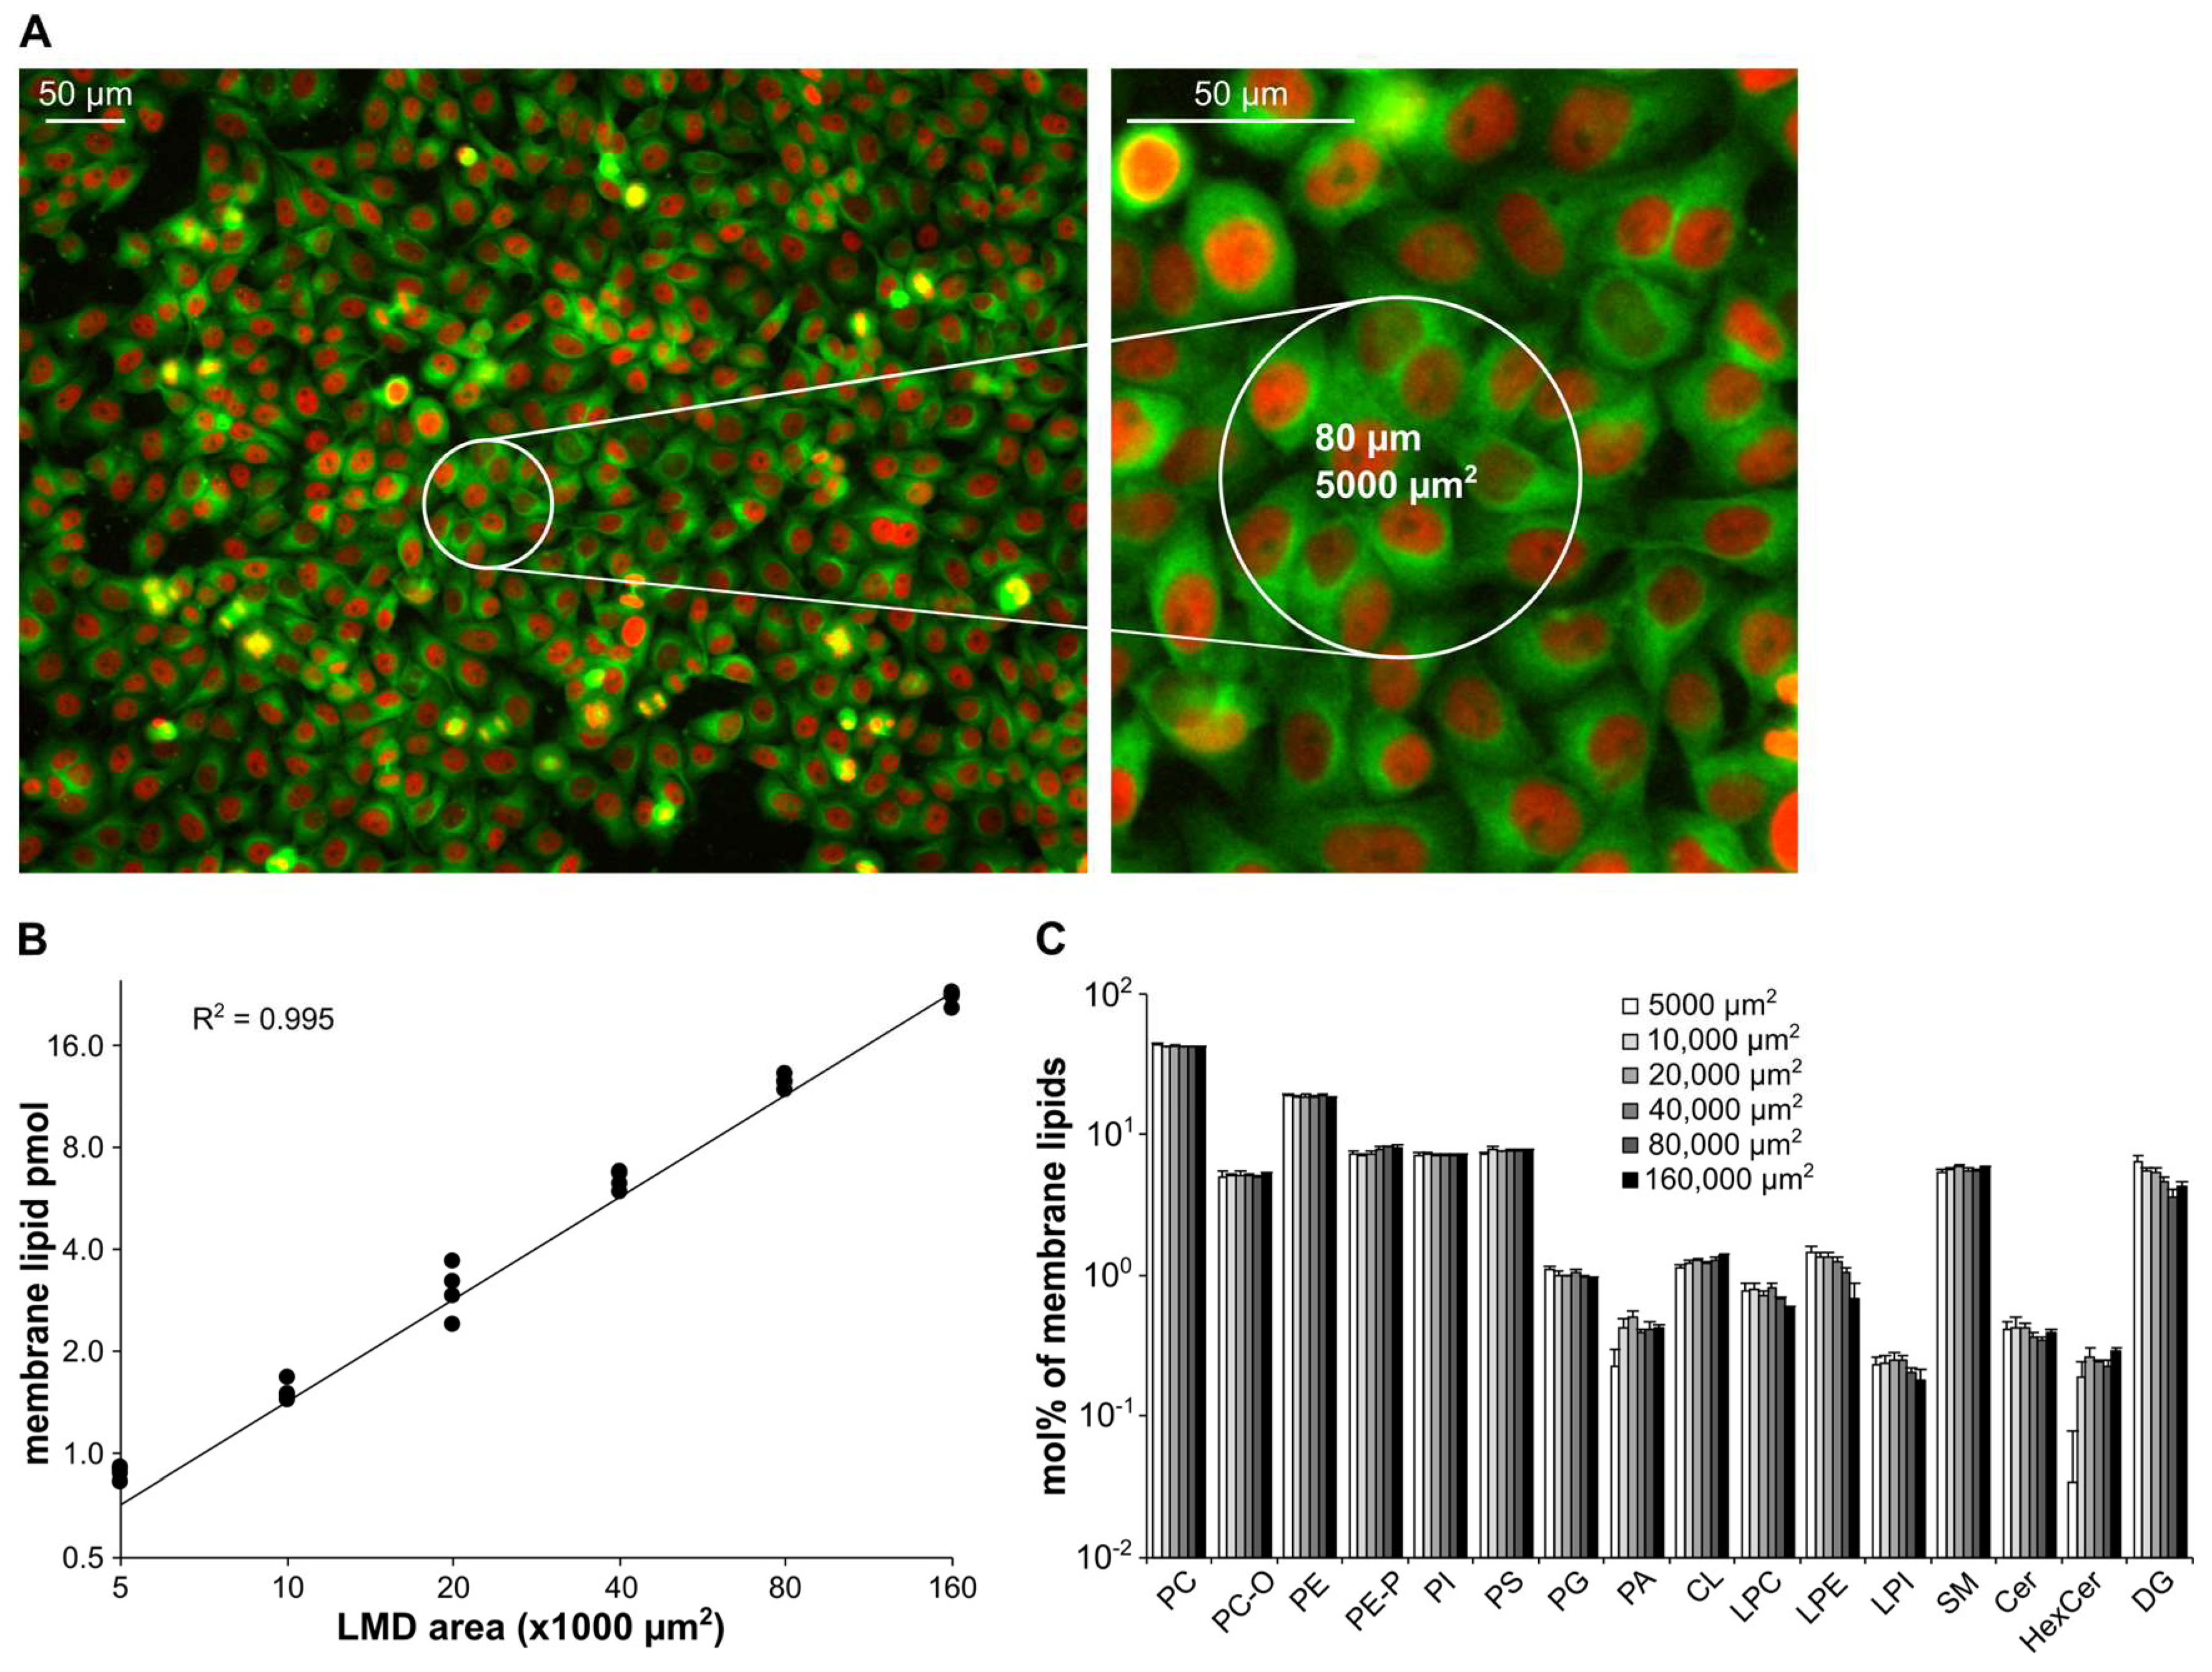
3.4.2. HeLa 2D Cultures
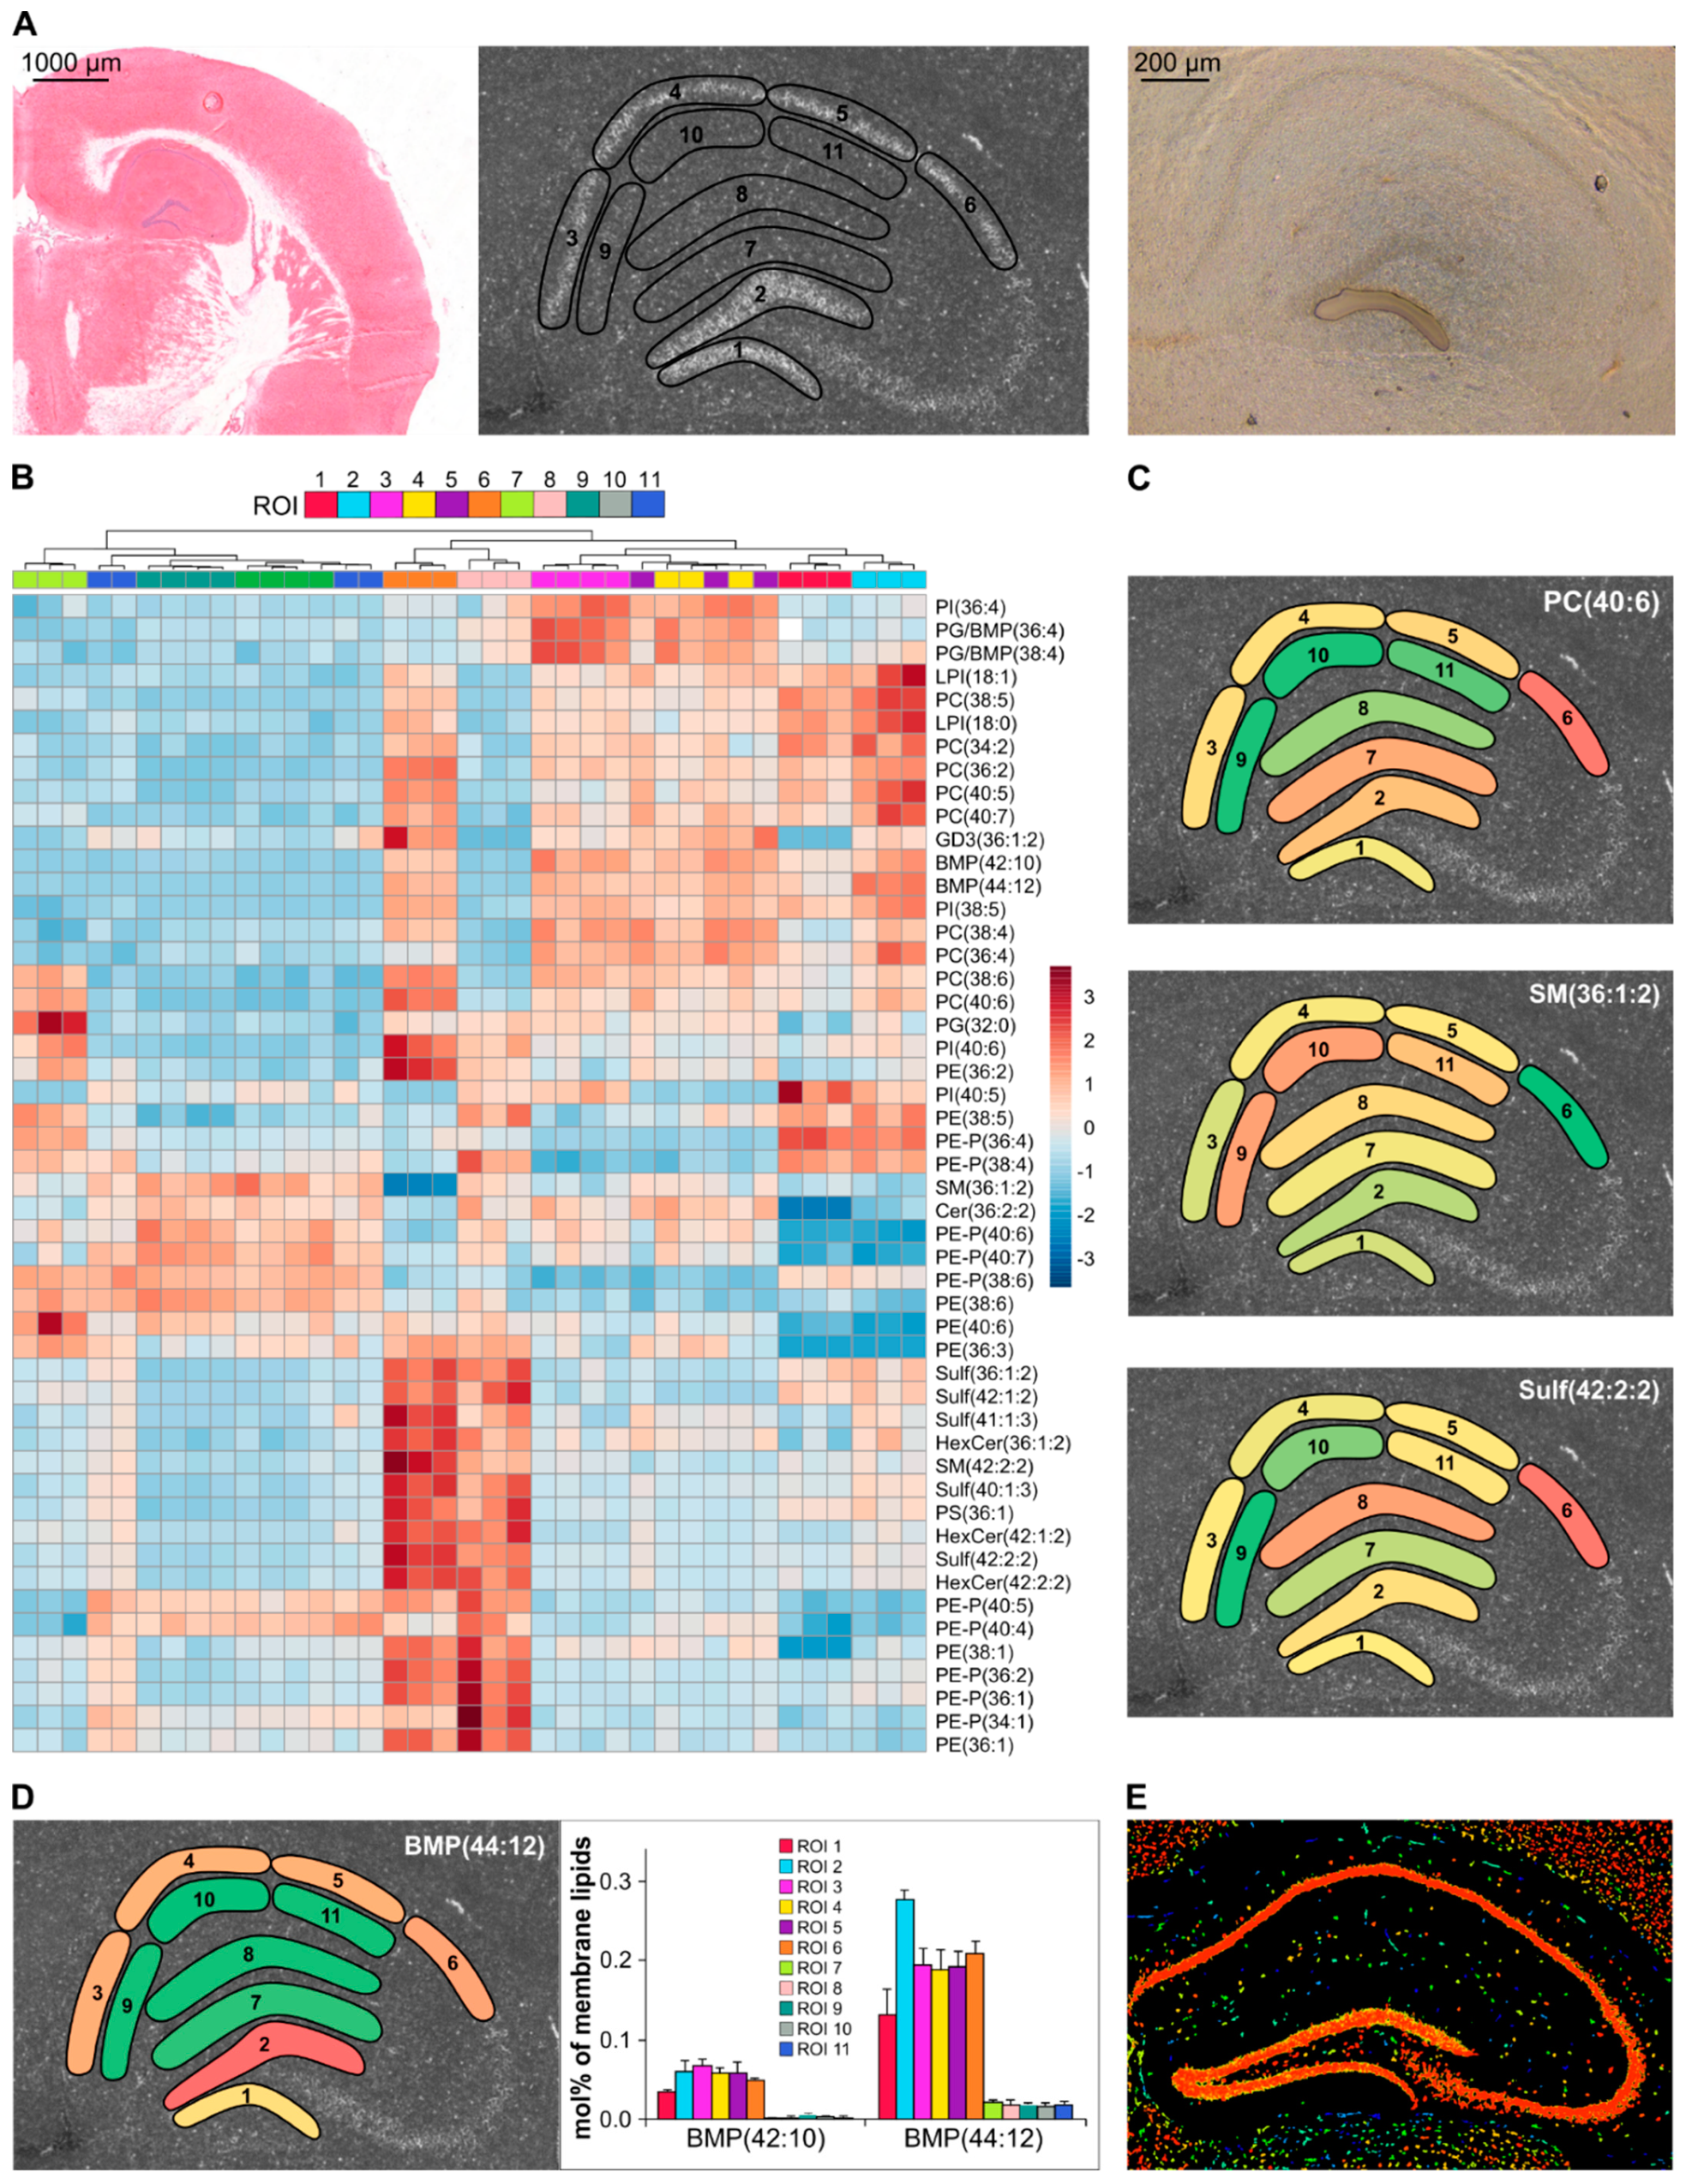
3.5. Recognition of Hippocampus Heterogeneity
3.6. Method Limitations and Potentials
4. Conclusions
Supplementary Materials
Author Contributions
Funding
Institutional Review Board Statement
Informed Consent Statement
Data Availability Statement
Acknowledgments
Conflicts of Interest
References
- Harayama, T.; Riezman, H. Understanding the Diversity of Membrane Lipid Composition. Nat. Rev. Mol. Cell Biol. 2018, 19, 281–296. [Google Scholar] [CrossRef] [PubMed]
- Balogh, G.; Péter, M.; Glatz, A.; Gombos, I.; Török, Z.; Horváth, I.; Harwood, J.L.; Vígh, L. Key Role of Lipids in Heat Stress Management. FEBS Lett. 2013, 587, 1970–1980. [Google Scholar] [CrossRef] [PubMed] [Green Version]
- Török, Z.; Crul, T.; Maresca, B.; Schütz, G.J.; Viana, F.; Dindia, L.; Piotto, S.; Brameshuber, M.; Balogh, G.; Péter, M.; et al. Plasma Membranes as Heat Stress Sensors: From Lipid-Controlled Molecular Switches to Therapeutic Applications. Biochim. Biophys. Acta—Biomembr. 2014, 1838, 1594–1618. [Google Scholar] [CrossRef] [PubMed] [Green Version]
- Butler, L.M.; Perone, Y.; Dehairs, J.; Lupien, L.E.; de Laat, V.; Talebi, A.; Loda, M.; Kinlaw, W.B.; Swinnen, J.V. Lipids and Cancer: Emerging Roles in Pathogenesis, Diagnosis and Therapeutic Intervention. Adv. Drug Deliv. Rev. 2020, 159, 245–293. [Google Scholar] [CrossRef] [PubMed]
- Choi, R.H.; Tatum, S.M.; Symons, J.D.; Summers, S.A.; Holland, W.L. Ceramides and Other Sphingolipids as Drivers of Cardiovascular Disease. Nat. Rev. Cardiol. 2021, 18, 701–711. [Google Scholar] [CrossRef]
- Athyros, V.G.; Doumas, M.; Imprialos, K.P.; Stavropoulos, K.; Georgianou, E.; Katsimardou, A.; Karagiannis, A. Diabetes and Lipid Metabolism. Hormones 2018, 17, 61–67. [Google Scholar] [CrossRef] [PubMed] [Green Version]
- Martin-Perez, M.; Urdiroz-Urricelqui, U.; Bigas, C.; Benitah, S.A. The Role of Lipids in Cancer Progression and Metastasis. Cell Metab. 2022, 34, 1675–1699. [Google Scholar] [CrossRef]
- Hsu, F.F. Mass Spectrometry-Based Shotgun Lipidomics—A Critical Review from the Technical Point of View. Anal. Bioanal. Chem. 2018, 410, 6387–6409. [Google Scholar] [CrossRef]
- Züllig, T.; Köfeler, H.C. HIGH RESOLUTION MASS SPECTROMETRY IN LIPIDOMICS. Mass Spectrom. Rev. 2021, 40, 162–176. [Google Scholar] [CrossRef] [Green Version]
- Hu, C.; Duan, Q.; Han, X. Strategies to Improve/Eliminate the Limitations in Shotgun Lipidomics. Proteomics 2020, 20, e1900070. [Google Scholar] [CrossRef]
- Han, X.; Gross, R.W. The Foundations and Development of Lipidomics. J. Lipid Res. 2022, 63, 100164. [Google Scholar] [CrossRef] [PubMed]
- Escribá, P.V.; Busquets, X.; Inokuchi, J.; Balogh, G.; Török, Z.; Horváth, I.; Harwood, J.L.; Vígh, L. Membrane Lipid Therapy: Modulation of the Cell Membrane Composition and Structure as a Molecular Base for Drug Discovery and New Disease Treatment. Prog. Lipid Res. 2015, 59, 38–53. [Google Scholar] [CrossRef] [Green Version]
- Ščupáková, K.; Balluff, B.; Tressler, C.; Adelaja, T.; Heeren, R.M.A.; Glunde, K.; Ertaylan, G. Cellular Resolution in Clinical MALDI Mass Spectrometry Imaging: The Latest Advancements and Current Challenges. Clin. Chem. Lab. Med. 2020, 58, 914–929. [Google Scholar] [CrossRef] [PubMed]
- Noun, M.; Akoumeh, R.; Abbas, I. Cell and Tissue Imaging by TOF-SIMS and MALDI-TOF: An Overview for Biological and Pharmaceutical Analysis. Microsc. Microanal. 2022, 28, 1–26. [Google Scholar] [CrossRef]
- Abbassi-Ghadi, N.; Jones, E.A.; Gomez-Romero, M.; Golf, O.; Kumar, S.; Huang, J.; Kudo, H.; Goldin, R.D.; Hanna, G.B.; Takats, Z. A Comparison of DESI-MS and LC-MS for the Lipidomic Profiling of Human Cancer Tissue. J. Am. Soc. Mass Spectrom. 2016, 27, 255–264. [Google Scholar] [CrossRef] [PubMed]
- Lanekoff, I.; Laskin, J. Quantitative Mass Spectrometry Imaging of Molecules in Biological Systems. In Advances in Chromatography; Grinberg, N., Grushka, E., Eds.; CRC Press: Boca Raton, FL, USA, 2017; Volume 54, pp. 43–72. [Google Scholar]
- Unsihuay, D.; Mesa Sanchez, D.; Laskin, J. Quantitative Mass Spectrometry Imaging of Biological Systems. Annu. Rev. Phys. Chem. 2021, 72, 307–329. [Google Scholar] [CrossRef] [PubMed]
- Brasko, C.; Smith, K.; Molnar, C.; Farago, N.; Hegedus, L.; Balind, A.; Balassa, T.; Szkalisity, A.; Sukosd, F.; Kocsis, K.; et al. Intelligent Image-Based in Situ Single-Cell Isolation. Nat. Commun. 2018, 9, 226. [Google Scholar] [CrossRef] [PubMed] [Green Version]
- Amini, P.; Ettlin, J.; Opitz, L.; Clementi, E.; Malbon, A.; Markkanen, E. An Optimised Protocol for Isolation of RNA from Small Sections of Laser-Capture Microdissected FFPE Tissue Amenable for next-Generation Sequencing. BMC Mol. Biol. 2017, 18, 22. [Google Scholar] [CrossRef] [PubMed] [Green Version]
- Løvendorf, M.B.; Mitsui, H.; Zibert, J.R.; Røpke, M.A.; Hafner, M.; Dyring-Andersen, B.; Bonefeld, C.M.; Krueger, J.G.; Skov, L. Laser Capture Microdissection Followed by Next-Generation Sequencing Identifies Disease-Related MicroRNAs in Psoriatic Skin That Reflect Systemic MicroRNA Changes in Psoriasis. Exp. Dermatol. 2015, 24, 187–193. [Google Scholar] [CrossRef]
- Martinek, J.; Wu, T.C.; Sun, L.; Lin, J.; Kim, K.I.; Marches, F.; Robson, P.; George, J.; Palucka, K. Multiplex Immunofluorescence-Guided Laser Capture Microdissection for Spatial Transcriptomics of Metastatic Melanoma Tissues. STAR Protoc. 2022, 3, 101698. [Google Scholar] [CrossRef]
- Coscia, F.; Doll, S.; Bech, J.M.; Schweizer, L.; Mund, A.; Lengyel, E.; Lindebjerg, J.; Madsen, G.I.; Moreira, J.M.A.; Mann, M. A Streamlined Mass Spectrometry–Based Proteomics Workflow for Large-Scale FFPE Tissue Analysis. J. Pathol. 2020, 251, 100–112. [Google Scholar] [CrossRef] [PubMed] [Green Version]
- Dilillo, M.; Pellegrini, D.; Ait-Belkacem, R.; De Graaf, E.L.; Caleo, M.; McDonnell, L.A. Mass Spectrometry Imaging, Laser Capture Microdissection, and LC-MS/MS of the Same Tissue Section. J. Proteome Res. 2017, 16, 2993–3001. [Google Scholar] [CrossRef] [PubMed]
- Mollee, P.; Boros, S.; Loo, D.; Ruelcke, J.E.; Lakis, V.A.; Cao, K.A.L.; Renaut, P.; Hill, M.M. Implementation and Evaluation of Amyloidosis Subtyping by Laser-Capture Microdissection and Tandem Mass Spectrometry. Clin. Proteomics 2016, 13, 30. [Google Scholar] [CrossRef] [Green Version]
- Mund, A.; Coscia, F.; Kriston, A.; Hollandi, R.; Kovács, F.; Brunner, A.D.; Migh, E.; Schweizer, L.; Santos, A.; Bzorek, M.; et al. Deep Visual Proteomics Defines Single-Cell Identity and Heterogeneity. Nat. Biotechnol. 2022, 40, 1231–1240. [Google Scholar] [CrossRef]
- Odenkirk, M.T.; Horman, B.M.; Dodds, J.N.; Patisaul, H.B.; Baker, E.S. Combining Micropunch Histology and Multidimensional Lipidomic Measurements for In-Depth Tissue Mapping. ACS Meas. Sci. Au 2022, 2, 67–75. [Google Scholar] [CrossRef]
- Knittelfelder, O.; Traikov, S.; Vvedenskaya, O.; Schuhmann, A.; Segeletz, S.; Shevchenko, A.; Shevchenko, A. Shotgun Lipidomics Combined with Laser Capture Microdissection: A Tool to Analyze Histological Zones in Cryosections of Tissues. Anal. Chem. 2018, 90, 9868–9878. [Google Scholar] [CrossRef]
- Hebbar, S.; Schulz, W.D.; Sauer, U.; Schwudke, D. Laser Capture Microdissection Coupled with On-Column Extraction LC-MS n Enables Lipidomics of Fluorescently Labeled Drosophila Neurons. Anal. Chem. 2014, 86, 5345–5352. [Google Scholar] [CrossRef]
- Herzog, R.; Schwudke, D.; Schuhmann, K.; Sampaio, J.L.; Bornstein, S.R.; Schroeder, M.; Shevchenko, A. A Novel Informatics Concept for High-Throughput Shotgun Lipidomics Based on the Molecular Fragmentation Query Language. Genome Biol. 2011, 12, R8. [Google Scholar] [CrossRef] [PubMed] [Green Version]
- Fahy, E.; Subramaniam, S.; Murphy, R.C.; Nishijima, M.; Raetz, C.R.H.; Shimizu, T.; Spener, F.; van Meer, G.; Wakelam, M.J.O.; Dennis, E.A. Update of the LIPID MAPS Comprehensive Classification System for Lipids. J. Lipid Res. 2009, 50, S9. [Google Scholar] [CrossRef] [Green Version]
- Liebisch, G.; Vizcaíno, J.A.; Köfeler, H.; Trötzmüller, M.; Griffiths, W.J.; Schmitz, G.; Spener, F.; Wakelam, M.J.O. Shorthand Notation for Lipid Structures Derived from Mass Spectrometry. J. Lipid Res. 2013, 54, 1523. [Google Scholar] [CrossRef]
- Xia, J.; Wishart, D.S. Web-Based Inference of Biological Patterns, Functions and Pathways from Metabolomic Data Using MetaboAnalyst. Nat. Protoc. 2011, 6, 743–760. [Google Scholar] [CrossRef] [PubMed]
- Péter, M.; Glatz, A.; Gudmann, P.; Gombos, I.; Török, Z.; Horváth, I.; Vígh, L.; Balogh, G. Metabolic Crosstalk between Membrane and Storage Lipids Facilitates Heat Stress Management in Schizosaccharomyces Pombe. PLoS ONE 2017, 12, e0173739. [Google Scholar] [CrossRef] [Green Version]
- Norheim, F.; Chella Krishnan, K.; Bjellaas, T.; Vergnes, L.; Pan, C.; Parks, B.W.; Meng, Y.; Lang, J.; Ward, J.A.; Reue, K.; et al. Genetic Regulation of Liver Lipids in a Mouse Model of Insulin Resistance and Hepatic Steatosis. Mol. Syst. Biol. 2021, 17, e9684. [Google Scholar] [CrossRef] [PubMed]
- Nelson, G.J. The Lipid Composition of Normal Mouse Liver. J. Lipid Res. 1962, 3, 256–262. [Google Scholar] [CrossRef]
- Péter, M.; Gudmann, P.; Kóta, Z.; Török, Z.; Vígh, L.; Glatz, A.; Balogh, G. Lipids and Trehalose Actively Cooperate in Heat Stress Management of Schizosaccharomyces Pombe. Int. J. Mol. Sci. 2021, 22, 13272. [Google Scholar] [CrossRef] [PubMed]
- Péter, M.; Török, W.; Petrovics-Balog, A.; Vígh, L.; Vécsei, L.; Balogh, G. Cerebrospinal Fluid Lipidomic Biomarker Signatures of Demyelination for Multiple Sclerosis and Guillain–Barré Syndrome. Sci. Rep. 2020, 10, 18380. [Google Scholar] [CrossRef]
- Tóth, M.E.; Dukay, B.; Péter, M.; Balogh, G.; Sűcs, G.; Zvara, Á.; Szebeni, G.J.; Hajdu, P.; Sárközy, M.; Puskás, L.G.; et al. Male and Female Animals Respond Differently to High-Fat Diet and Regular Exercise Training in a Mouse Model of Hyperlipidemia. Int. J. Mol. Sci. 2021, 22, 4198. [Google Scholar] [CrossRef]
- Schuhmann, K.; Almeida, R.; Baumert, M.; Herzog, R.; Bornstein, S.R.; Shevchenko, A. Shotgun Lipidomics on a LTQ Orbitrap Mass Spectrometer by Successive Switching between Acquisition Polarity Modes. J. Mass Spectrom. 2012, 47, 96–104. [Google Scholar] [CrossRef] [PubMed] [Green Version]
- Höring, M.; Ekroos, K.; Baker, P.R.S.; Connell, L.; Stadler, S.C.; Burkhardt, R.; Liebisch, G. Correction of Isobaric Overlap Resulting from Sodiated Ions in Lipidomics. Anal. Chem. 2020, 92, 10966–10970. [Google Scholar] [CrossRef]
- Dudek, S.M.; Alexander, G.M.; Farris, S. Rediscovering Area CA2: Unique Properties and Functions. Nat. Rev. Neurosci. 2016, 17, 89–102. [Google Scholar] [CrossRef]
- Angerer, T.B.; Bour, J.; Biagi, J.L.; Moskovets, E.; Frache, G. Evaluation of 6 MALDI-Matrices for 10 Μm Lipid Imaging and On-Tissue MSn with AP-MALDI-Orbitrap. J. Am. Soc. Mass Spectrom. 2022, 33, 760–771. [Google Scholar] [CrossRef]
- Wang, X.; Schmitt, M.V.; Xu, L.; Jiao, Y.; Guo, L.; Lienau, P.; Reichel, A.; Liu, X. Quantitative Molecular Tissue Atlas of Bis(Monoacylglycero)Phosphate and Phosphatidylglycerol Membrane Lipids in Rodent Organs Generated by Methylation Assisted High Resolution Mass Spectrometry. Anal. Chim. Acta 2019, 1084, 60–70. [Google Scholar] [CrossRef]
- Allen Reference Atlas—Mouse Brain. Available online: http://atlas.brain-map.org/ (accessed on 21 November 2022).
- Hook, G.; Reinheckel, T.; Ni, J.; Wu, Z.; Kindy, M.; Peters, C.; Hook, V. Cathepsin B Gene Knockout Improves Behavioral Deficits and Reduces Pathology in Models of Neurologic Disorders. Pharmacol. Rev. 2022, 74, 600–629. [Google Scholar] [CrossRef]
- Qi, K.; Wu, L.; Liu, C.; Pan, Y. Recent Advances of Ambient Mass Spectrometry Imaging and Its Applications in Lipid and Metabolite Analysis. Metabolites 2021, 11, 780. [Google Scholar] [CrossRef]
- Morris, C.B.; Poland, J.C.; May, J.C.; McLean, J.A. Fundamentals of Ion Mobility-Mass Spectrometry for the Analysis of Biomolecules. Methods Mol. Biol. 2020, 2084, 1–31. [Google Scholar]
- Kanu, A.B.; Dwivedi, P.; Tam, M.; Matz, L.; Hill, H.H. Ion Mobility-Mass Spectrometry. J. Mass Spectrom. 2008, 43, 1–22. [Google Scholar] [CrossRef]
- Porter, M.J.; Zhang, G.L.; Schnaar, R.L. Ganglioside Extraction, Purification and Profiling. J. Vis. Exp. 2021, 2021, e62385. [Google Scholar] [CrossRef]


Disclaimer/Publisher’s Note: The statements, opinions and data contained in all publications are solely those of the individual author(s) and contributor(s) and not of MDPI and/or the editor(s). MDPI and/or the editor(s) disclaim responsibility for any injury to people or property resulting from any ideas, methods, instructions or products referred to in the content. |
© 2023 by the authors. Licensee MDPI, Basel, Switzerland. This article is an open access article distributed under the terms and conditions of the Creative Commons Attribution (CC BY) license (https://creativecommons.org/licenses/by/4.0/).
Share and Cite
Varga-Zsíros, V.; Migh, E.; Marton, A.; Kóta, Z.; Vizler, C.; Tiszlavicz, L.; Horváth, P.; Török, Z.; Vígh, L.; Balogh, G.; et al. Development of a Laser Microdissection-Coupled Quantitative Shotgun Lipidomic Method to Uncover Spatial Heterogeneity. Cells 2023, 12, 428. https://doi.org/10.3390/cells12030428
Varga-Zsíros V, Migh E, Marton A, Kóta Z, Vizler C, Tiszlavicz L, Horváth P, Török Z, Vígh L, Balogh G, et al. Development of a Laser Microdissection-Coupled Quantitative Shotgun Lipidomic Method to Uncover Spatial Heterogeneity. Cells. 2023; 12(3):428. https://doi.org/10.3390/cells12030428
Chicago/Turabian StyleVarga-Zsíros, Vanda, Ede Migh, Annamária Marton, Zoltán Kóta, Csaba Vizler, László Tiszlavicz, Péter Horváth, Zsolt Török, László Vígh, Gábor Balogh, and et al. 2023. "Development of a Laser Microdissection-Coupled Quantitative Shotgun Lipidomic Method to Uncover Spatial Heterogeneity" Cells 12, no. 3: 428. https://doi.org/10.3390/cells12030428