

Erk1/2-Dependent HNSCC Cell Susceptibility to Erastin-Induced Ferroptosis
 , and
, and 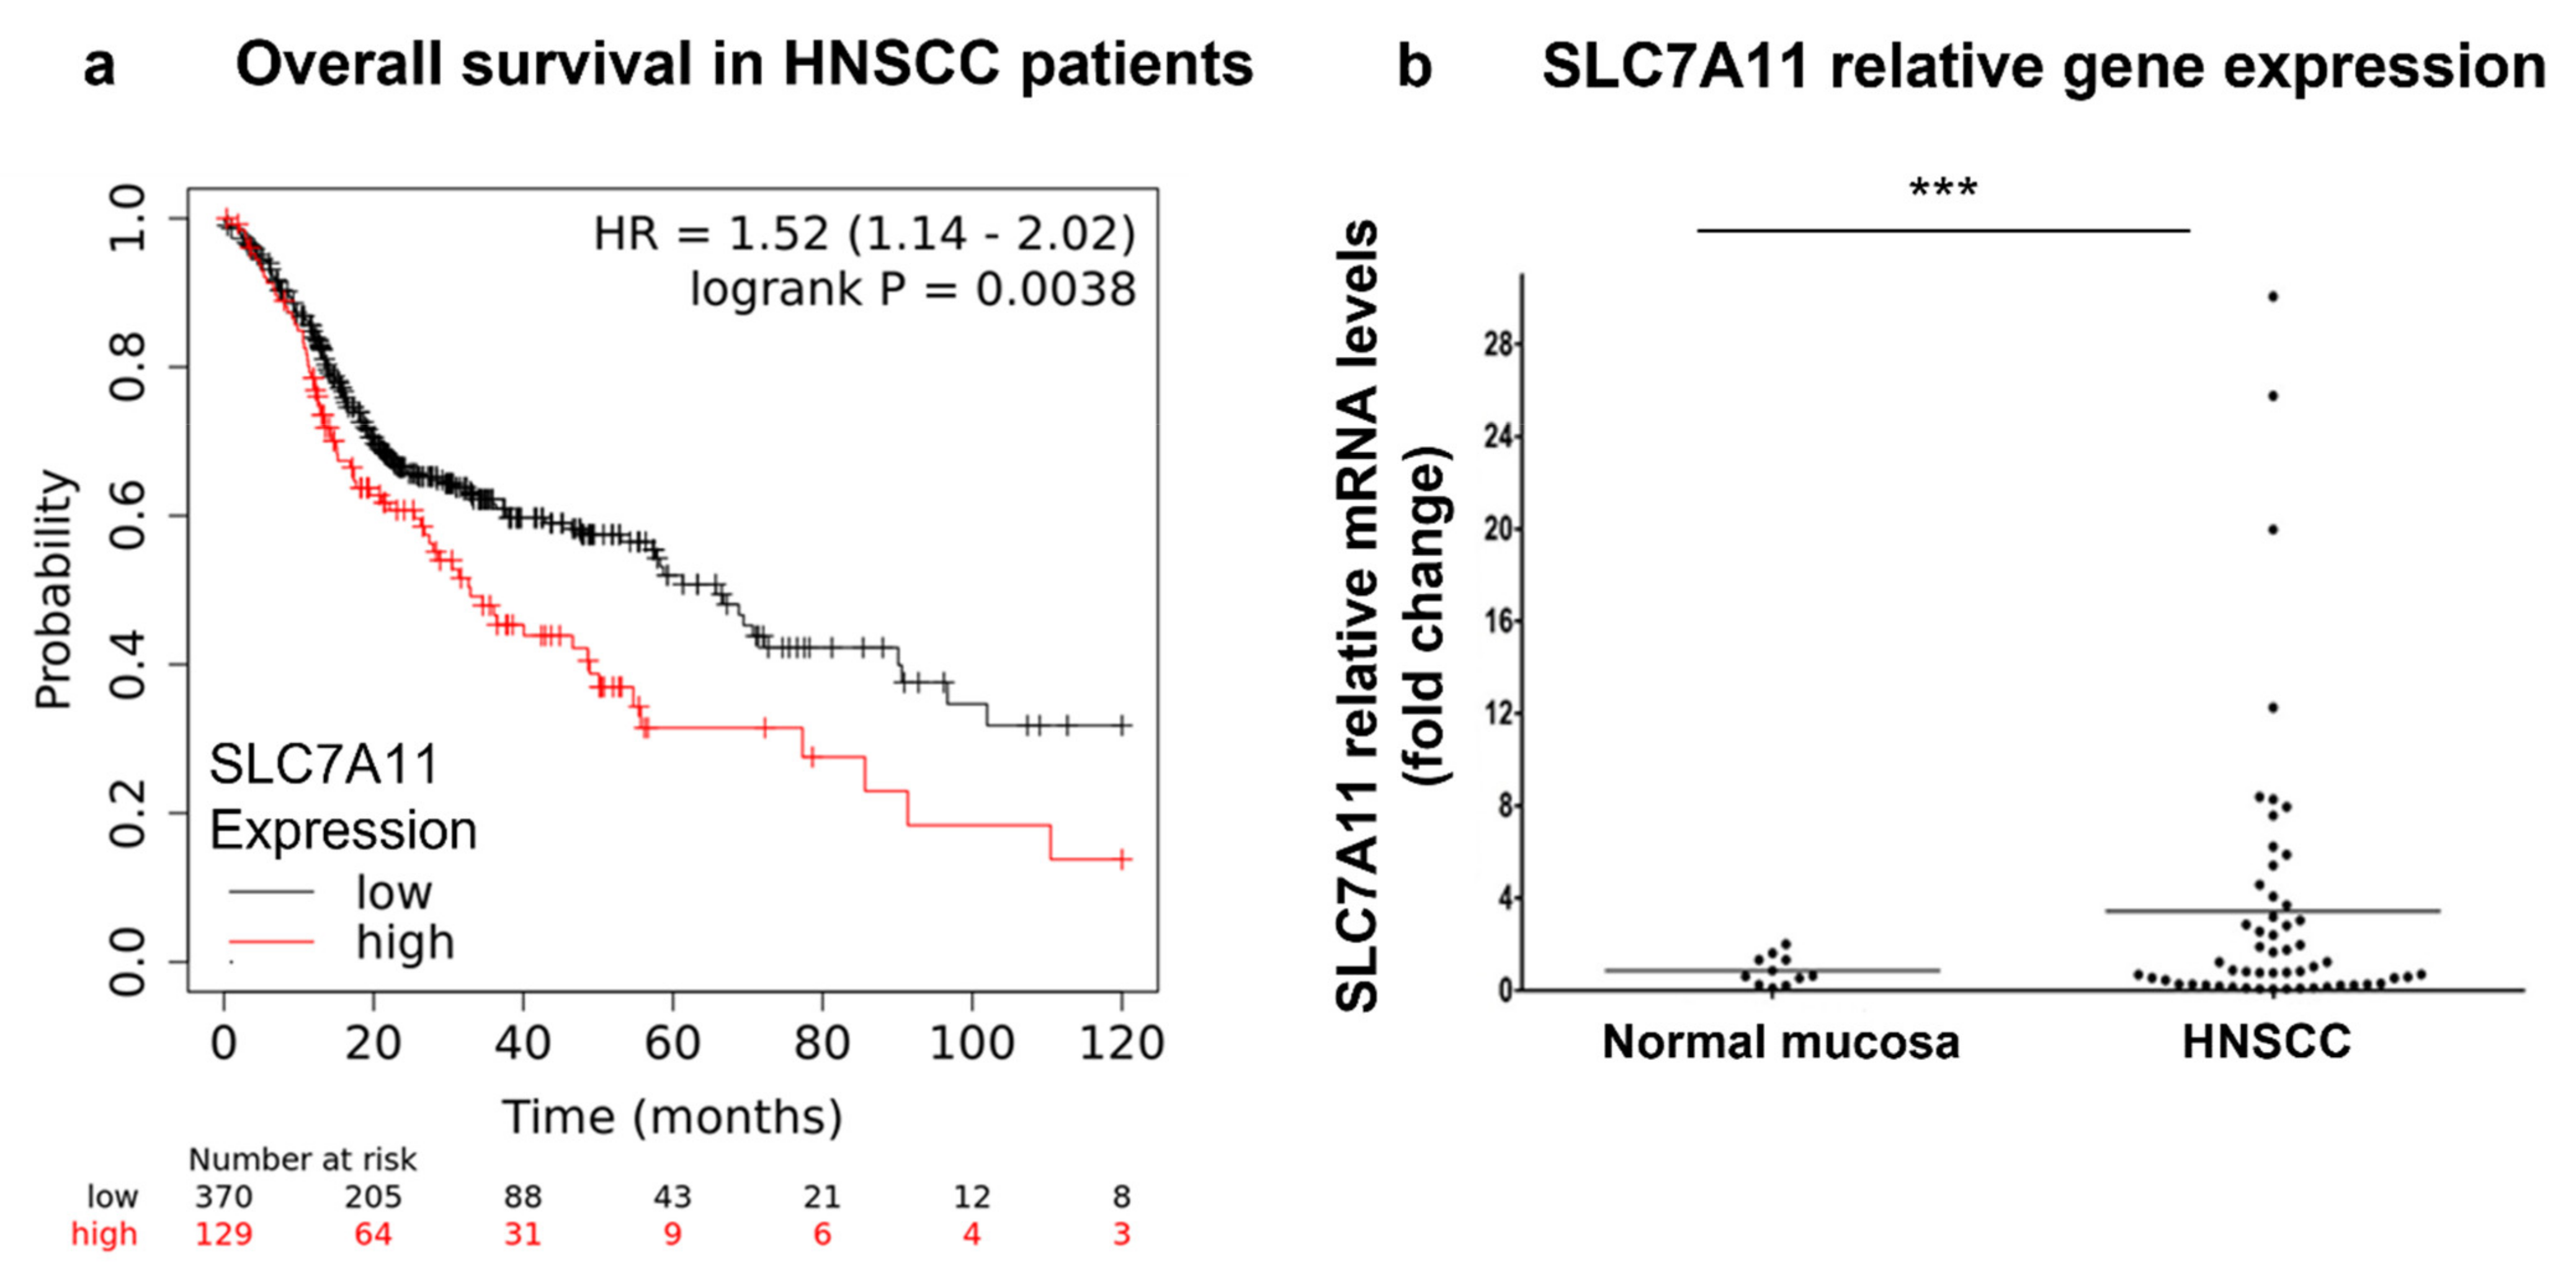
Abstract
:1. Introduction
2. Materials and Methods
2.1. Patients
2.2. RNA Isolation and Relative Quantification via RT-PCR
2.3. Immunohistochemistry and Immunocytochemistry Staining and Image Acquisition
2.4. TCGA-HNSCC Dataset Analysis
2.5. Cell Lines and Cell Culture
2.6. Cell Viability Assay
2.7. Three-Dimensional Tomographic Microscopy
2.8. Lipid Peroxidation
2.9. Measurement of ROS Levels
2.10. Analysis of Erk1/2 Activation
2.11. Promega Lumit™ Immunoassay Cellular System
2.12. Statistical Analysis
3. Results
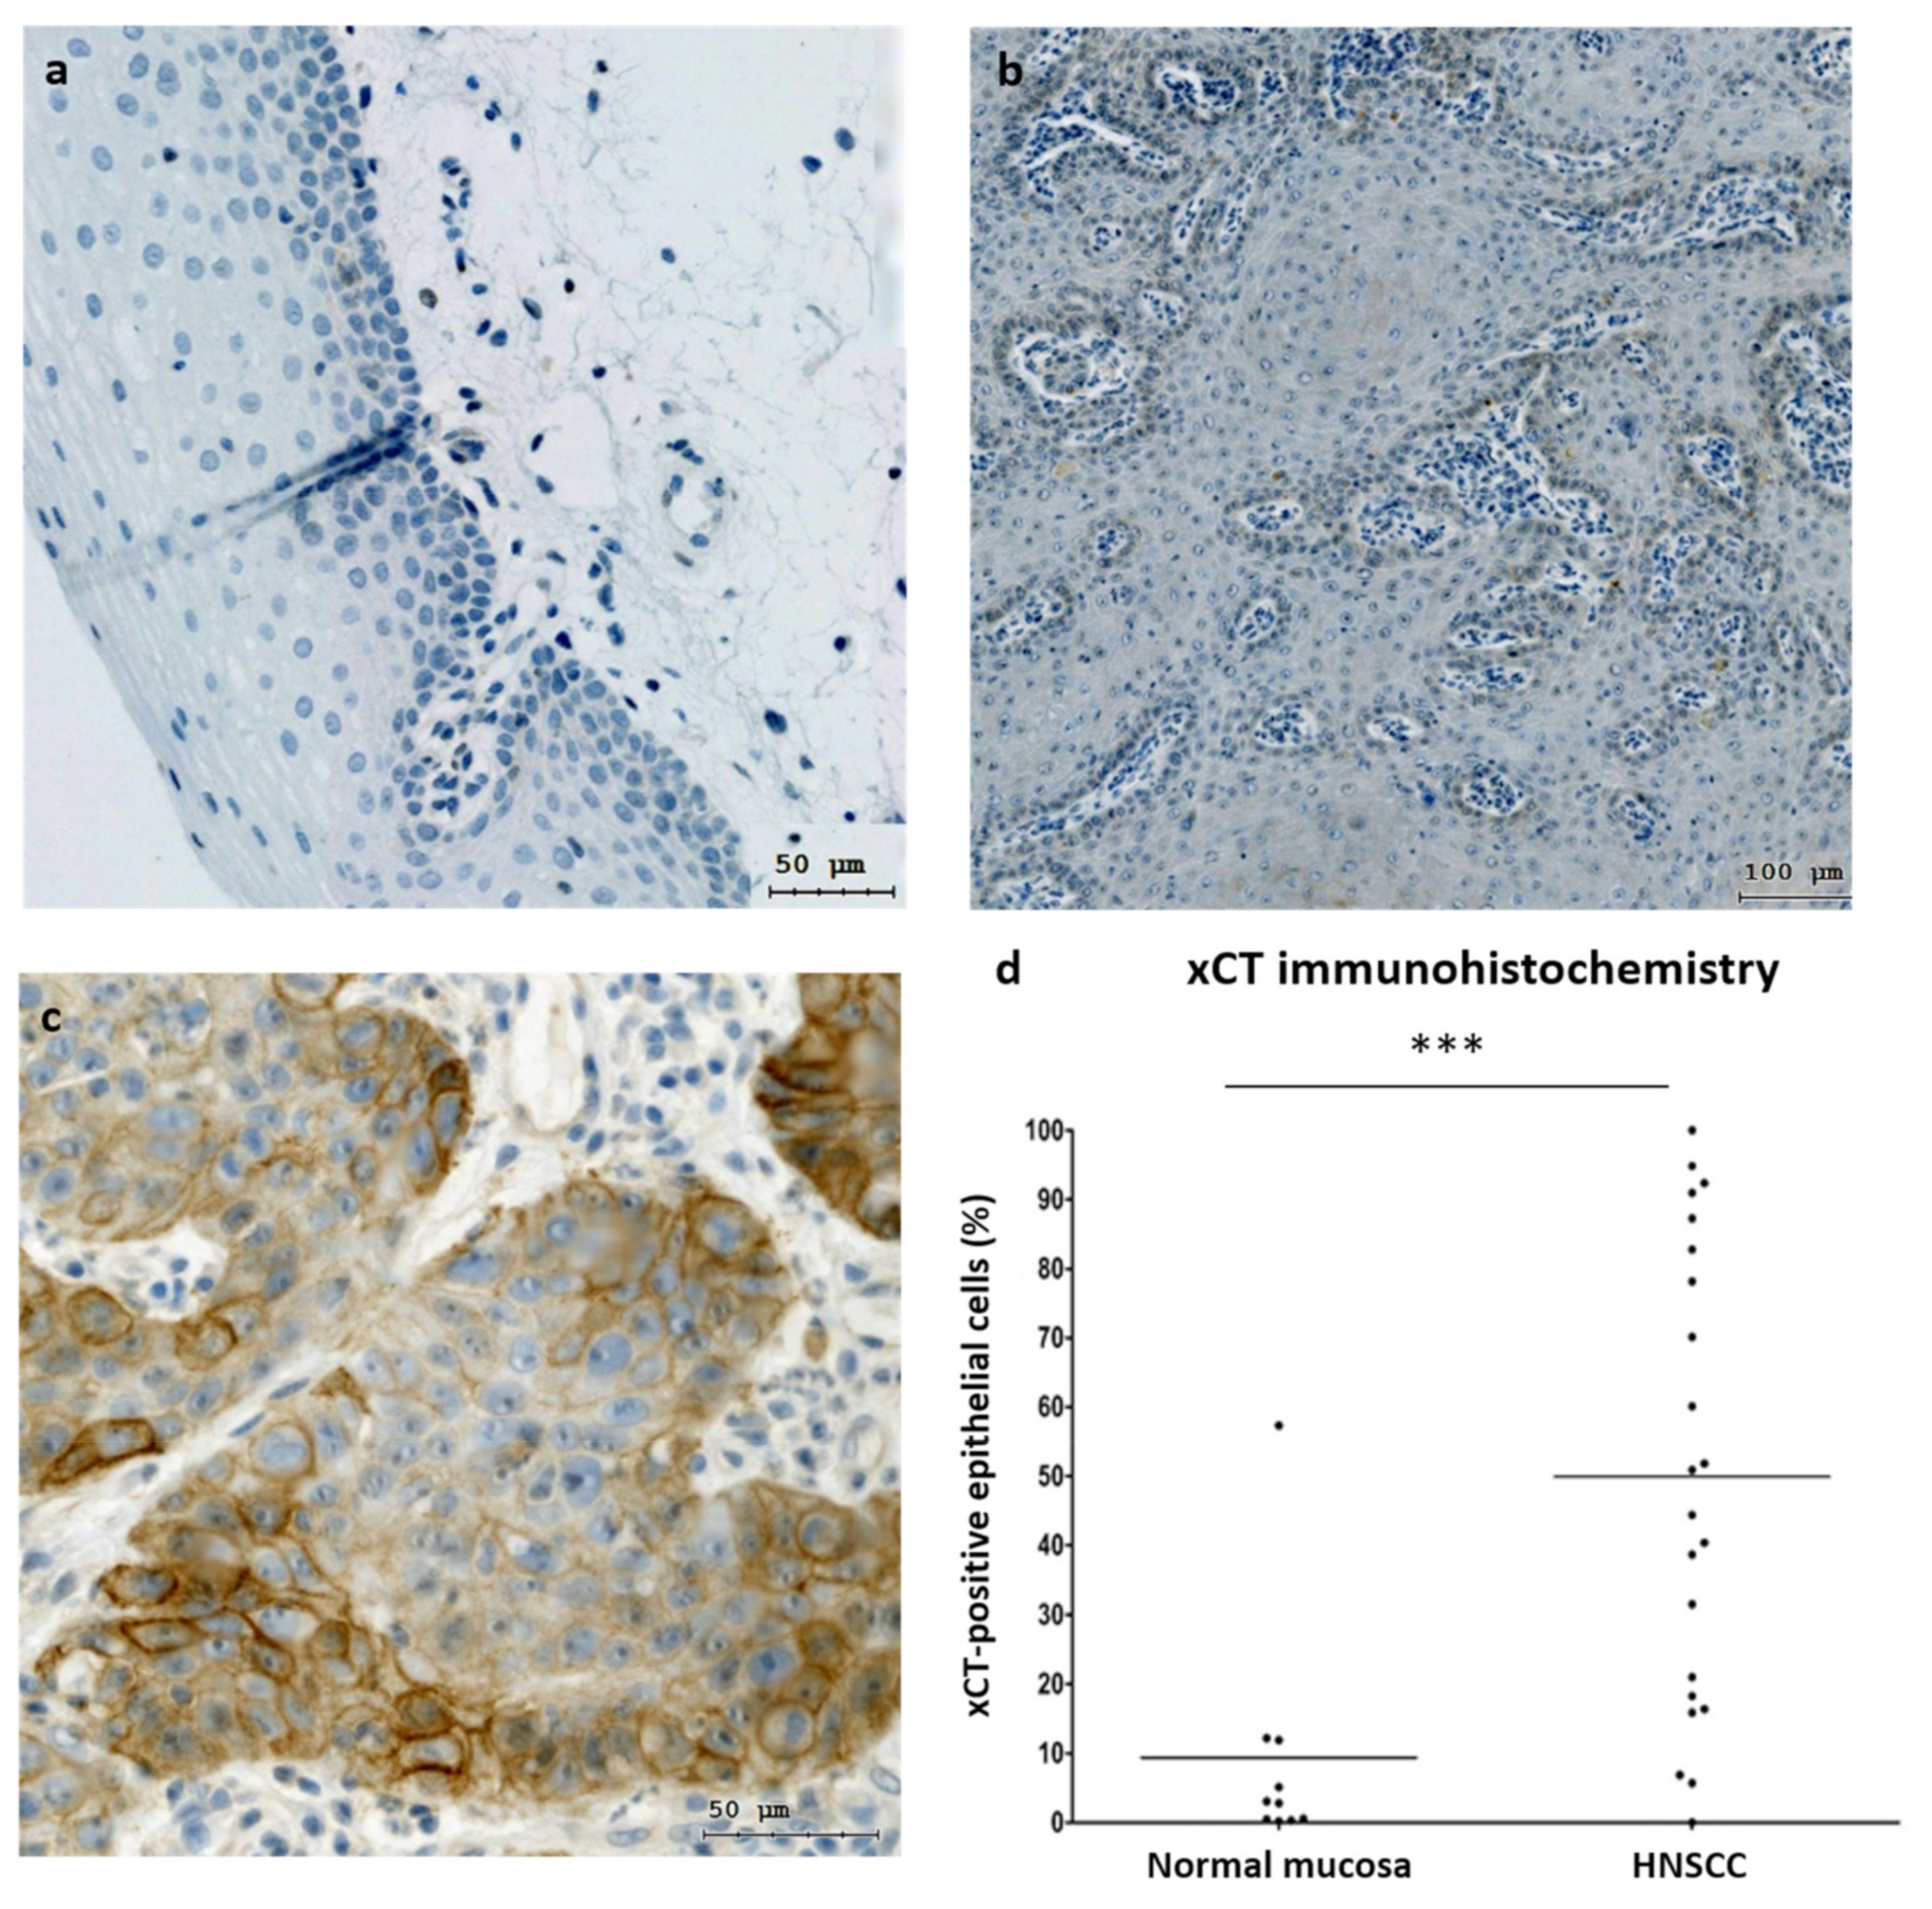
3.1. xCT (SLC7A11) Is Overexpressed in Malignant Tissues and Is Negatively Associated with the Overall Survival Rate in HNSCC Patients
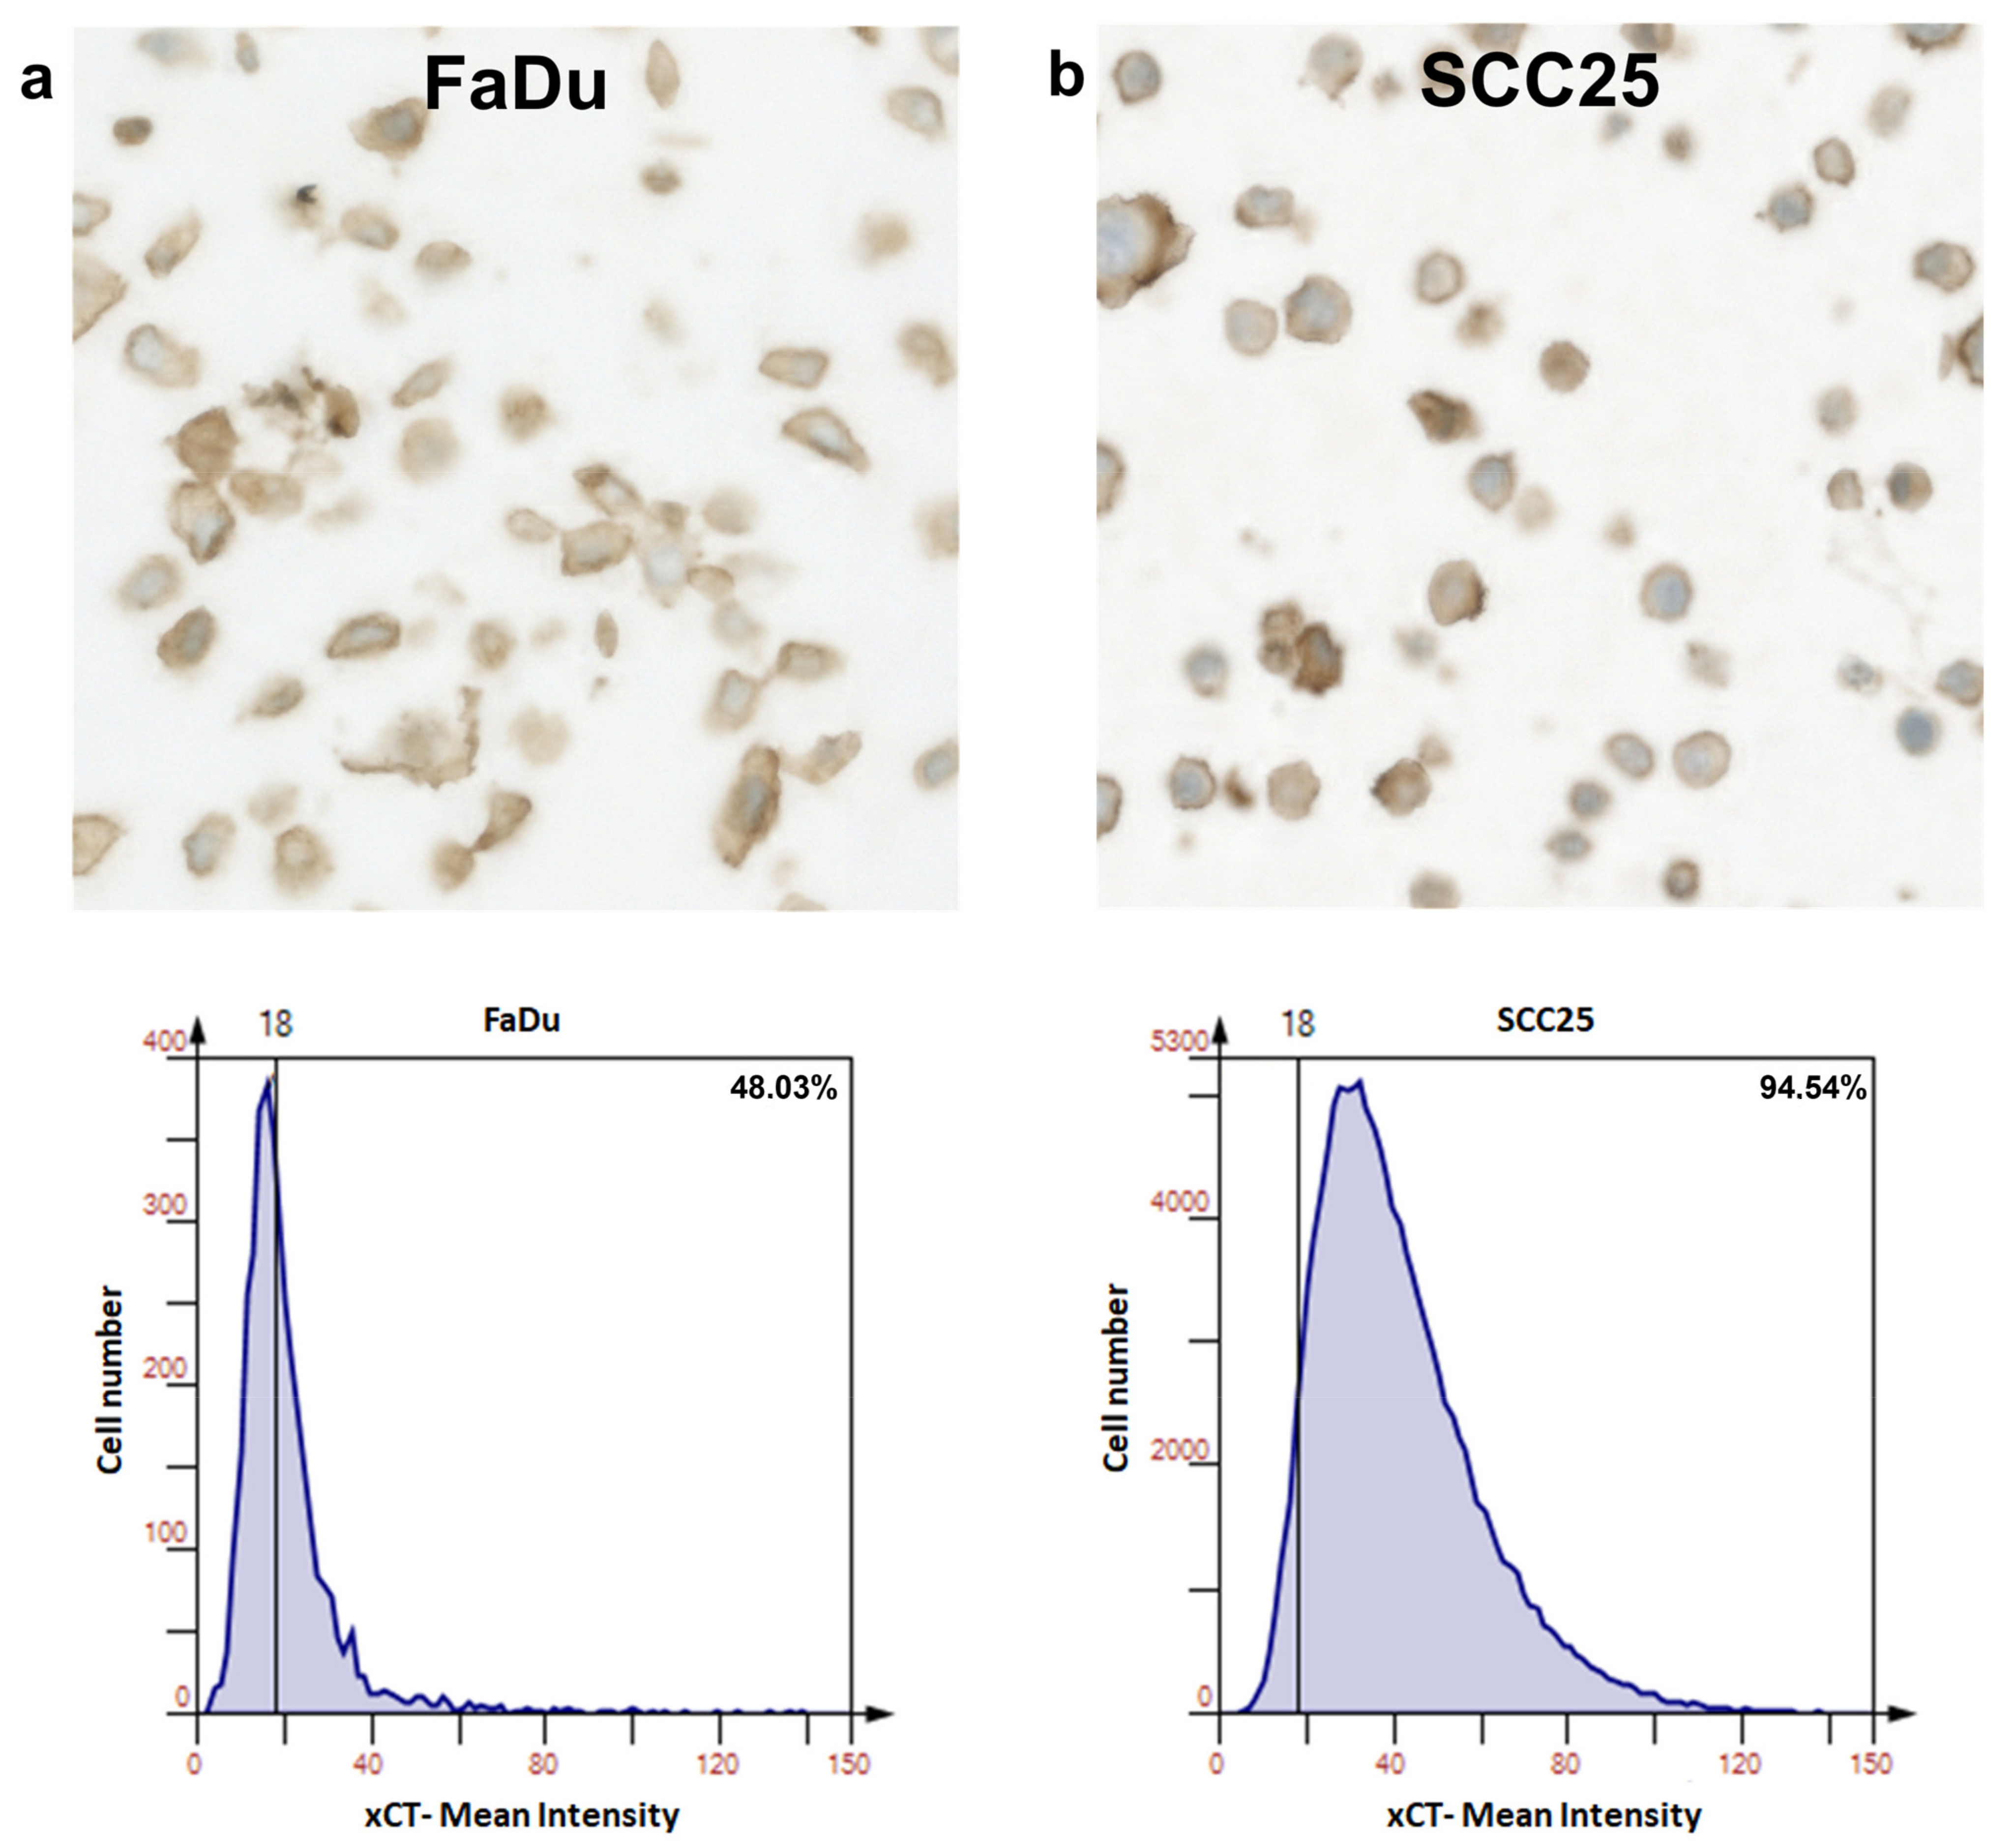
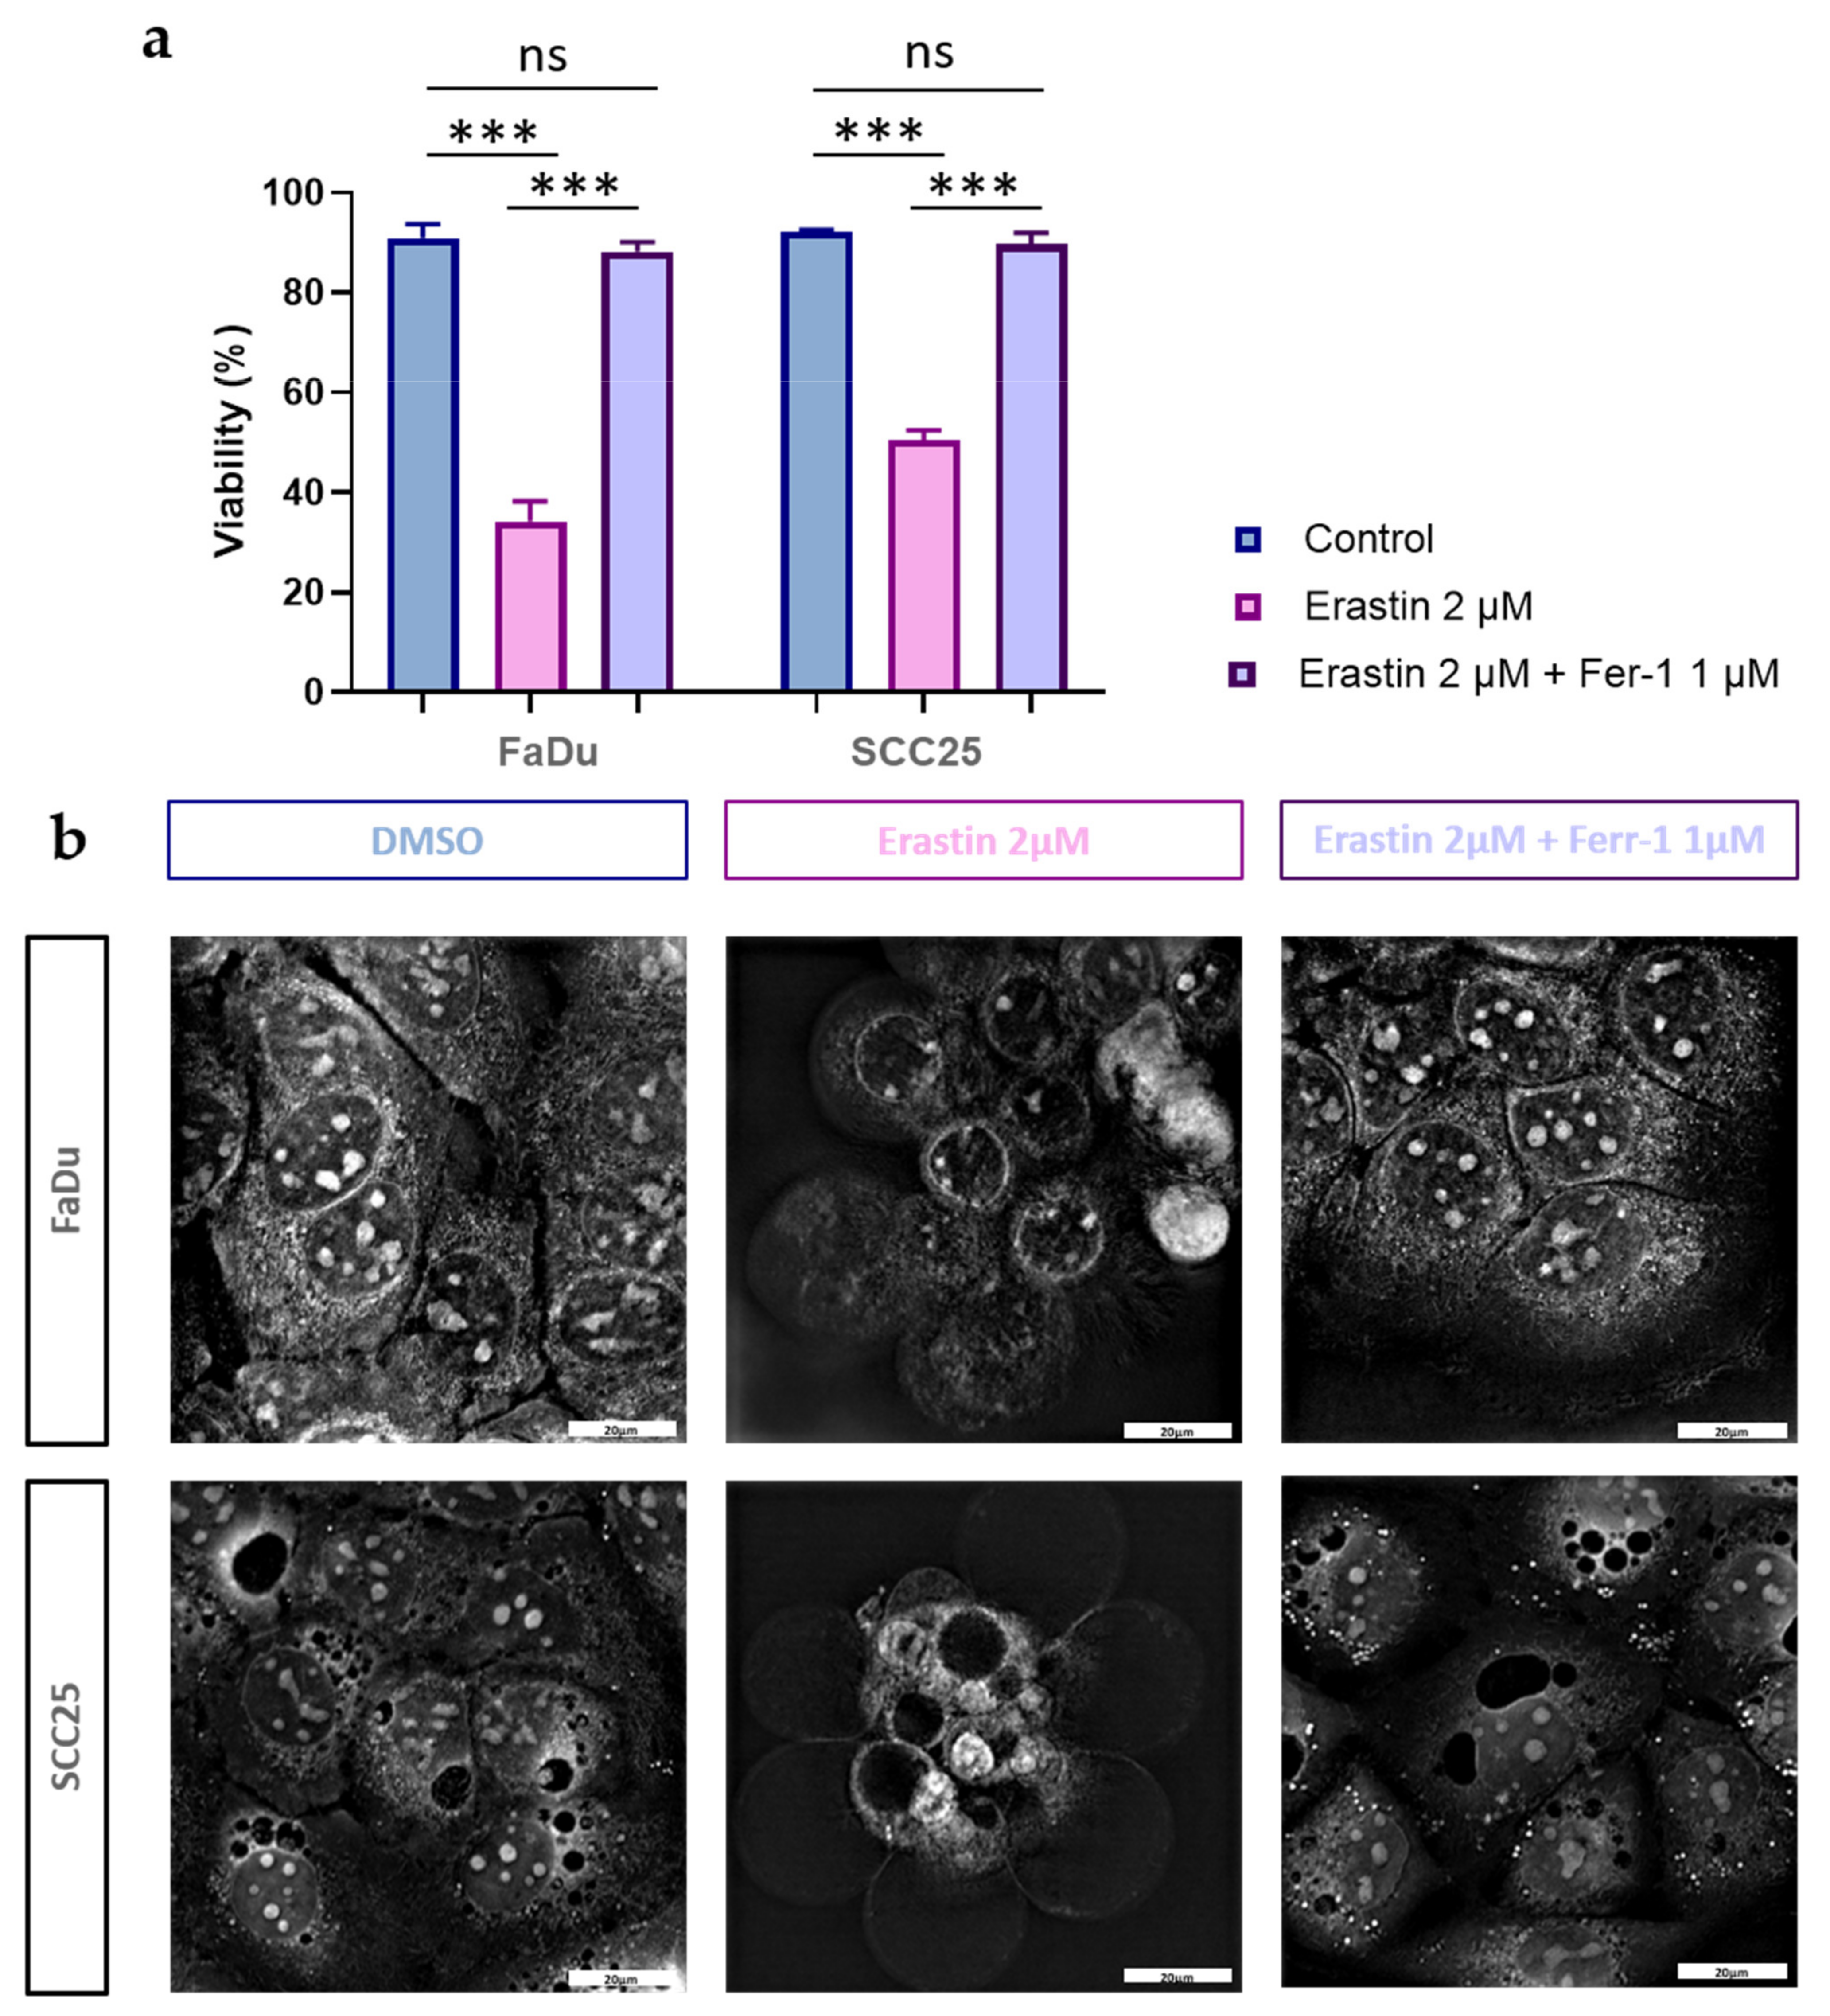
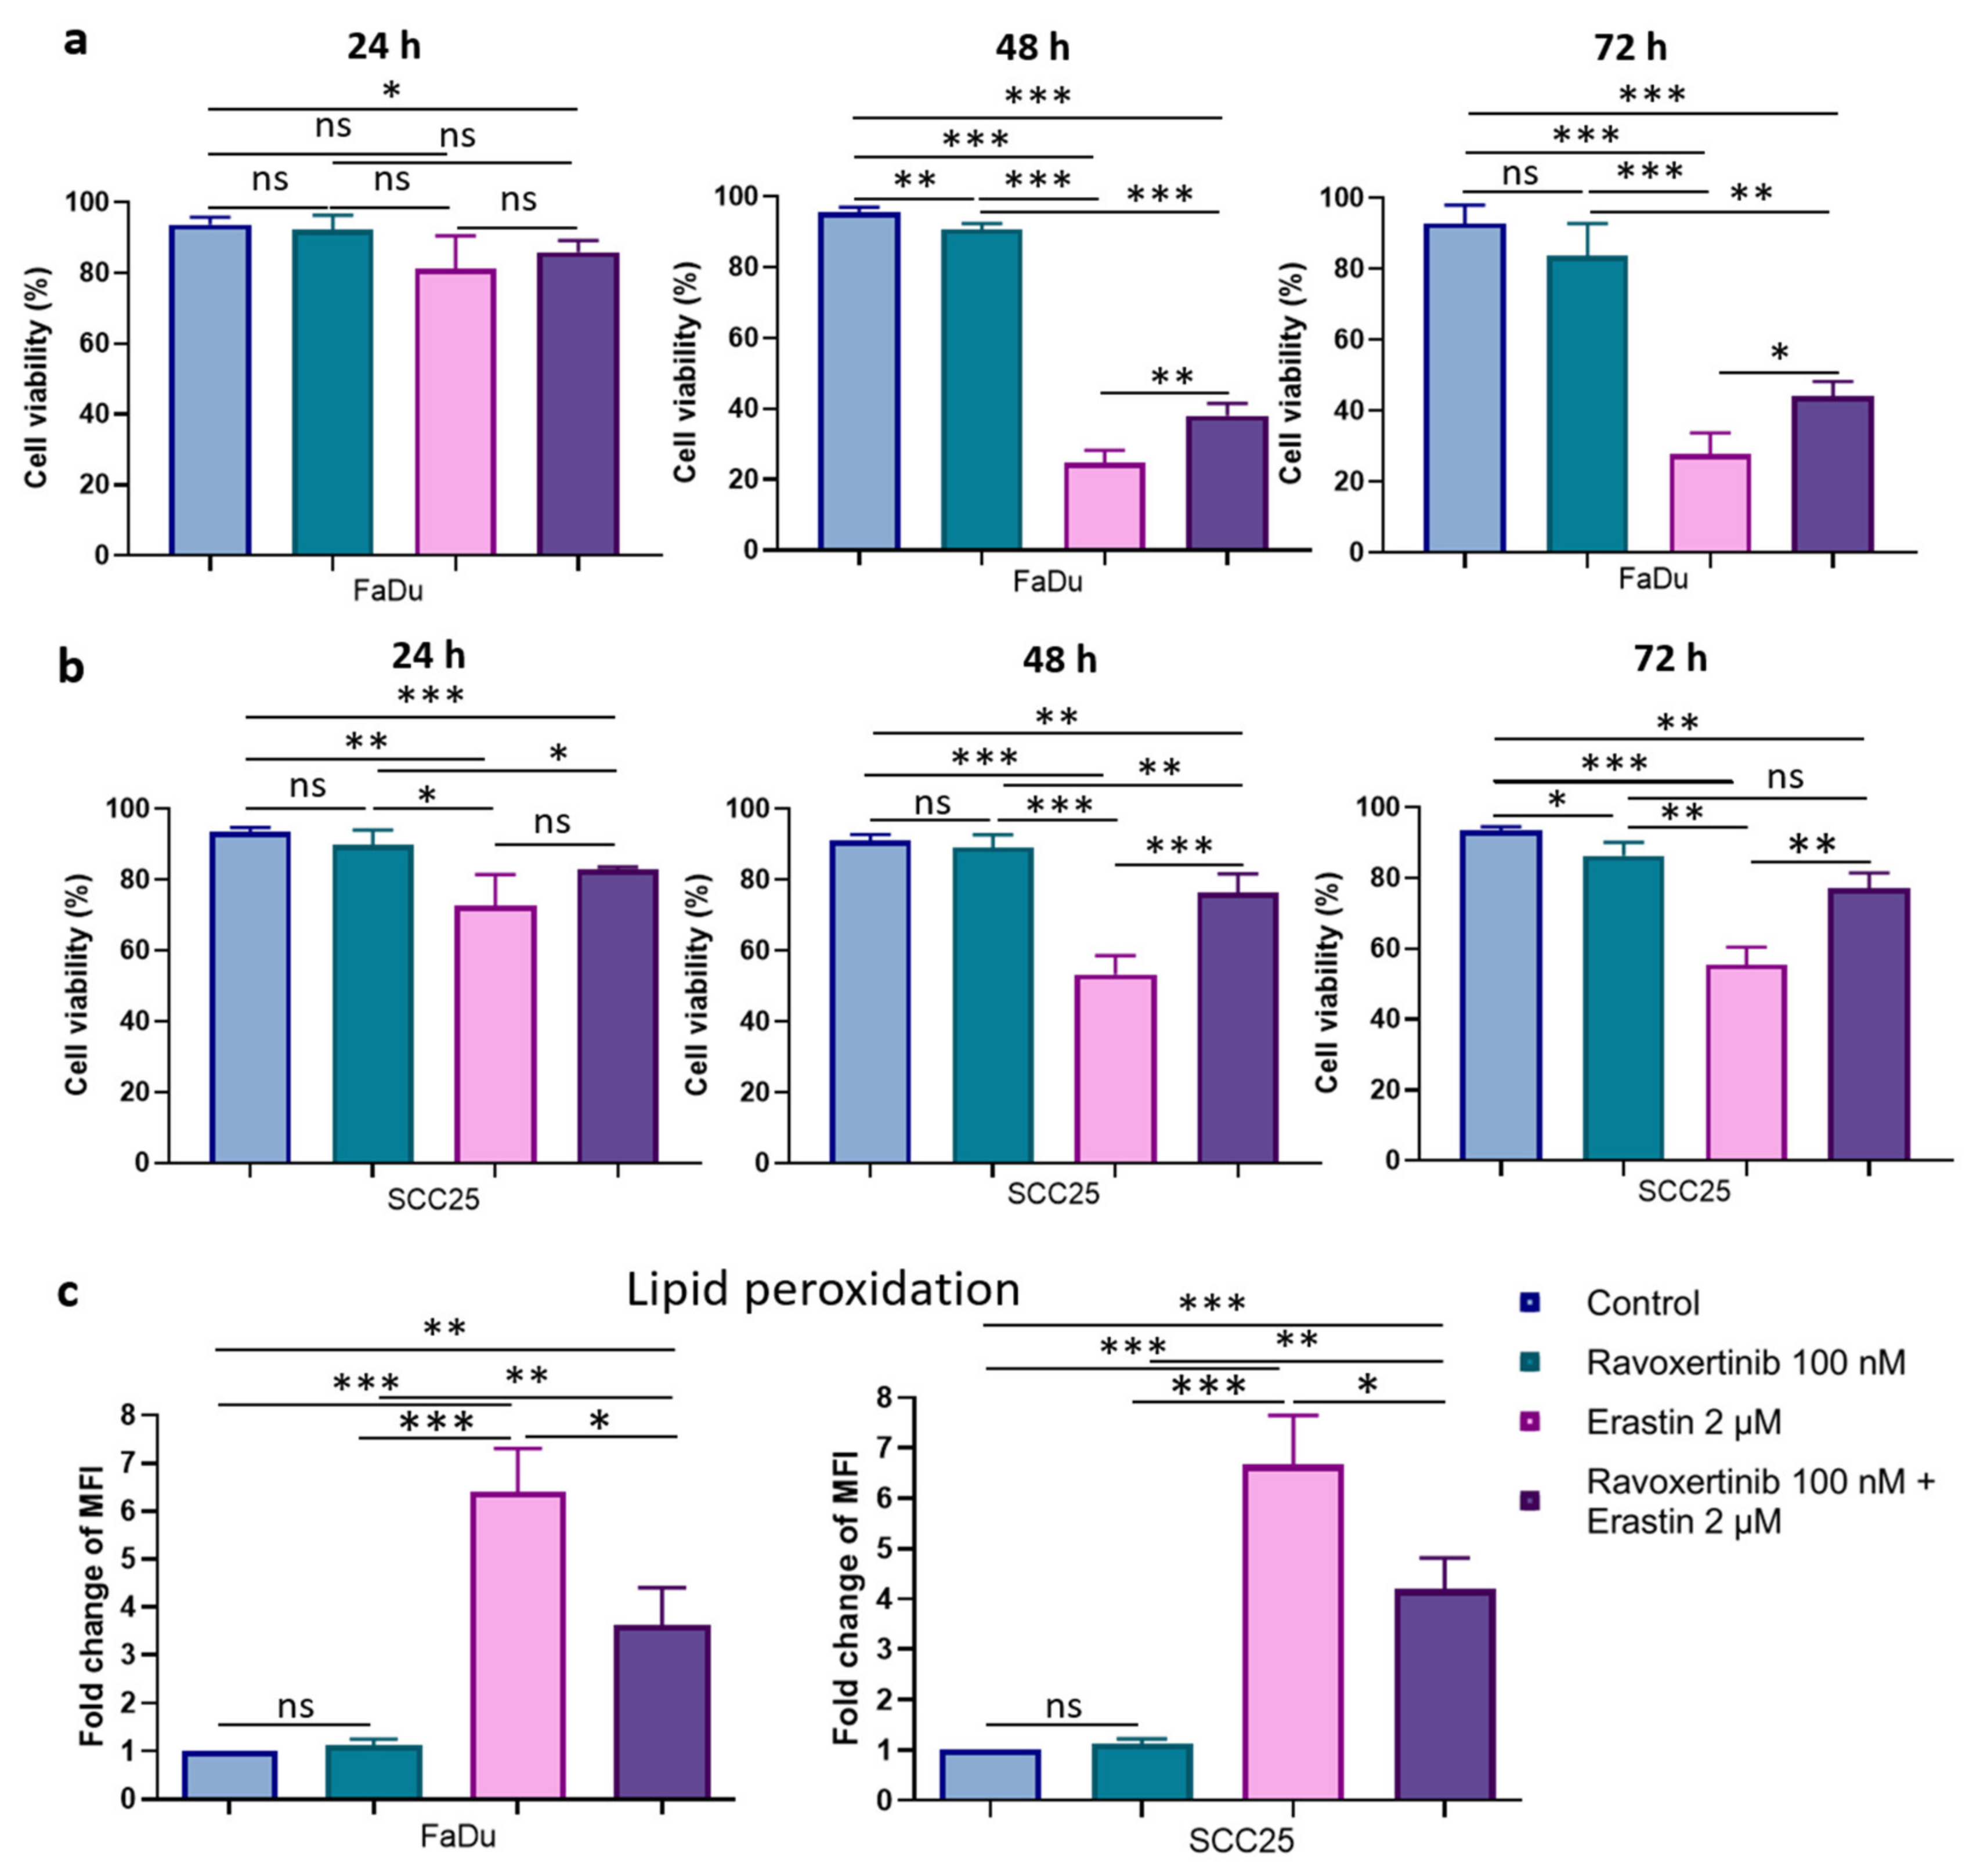
3.2. xCT (SLC7A11) Overexpressing HNSCC Cell Lines FaDu and SCC25 Demonstrate Sensitivity to Ferroptosis Inducer Erastin
3.3. HNSCC Cells Are Characterized by Expression of Phosphorylated Erk1/2
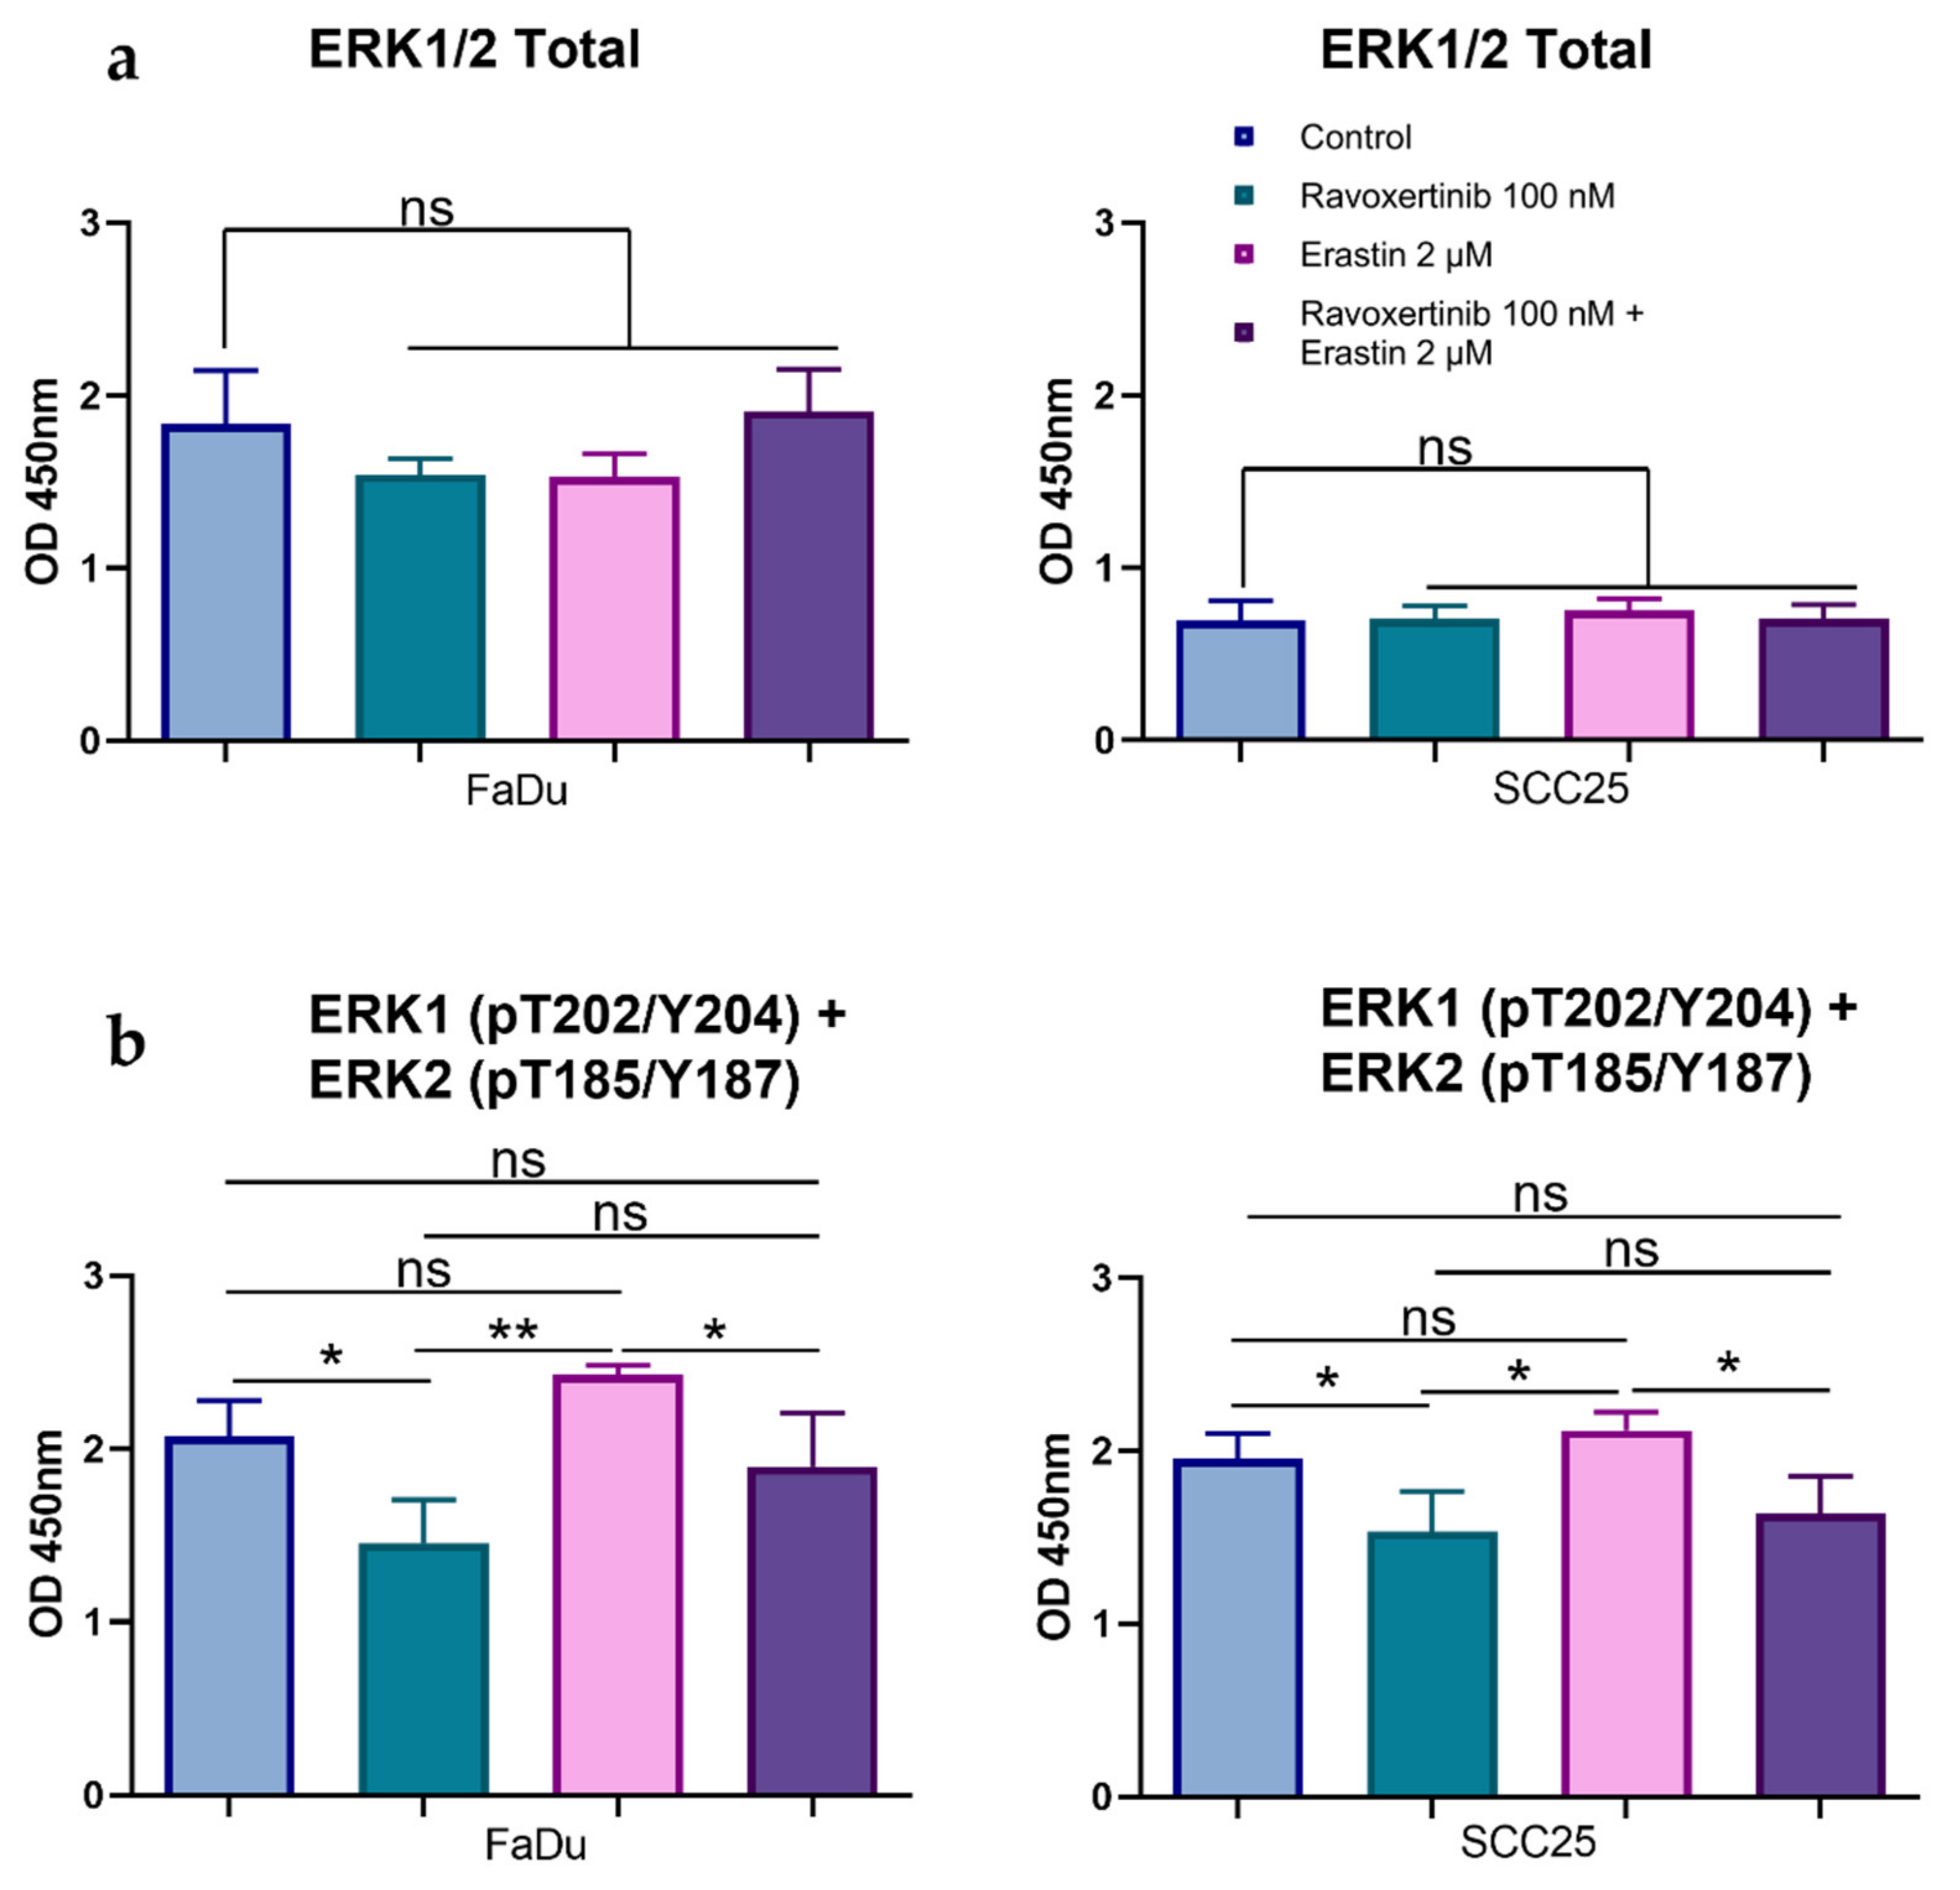
3.4. Erk1/2 Inhibitor Ravoxertinib Mitigates HNSCC Cell Susceptibility to Erastin
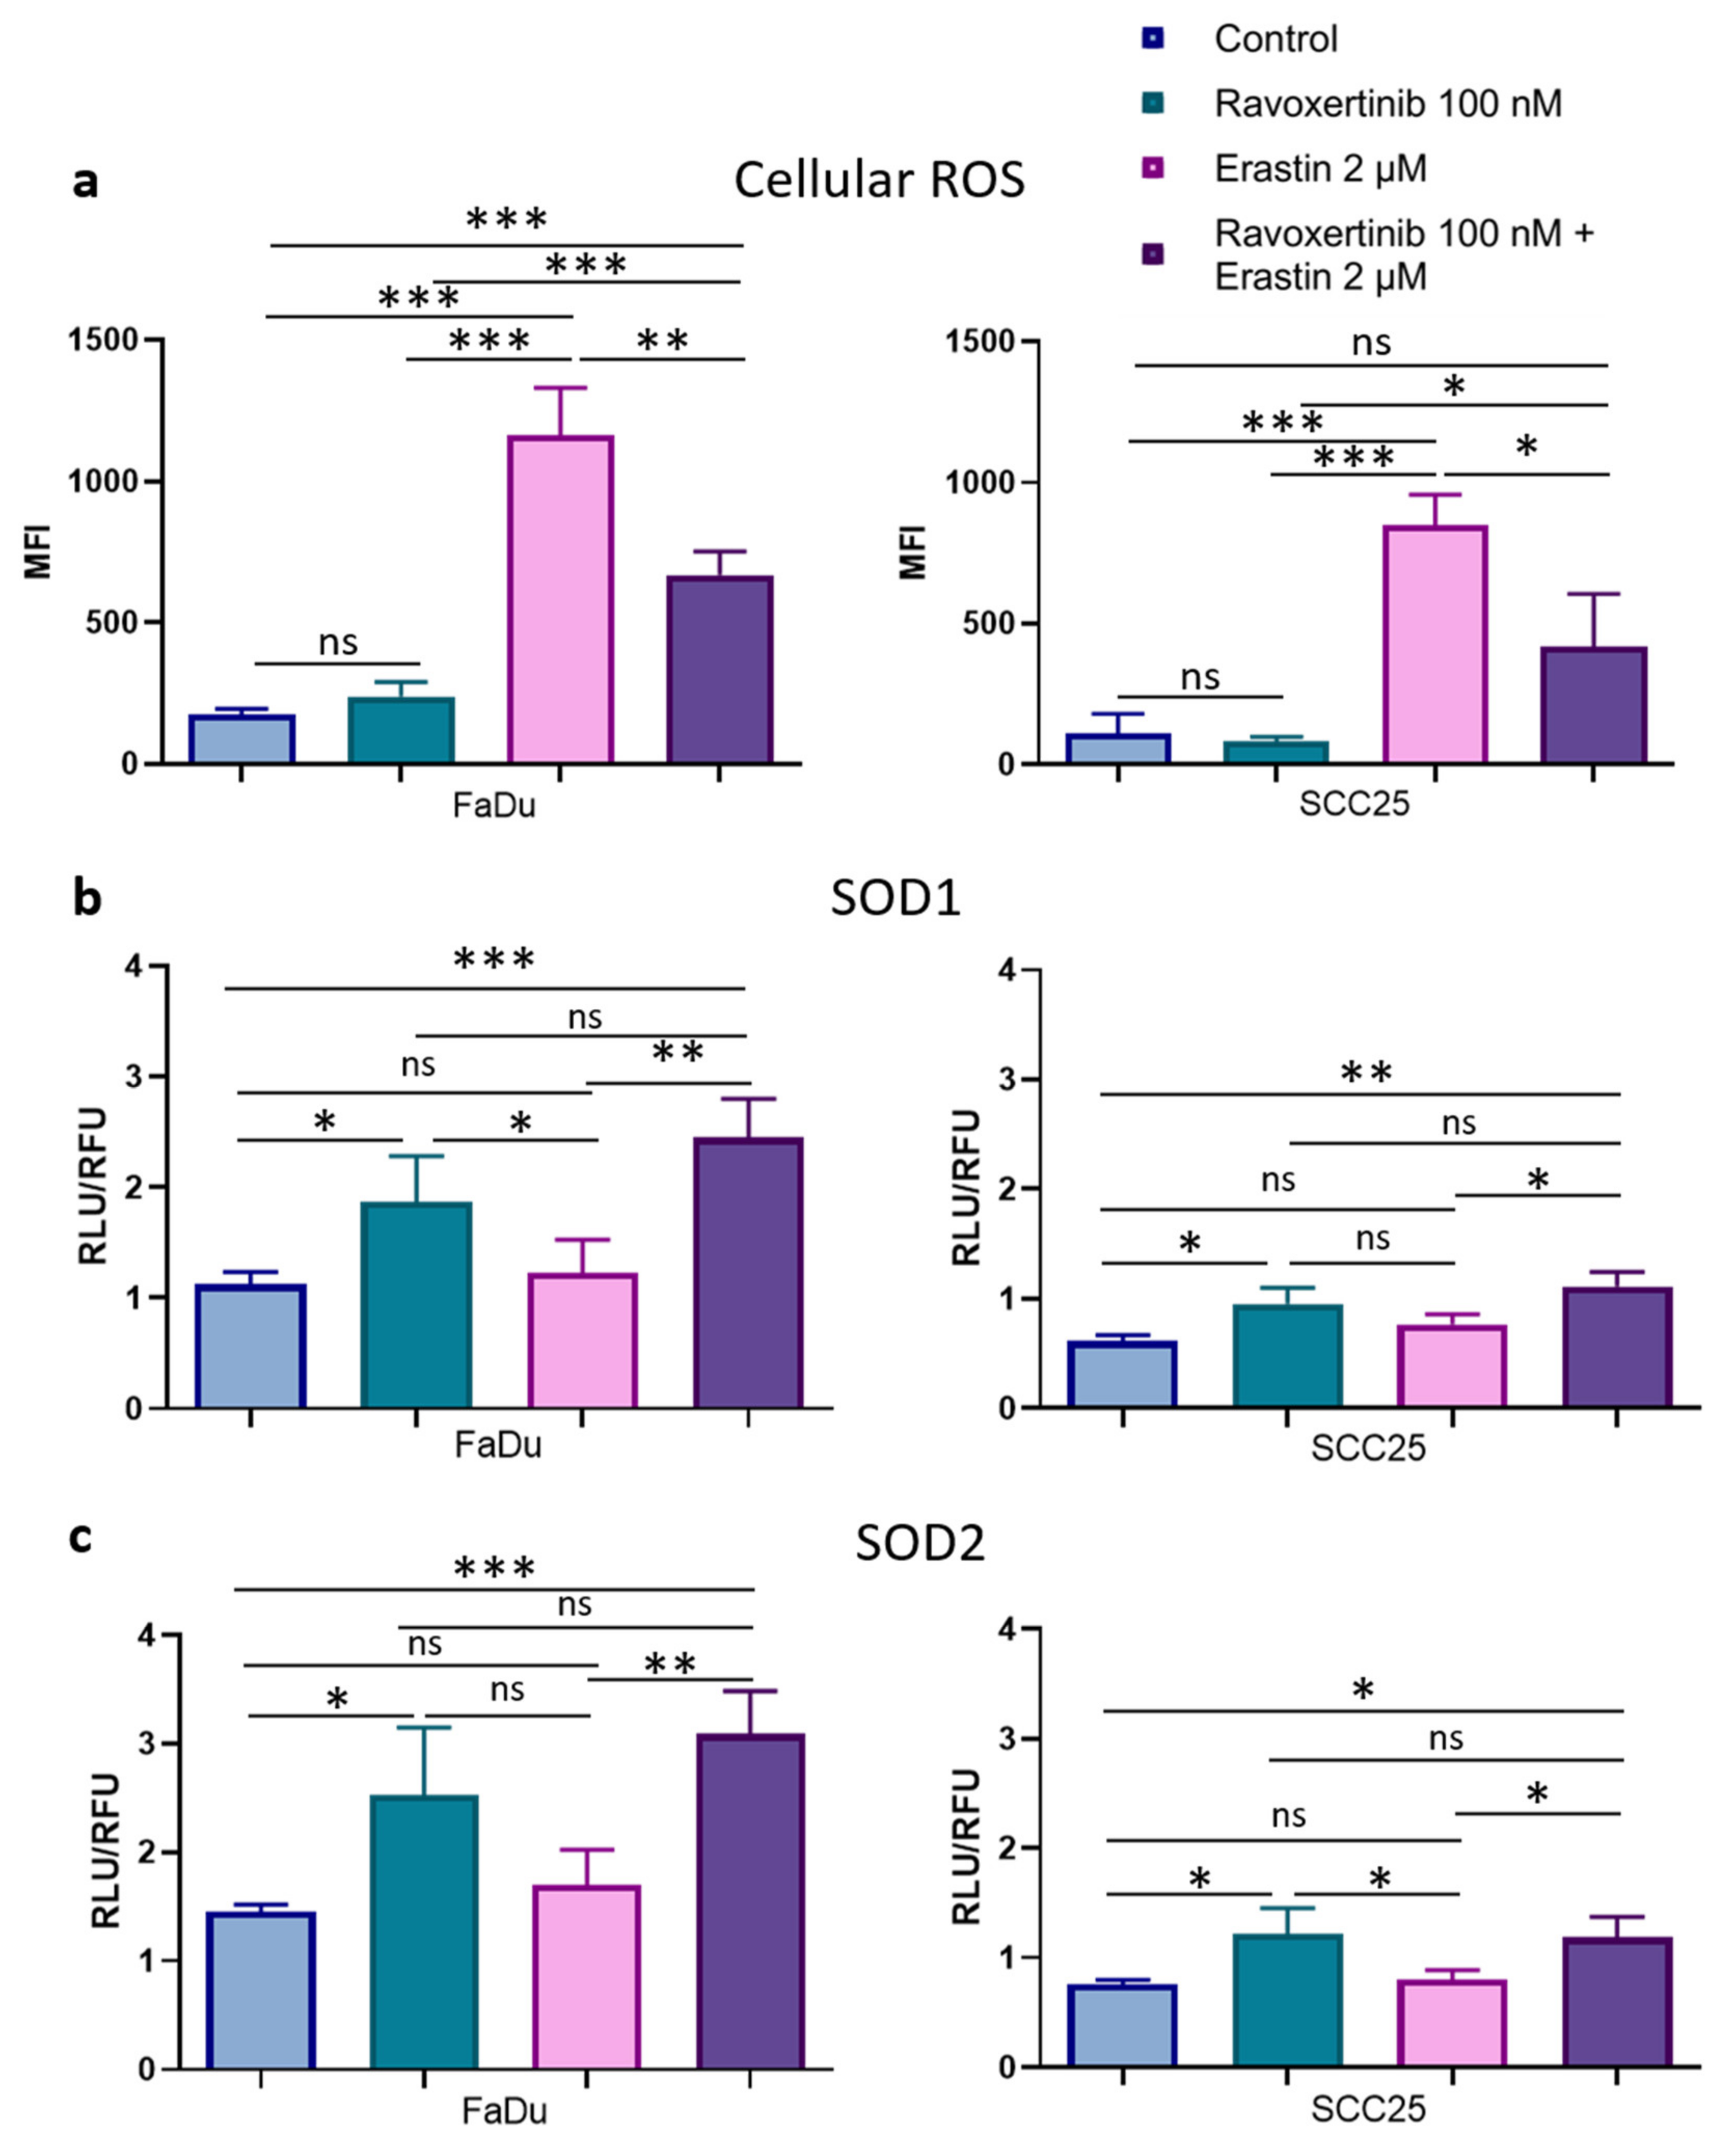
3.5. Erk1/2 Inhibitor Ravoxertinib Decreases ROS Production and Enhances Expression of ROS Scavengers in HNSCC Cells in Response to Erastin
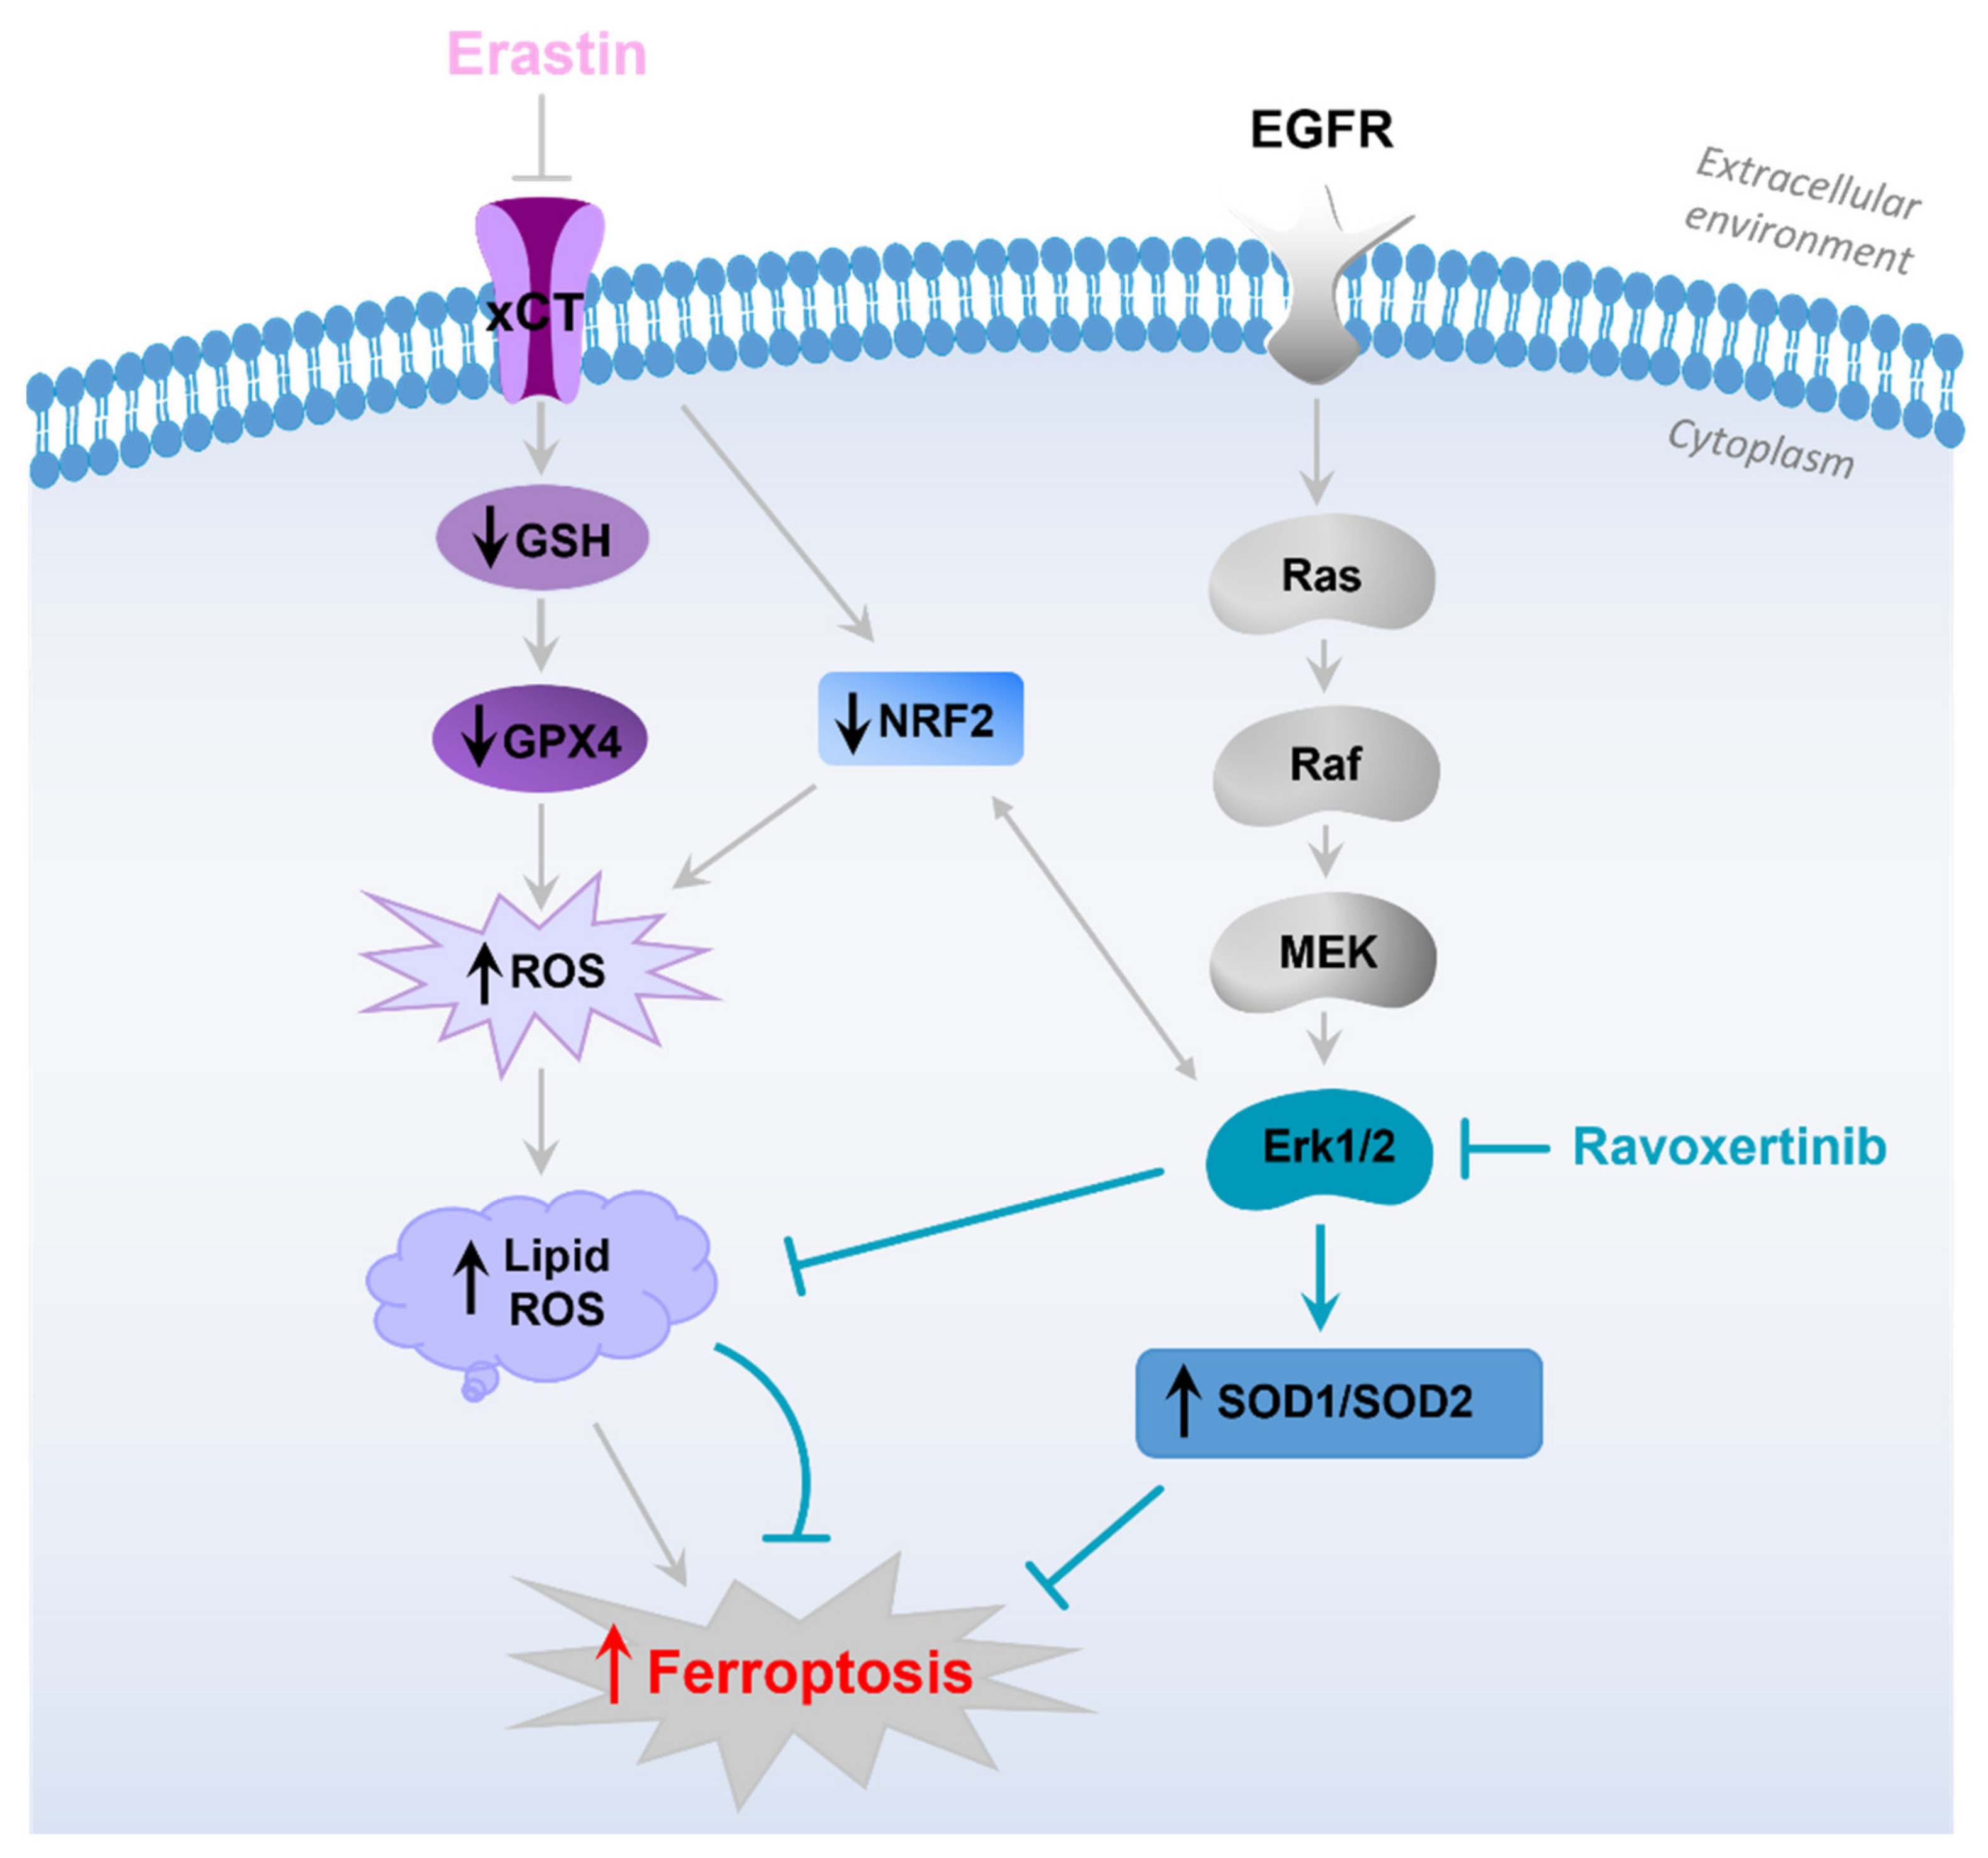
4. Discussion
Supplementary Materials
Author Contributions
Funding
Institutional Review Board Statement
Informed Consent Statement
Data Availability Statement
Conflicts of Interest
Abbreviations
| ATCC | American Type Culture Collection |
| CT | Threshold cycle |
| DMSO | Dimethylsulfoxide |
| FBS | Fetal bovine serum |
| Fer-1 | Ferrostatin-1 |
| GSH | Glutathione |
| HNSCC | Head and neck squamous cell carcinoma |
| HPV | Human papilloma virus |
| KM | Kaplan–Meier |
| MFI | Mean fluorescence intensity |
| OD | Optical density |
| PSG | Penicillin/streptomycin/glutamine |
| RFU | Relative Fluorescence Unit |
| RLU | Relative Light Unit |
| ROS | Reactive oxygen species |
| SLC7A11 | Solute carrier family 7 member 11 |
| SOD | Superoxide dismutase |
| TCGA | The Cancer Genome Atlas |
References
- Sung, H.; Ferlay, J.; Siegel, R.L.; Laversanne, M.; Soerjomataram, I.; Jemal, A.; Bray, F. Global cancer statistics 2020: GLOBOCAN estimates of incidence and mortality worldwide for 36 cancers in 185 countries. CA Cancer J. Clin. 2021, 71, 209–249. [Google Scholar] [CrossRef] [PubMed]
- De Angelis, R.; Sant, M.; Coleman, M.P.; Francisci, S.; Baili, P.; Pierannunzio, D.; Trama, A.; Visser, O.; Brenner, H.; Ardanaz, E. Cancer survival in Europe 1999–2007 by country and age: Results of EUROCARE-5—A population-based study. Lancet Oncol. 2014, 15, 23–34. [Google Scholar] [CrossRef] [PubMed]
- Johnson, D.E.; Burtness, B.; Leemans, C.R.; Lui, V.W.Y.; Bauman, J.E.; Grandis, J.R. Head and neck squamous cell carcinoma. Nat. Rev. Dis. Prim. 2020, 6, 1–22. [Google Scholar] [CrossRef] [PubMed]
- Raudenská, M.; Balvan, J.; Masařík, M. Cell death in head and neck cancer pathogenesis and treatment. Cell Death Dis. 2021, 12, 192. [Google Scholar] [CrossRef] [PubMed]
- Dixon, S.J.; Lemberg, K.M.; Lamprecht, M.R.; Skouta, R.; Zaitsev, E.M.; Gleason, C.E.; Patel, D.N.; Bauer, A.J.; Cantley, A.M.; Yang, W.S. Ferroptosis: An iron-dependent form of nonapoptotic cell death. Cell 2012, 149, 1060–1072. [Google Scholar] [CrossRef] [Green Version]
- Li, J.; Cao, F.; Yin, H.-L.; Huang, Z.-J.; Lin, Z.-T.; Mao, N.; Sun, B.; Wang, G. Ferroptosis: Past, present and future. Cell Death Dis. 2020, 11, 88. [Google Scholar] [CrossRef] [Green Version]
- Mou, Y.; Wang, J.; Wu, J.; He, D.; Zhang, C.; Duan, C.; Li, B. Ferroptosis, a new form of cell death: Opportunities and challenges in cancer. J. Hematol. Oncol. 2019, 12, 34. [Google Scholar] [CrossRef] [Green Version]
- Shan, L.; Hao, Y.; Wang, S.; Korotcov, A.; Zhang, R.; Wang, T.; Califano, J.; Gu, X.; Sridhar, R.; Bhujwalla, Z.M. Visualizing head and neck tumors in vivo using near-infrared fluorescent transferrin conjugate. Mol. Imaging 2008, 7, 42–49. [Google Scholar] [CrossRef]
- Li, S.; Liu, Y.; Li, J.; Zhao, X.; Yu, D. Mechanisms of ferroptosis and application to head and neck squamous cell carcinoma treatments. DNA Cell Biol. 2021, 40, 720–732. [Google Scholar] [CrossRef]
- Roh, J.-L.; Kim, E.H.; Jang, H.; Shin, D. Nrf2 inhibition reverses the resistance of cisplatin-resistant head and neck cancer cells to artesunate-induced ferroptosis. Redox Biol. 2017, 11, 254–262. [Google Scholar] [CrossRef]
- Shin, D.; Kim, E.H.; Lee, J.; Roh, J.-L. Nrf2 inhibition reverses resistance to GPX4 inhibitor-induced ferroptosis in head and neck cancer. Free Radic. Biol. Med. 2018, 129, 454–462. [Google Scholar] [CrossRef] [PubMed]
- Feng, L.; Zhao, K.; Sun, L.; Yin, X.; Zhang, J.; Liu, C.; Li, B. SLC7A11 regulated by NRF2 modulates esophageal squamous cell carcinoma radiosensitivity by inhibiting ferroptosis. J. Transl. Med. 2021, 19, 367. [Google Scholar] [CrossRef] [PubMed]
- Xie, Y.; Hou, W.; Song, X.; Yu, Y.; Huang, J.; Sun, X.; Kang, R.; Tang, D. Ferroptosis: Process and function. Cell Death Differ. 2016, 23, 369–379. [Google Scholar] [CrossRef] [Green Version]
- Abdel-Messeih, P.L.; Nosseir, N.M.; Bakhe, O.H. Evaluation of inflammatory cytokines and oxidative stress markers in prostate cancer patients undergoing curative radiotherapy. Cent. Eur. J. Immunol. 2017, 42, 68–72. [Google Scholar] [CrossRef] [PubMed] [Green Version]
- Ma, C.-s.; Lv, Q.-M.; Zhang, K.-R.; Tang, Y.-B.; Zhang, Y.-f.; Shen, Y.; Lei, H.-m.; Zhu, L. NRF2-GPX4/SOD2 axis imparts resistance to EGFR-tyrosine kinase inhibitors in non-small-cell lung cancer cells. Acta Pharmacol. Sin. 2021, 42, 613–623. [Google Scholar] [CrossRef] [PubMed]
- Roh, J.-L.; Kim, E.H.; Jang, H.J.; Park, J.Y.; Shin, D. Induction of ferroptotic cell death for overcoming cisplatin resistance of head and neck cancer. Cancer Lett. 2016, 381, 96–103. [Google Scholar] [CrossRef] [PubMed]
- Hémon, A.; Louandre, C.; Lailler, C.; Godin, C.; Bottelin, M.; Morel, V.; François, C.; Galmiche, A.; Saidak, Z. SLC7A11 as a biomarker and therapeutic target in HPV-positive head and neck Squamous Cell Carcinoma. Biochem. Biophys. Res. Commun. 2020, 533, 1083–1087. [Google Scholar] [CrossRef] [PubMed]
- Sun, K.; Ren, W.; Li, S.; Zheng, J.; Huang, Y.; Zhi, K.; Gao, L. MiR-34c-3p upregulates erastin-induced ferroptosis to inhibit proliferation in oral squamous cell carcinomas by targeting SLC7A11. Pathol. Res. Pract. 2022, 231, 153778. [Google Scholar] [CrossRef] [PubMed]
- Han, L.; Li, L.; Wu, G. Induction of ferroptosis by carnosic acid-mediated inactivation of Nrf2/HO-1 potentiates cisplatin responsiveness in OSCC cells. Mol. Cell. Probes 2022, 64, 101821. [Google Scholar] [CrossRef]
- Dong, H.; Xia, Y.; Jin, S.; Xue, C.; Wang, Y.; Hu, R.; Jiang, H. Nrf2 attenuates ferroptosis-mediated IIR-ALI by modulating TERT and SLC7A11. Cell Death Dis. 2021, 12, 1–10. [Google Scholar] [CrossRef]
- Tang, Y.-C.; Hsiao, J.-R.; Jiang, S.-S.; Chang, J.-Y.; Chu, P.-Y.; Liu, K.-J.; Fang, H.-L.; Lin, L.-M.; Chen, H.-H.; Huang, Y.-W. c-MYC-directed NRF2 drives malignant progression of head and neck cancer via glucose-6-phosphate dehydrogenase and transketolase activation. Theranostics 2021, 11, 5232. [Google Scholar] [CrossRef] [PubMed]
- Mukhopadhyay, S.; Goswami, D.; Adiseshaiah, P.P.; Burgan, W.; Yi, M.; Guerin, T.M.; Kozlov, S.V.; Nissley, D.V.; McCormick, F. Undermining Glutaminolysis Bolsters Chemotherapy While NRF2 Promotes Chemoresistance in KRAS-Driven Pancreatic CancersExploiting Glutaminolysis to Combat Chemoresistance in PDAC. Cancer Res. 2020, 80, 1630–1643. [Google Scholar] [CrossRef] [PubMed] [Green Version]
- Mukhopadhyay, S.; Vander Heiden, M.G.; McCormick, F. The metabolic landscape of RAS-driven cancers from biology to therapy. Nat. Cancer 2021, 2, 271–283. [Google Scholar] [CrossRef] [PubMed]
- Liu, N.; Liang, Y.; Wei, T.; Zou, L.; Huang, X.; Kong, L.; Tang, M.; Zhang, T. The role of ferroptosis mediated by NRF2/ERK-regulated ferritinophagy in CdTe QDs-induced inflammation in macrophage. J. Hazard. Mater. 2022, 436, 129043. [Google Scholar] [CrossRef]
- Kalyankrishna, S.; Grandis, J.R. Epidermal growth factor receptor biology in head and neck cancer. J. Clin. Oncol. 2006, 24, 2666–2672. [Google Scholar] [CrossRef]
- Rehmani, H.S.; Issaeva, N. EGFR in head and neck squamous cell carcinoma: Exploring possibilities of novel drug combinations. Ann. Transl. Med. 2020, 8, 813. [Google Scholar] [CrossRef]
- Albanell, J.; Codony-Servat, J.; Rojo, F.; Del Campo, J.M.; Sauleda, S.; Anido, J.; Raspall, G.; Giralt, J.; Roselló, J.; Nicholson, R.I. Activated extracellular signal-regulated kinases: Association with epidermal growth factor receptor/transforming growth factor α expression in head and neck squamous carcinoma and inhibition by anti-epidermal growth factor receptor treatments. Cancer Res. 2001, 61, 6500–6510. [Google Scholar]
- Poursaitidis, I.; Wang, X.; Crighton, T.; Labuschagne, C.; Mason, D.; Cramer, S.L.; Triplett, K.; Roy, R.; Pardo, O.E.; Seckl, M.J. Oncogene-selective sensitivity to synchronous cell death following modulation of the amino acid nutrient cystine. Cell Rep. 2017, 18, 2547–2556. [Google Scholar] [CrossRef] [Green Version]
- Dong, J.; Ramachandiran, S.; Tikoo, K.; Jia, Z.; Lau, S.S.; Monks, T.J. EGFR-independent activation of p38 MAPK and EGFR-dependent activation of ERK1/2 are required for ROS-induced renal cell death. Am. J. Physiol. Ren. Physiol. 2004, 287, F1049–F1058. [Google Scholar] [CrossRef] [Green Version]
- Søland, T.M.; Husvik, C.; Koppang, H.S.; Boysen, M.; Sandvik, L.; Clausen, O.P.F.; Christoffersen, T.; Bryne, M. A study of phosphorylated ERK1/2 and COX-2 in early stage (T1–T2) oral squamous cell carcinomas. J. Oral Pathol. Med. 2008, 37, 535–542. [Google Scholar] [CrossRef]
- Judd, N.P.; Winkler, A.E.; Murillo-Sauca, O.; Brotman, J.J.; Law, J.H.; Lewis, J.S.; Dunn, G.P.; Bui, J.D.; Sunwoo, J.B.; Uppaluri, R. ERK1/2 Regulation of CD44 Modulates Oral Cancer AggressivenessERK1/2 Controls Mouse Oral Cancer Growth via CD44. Cancer Res. 2012, 72, 365–374. [Google Scholar] [CrossRef] [PubMed]
- Ngan, H.-L.; Law, C.-H.; Choi, Y.C.Y.; Chan, J.Y.-S.; Lui, V.W.Y. Precision drugging of the MAPK pathway in head and neck cancer. NPJ Genom. Med. 2022, 7, 20. [Google Scholar] [CrossRef]
- Li, X.L.; Hara, T.; Choi, Y.; Subramanian, M.; Francis, P.; Bilke, S.; Walker, R.L.; Pineda, M.; Zhu, Y.; Yang, Y. A p21-ZEB1 complex inhibits epithelial-mesenchymal transition through the microRNA 183-96-182 cluster. Mol. Cell. Biol. 2014, 34, 533–550. [Google Scholar] [CrossRef] [PubMed] [Green Version]
- Flach, C.-F.; Qadri, F.; Bhuiyan, T.R.; Alam, N.H.; Jennische, E.; Holmgren, J.; Lönnroth, I. Differential expression of intestinal membrane transporters in cholera patients. FEBS Lett. 2007, 581, 3183–3188. [Google Scholar] [CrossRef] [PubMed] [Green Version]
- Livak, K.J.; Schmittgen, T.D. Analysis of relative gene expression data using real-time quantitative PCR and the 2−ΔΔCT method. Methods 2001, 25, 402–408. [Google Scholar] [CrossRef] [PubMed]
- Steinbichler, T.; Dudas, J.; Ingruber, J.; Glueckert, R.; Sprung, S.; Fleischer, F.; Cidlinsky, N.; Dejaco, D.; Kofler, B.; Giotakis, A. Slug is a surrogate marker of epithelial to mesenchymal transition (EMT) in head and neck cancer. J. Clin. Med. 2020, 9, 2061. [Google Scholar] [CrossRef] [PubMed]
- Lánczky, A.; Győrffy, B. Web-based survival analysis tool tailored for medical research (KMplot): Development and implementation. J. Med. Internet Res. 2021, 23, e27633. [Google Scholar] [CrossRef]
- Nagy, Á.; Munkácsy, G.; Győrffy, B. Pancancer survival analysis of cancer hallmark genes. Sci. Rep. 2021, 11, 6047. [Google Scholar] [CrossRef]
- Skvortsov, S.; Jimenez, C.R.; Knol, J.C.; Eichberger, P.; Schiestl, B.; Debbage, P.; Skvortsova, I.; Lukas, P. Radioresistant head and neck squamous cell carcinoma cells: Intracellular signaling, putative biomarkers for tumor recurrences and possible therapeutic targets. Radiother. Oncol. 2011, 101, 177–182. [Google Scholar] [CrossRef]
- Skvortsov, S.; Dudas, J.; Eichberger, P.; Witsch-Baumgartner, M.; Loeffler-Ragg, J.; Pritz, C.; Schartinger, V.; Maier, H.; Hall, J.; Debbage, P. Rac1 as a potential therapeutic target for chemo-radioresistant head and neck squamous cell carcinomas (HNSCC). Br. J. Cancer 2014, 110, 2677–2687. [Google Scholar] [CrossRef] [Green Version]
- Li, D.; Li, Y. The interaction between ferroptosis and lipid metabolism in cancer. Signal Transduct. Target. Ther. 2020, 5, 108. [Google Scholar] [CrossRef] [PubMed]
- Battaglia, A.M.; Chirillo, R.; Aversa, I.; Sacco, A.; Costanzo, F.; Biamonte, F. Ferroptosis and cancer: Mitochondria meet the “iron maiden” cell death. Cells 2020, 9, 1505. [Google Scholar] [CrossRef] [PubMed]
- Wu, H.; Wang, F.; Ta, N.; Zhang, T.; Gao, W. The multifaceted regulation of mitochondria in ferroptosis. Life 2021, 11, 222. [Google Scholar] [CrossRef] [PubMed]
- Hayes, J.D.; Dinkova-Kostova, A.T.; Tew, K.D. Oxidative stress in cancer. Cancer Cell 2020, 38, 167–197. [Google Scholar] [CrossRef] [PubMed]
- Valko, M.; Leibfritz, D.; Moncol, J.; Cronin, M.T.; Mazur, M.; Telser, J. Free radicals and antioxidants in normal physiological functions and human disease. Int. J. Biochem. Cell Biol. 2007, 39, 44–84. [Google Scholar] [CrossRef]
- Kuo, C.-W.; Shen, C.-J.; Tung, Y.-T.; Chen, H.-L.; Chen, Y.-H.; Chang, W.-H.; Cheng, K.-C.; Yang, S.-H.; Chen, C.-M. Extracellular superoxide dismutase ameliorates streptozotocin-induced rat diabetic nephropathy via inhibiting the ROS/ERK1/2 signaling. Life Sci. 2015, 135, 77–86. [Google Scholar] [CrossRef]
- Kim, C.H.; Han, S.I.; Lee, S.Y.; Youk, H.S.; Moon, J.Y.; Duong, H.Q.; Park, M.J.; Joo, Y.M.; Park, H.G.; Kim, Y.J. Protein kinase C-ERK1/2 signal pathway switches glucose depletion-induced necrosis to apoptosis by regulating superoxide dismutases and suppressing reactive oxygen species production in A549 lung cancer cells. J. Cell. Physiol. 2007, 211, 371–385. [Google Scholar] [CrossRef]
- Caraglia, M.; Giuberti, G.; Marra, M.; Addeo, R.; Montella, L.; Murolo, M.; Sperlongano, P.; Vincenzi, B.; Naviglio, S.; Del Prete, S. Oxidative stress and ERK1/2 phosphorylation as predictors of outcome in hepatocellular carcinoma patients treated with sorafenib plus octreotide LAR. Cell Death Dis. 2011, 2, e150. [Google Scholar] [CrossRef]
- Goel, B.; Tiwari, A.K.; Pandey, R.K.; Singh, A.P.; Kumar, S.; Sinha, A.; Jain, S.K.; Khattri, A. Therapeutic approaches for the treatment of head and neck squamous cell carcinoma–An update on clinical trials. Transl. Oncol. 2022, 21, 101426. [Google Scholar] [CrossRef]
- Okuno, S.; Sato, H.; Kuriyama-Matsumura, K.; Tamba, M.; Wang, H.; Sohda, S.; Hamada, H.; Yoshikawa, H.; Kondo, T.; Bannai, S. Role of cystine transport in intracellular glutathione level and cisplatin resistance in human ovarian cancer cell lines. Br. J. Cancer 2003, 88, 951–956. [Google Scholar] [CrossRef] [Green Version]
- Huang, Y.; Dai, Z.; Barbacioru, C.; Sadée, W. Cystine-glutamate transporter SLC7A11 in cancer chemosensitivity and chemoresistance. Cancer Res. 2005, 65, 7446–7454. [Google Scholar] [CrossRef] [PubMed]
- Lo, M.; Ling, V.; Wang, Y.; Gout, P. The xc—Cystine/glutamate antiporter: A mediator of pancreatic cancer growth with a role in drug resistance. Br. J. Cancer 2008, 99, 464–472. [Google Scholar] [CrossRef] [PubMed] [Green Version]
- Lo, M.; Wang, Y.Z.; Gout, P.W. The x cystine/glutamate antiporter: A potential target for therapy of cancer and other diseases. J. Cell. Physiol. 2008, 215, 593–602. [Google Scholar] [CrossRef] [PubMed]
- Shi, Z.-Z.; Tao, H.; Fan, Z.-W.; Song, S.-J.; Bai, J. Prognostic and immunological role of key genes of ferroptosis in pan-cancer. Front. Cell Dev. Biol. 2021, 9, 748925. [Google Scholar] [CrossRef] [PubMed]
- Lee, J.R.; Roh, J.L.; Lee, S.M.; Park, Y.; Cho, K.J.; Choi, S.H.; Nam, S.Y.; Kim, S.Y. Overexpression of cysteine-glutamate transporter and CD44 for prediction of recurrence and survival in patients with oral cavity squamous cell carcinoma. Head Neck 2018, 40, 2340–2346. [Google Scholar] [CrossRef] [PubMed]
- Xu, X.; Zhang, X.; Wei, C.; Zheng, D.; Lu, X.; Yang, Y.; Luo, A.; Zhang, K.; Duan, X.; Wang, Y. Targeting SLC7A11 specifically suppresses the progression of colorectal cancer stem cells via inducing ferroptosis. Eur. J. Pharm. Sci. 2020, 152, 105450. [Google Scholar] [CrossRef] [PubMed]
- DeNicola, G.M.; Karreth, F.A.; Humpton, T.J.; Gopinathan, A.; Wei, C.; Frese, K.; Mangal, D.; Kenneth, H.Y.; Yeo, C.J.; Calhoun, E.S. Oncogene-induced Nrf2 transcription promotes ROS detoxification and tumorigenesis. Nature 2011, 475, 106–109. [Google Scholar] [CrossRef] [Green Version]
- Fan, Z.; Wirth, A.; Chen, D.; Wruck, C.; Rauh, M.; Buchfelder, M.; Savaskan, N. Nrf2-Keap1 pathway promotes cell proliferation and diminishes ferroptosis. Oncogenesis 2017, 6, e371. [Google Scholar] [CrossRef] [Green Version]
- Kuang, F.; Liu, J.; Tang, D.; Kang, R. Oxidative damage and antioxidant defense in ferroptosis. Front. Cell Dev. Biol. 2020, 8, 969. [Google Scholar] [CrossRef]
- Zhang, C.; Yu, J.J.; Yang, C.; Shang, S.; Lv, X.X.; Cui, B.; Hua, F. Crosstalk between ferroptosis and stress—Implications in cancer therapeutic responses. Cancer Innov. 2022, 1, 92–113. [Google Scholar] [CrossRef]
- Weng, M.-S.; Chang, J.-H.; Hung, W.-Y.; Yang, Y.-C.; Chien, M.-H. The interplay of reactive oxygen species and the epidermal growth factor receptor in tumor progression and drug resistance. J. Exp. Clin. Cancer Res. 2018, 37, 61. [Google Scholar] [CrossRef] [PubMed]
- Ayala, A.; Muñoz, M.F.; Argüelles, S. Lipid peroxidation: Production, metabolism, and signaling mechanisms of malondialdehyde and 4-hydroxy-2-nonenal. Oxidative Med. Cell. Longev. 2014, 2014, 360438. [Google Scholar] [CrossRef] [Green Version]
- Zalyte, E.; Cicenas, J. Starvation mediates pancreatic cancer cell sensitivity to ferroptosis via ERK1/2, JNK and changes in the cell mesenchymal state. Int. J. Mol. Med. 2022, 49, 1–14. [Google Scholar] [CrossRef] [PubMed]
- Yagoda, N.; von Rechenberg, M.; Zaganjor, E.; Bauer, A.J.; Yang, W.S.; Fridman, D.J.; Wolpaw, A.J.; Smukste, I.; Peltier, J.M.; Boniface, J.J. RAS–RAF–MEK-dependent oxidative cell death involving voltage-dependent anion channels. Nature 2007, 447, 865–869. [Google Scholar] [CrossRef] [PubMed] [Green Version]
- Lei, P.; Bai, T.; Sun, Y. Mechanisms of ferroptosis and relations with regulated cell death: A review. Front. Physiol. 2019, 10, 139. [Google Scholar] [CrossRef] [PubMed] [Green Version]
- Montllor-Albalate, C.; Kim, H.; Thompson, A.E.; Jonke, A.P.; Torres, M.P.; Reddi, A.R. Sod1 integrates oxygen availability to redox regulate NADPH production and the thiol redoxome. Proc. Natl. Acad. Sci. USA 2022, 119, e2023328119. [Google Scholar] [CrossRef] [PubMed]
- Ambrosio, G.; Flaherty, J.T. Effects of the superoxide radical scavenger superoxide dismutase, and of the hydroxyl radical scavenger mannitol, on reperfusion injury in isolated rabbit hearts. Cardiovasc. Drugs Ther. 1992, 6, 623–632. [Google Scholar] [CrossRef]
- Zeng, L.; Xia, T.; Hu, W.; Chen, S.; Chi, S.; Lei, Y.; Liu, Z. Visualizing the regulation of hydroxyl radical level by superoxide dismutase via a specific molecular probe. Anal. Chem. 2018, 90, 1317–1324. [Google Scholar] [CrossRef]
- Subburayan, K.; Thayyullathil, F.; Pallichankandy, S.; Cheratta, A.R.; Galadari, S. Superoxide-mediated ferroptosis in human cancer cells induced by sodium selenite. Transl. Oncol. 2020, 13, 100843. [Google Scholar] [CrossRef]
- Nogueira, V.; Park, Y.; Chen, C.-C.; Xu, P.-Z.; Chen, M.-L.; Tonic, I.; Unterman, T.; Hay, N. Akt determines replicative senescence and oxidative or oncogenic premature senescence and sensitizes cells to oxidative apoptosis. Cancer Cell 2008, 14, 458–470. [Google Scholar] [CrossRef] [Green Version]
- Zhang, Z.; Dalan, R.; Hu, Z.; Wang, J.W.; Chew, N.W.; Poh, K.K.; Tan, R.S.; Soong, T.W.; Dai, Y.; Ye, L. Reactive Oxygen Species Scavenging Nanomedicine for The Treatment of Ischemic Heart Disease. Adv. Mater. 2022, 34, 2202169. [Google Scholar] [CrossRef] [PubMed]


Disclaimer/Publisher’s Note: The statements, opinions and data contained in all publications are solely those of the individual author(s) and contributor(s) and not of MDPI and/or the editor(s). MDPI and/or the editor(s) disclaim responsibility for any injury to people or property resulting from any ideas, methods, instructions or products referred to in the content. |
© 2023 by the authors. Licensee MDPI, Basel, Switzerland. This article is an open access article distributed under the terms and conditions of the Creative Commons Attribution (CC BY) license (https://creativecommons.org/licenses/by/4.0/).
Share and Cite
Savic, D.; Steinbichler, T.B.; Ingruber, J.; Negro, G.; Aschenbrenner, B.; Riechelmann, H.; Ganswindt, U.; Skvortsov, S.; Dudás, J.; Skvortsova, I.-I. Erk1/2-Dependent HNSCC Cell Susceptibility to Erastin-Induced Ferroptosis. Cells 2023, 12, 336. https://doi.org/10.3390/cells12020336
Savic D, Steinbichler TB, Ingruber J, Negro G, Aschenbrenner B, Riechelmann H, Ganswindt U, Skvortsov S, Dudás J, Skvortsova I-I. Erk1/2-Dependent HNSCC Cell Susceptibility to Erastin-Induced Ferroptosis. Cells. 2023; 12(2):336. https://doi.org/10.3390/cells12020336
Chicago/Turabian StyleSavic, Dragana, Teresa Bernadette Steinbichler, Julia Ingruber, Giulia Negro, Bertram Aschenbrenner, Herbert Riechelmann, Ute Ganswindt, Sergej Skvortsov, József Dudás, and Ira-Ida Skvortsova. 2023. "Erk1/2-Dependent HNSCC Cell Susceptibility to Erastin-Induced Ferroptosis" Cells 12, no. 2: 336. https://doi.org/10.3390/cells12020336