
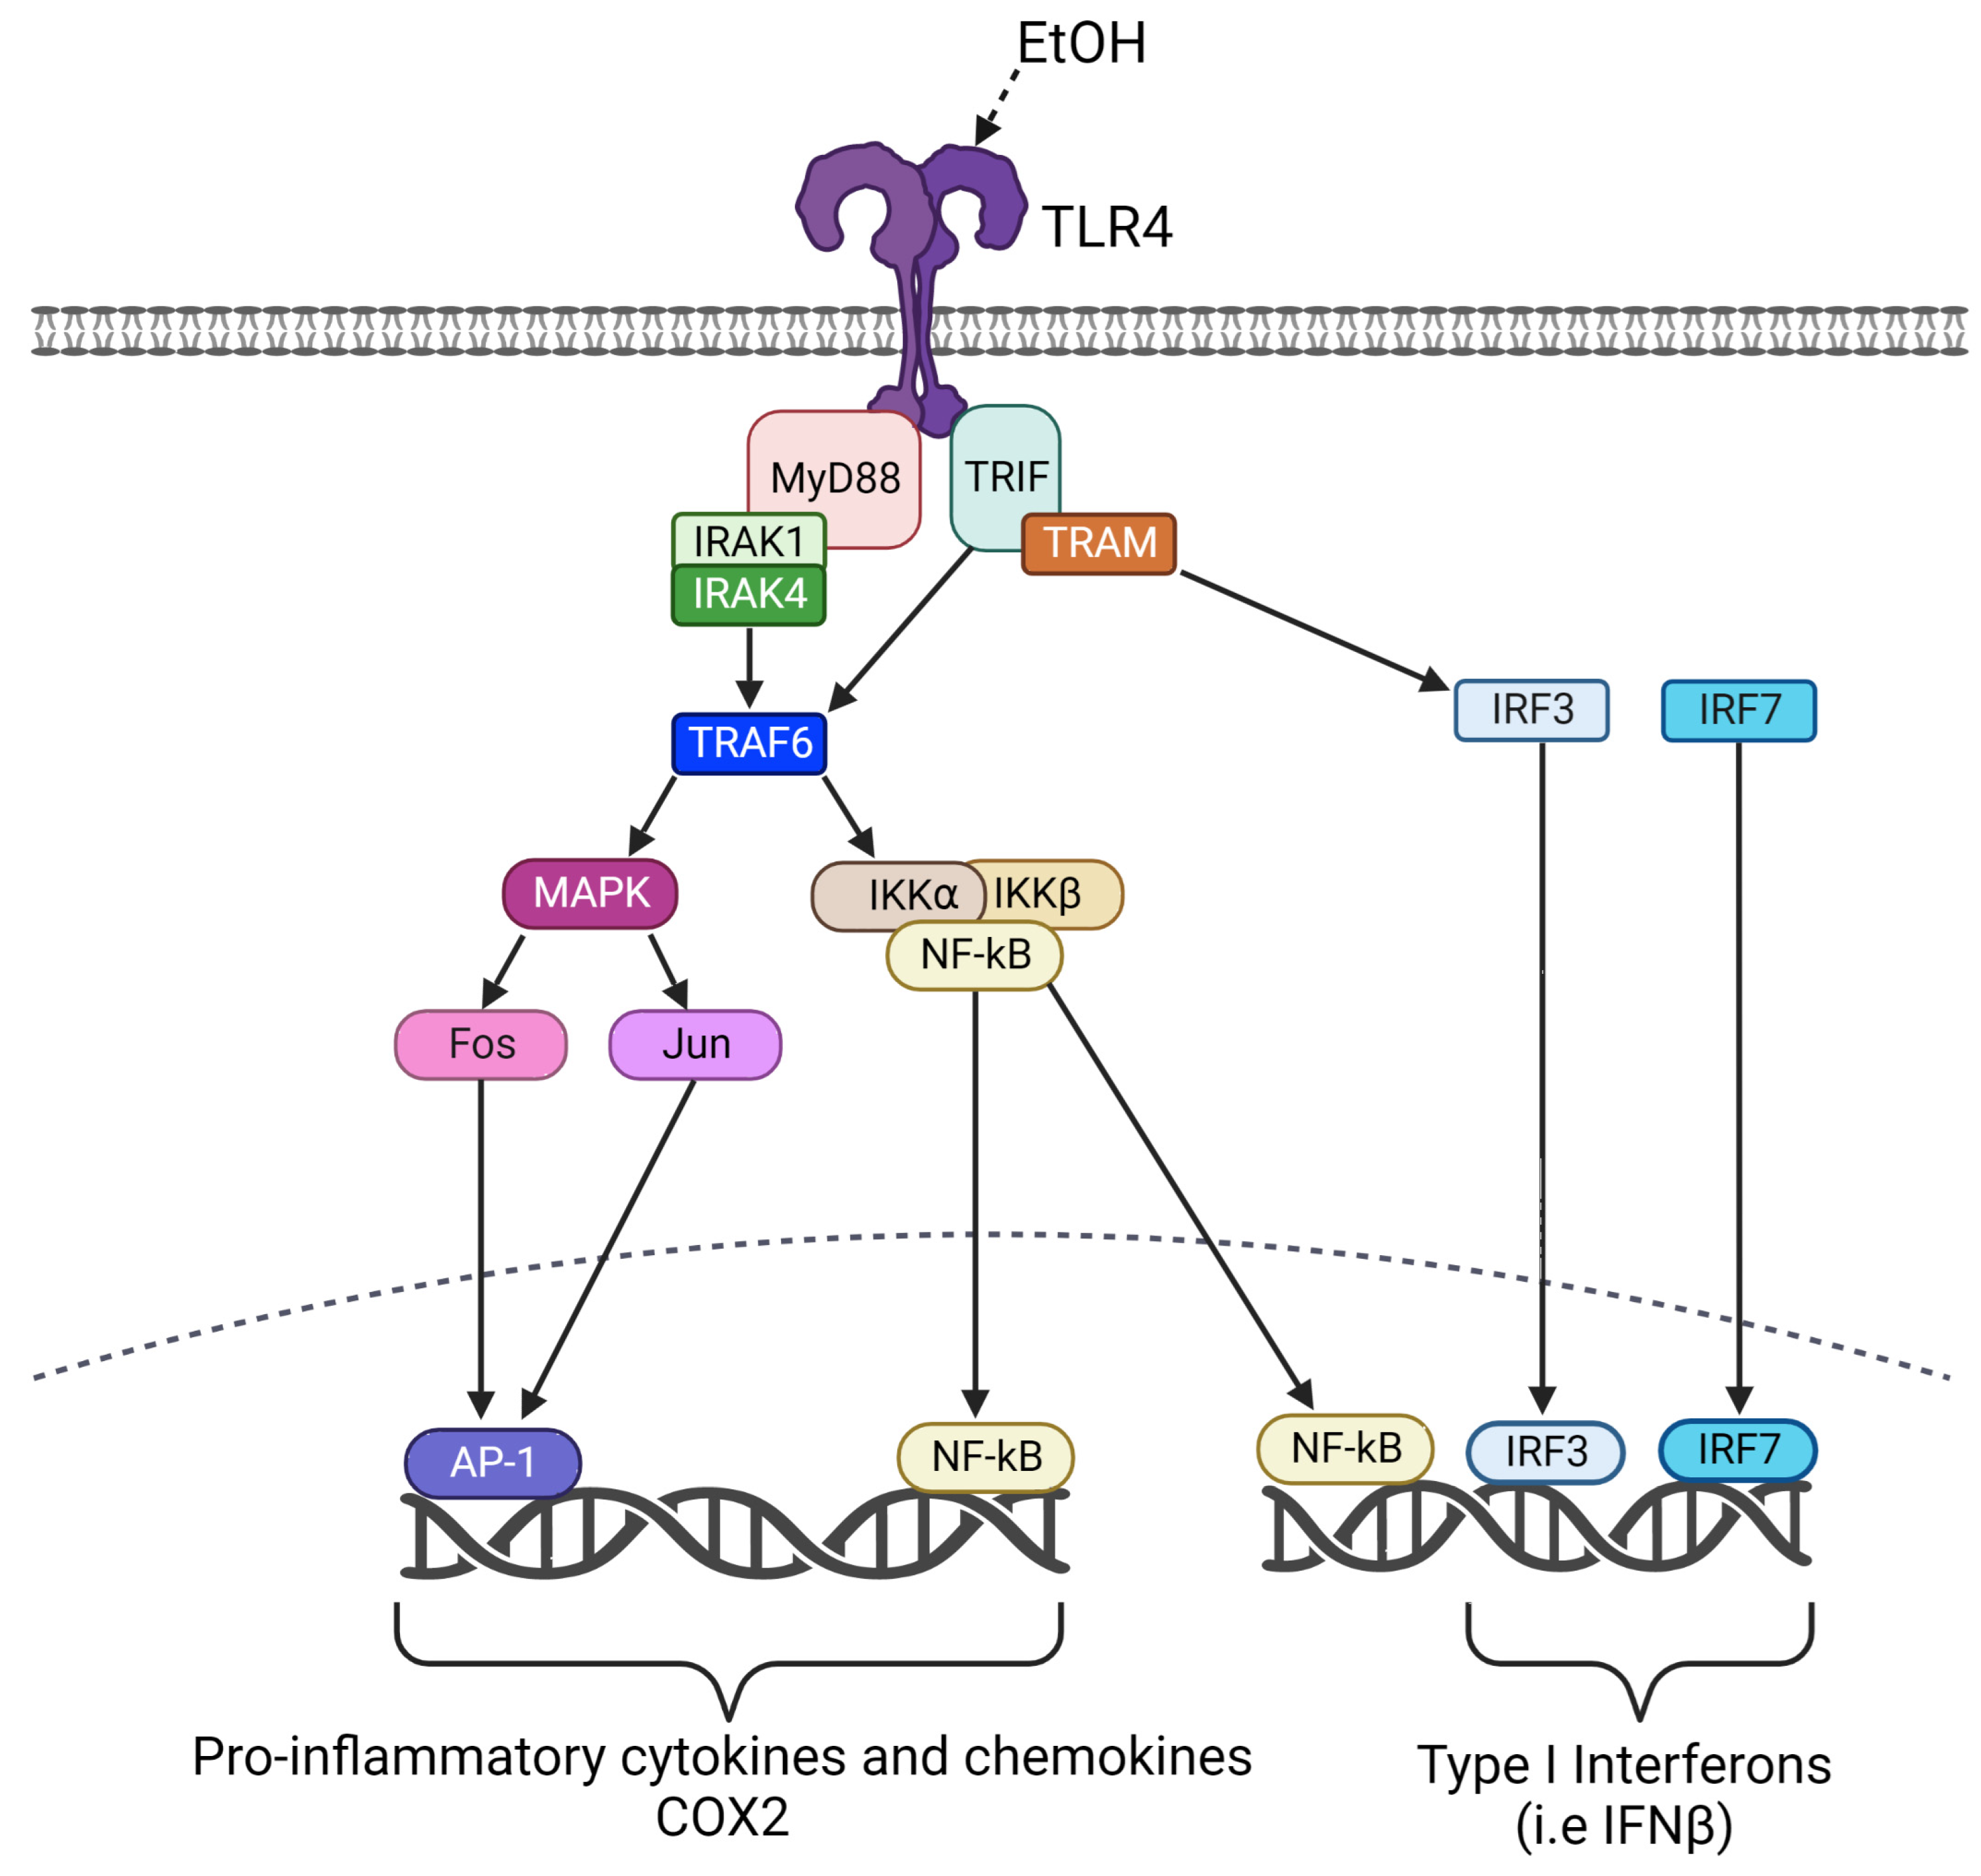
Ethanol Induces Neuroinflammation in a Chronic Plus Binge Mouse Model of Alcohol Use Disorder via TLR4 and MyD88-Dependent Signaling

Abstract
:1. Introduction
2. Materials and Methods
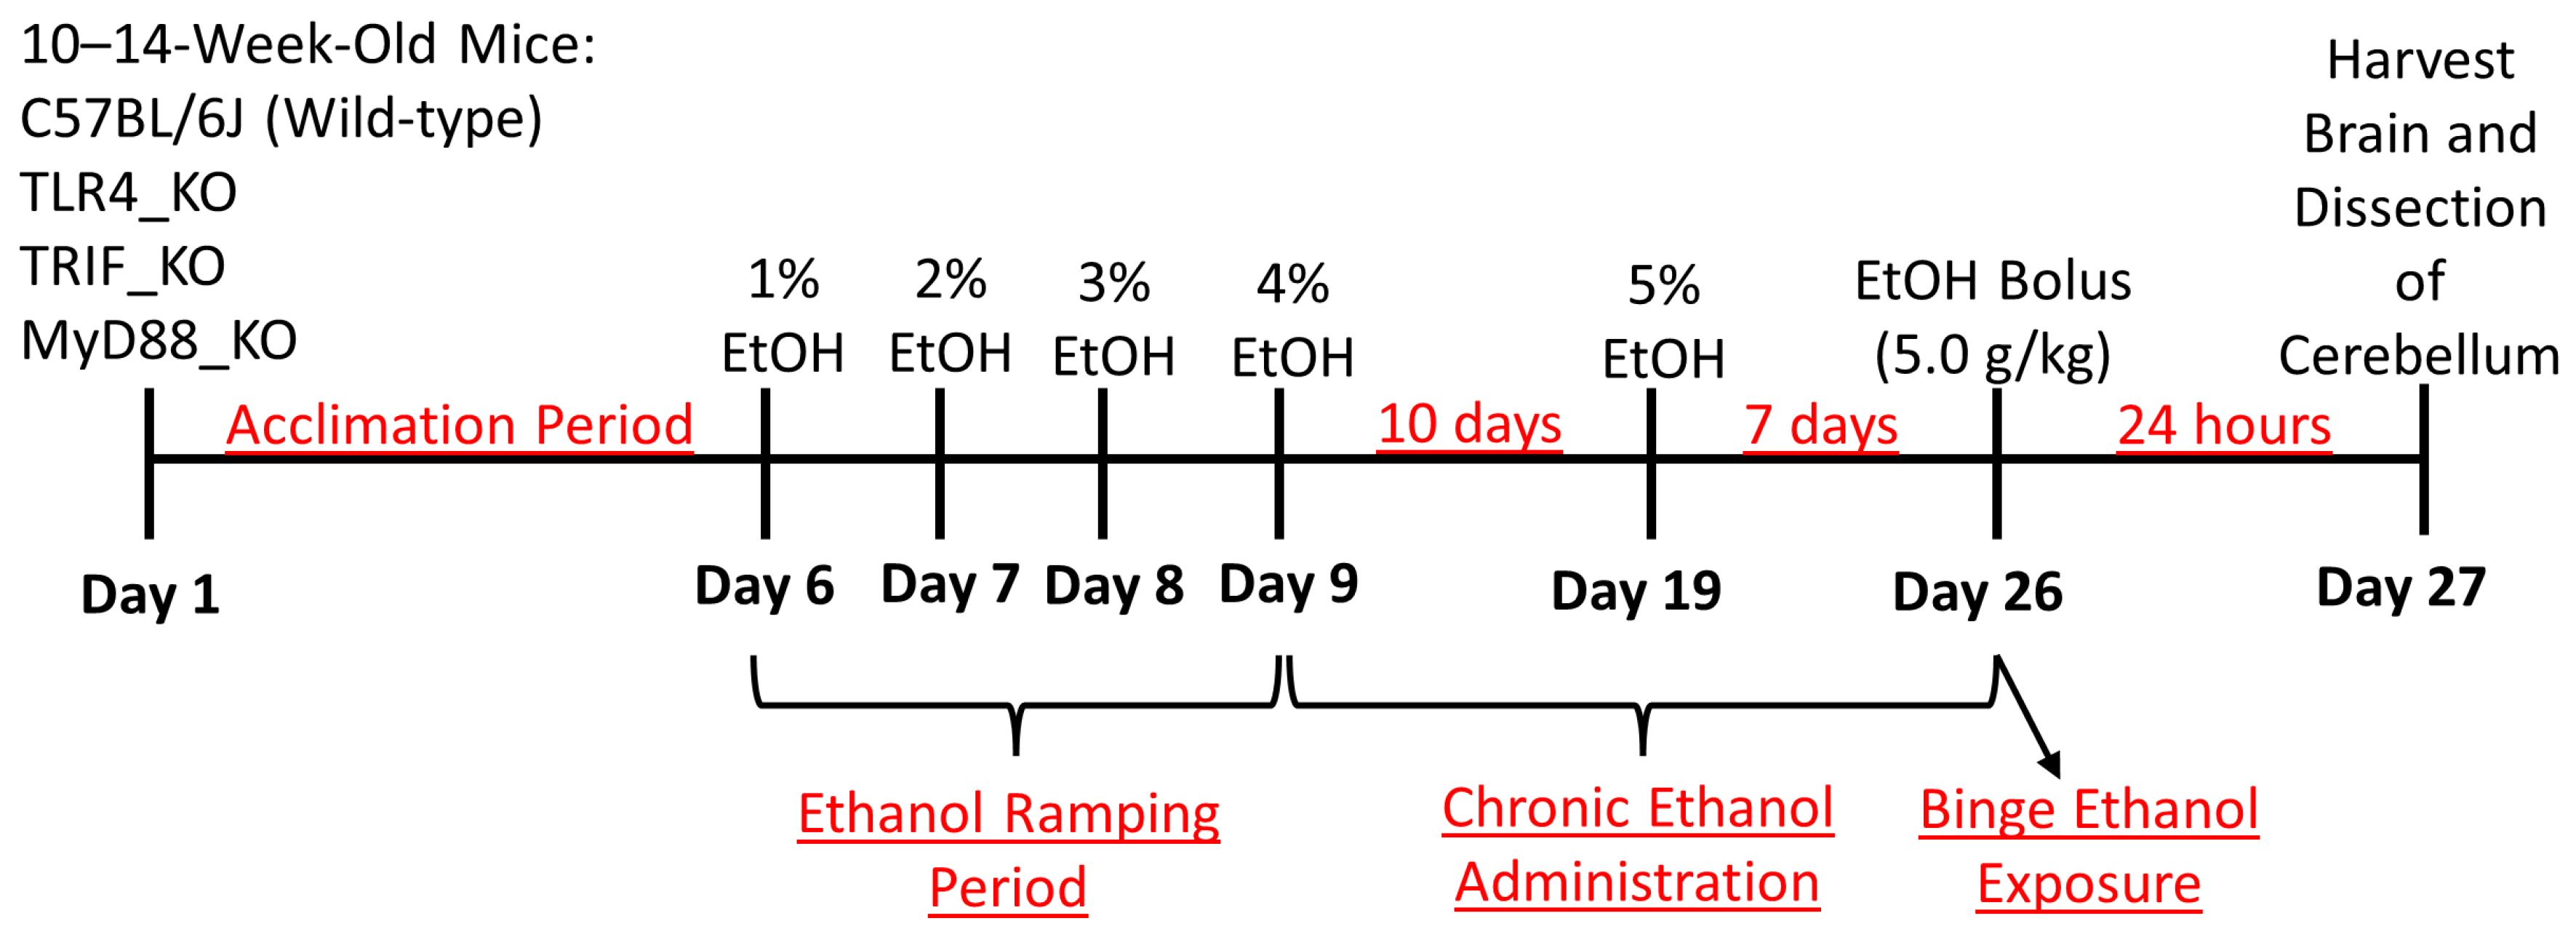
2.1. Animals
2.2. Isolation of RNA and cDNA Synthesis
2.3. Real-Time Quantitative PCR Analysis
2.4. Statistical Analysis
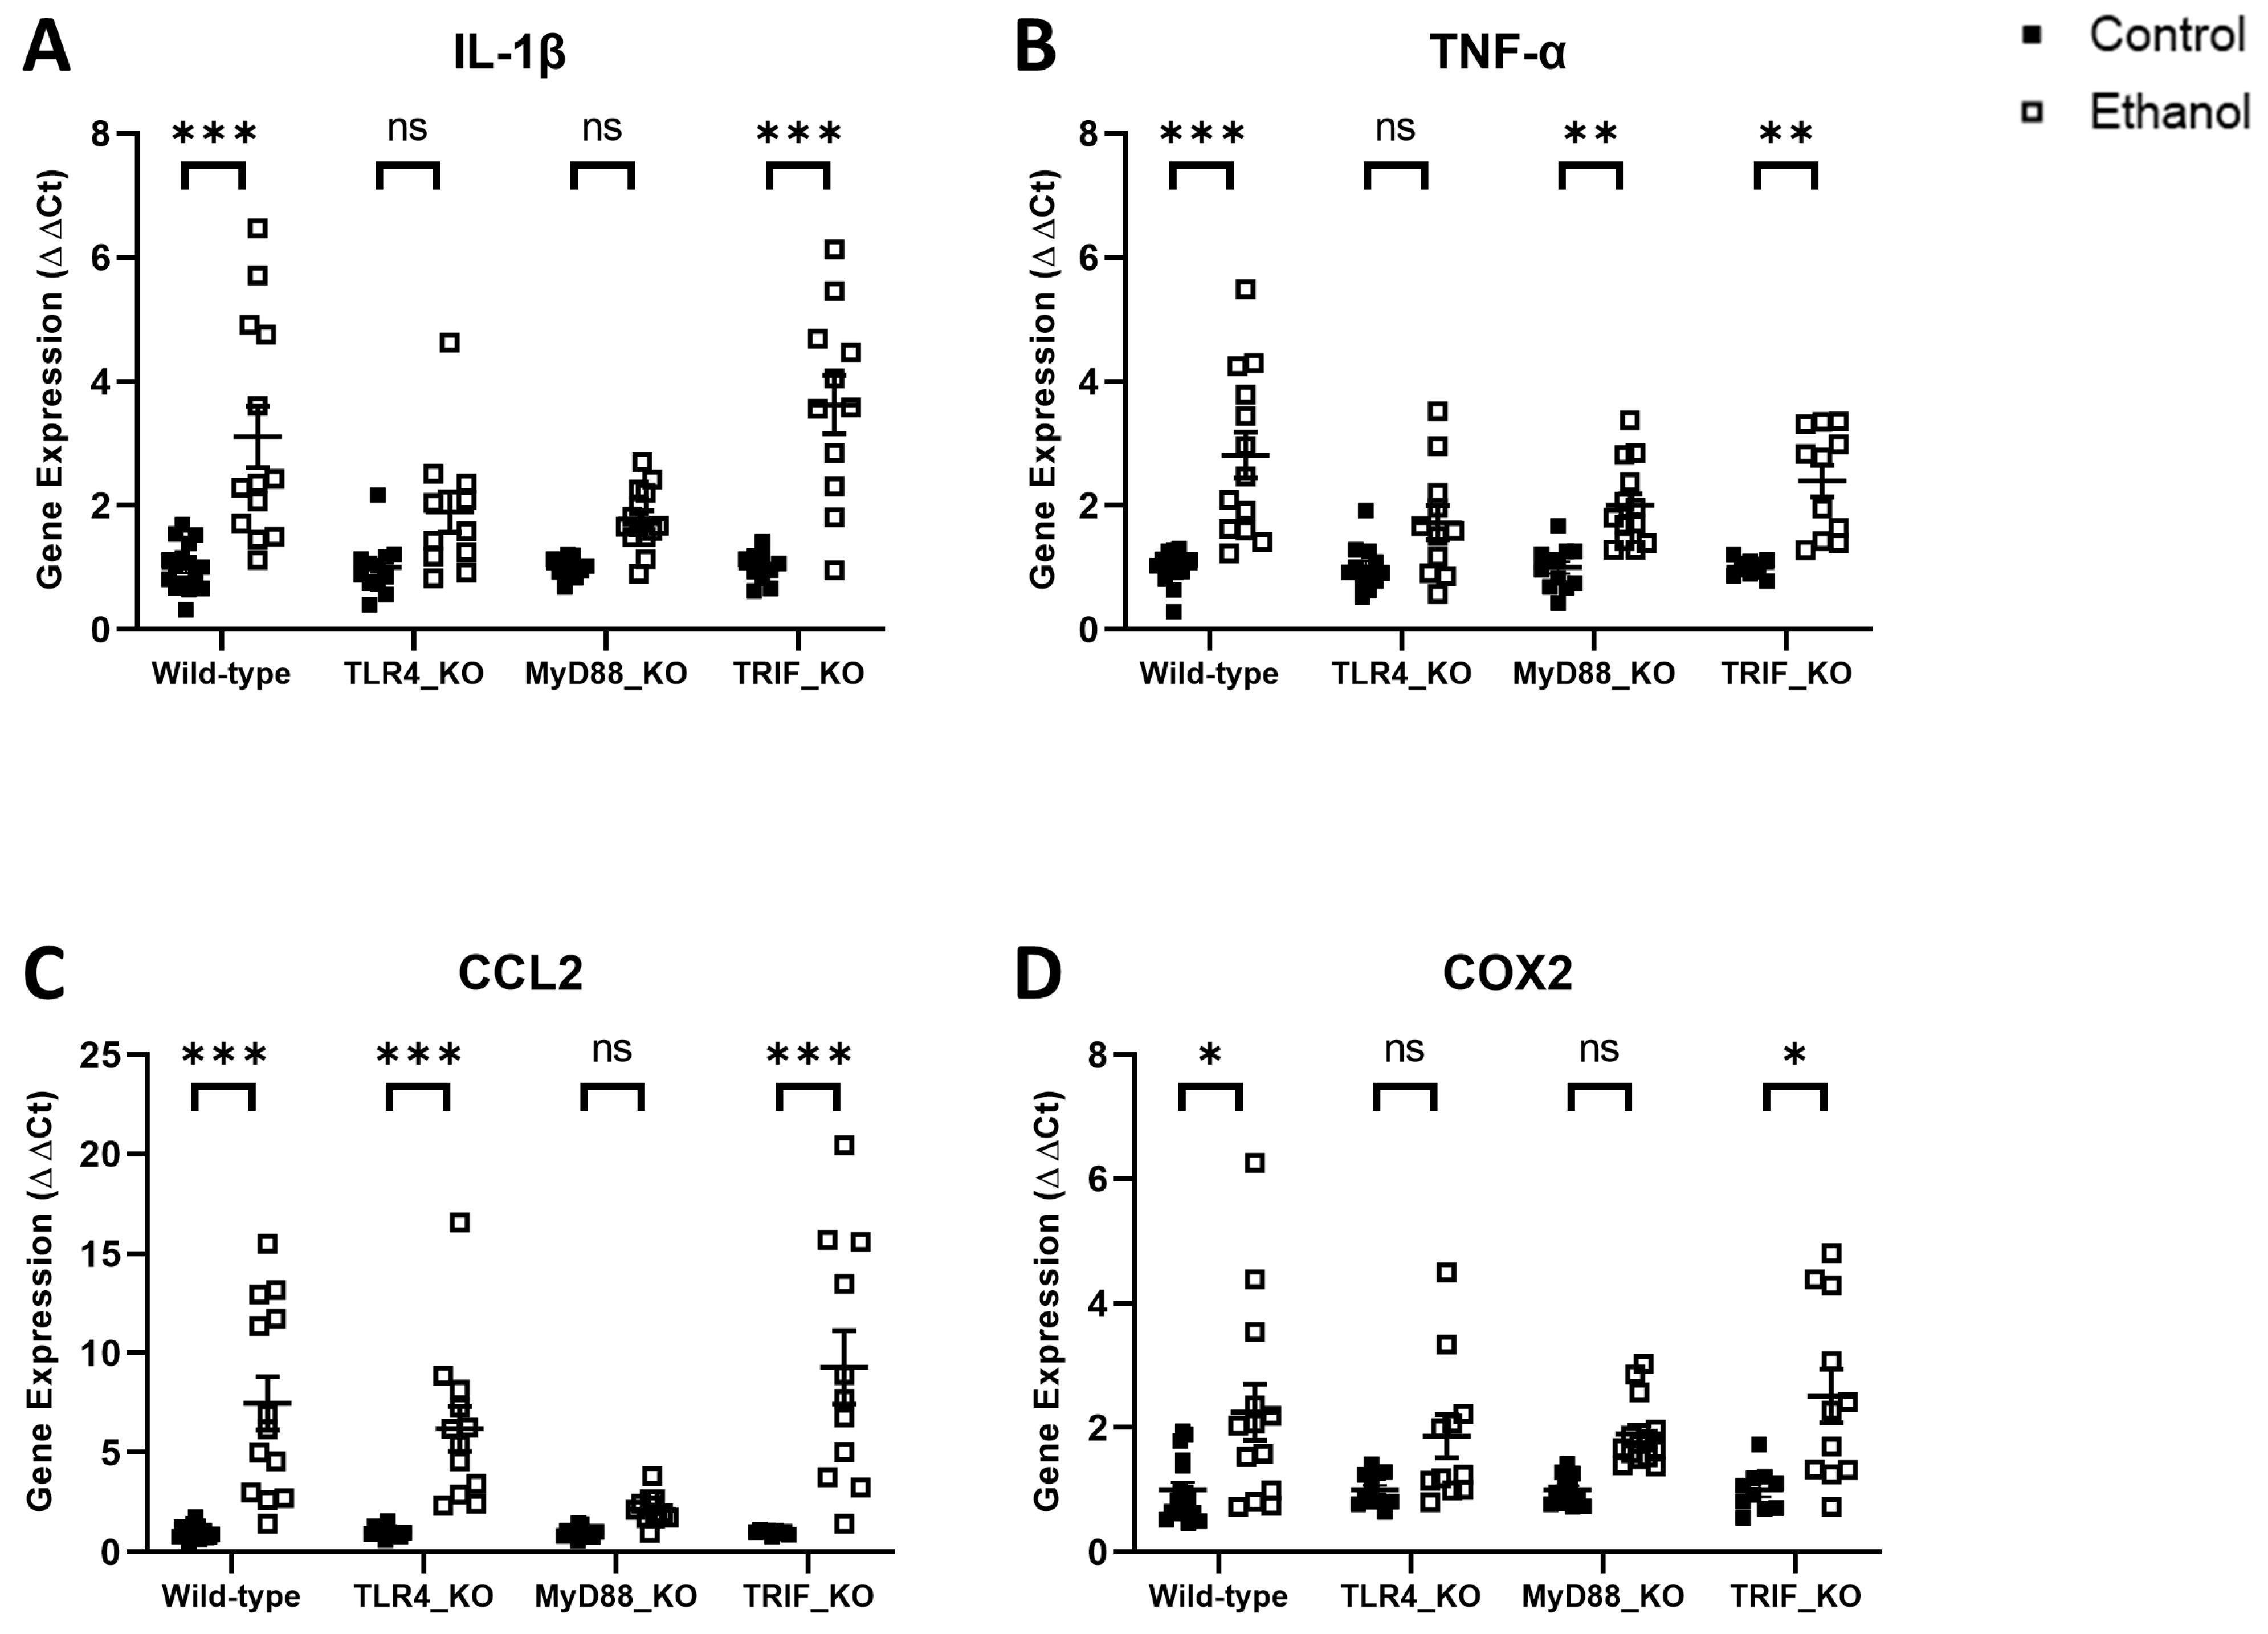
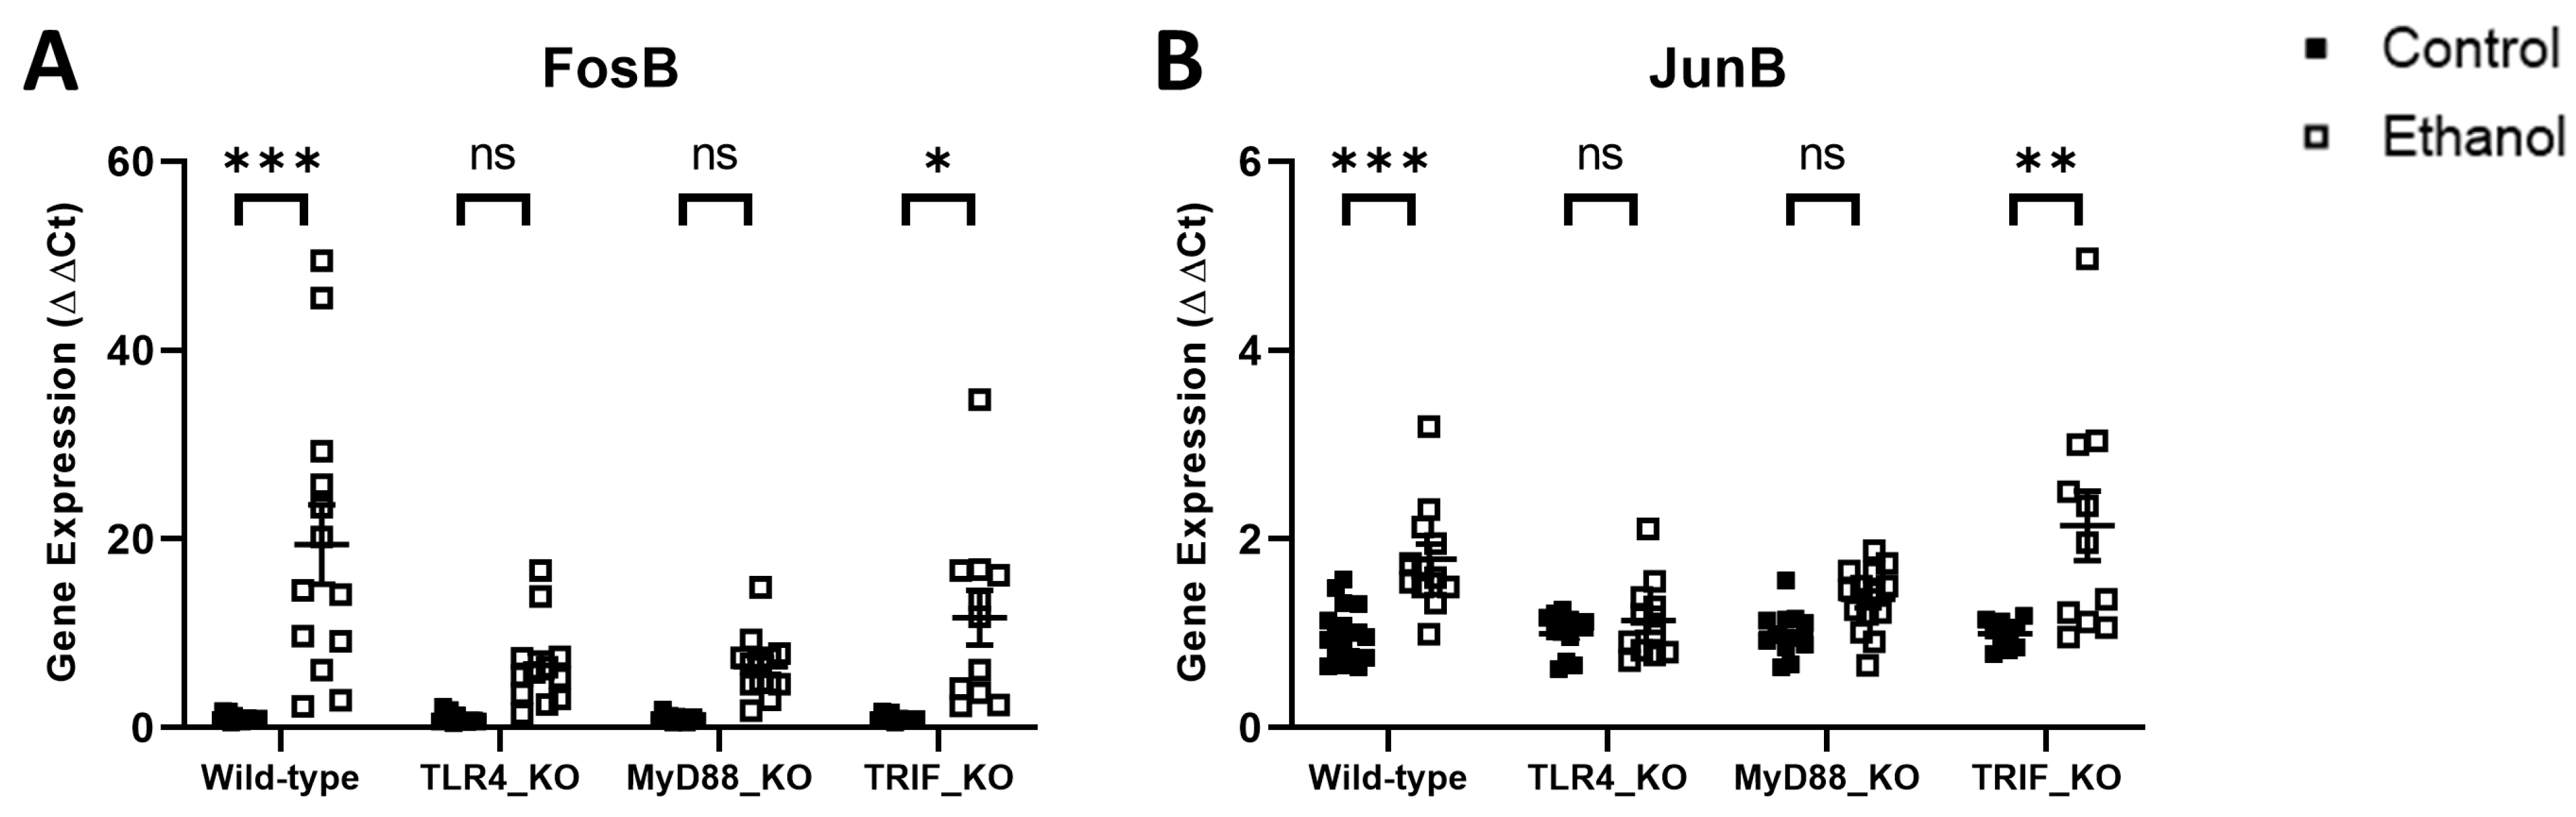
3. Results
4. Discussion
Author Contributions
Funding
Institutional Review Board Statement
Informed Consent Statement
Data Availability Statement
Conflicts of Interest
References
- Sacks, J.J.; Gonzales, K.R.; Bouchery, E.E.; Tomedi, L.E.; Brewer, R.D. 2010 National and State Costs of Excessive Alcohol Consumption. Am. J. Prev. Med. 2015, 49, e73–e79. [Google Scholar] [CrossRef] [PubMed]
- Substance Abuse and Mental Health Services Administration (SAMHSA) CfBHSaQ. National Survey on Drug Use and Health. Table 5.4A/B—Alcohol Use Disorder in Past Year among Persons Aged 12 or Older, by Age Group and Demographic Characteristics: Numbers in Thousands, 2018 and 2019. 2019. Available online: https://www.samhsa.gov/ (accessed on 17 May 2023).
- Alfonso-Loeches, S.; Guerri, C. Molecular and behavioral aspects of the actions of alcohol on the adult and developing brain. Crit. Rev. Clin. Lab. Sci. 2011, 48, 19–47. [Google Scholar] [CrossRef] [PubMed]
- Pascual, M.; Baliño, P.; Alfonso-Loeches, S.; Aragón, C.M.; Guerri, C. Impact of TLR4 on behavioral and cognitive dysfunctions associated with alcohol-induced neuroinflammatory damage. Brain Behav. Immun. 2011, 25 (Suppl. 1), S80–S91. [Google Scholar] [CrossRef] [PubMed]
- Alfonso-Loeches, S.; Pascual-Lucas, M.; Blanco, A.M.; Sanchez-Vera, I.; Guerri, C. Pivotal role of TLR4 receptors in alcohol-induced neuroinflammation and brain damage. J. Neurosci. 2010, 30, 8285–8295. [Google Scholar] [CrossRef] [PubMed]
- Niedzwiedz-Massey, V.M.; Douglas, J.C.; Rafferty, T.; Johnson, J.W.; Holloway, K.N.; Berquist, M.D.; Kane, C.J.; Drew, P.D. Effects of chronic and binge ethanol administration on mouse cerebellar and hippocampal neuroinflammation. Am. J. Drug Alcohol. Abuse. 2022, 49, 345–358. [Google Scholar] [CrossRef] [PubMed]
- Niedzwiedz-Massey, V.M.; Douglas, J.C.; Rafferty, T.; Johnson, J.W.; Holloway, K.N.; Berquist, M.D.; Kane, C.J.; Drew, P.D. Cerebellar Transcriptomic Analysis in a Chronic plus Binge Mouse Model of Alcohol Use Disorder Demonstrates Ethanol-Induced Neuroinflammation and Altered Glial Gene Expression. Cells 2023, 12, 745. [Google Scholar]
- Doremus-Fitzwater, T.L.; Gano, A.; Paniccia, J.E.; Deak, T. Male adolescent rats display blunted cytokine responses in the CNS after acute ethanol or lipopolysaccharide exposure. Physiol. Behav. 2015, 148, 131–144. [Google Scholar] [CrossRef] [PubMed]
- Qin, L.; He, J.; Hanes, R.N.; Pluzarev, O.; Hong, J.S.; Crews, F.T. Increased systemic and brain cytokine production and neuroinflammation by endotoxin following ethanol treatment. J. Neuroinflamm. 2008, 5, 10. [Google Scholar] [CrossRef]
- Kane, C.J.M.; Phelan, K.D.; Douglas, J.C.; Wagoner, G.; Johnson, J.W.; Xu, J.; Phelan, P.S.; Drew, P.D. Effects of ethanol on immune response in the brain: Region-specific changes in adolescent versus adult mice. Alcohol. Clin. Exp. Res. 2014, 38, 384–391. [Google Scholar] [CrossRef]
- Marshall, S.A.; McClain, J.A.; Kelso, M.L.; Hopkins, D.M.; Pauly, J.R.; Nixon, K. Microglial activation is not equivalent to neuroinflammation in alcohol-induced neurodegeneration: The importance of microglia phenotype. Neurobiol. Dis. 2013, 54, 239–251. [Google Scholar] [CrossRef]
- Deak, T.; Kelliher, K.T.; Wojcik, H.J.; Gano, A. Prenatal and adolescent alcohol exposure programs immunity across the lifespan: CNS-mediated regulation. Pharmacol. Biochem. Behav. 2022, 216, 173390. [Google Scholar] [CrossRef] [PubMed]
- Crews, F.T.; Qin, L.; Sheedy, D.; Vetreno, R.P.; Zou, J. High mobility group box 1/Toll-like receptor danger signaling increases brain neuroimmune activation in alcohol dependence. Biol. Psychiatry 2013, 73, 602–612. [Google Scholar] [CrossRef] [PubMed]
- Chen, W.W.; Zhang, X.; Huang, W.J. Role of neuroinflammation in neurodegenerative diseases (Review). Mol. Med. Rep. 2016, 13, 3391–3396. [Google Scholar] [CrossRef] [PubMed]
- Lacagnina, M.J.; Rivera, P.D.; Bilbo, S.D. Glial and Neuroimmune Mechanisms as Critical Modulators of Drug Use and Abuse. Neuropsychopharmacology 2017, 42, 156–177. [Google Scholar] [CrossRef] [PubMed]
- Mayfield, J.; Ferguson, L.; Harris, R.A. Neuroimmune signaling: A key component of alcohol abuse. Curr. Opin. Neurobiol. 2013, 23, 513–520. [Google Scholar] [CrossRef] [PubMed]
- Crews, F.T.; Walter, T.J.; Coleman, L.G., Jr.; Vetreno, R.P. Toll-like receptor signaling and stages of addiction. Psychopharmacology 2017, 234, 1483–1498. [Google Scholar] [CrossRef] [PubMed]
- Dabi, Y.T.; Ajagbe, A.O.; Degechisa, S.T. Toll-like receptors in pathogenesis of neurodegenerative diseases and their therapeutic potential. Immun. Inflamm. Dis. 2023, 11, e839. [Google Scholar] [CrossRef]
- Piccinini, A.; Midwood, K. DAMPening inflammation by modulating TLR signalling. Mediat. Inflamm. 2010, 2010, 672395. [Google Scholar] [CrossRef]
- Mogensen, T.H. Pathogen recognition and inflammatory signaling in innate immune defenses. Clin. Microbiol. Rev. 2009, 22, 240–273. [Google Scholar] [CrossRef]
- Vetreno, R.P.; Qin, L.; Crews, F.T. Increased receptor for advanced glycation end product expression in the human alcoholic prefrontal cortex is linked to adolescent drinking. Neurobiol. Dis. 2013, 59, 52–62. [Google Scholar] [CrossRef]
- Fernandez-Lizarbe, S.; Pascual, M.; Guerri, C. Critical role of TLR4 response in the activation of microglia induced by ethanol. J. Immunol. 2009, 183, 4733–4744. [Google Scholar] [CrossRef] [PubMed]
- McCarthy, G.M.; Warden, A.S.; Bridges, C.R.; Blednov, Y.A.; Harris, R.A. Chronic ethanol consumption: Role of TLR3/TRIF-dependent signaling. Addict. Biol. 2018, 23, 889–903. [Google Scholar] [CrossRef] [PubMed]
- Warden, A.S.; Azzam, M.; DaCosta, A.; Mason, S.; Blednov, Y.A.; Messing, R.O.; Mayfield, R.D.; Harris, R.A. Toll-like receptor 3 activation increases voluntary alcohol intake in C57BL/6J male mice. Brain Behav. Immun. 2019, 77, 55–65. [Google Scholar] [CrossRef] [PubMed]
- Vetreno, R.P.; Qin, L.; Coleman, L.G., Jr.; Crews, F.T. Increased Toll-like Receptor-MyD88-NFkappaB-Proinflammatory neuroimmune signaling in the orbitofrontal cortex of humans with alcohol use disorder. Alcohol. Clin. Exp. Res. 2021, 45, 1747–1761. [Google Scholar] [CrossRef] [PubMed]
- Blednov, Y.A.; Da Costa, A.; Mayfield, J.; Harris, R.A.; Messing, R.O. Deletion of Tlr3 reduces acute tolerance to alcohol and alcohol consumption in the intermittent access procedure in male mice. Addict. Biol. 2021, 26, e12932. [Google Scholar] [CrossRef] [PubMed]
- Lovelock, D.F.; Randall, P.A.; Van Voorhies, K.; Vetreno, R.P.; Crews, F.T.; Besheer, J. Increased alcohol self-administration following repeated Toll-like receptor 3 agonist treatment in male and female rats. Pharmacol. Biochem. Behav. 2022, 216, 173379. [Google Scholar] [CrossRef] [PubMed]
- Kawai, T.; Akira, S. The role of pattern-recognition receptors in innate immunity: Update on Toll-like receptors. Nat. Immunol. 2010, 11, 373–384. [Google Scholar] [CrossRef]
- Pascual, M.; Calvo-Rodriguez, M.; Núñez, L.; Villalobos, C.; Ureña, J.; Guerri, C. Toll-like receptors in neuroinflammation, neurodegeneration, and alcohol-induced brain damage. IUBMB Life 2021, 73, 900–915. [Google Scholar] [CrossRef]
- Poltorak, A.; He, X.; Smirnova, I.; Liu, M.-Y.; Van Huffel, C.; Du, X.; Birdwell, D.; Alejos, E.; Silva, M.; Galanos, C.; et al. Defective LPS signaling in C3H/HeJ and C57BL/10ScCr mice: Mutations in Tlr4 gene. Science 1998, 282, 2085–2088. [Google Scholar] [CrossRef]
- Vogel, S.N.; Hansen, C.T.; Rosenstreich, D.L. Characterization of a congenitally LPS-resistant, athymic mouse strain. J. Immunol. 1979, 122, 619–622. [Google Scholar] [CrossRef]
- Hou, B.; Reizis, B.; DeFranco, A.L. Toll-like receptors activate innate and adaptive immunity by using dendritic cell-intrinsic and -extrinsic mechanisms. Immunity 2008, 29, 272–282. [Google Scholar] [CrossRef] [PubMed]
- Hoebe, K.; Du, X.; Georgel, P.; Janssen, E.; Tabeta, K.; Kim, S.O.; Goode, J.; Lin, P.; Mann, N.; Mudd, S.; et al. Identification of Lps2 as a key transducer of MyD88-independent TIR signalling. Nature 2003, 424, 743–748. [Google Scholar] [CrossRef] [PubMed]
- Alfonso-Loeches, S.; Pascual, M.; Gómez-Pinedo, U.; Pascual-Lucas, M.; Renau-Piqueras, J.; Guerri, C. Toll-like receptor 4 participates in the myelin disruptions associated with chronic alcohol abuse. Glia 2012, 60, 948–964. [Google Scholar] [CrossRef] [PubMed]
- Heberlein, A.; Käser, M.; Lichtinghagen, R.; Rhein, M.; Lenz, B.; Kornhuber, J.; Bleich, S.; Hillemacher, T. TNF-α and IL-6 serum levels: Neurobiological markers of alcohol consumption in alcohol-dependent patients? Alcohol 2014, 48, 671–676. [Google Scholar] [CrossRef] [PubMed]
- Crews, F.T.; Lawrimore, C.J.; Walter, T.J.; Coleman, L.G., Jr. The role of neuroimmune signaling in alcoholism. Neuropharmacology 2017, 122, 56–73. [Google Scholar] [CrossRef] [PubMed]
- Leclercq, S.; De Saeger, C.; Delzenne, N.; de Timary, P.; Stärkel, P. Role of inflammatory pathways, blood mononuclear cells, and gut-derived bacterial products in alcohol dependence. Biol. Psychiatry 2014, 76, 725–733. [Google Scholar] [CrossRef] [PubMed]
- He, J.; Crews, F.T. Increased MCP-1 and microglia in various regions of the human alcoholic brain. Exp. Neurol. 2008, 210, 349–358. [Google Scholar] [CrossRef] [PubMed]
- Vetreno, R.P.; Crews, F.T. Adolescent binge drinking increases expression of the danger signal receptor agonist HMGB1 and Toll-like receptors in the adult prefrontal cortex. Neuroscience 2012, 226, 475–488. [Google Scholar] [CrossRef]
- Crews, F.T.; Vetreno, R.P. Mechanisms of neuroimmune gene induction in alcoholism. Psychopharmacology 2016, 233, 1543–1557. [Google Scholar] [CrossRef]
- Blanco, A.M.; Perez-Arago, A.; Fernandez-Lizarbe, S.; Guerri, C. Ethanol mimics ligand-mediated activation and endocytosis of IL-1RI/TLR4 receptors via lipid rafts caveolae in astroglial cells. J. Neurochem. 2008, 106, 625–639. [Google Scholar] [CrossRef]
- Montesinos, J.; Pascual, M.; Pla, A.; Maldonado, C.; Rodríguez-Arias, M.; Miñarro, J.; Guerri, C. TLR4 elimination prevents synaptic and myelin alterations and long-term cognitive dysfunctions in adolescent mice with intermittent ethanol treatment. Brain Behav. Immun. 2015, 45, 233–244. [Google Scholar] [CrossRef]
- Pascual, M.; Baliño, P.; Aragón, C.M.; Guerri, C. Cytokines and chemokines as biomarkers of ethanol-induced neuroinflammation and anxiety-related behavior: Role of TLR4 and TLR2. Neuropharmacology 2015, 89, 352–359. [Google Scholar] [CrossRef] [PubMed]
- Randall, C.A.; Sun, D.; Randall, P.A. Differential Effects of Nicotine, Alcohol, and Coexposure on Neuroimmune-Related Protein and Gene Expression in Corticolimbic Brain Regions of Rats. ACS Chem. Neurosci. 2023, 14, 628–644. [Google Scholar] [CrossRef] [PubMed]
- Zhen, F.; Yu, L.; Wang, L.; Wang, S.; Lu, W.; Wang, X.; An, C. Salvianolic Acids Alleviate Chronic Mild Stress-Induced Depressive-Like Behaviors in Rats. J. Integr. Neurosci. 2023, 22, 60. [Google Scholar] [CrossRef]
- Teng, T.; Yang, H.; Xu, T.; Sun, G.; Song, X.; Bai, G.; Shi, B. Activation of Inflammatory Networks in the Lungs Caused by Chronic Cold Stress Is Moderately Attenuated by Glucose Supplementation. Int. J. Mol. Sci. 2022, 23, 10697. [Google Scholar] [CrossRef]
- Vijay, K. Toll-like receptors in immunity and inflammatory diseases: Past, present, and future. Int. Immunopharmacol. 2018, 59, 391–412. [Google Scholar] [CrossRef] [PubMed]
- Lv, R.; Du, L.; Liu, X.; Zhou, F.; Zhang, Z.; Zhang, L. Rosmarinic acid attenuates inflammatory responses through inhibiting HMGB1/TLR4/NF-κB signaling pathway in a mouse model of Parkinson's disease. Life Sci. 2019, 223, 158–165. [Google Scholar] [CrossRef] [PubMed]
- Nalamolu, K.R.; Challa, S.R.; Fornal, C.A.; Grudzien, N.A.; Jorgenson, L.C.; Choudry, M.M.; Smith, N.J.; Palmer, C.J.; Pinson, D.M.; Klopfenstein, J.D.; et al. Attenuation of the Induction of TLRs 2 and 4 Mitigates Inflammation and Promotes Neurological Recovery After Focal Cerebral Ischemia. Transl. Stroke Res. 2021, 12, 923–936. [Google Scholar] [CrossRef]
- Li, W.; Dong, M.; Chu, L.; Feng, L.; Sun, X. MicroRNA-451 relieves inflammation in cerebral ischemia-reperfusion via the Toll-like receptor 4/MyD88/NF-κB signaling pathway. Mol. Med. Rep. 2019, 20, 3043–3054. [Google Scholar] [CrossRef]
- Lin, C.; Wang, H.; Zhang, M.; Mustafa, S.; Wang, Y.; Li, H.; Yin, H.; Hutchinson, M.R.; Wang, X. TLR4 biased small molecule modulators. Pharmacol. Ther. 2021, 228, 107918. [Google Scholar] [CrossRef]
- Olson, M.A.; Lee, M.S.; Kissner, T.L.; Alam, S.; Waugh, D.S.; Saikh, K.U. Discovery of small molecule inhibitors of MyD88-dependent signaling pathways using a computational screen. Sci. Rep. 2015, 5, 14246. [Google Scholar] [CrossRef]
- Bryant, C.E.; Symmons, M.; Gay, N.J. Toll-like receptor signalling through macromolecular protein complexes. Mol. Immunol. 2015, 63, 162–165. [Google Scholar] [CrossRef]


| Generic Name | Strain | Common Name | JAX Lab Strain | RRID |
|---|---|---|---|---|
| Wild-type | C57BL/6J | B6 | 000664 | IMSR_JAX:000664 |
| TLR4_KO | B6.B10ScN-Tlr4lps-del/JthJ | Tlr4Lps-del | 007227 | IMSR_JAX:007227 |
| MyD88_KO | B6.129P2(SJL)-Myd88tm1.1Defr/J | Myd88 null | 009088 | IMSR_JAX:009088 |
| TRIF_KO | C57BL/6J-Ticam1Lps2/J | TrifLps2 | 005037 | IMSR_JAX:005037 |
| Gene Name | Assay ID |
|---|---|
| IL-1β | Mm00434228_m1 |
| TNF-α | Mm00443258_m1 |
| CCL2 | Mm00441242_m1 |
| Ptgs2 (COX2) | Mm00478374_m1 |
| Fosb | Mm00500403_m1 |
| Junb | Mm04243546_s1 |
| IRF3 | Mm00516784_m1 |
| IRF7 | Mm00516793_g1 |
| IFN-β1 | Mm00439552_s1 |
| IL-1β | Wild-Type vs. TLR4_KO | Wild-Type vs. MyD88_KO | Wild-Type vs. TRIF_KO | ||||||
| Two-Way ANOVA | F (DFn, DFd) | p Value | Sig. | F (DFn, DFd) | p Value | Sig. | F (DFn, DFd) | p Value | Sig. |
| Interaction | F (1, 49) = 4.296 | 0.04 | * | F (1, 52) = 7.100 | 0.01 | * | F (1, 47) = 0.5886 | 0.45 | ns |
| Genotype | F (1, 49) = 4.296 | 0.04 | * | F (1, 52) = 7.136 | 0.01 | * | F (1, 47) = 0.5840 | 0.45 | ns |
| Treatment | F (1, 49) = 26.26 | <0.001 | *** | F (1, 52) = 34.08 | <0.001 | *** | F (1, 47) = 49.17 | <0.001 | *** |
| TNF-α | Wild-type vs. TLR4_KO | Wild-type vs. MyD88_KO | Wild-type vs. TRIF_KO | ||||||
| Two-way ANOVA | F (DFn, DFd) | p value | Sig. | F (DFn, DFd) | p value | Sig. | F (DFn, DFd) | p value | Sig. |
| Interaction | F (1, 48) = 5.682 | 0.02 | * | F (1, 50) = 3.729 | 0.06 | ns | F (1, 46) = 0.8172 | 0.37 | ns |
| Genotype | F (1, 48) = 5.635 | 0.02 | * | F (1, 50) = 3.717 | 0.06 | ns | F (1, 46) = 0.8123 | 0.37 | ns |
| Treatment | F (1, 48) = 30.51 | <0.001 | *** | F (1, 50) = 45.36 | <0.001 | *** | F (1, 46) = 47.64 | <0.001 | *** |
| CCL2 | Wild-type vs. TLR4_KO | Wild-type vs. MyD88_KO | Wild-type vs. TRIF_KO | ||||||
| Two-way ANOVA | F (DFn, DFd) | p value | Sig. | F (DFn, DFd) | p value | Sig. | F (DFn, DFd) | p value | Sig. |
| Interaction | F (1, 49) = 0.5700 | 0.45 | ns | F (1, 50) = 16.21 | <0.001 | *** | F (1, 46) = 0.6718 | 0.42 | ns |
| Genotype | F (1, 49) = 0.5684 | 0.45 | ns | F (1, 50) = 16.23 | <0.001 | *** | F (1, 46) = 0.6718 | 0.42 | ns |
| Treatment | F (1, 49) = 47.53 | <0.001 | *** | F (1, 50) = 33.55 | <0.001 | *** | F (1, 46) = 44.86 | <0.001 | *** |
| COX2 | Wild-type vs. TLR4_KO | Wild-type vs. MyD88_KO | Wild-type vs. TRIF_KO | ||||||
| Two-way ANOVA | F (DFn, DFd) | p value | Sig. | F (DFn, DFd) | p value | Sig. | F (DFn, DFd) | p value | Sig. |
| Interaction | F (1, 48) = 0.4550 | 0.5 | ns | F (1, 52) = 0.5579 | 0.46 | ns | F (1, 47) = 0.1670 | 0.68 | ns |
| Genotype | F (1, 48) = 0.4508 | 0.51 | ns | F (1, 52) = 0.5526 | 0.46 | ns | F (1, 47) = 0.1670 | 0.68 | ns |
| Treatment | F (1, 48) = 13.56 | <0.001 | *** | F (1, 52) = 20.60 | <0.001 | *** | F (1, 47) = 19.05 | <0.001 | *** |
| FosB | Wild-Type vs. TLR4_KO | Wild-Type vs. MyD88_KO | Wild-Type vs. TRIF_KO | ||||||
| Two-Way ANOVA | F (DFn, DFd) | p Value | Sig. | F (DFn, DFd) | p Value | Sig. | F (DFn, DFd) | p Value | Sig. |
| Interaction | F (1, 48) = 8.583 | 0.005 | ** | F (1, 49) = 9.414 | 0.004 | ** | F (1, 45) = 2.203 | 0.14 | ns |
| Genotype | F (1, 48) = 8.584 | 0.005 | ** | F (1, 49) = 9.421 | 0.003 | ** | F (1, 45) = 2.204 | 0.14 | ns |
| Treatment | F (1, 48) = 30.17 | <0.001 | *** | F (1, 49) = 32.22 | <0.001 | *** | F (1, 45) = 31.07 | <0.001 | *** |
| JunB | Wild-type vs. TLR4_KO | Wild-type vs. MyD88_KO | Wild-type vs. TRIF_KO | ||||||
| Two-way ANOVA | F (DFn, DFd) | p value | Sig. | F (DFn, DFd) | p value | Sig. | F (DFn, DFd) | p value | Sig. |
| Interaction | F (1, 48) = 8.811 | 0.005 | ** | F (1, 51) = 4.386 | 0.04 | * | F (1, 46) = 0.8740 | 0.35 | ns |
| Genotype | F (1, 48) = 8.824 | 0.005 | ** | F (1, 51) = 4.327 | 0.04 | * | F (1, 46) = 0.8699 | 0.36 | ns |
| Treatment | F (1, 48) = 18.09 | <0.001 | *** | F (1, 51) = 32.12 | <0.001 | *** | F (1, 46) = 25.82 | <0.001 | *** |
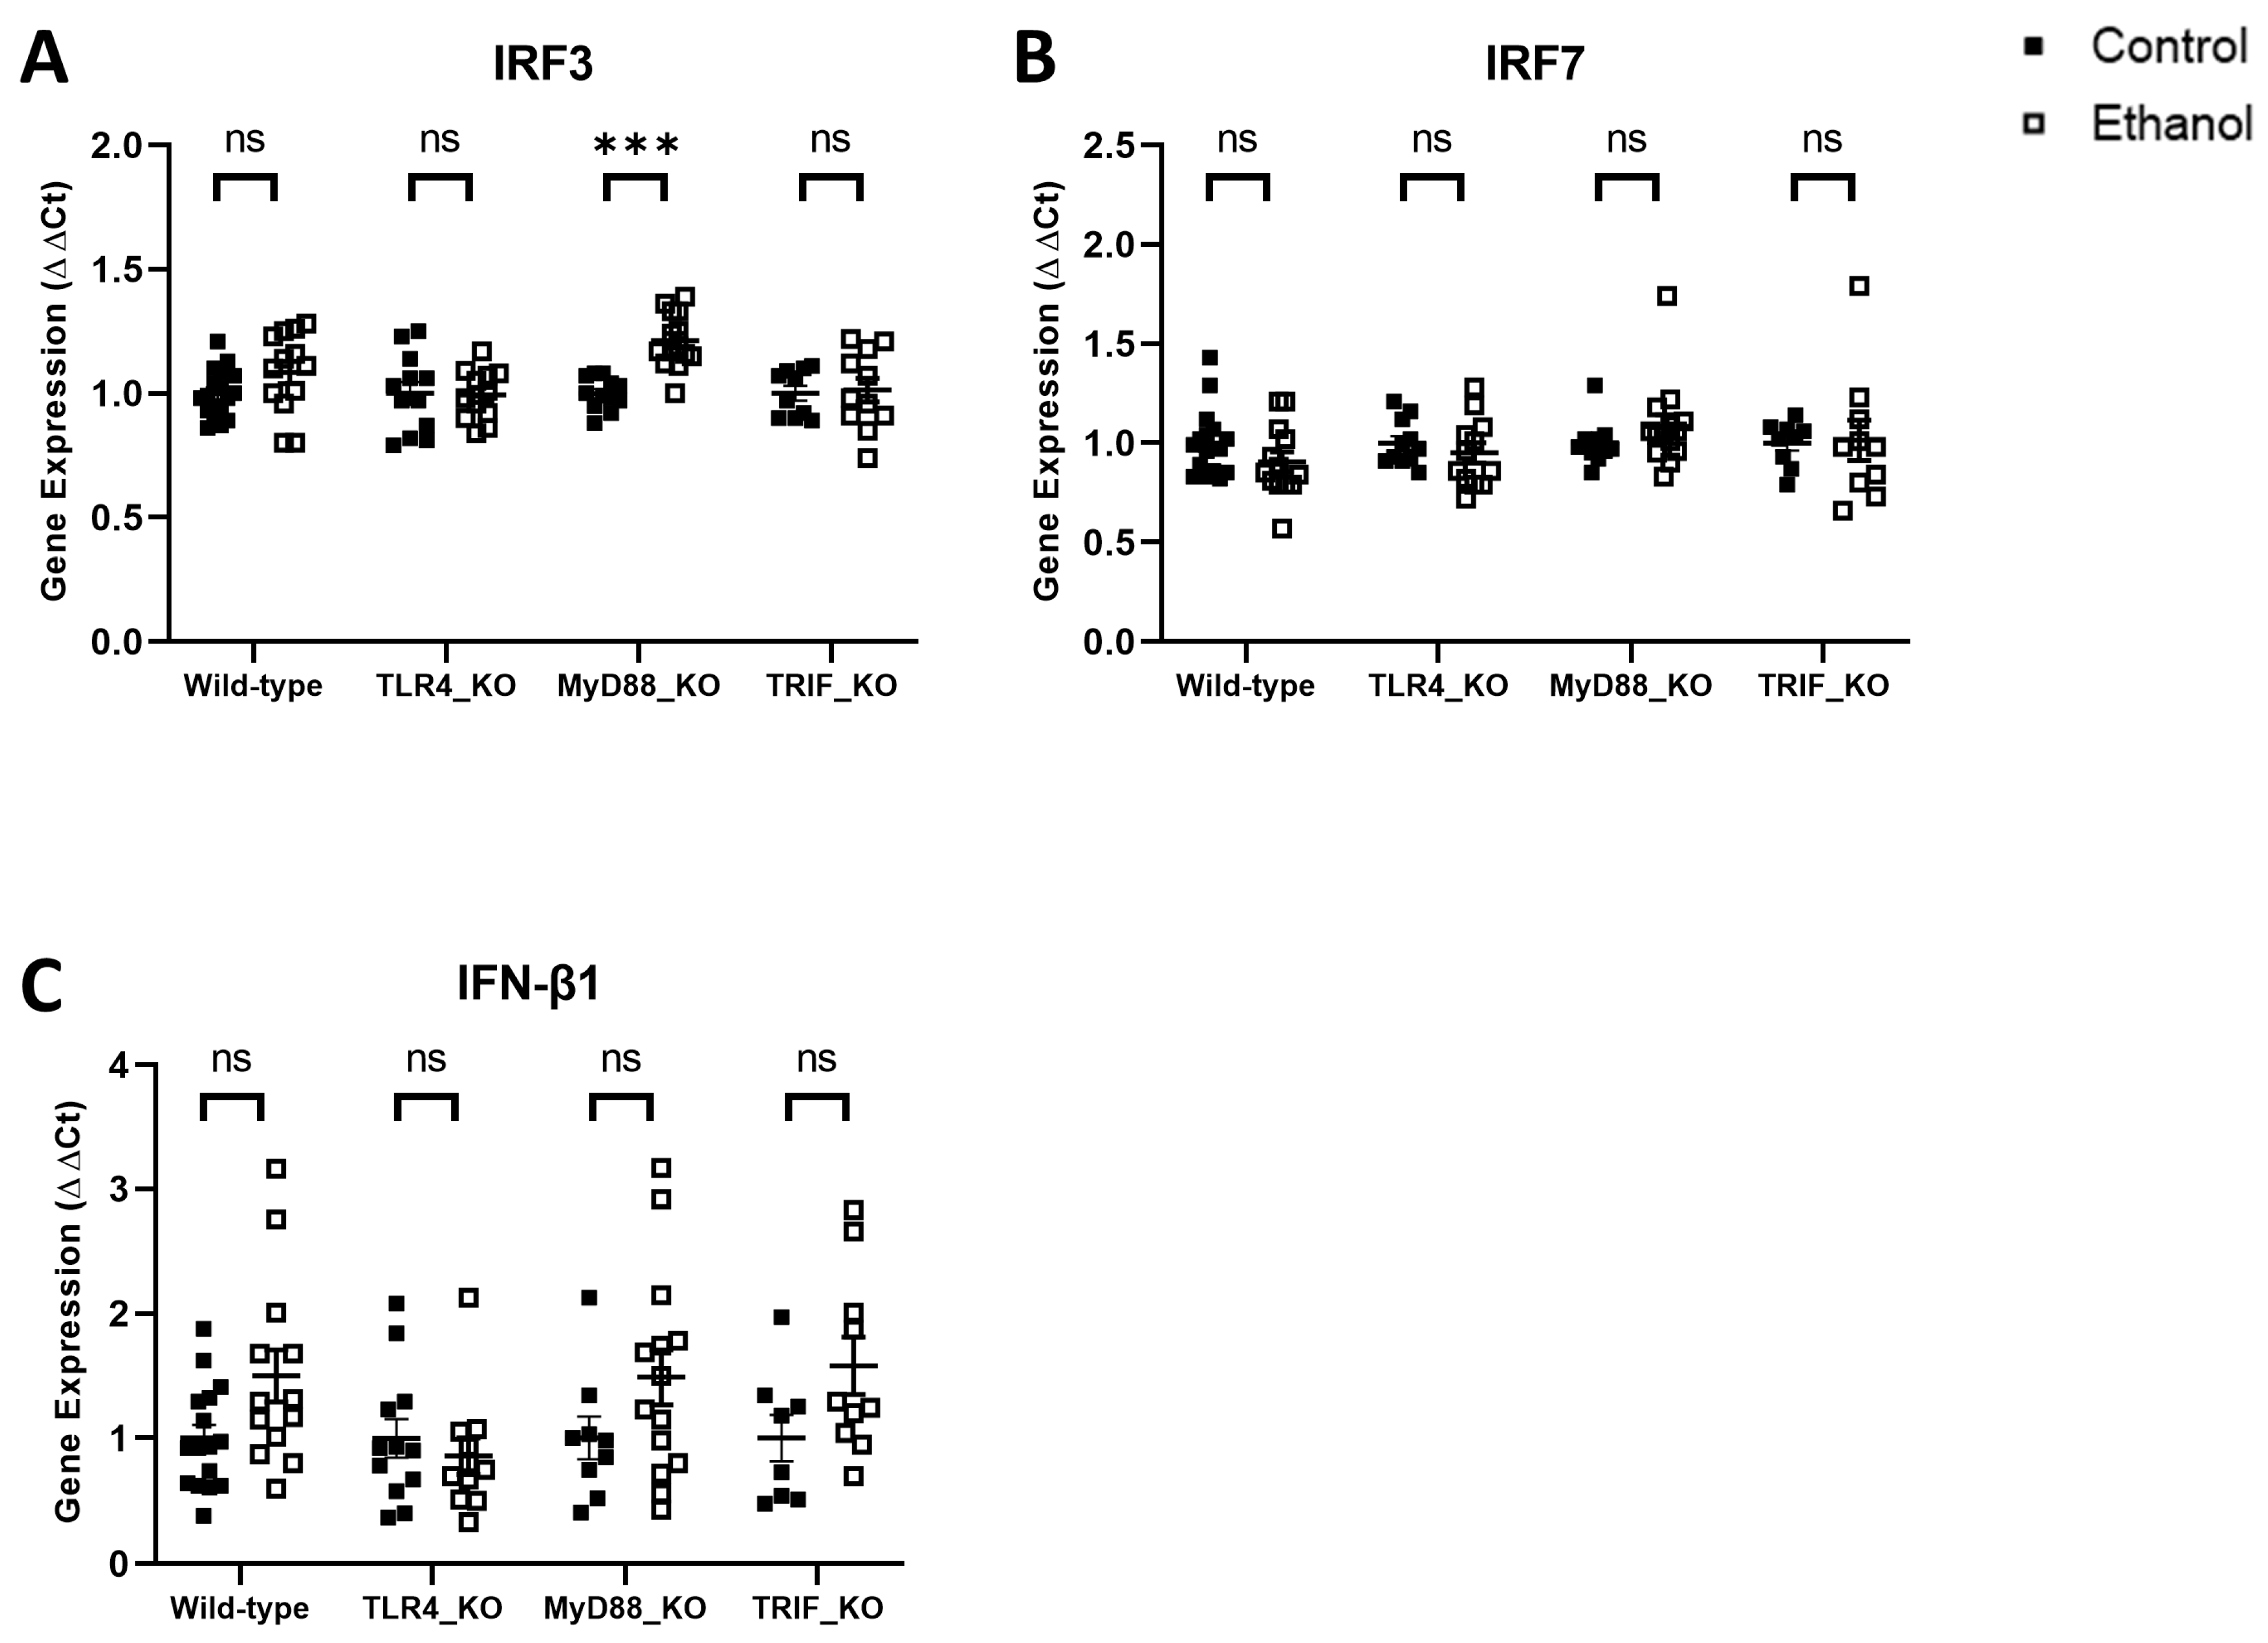
| IRF3 | Wild-Type vs. TLR4_KO | Wild-Type vs. MyD88_KO | Wild-Type vs. TRIF_KO | ||||||
| Two-Way ANOVA | F (DFn, DFd) | p Value | Sig. | F (DFn, DFd) | p Value | Sig. | F (DFn, DFd) | p Value | Sig. |
| Interaction | F (1, 50) = 1.578 | 0.21 | ns | F (1, 52) = 4.392 | 0.04 | * | F (1, 47) = 0.9352 | 0.34 | ns |
| Genotype | F (1, 50) = 1.578 | 0.21 | ns | F (1, 52) = 4.279 | 0.04 | * | F (1, 47) = 0.8840 | 0.35 | ns |
| Treatment | F (1, 50) = 1.197 | 0.28 | ns | F (1, 52) = 23.61 | <0.001 | *** | F (1, 47) = 1.707 | 0.20 | ns |
| IRF7 | Wild-type vs. TLR4_KO | Wild-type vs. MyD88_KO | Wild-type vs. TRIF_KO | ||||||
| Two-way ANOVA | F (DFn, DFd) | p value | Sig. | F (DFn, DFd) | p value | Sig. | F (DFn, DFd) | p value | Sig. |
| Interaction | F (1, 48) = 0.2452 | 0.62 | ns | F (1, 49) = 3.275 | 0.08 | ns | F (1, 44) = 0.8061 | 0.37 | ns |
| Genotype | F (1, 48) = 0.2392 | 0.63 | ns | F (1, 49) = 3.321 | 0.07 | ns | F (1, 44) = 0.7919 | 0.38 | ns |
| Treatment | F (1, 48) = 2.433 | 0.13 | ns | F (1, 49) = 0.0097 | 0.92 | ns | F (1, 44) = 0.4236 | 0.52 | ns |
| IFN-β1 | Wild-type vs. TLR4_KO | Wild-type vs. MyD88_KO | Wild-type vs. TRIF_KO | ||||||
| Two-way ANOVA | F (DFn, DFd) | p value | Sig. | F (DFn, DFd) | p value | Sig. | F (DFn, DFd) | p value | Sig. |
| Interaction | F (1, 48) = 4.196 | 0.05 | * | F (1, 48) = 0.0011 | 0.97 | ns | F (1, 43) = 0.0469 | 0.83 | ns |
| Genotype | F (1, 48) = 4.234 | 0.05 | * | F (1, 48) = 0.0009 | 0.98 | ns | F (1, 43) = 0.0455 | 0.83 | ns |
| Treatment | F (1, 48) = 1.312 | 0.26 | ns | F (1, 48) = 7.038 | 0.01 | * | F (1, 43) = 8.436 | 0.006 | ** |
Disclaimer/Publisher’s Note: The statements, opinions and data contained in all publications are solely those of the individual author(s) and contributor(s) and not of MDPI and/or the editor(s). MDPI and/or the editor(s) disclaim responsibility for any injury to people or property resulting from any ideas, methods, instructions or products referred to in the content. |
© 2023 by the authors. Licensee MDPI, Basel, Switzerland. This article is an open access article distributed under the terms and conditions of the Creative Commons Attribution (CC BY) license (https://creativecommons.org/licenses/by/4.0/).
Share and Cite
Holloway, K.N.; Douglas, J.C.; Rafferty, T.M.; Kane, C.J.M.; Drew, P.D. Ethanol Induces Neuroinflammation in a Chronic Plus Binge Mouse Model of Alcohol Use Disorder via TLR4 and MyD88-Dependent Signaling. Cells 2023, 12, 2109. https://doi.org/10.3390/cells12162109
Holloway KN, Douglas JC, Rafferty TM, Kane CJM, Drew PD. Ethanol Induces Neuroinflammation in a Chronic Plus Binge Mouse Model of Alcohol Use Disorder via TLR4 and MyD88-Dependent Signaling. Cells. 2023; 12(16):2109. https://doi.org/10.3390/cells12162109
Chicago/Turabian StyleHolloway, Kalee N., James C. Douglas, Tonya M. Rafferty, Cynthia J. M. Kane, and Paul D. Drew. 2023. "Ethanol Induces Neuroinflammation in a Chronic Plus Binge Mouse Model of Alcohol Use Disorder via TLR4 and MyD88-Dependent Signaling" Cells 12, no. 16: 2109. https://doi.org/10.3390/cells12162109