
Sigma-1 Receptor as a Protective Factor for Diabetes-Associated Cognitive Dysfunction via Regulating Astrocytic Endoplasmic Reticulum-Mitochondrion Contact and Endoplasmic Reticulum Stress
 , , , and
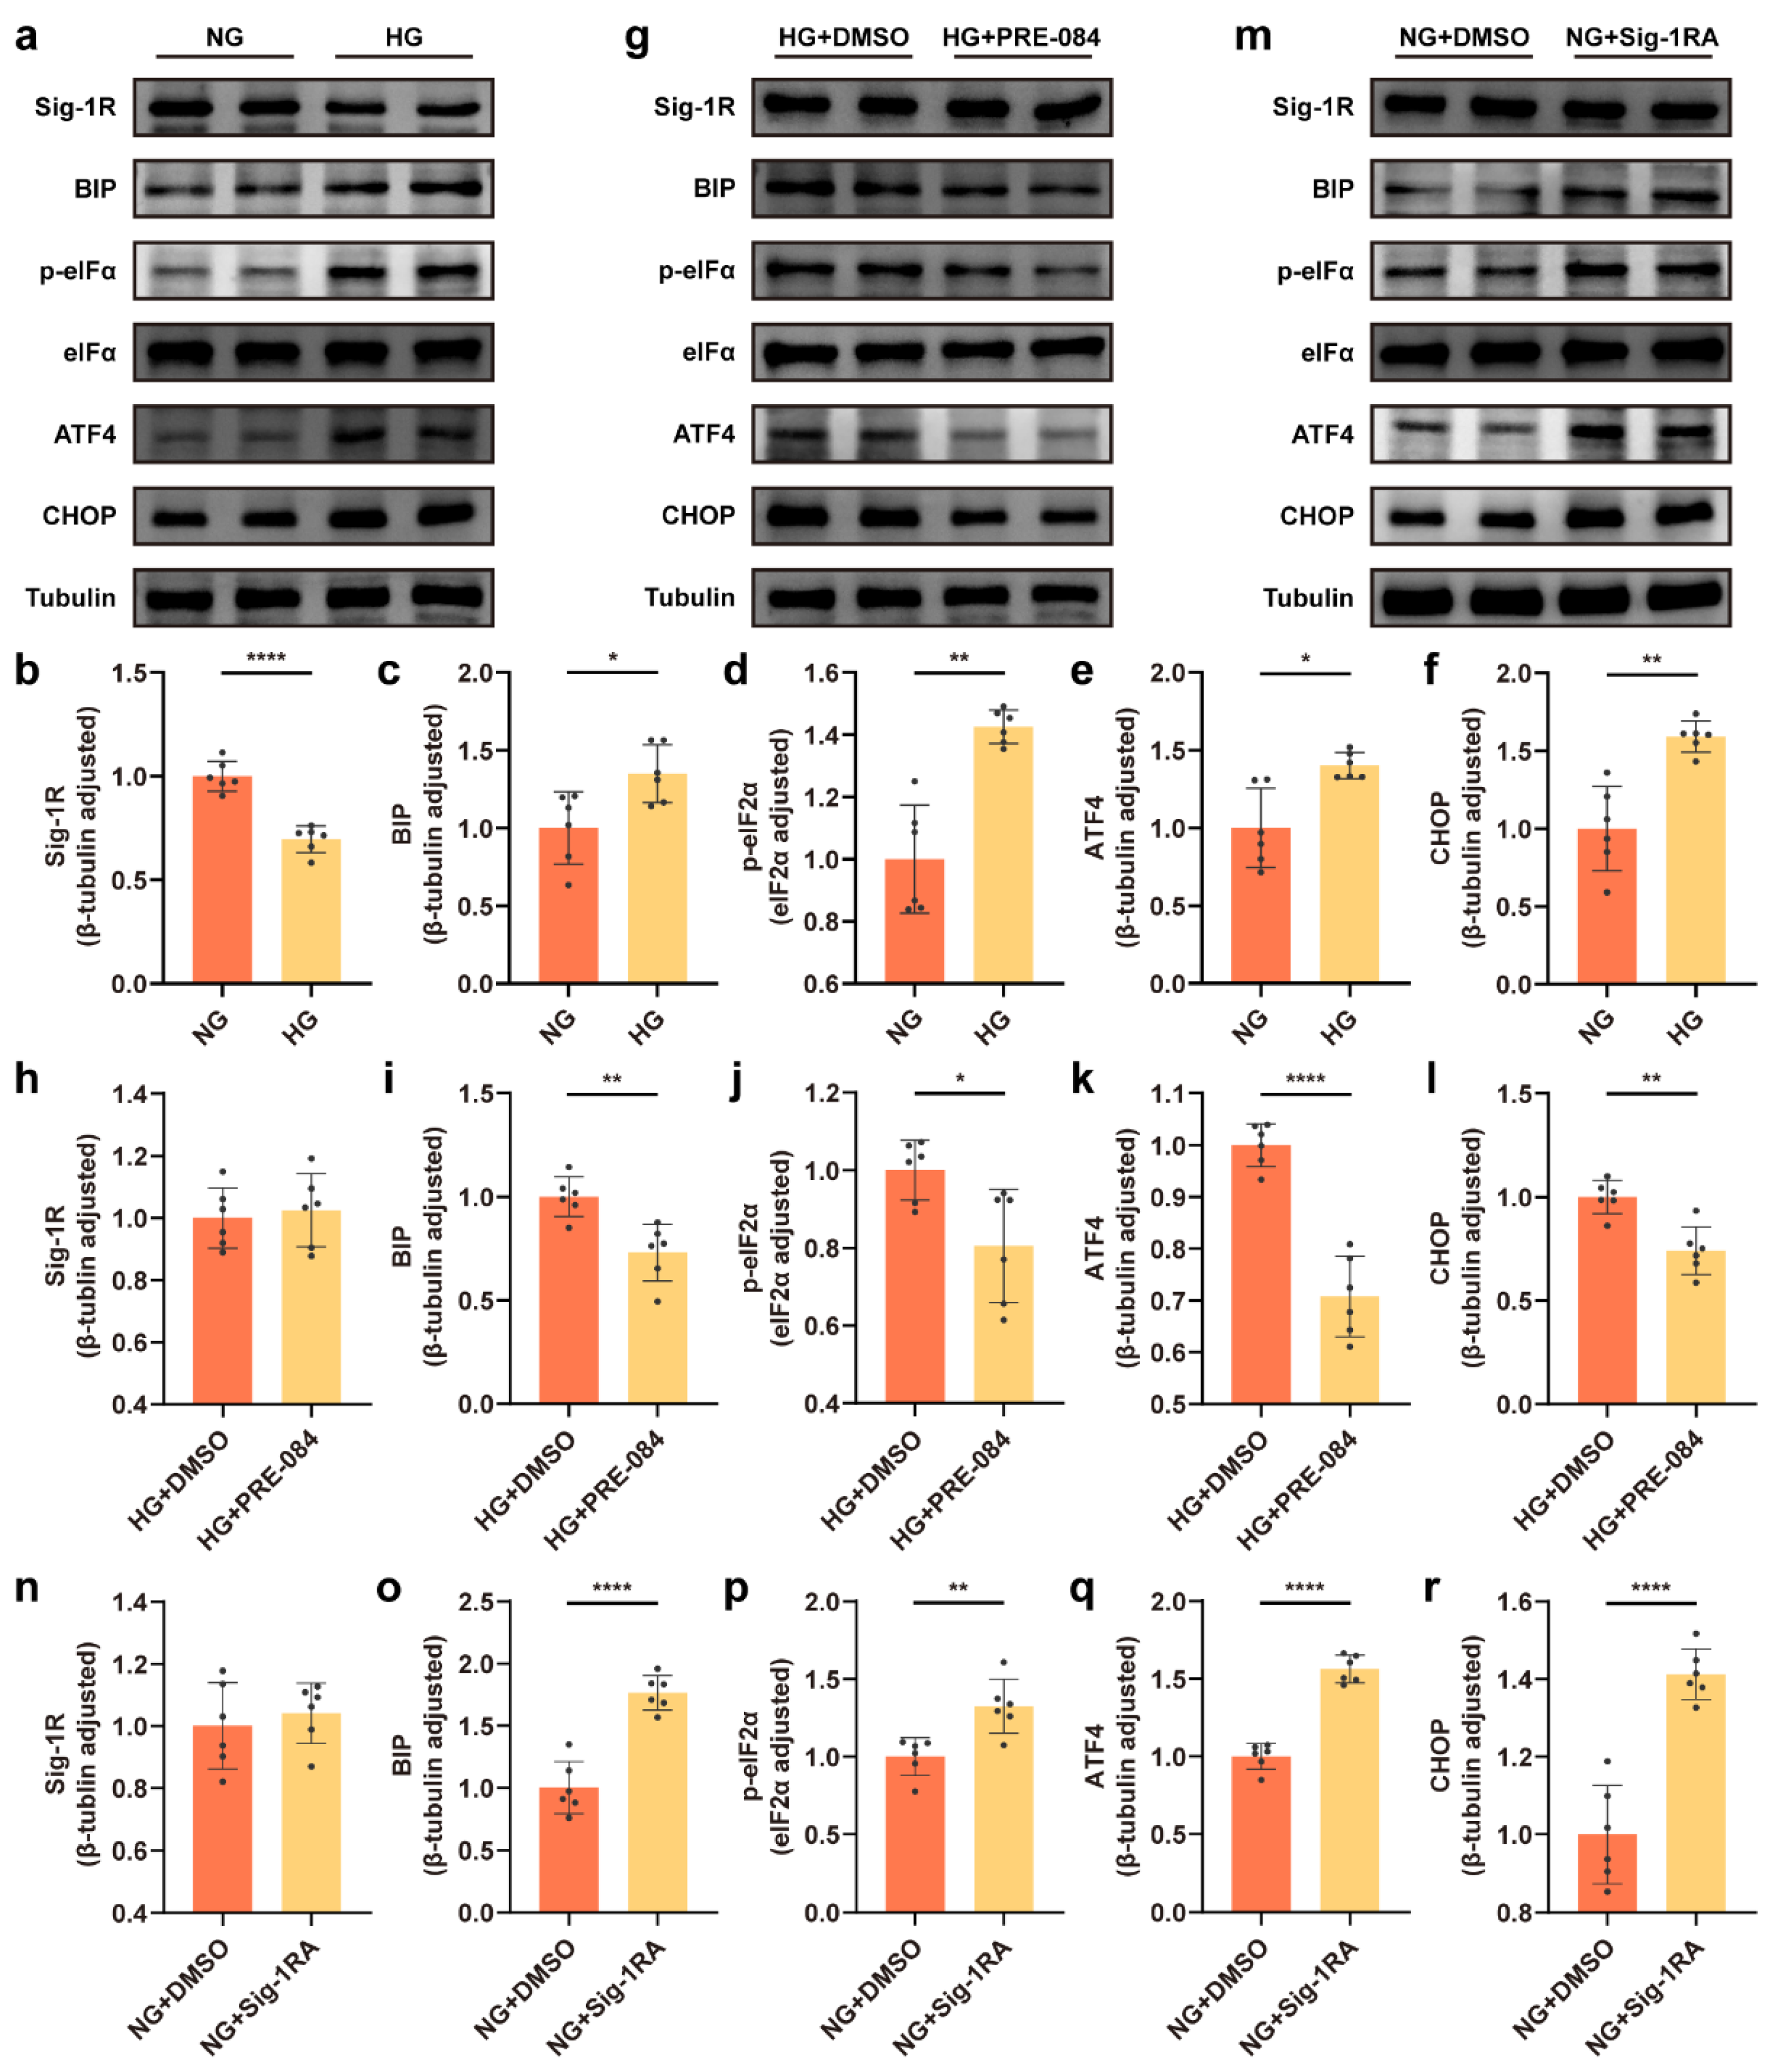
Abstract
:1. Introduction
2. Materials and Methods
2.1. Cell Culture and Treatment
2.2. Animal Participants and Drug Administration
2.3. Western Blot Analysis
2.4. Enzyme-Linked Immunosorbent Assay Analysis
2.5. Transmission Electron Microscopy
2.6. Golgi Staining
2.7. TUNEL Assay
2.8. Y-Maze Test
2.9. Morris Water Maze Test
2.10. Statistical Analysis
3. Results
3.1. Decrease in Sig-1R Expression Was Associated with ERS of Astrocytes Exposed to a HG Concentration
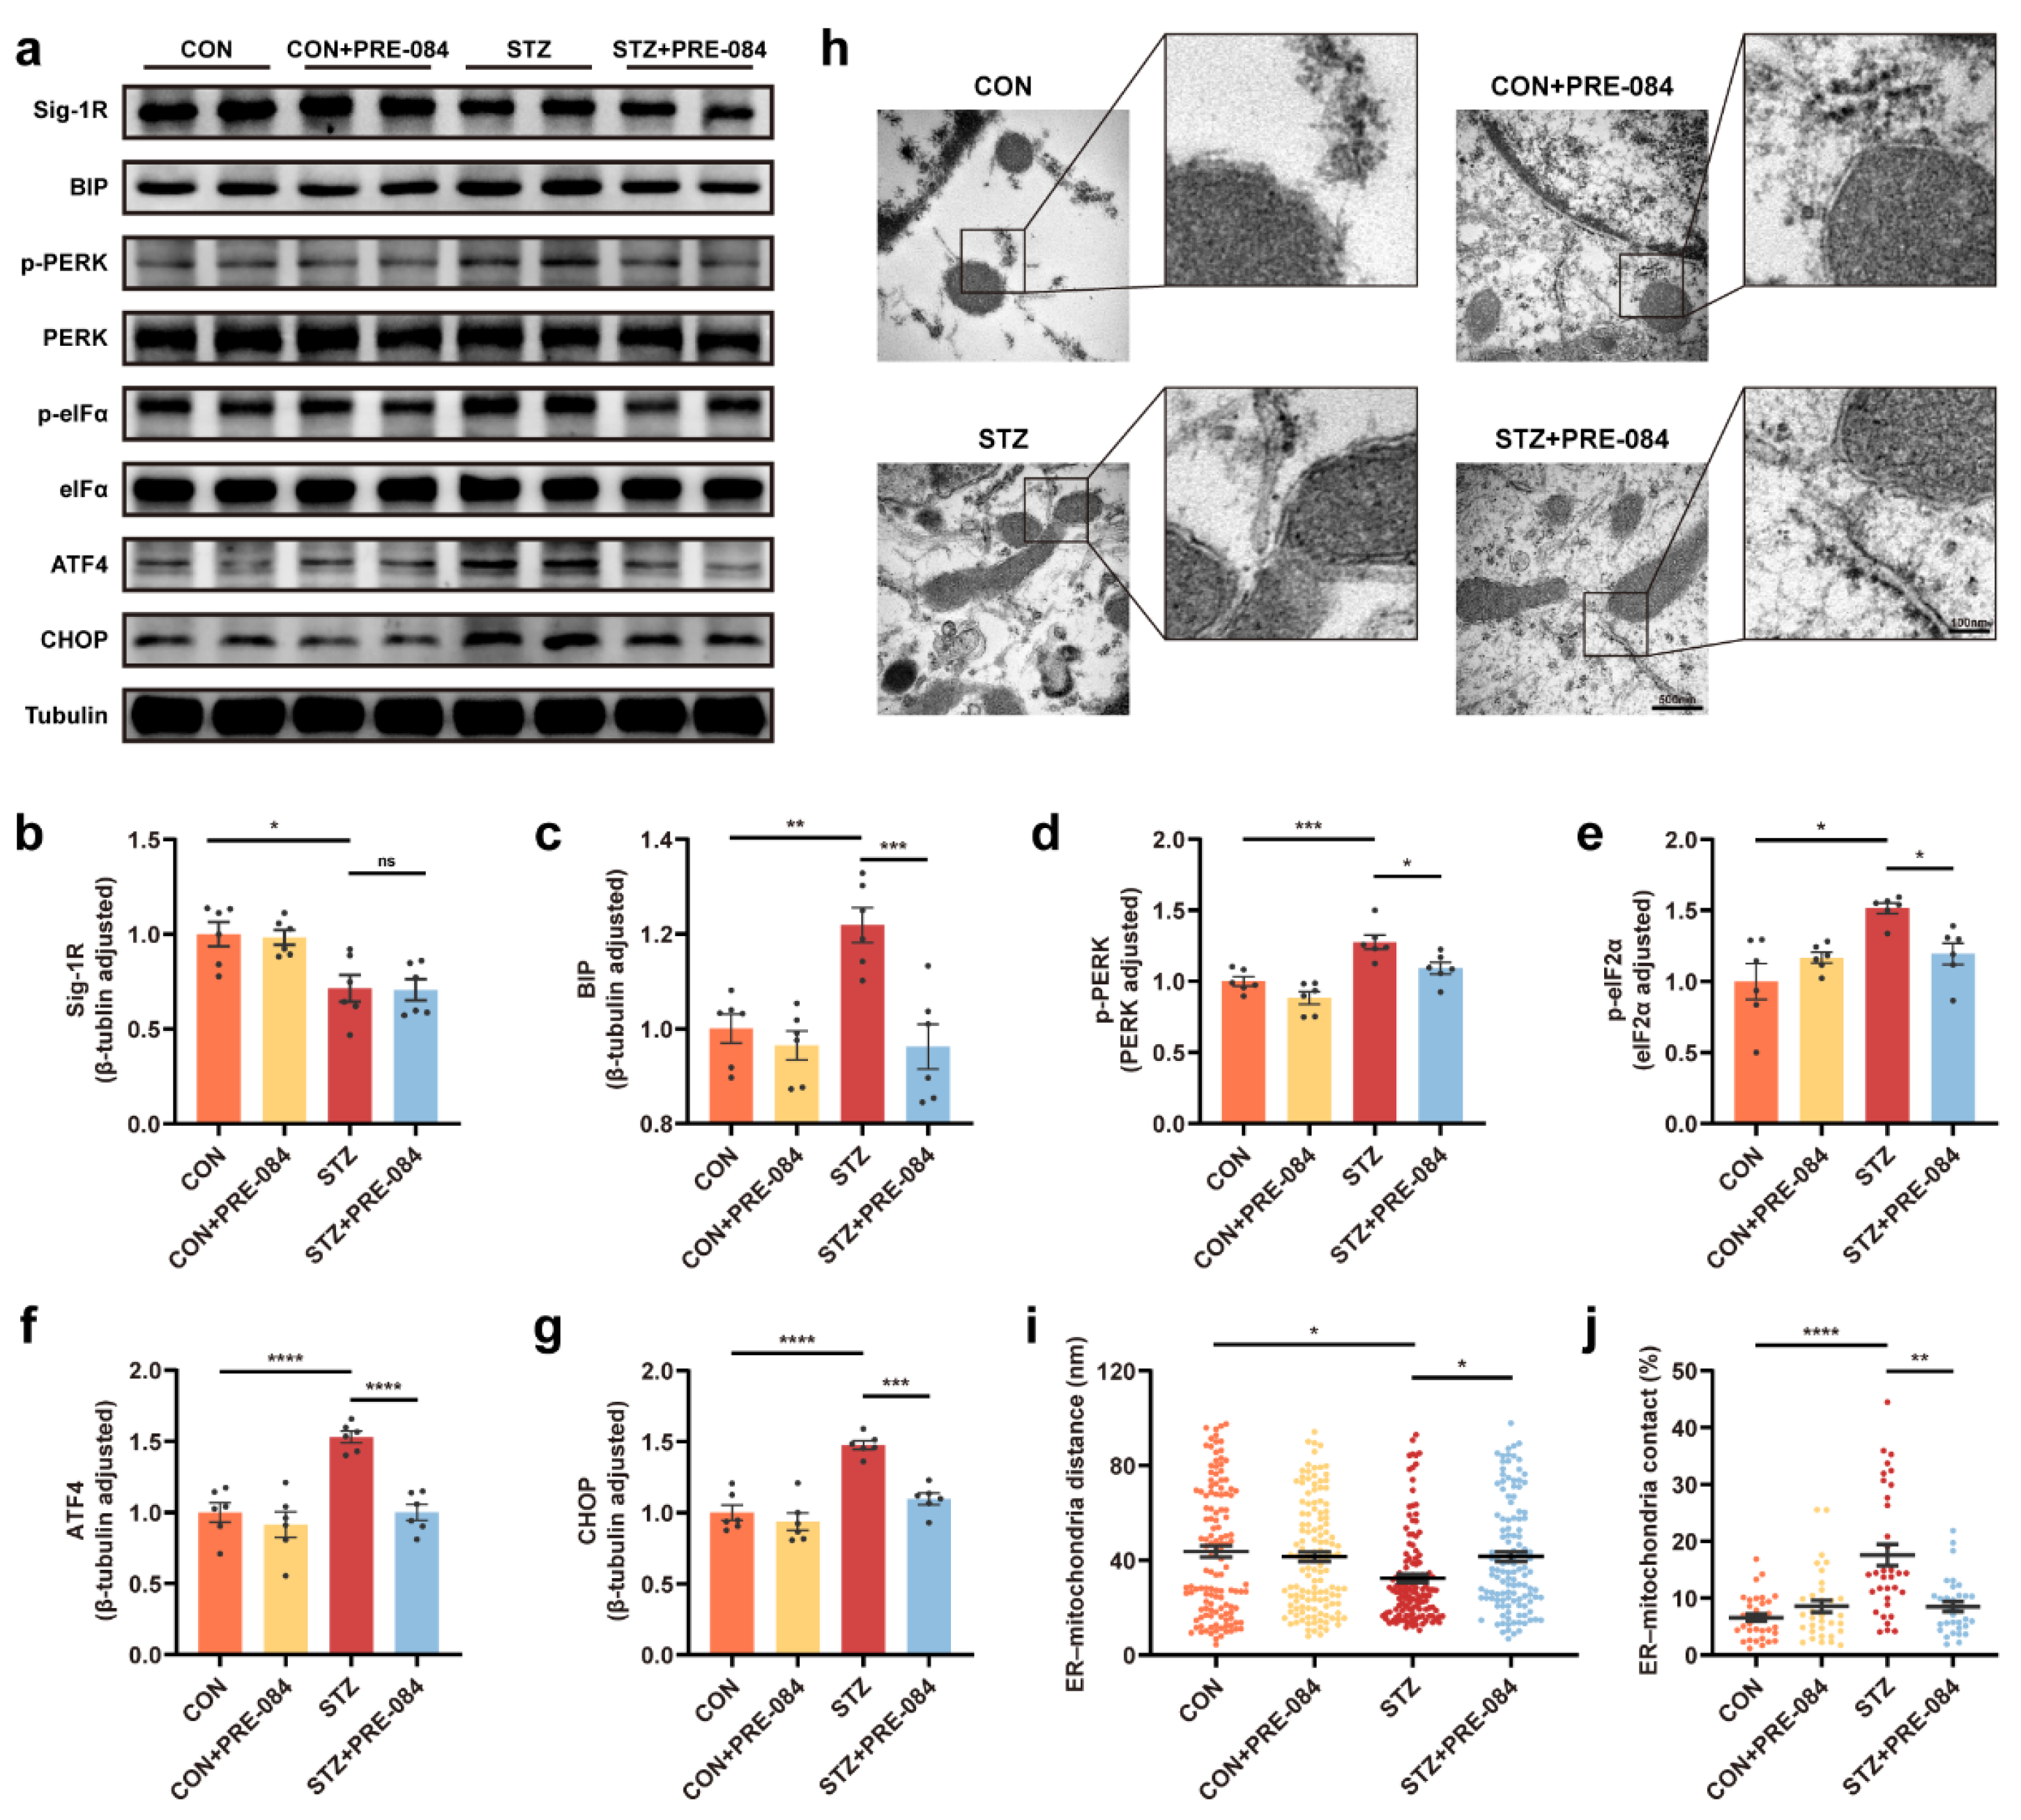
3.2. Activation of Sig-1R Reduced ERS and Astrocytic ER-Mitochondrion Contact in the Hippocampus of Mice with T1DM
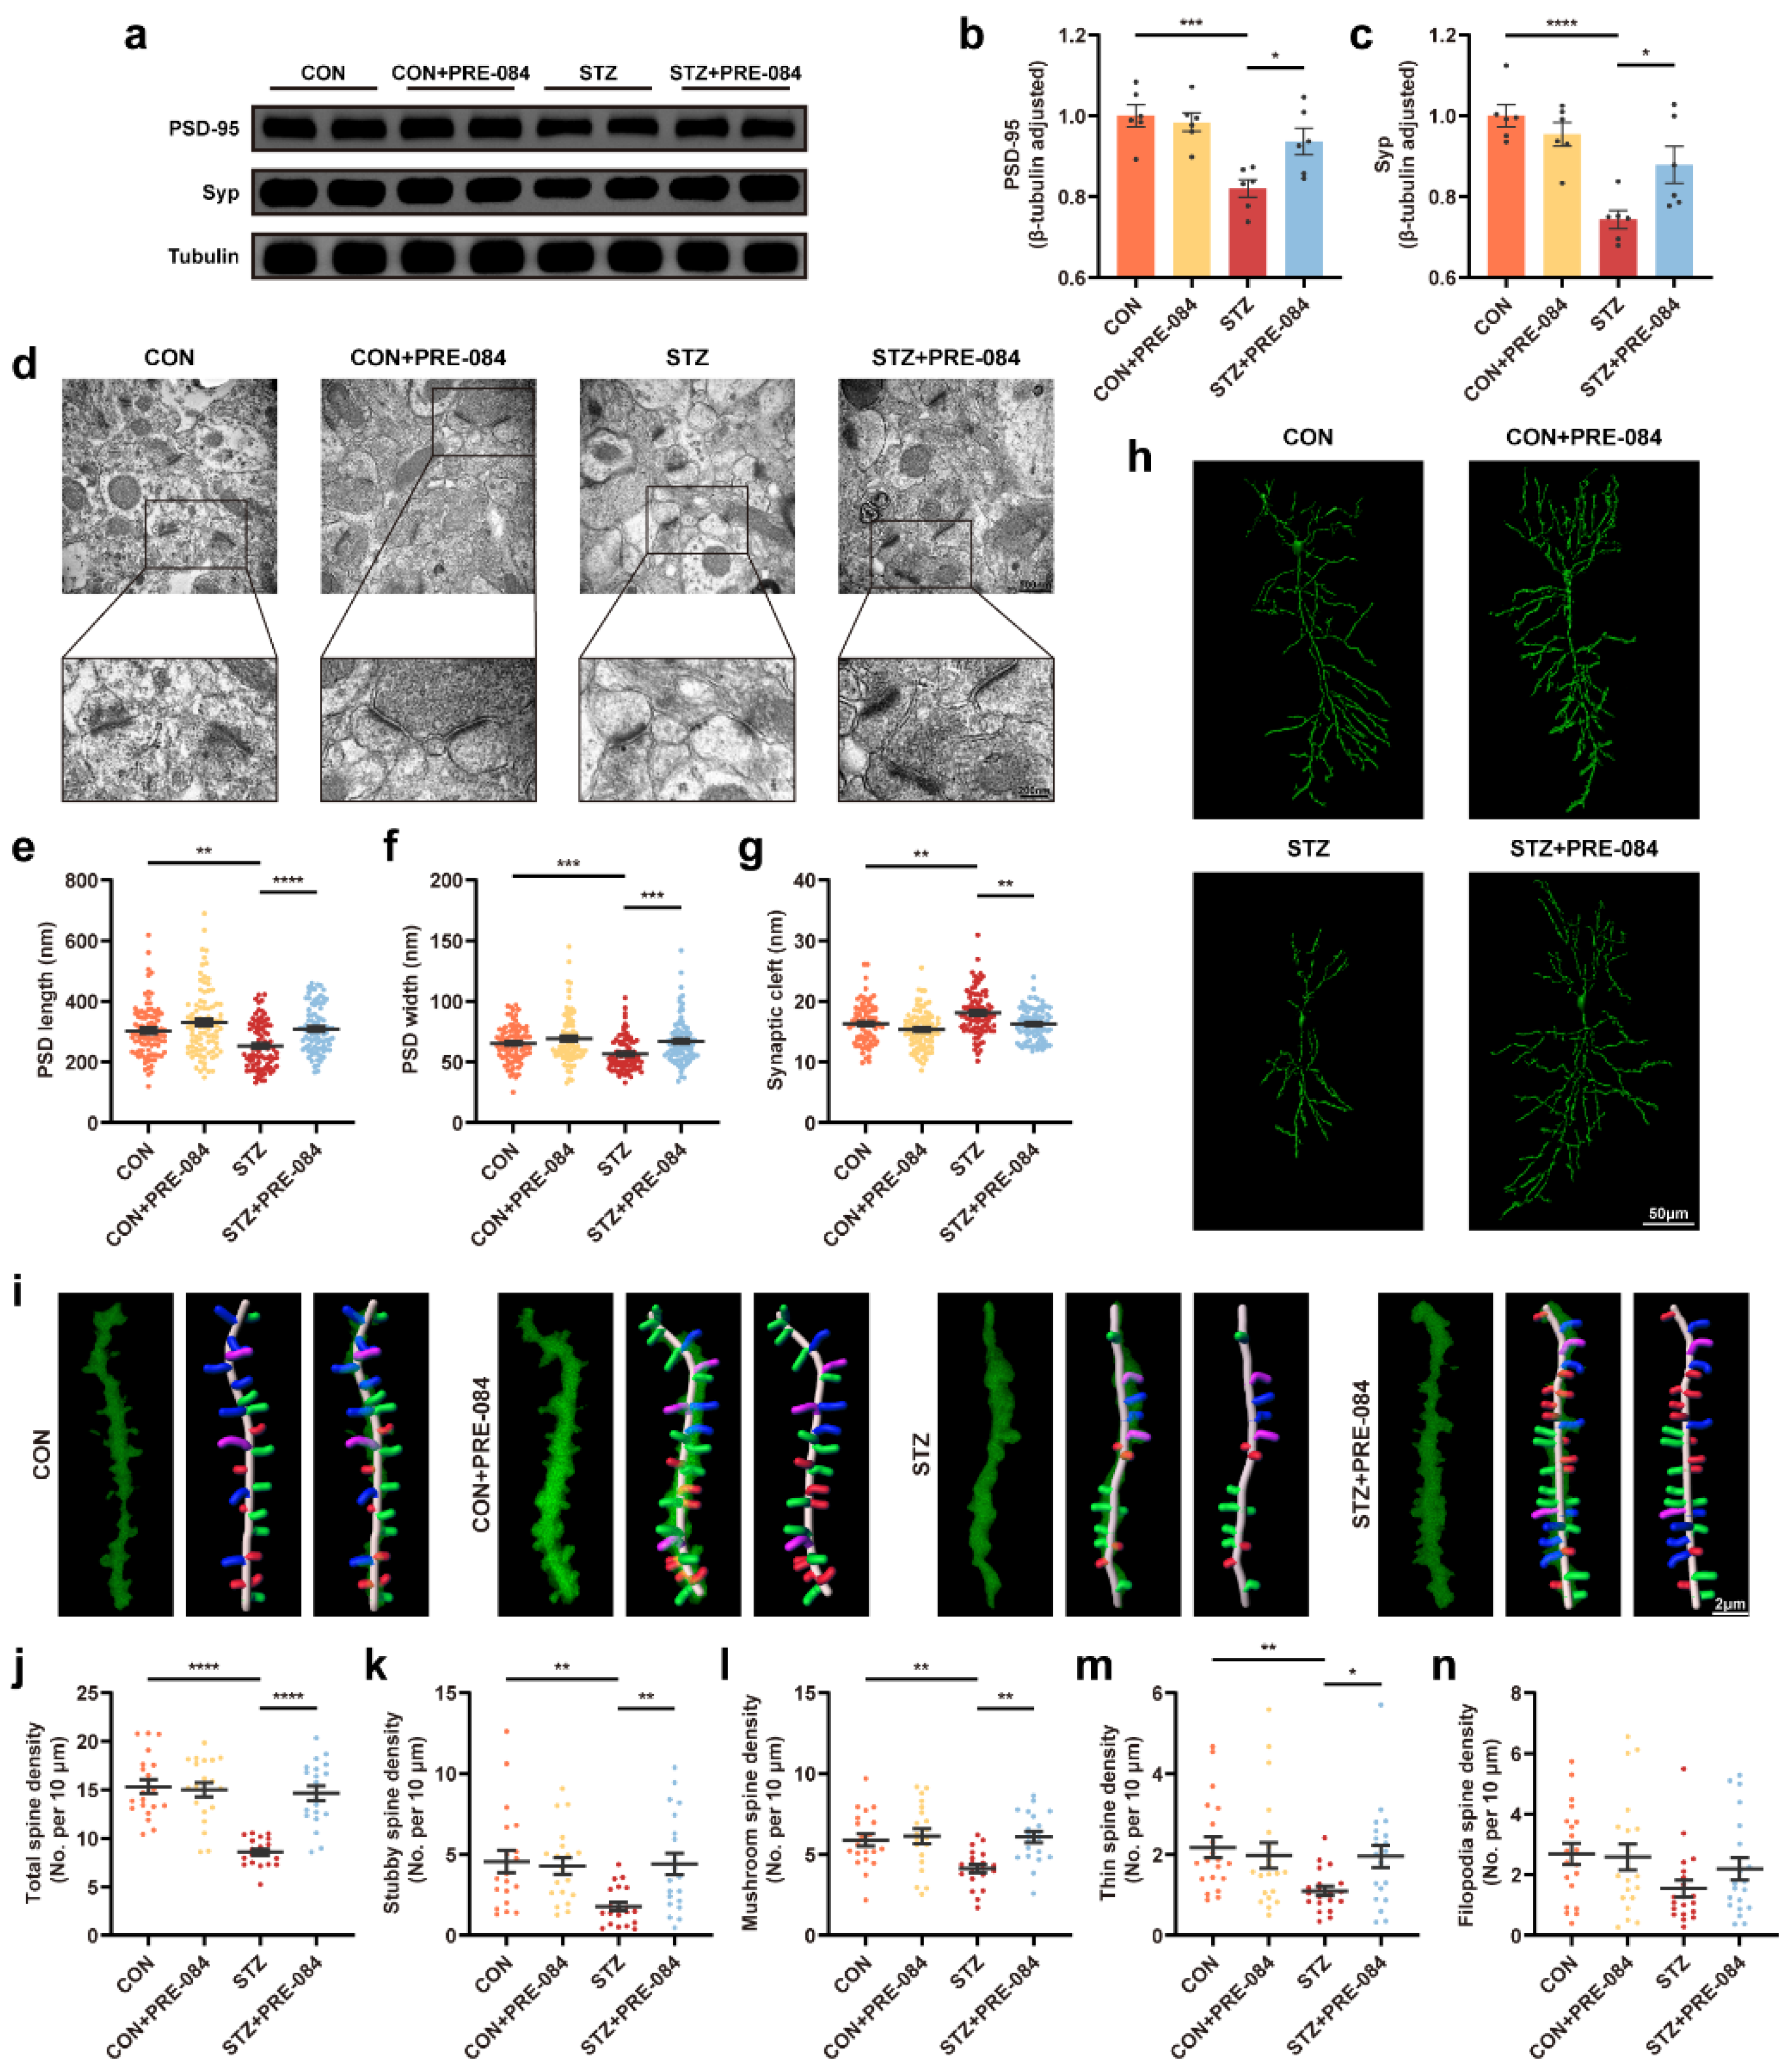
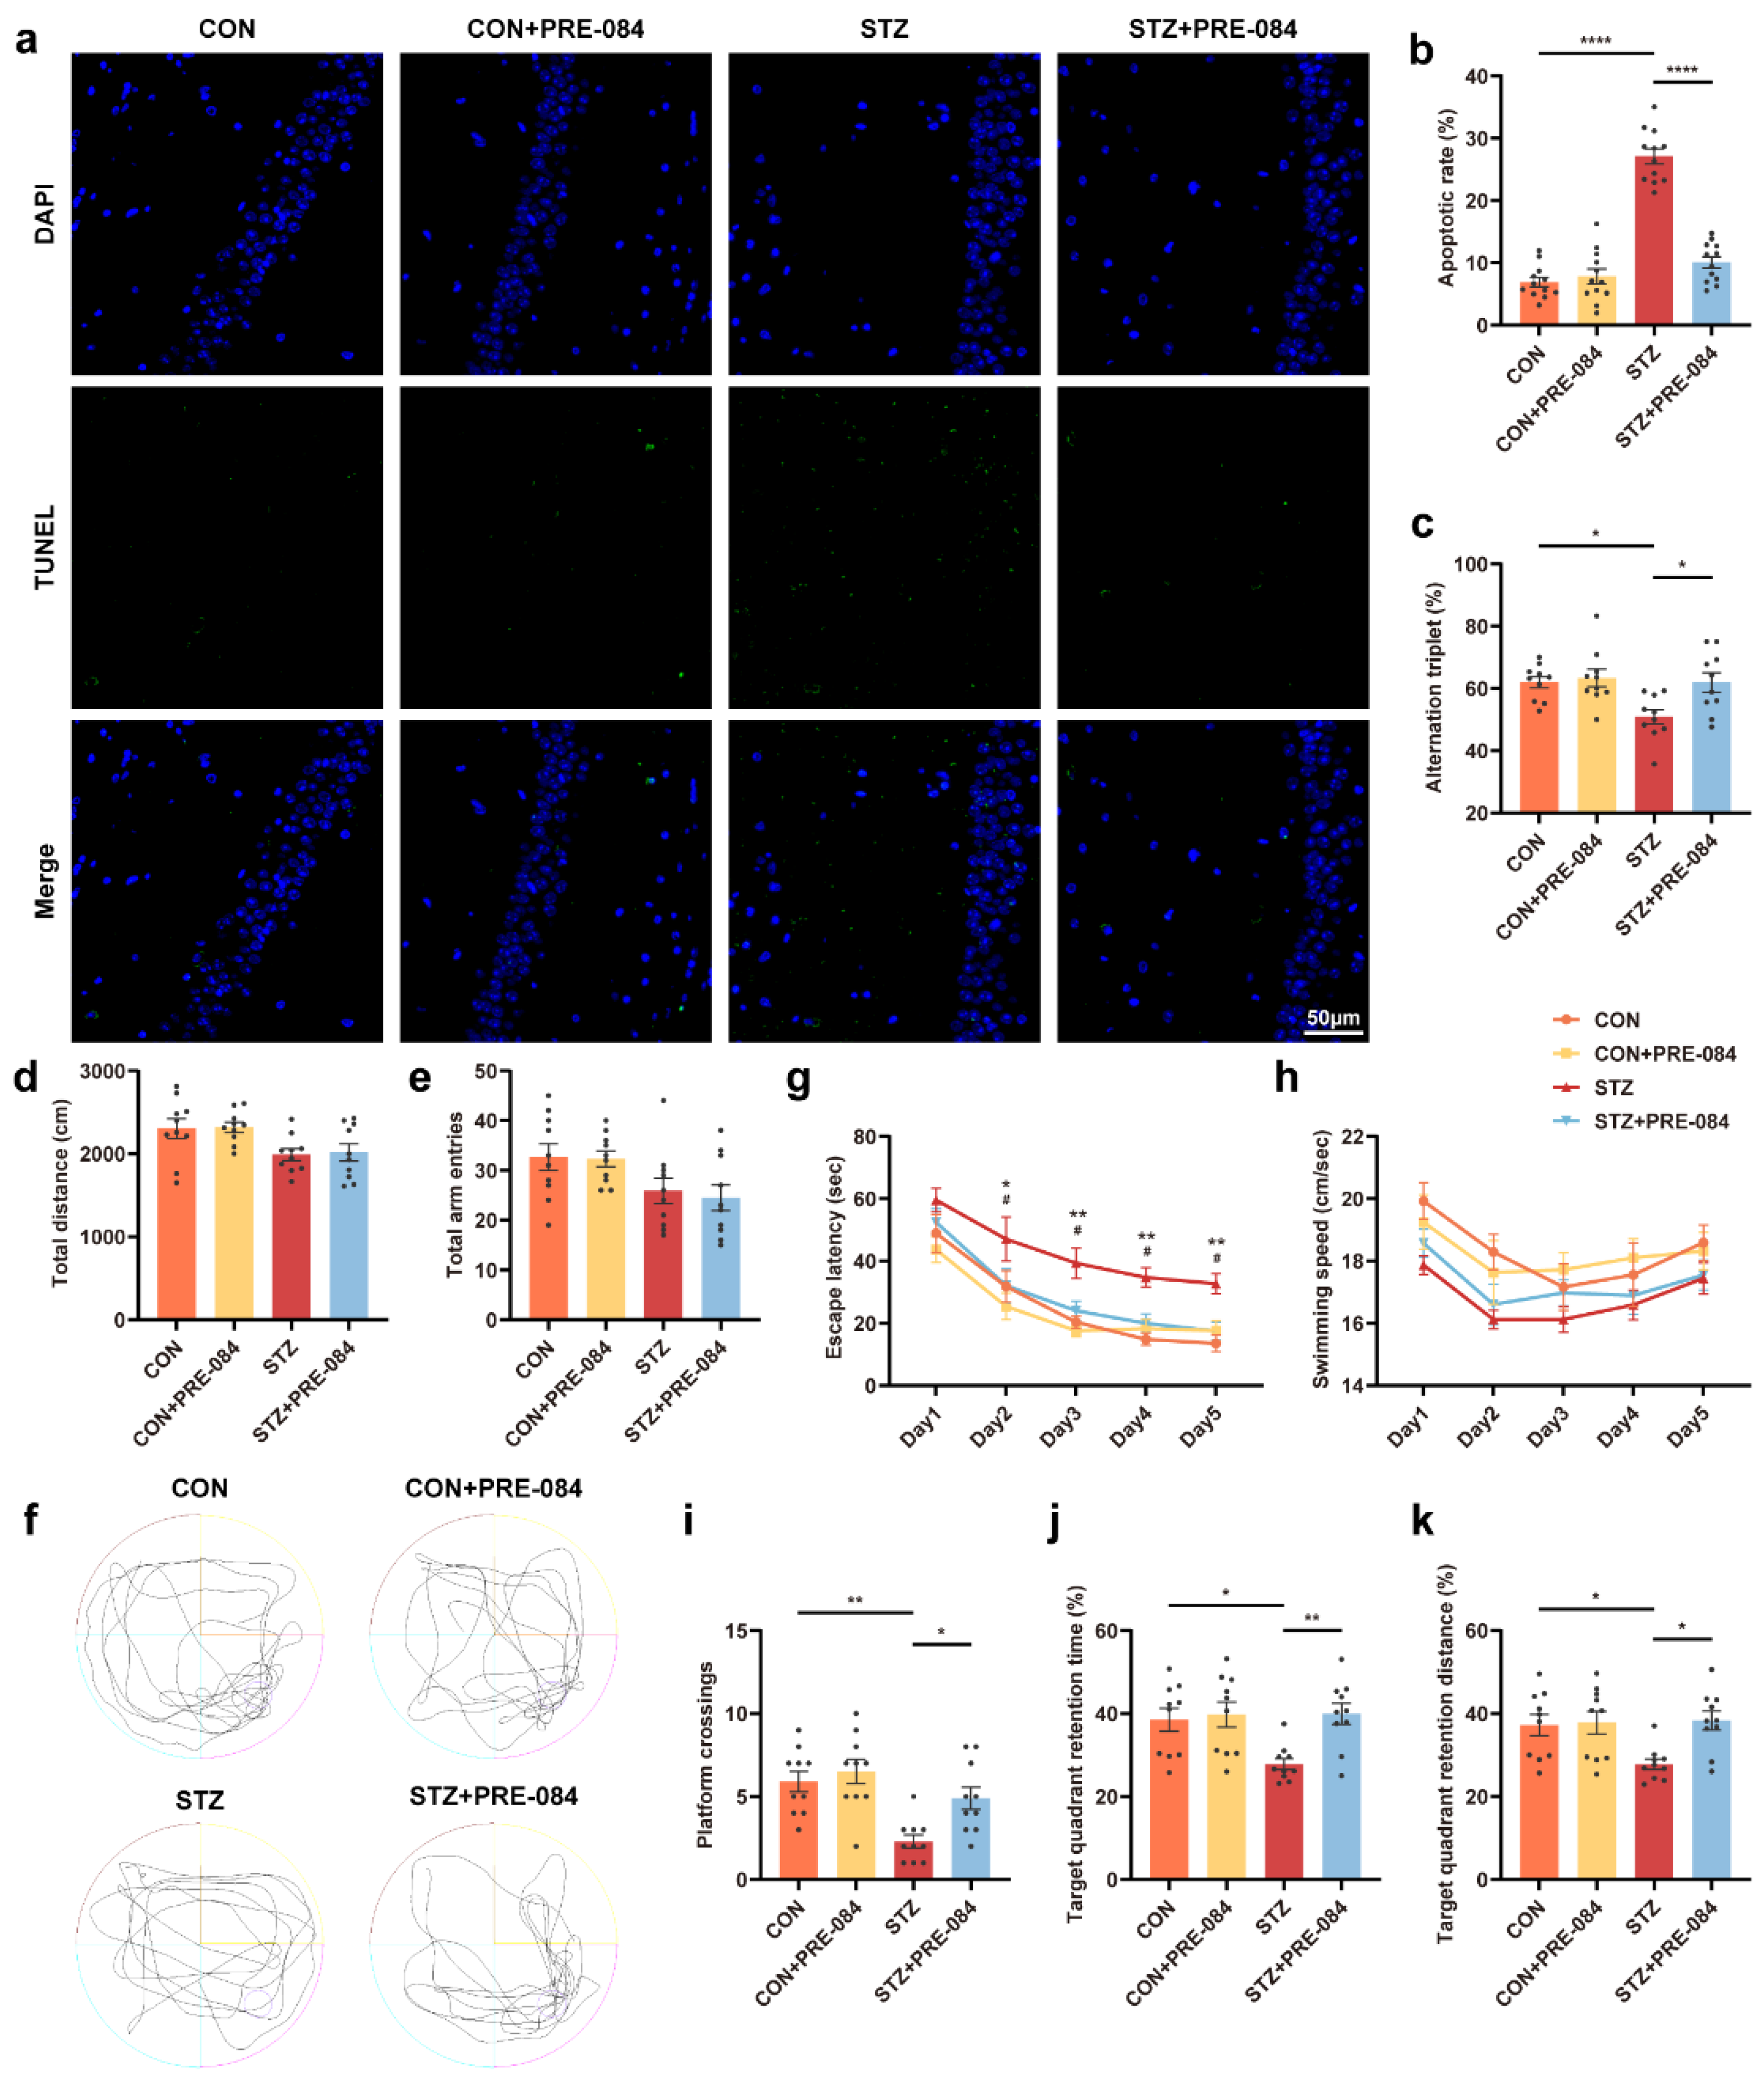
3.3. Activation of Sig-1R Ameliorated Synaptic Loss and Cognitive Dysfunction in Mice with T1DM
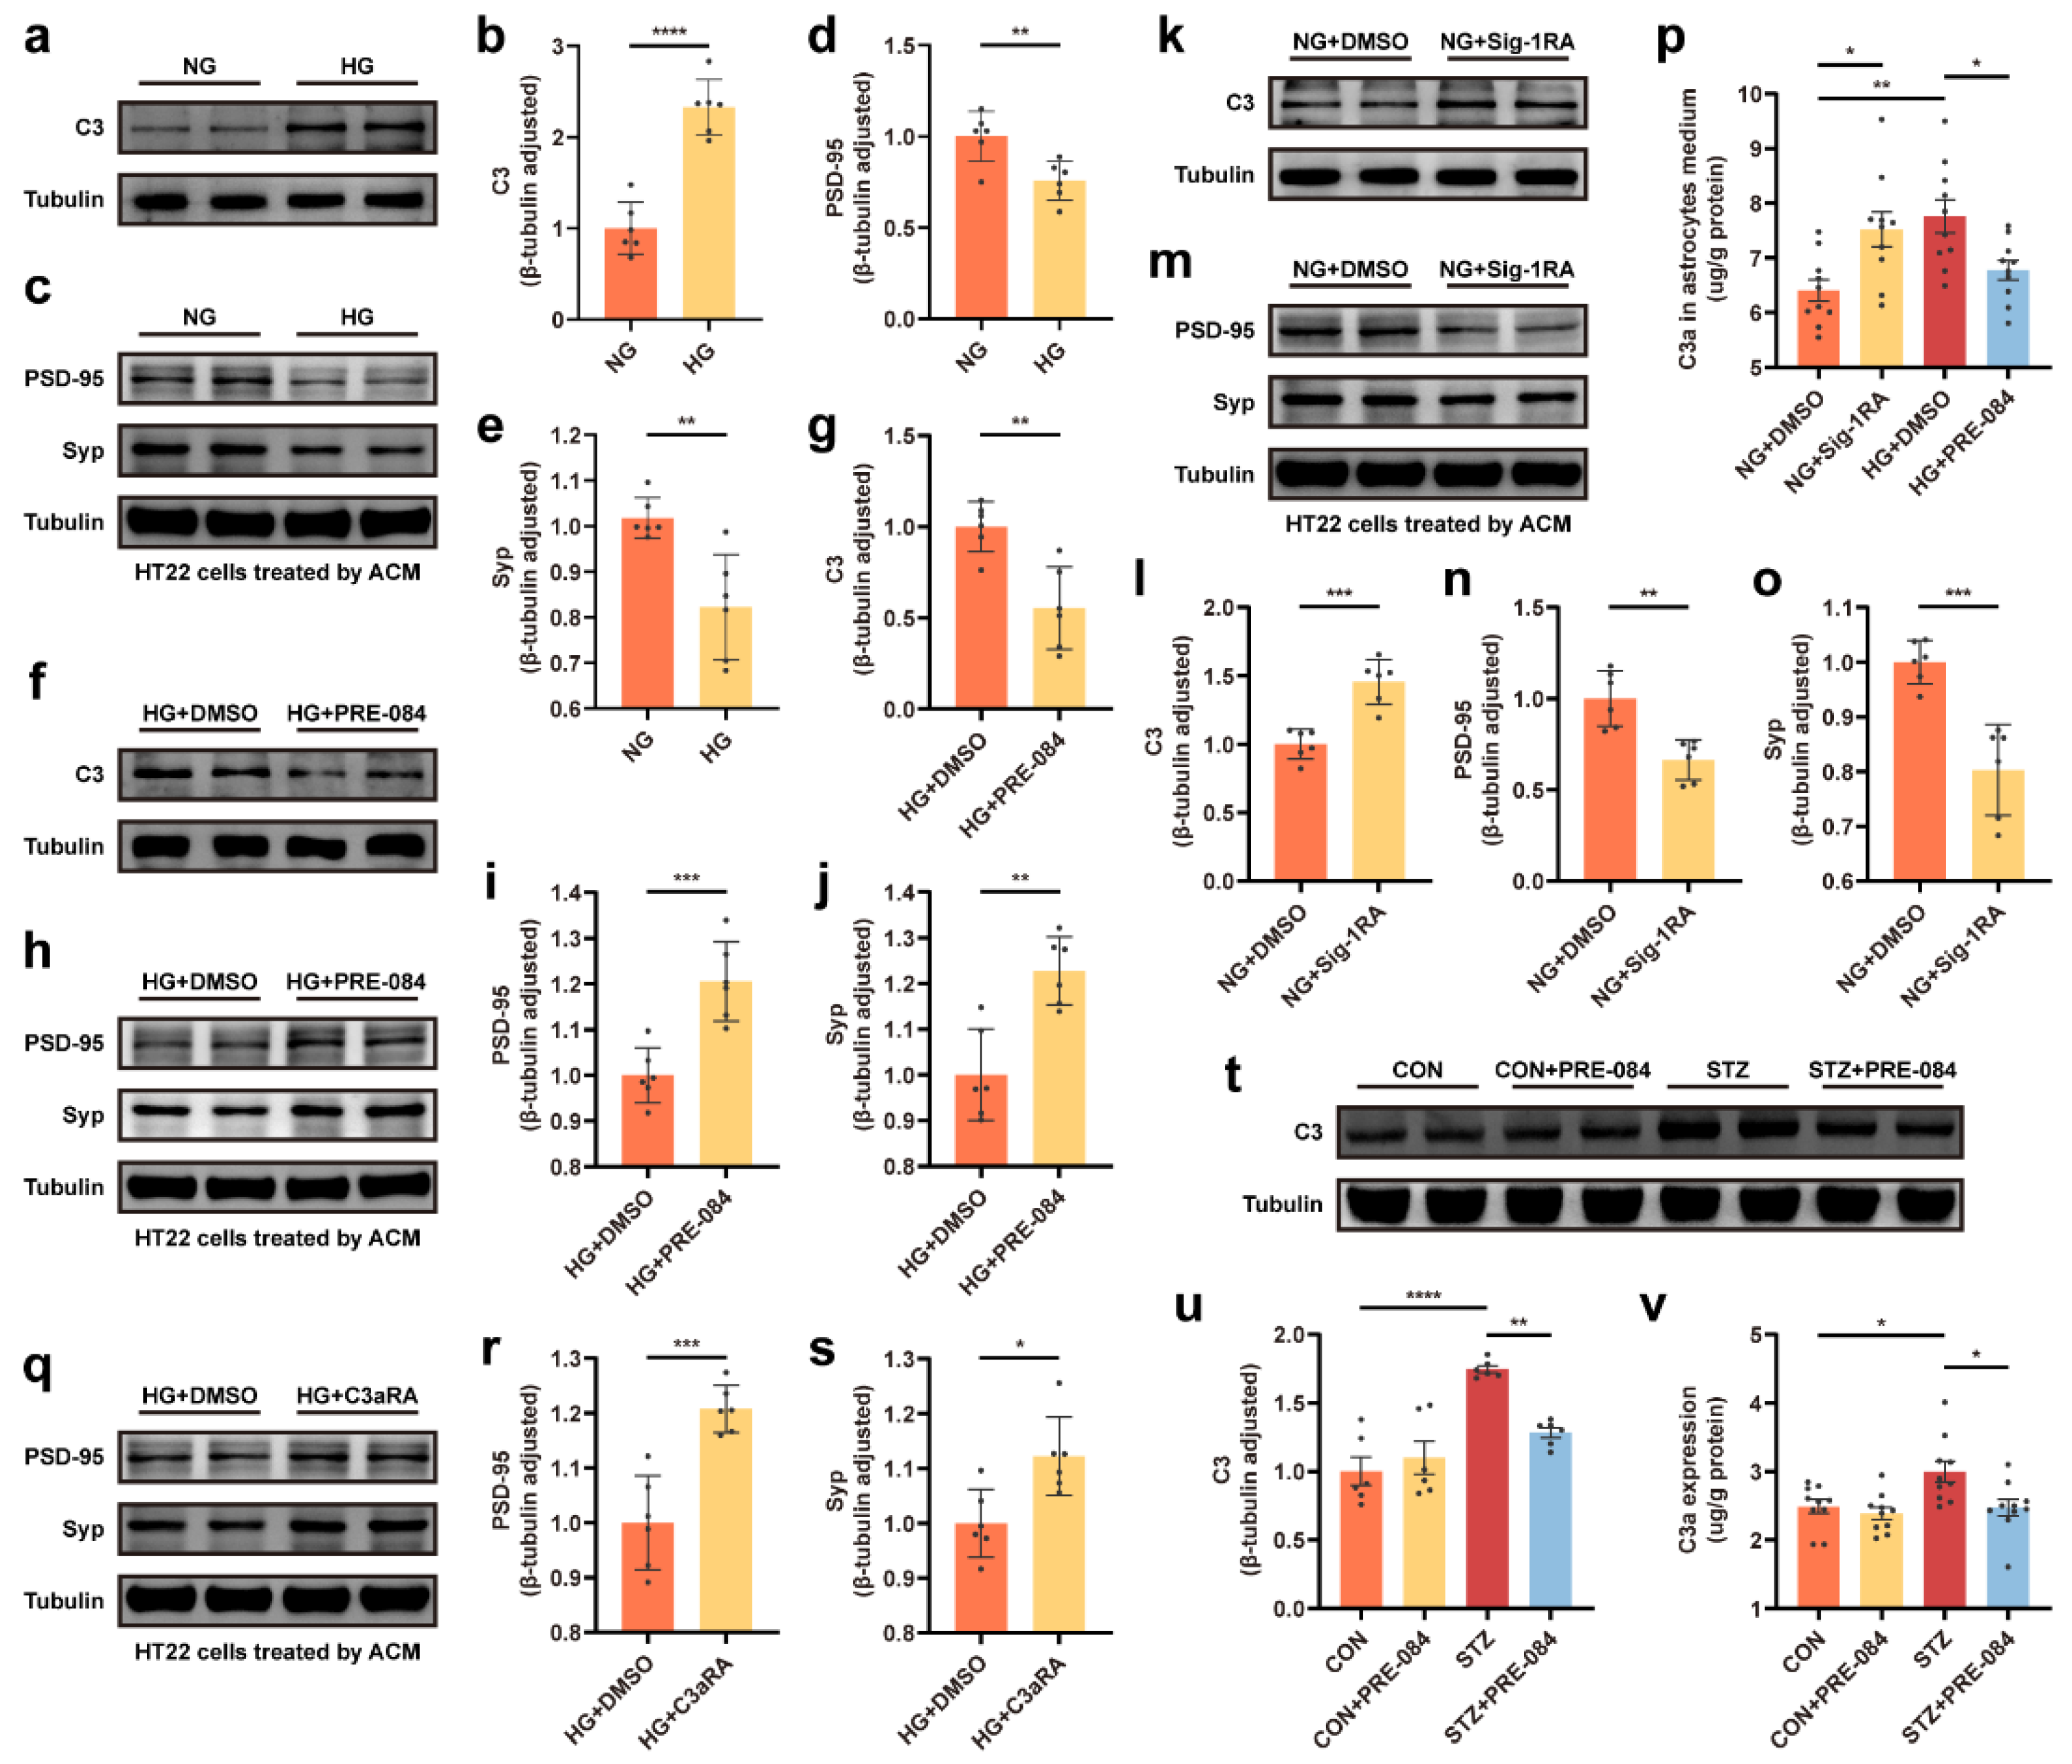
3.4. Sig-1R Regulation of C3/C3a Secretion Was Required for Controlled Synaptic Protein Loss
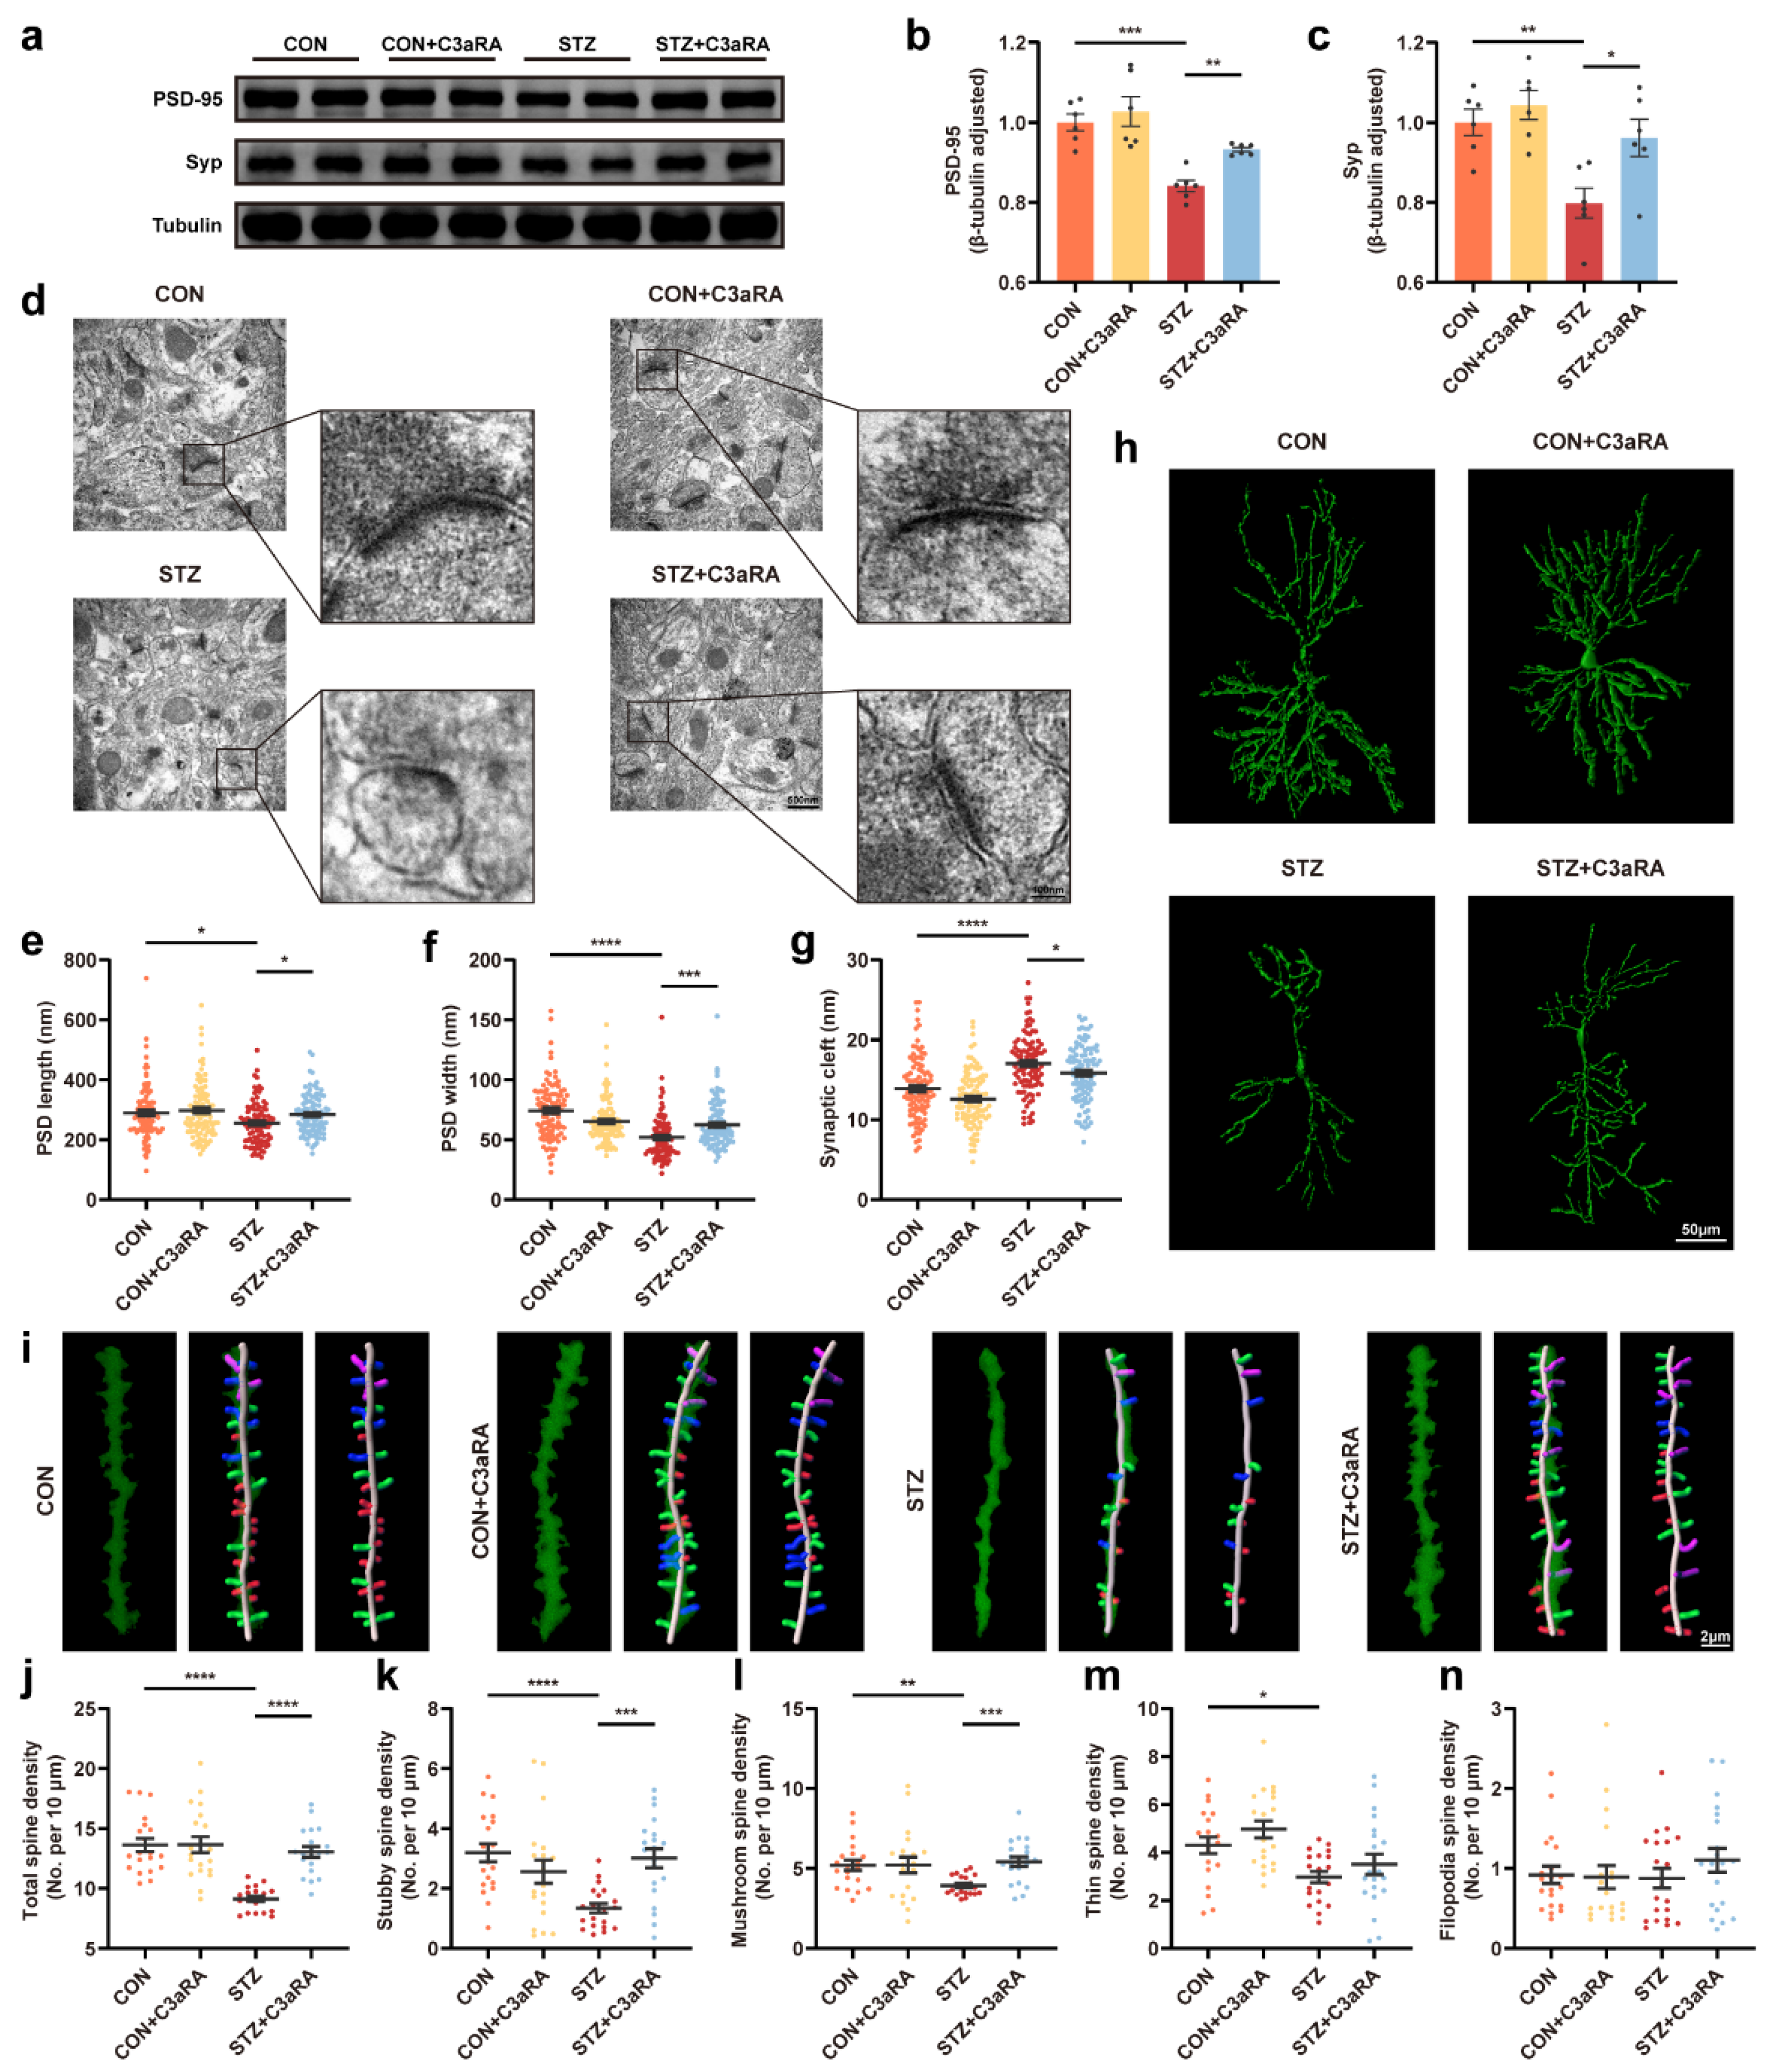
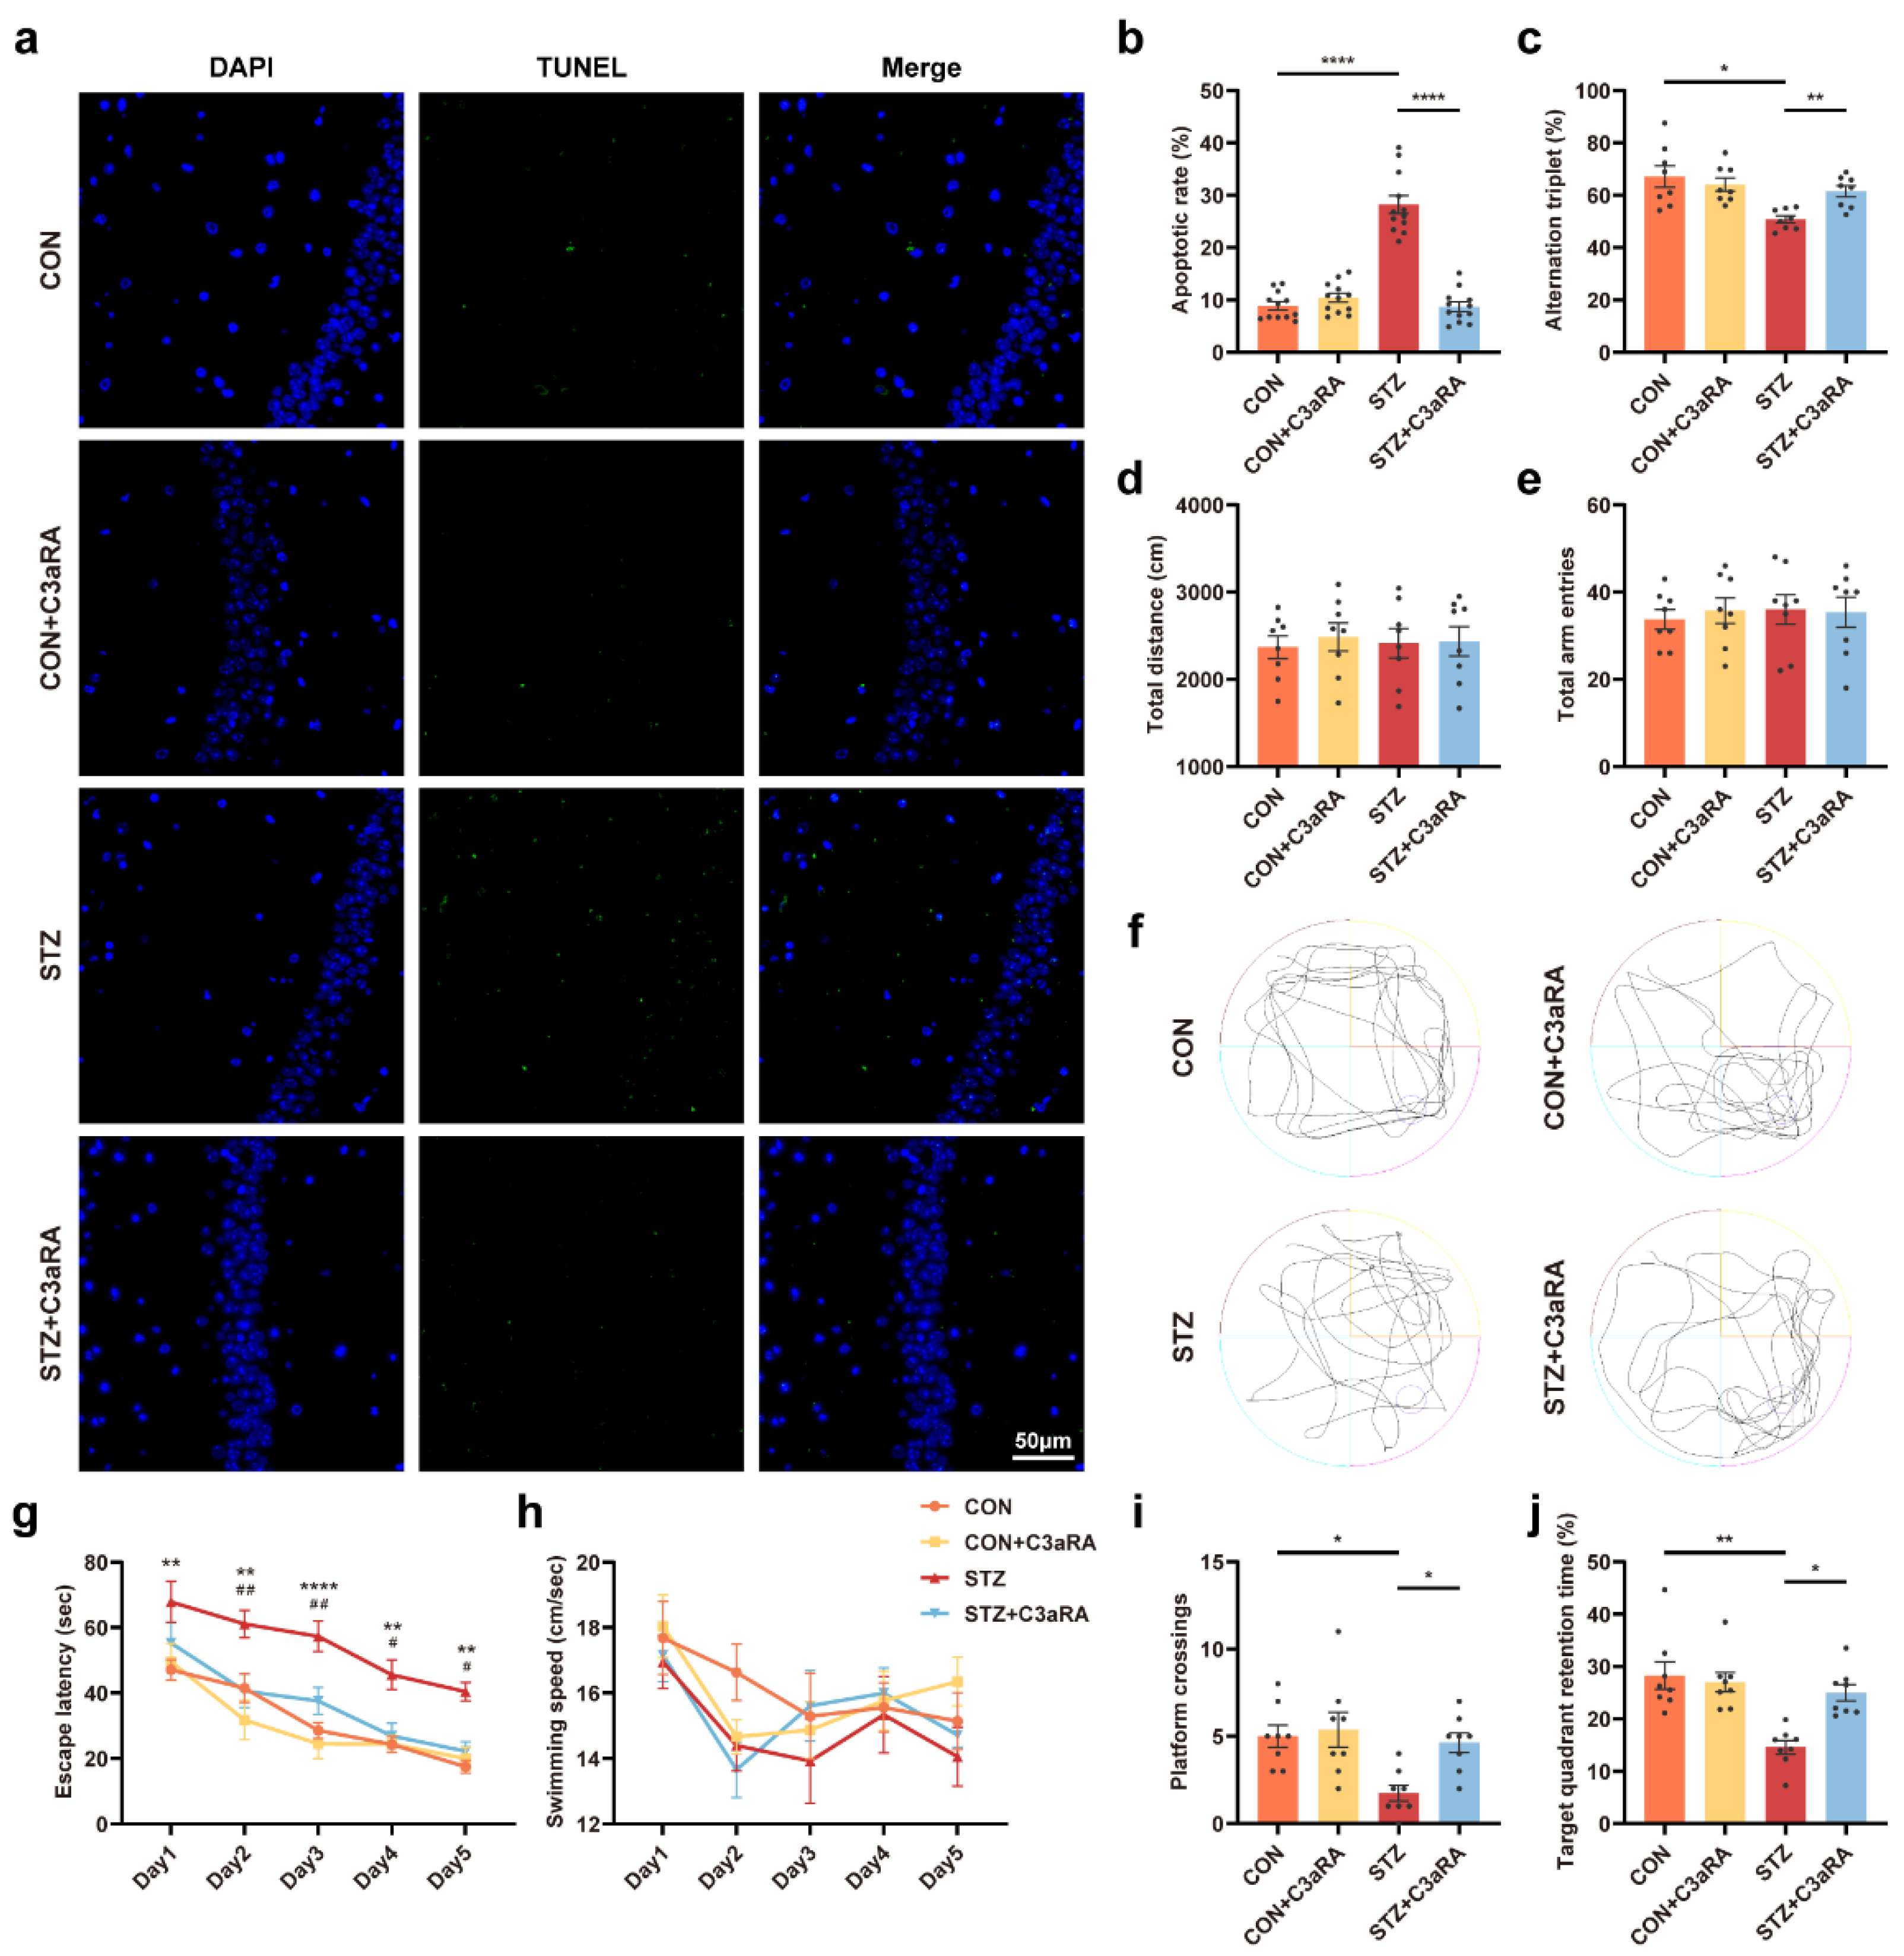
3.5. The C3aR Antagonist Improved Synaptic Damage and Cognitive Impairment in Mice with T1DM
4. Discussion
Supplementary Materials
Author Contributions
Funding
Institutional Review Board Statement
Informed Consent Statement
Data Availability Statement
Acknowledgments
Conflicts of Interest
References
- Gao, Y.; Xiao, Y.; Miao, R.; Zhao, J.; Cui, M.; Huang, G.; Fei, M. The prevalence of mild cognitive impairment with type 2 diabetes mellitus among elderly people in China: A cross-sectional study. Arch. Gerontol. Geriatr. 2016, 62, 138–142. [Google Scholar] [CrossRef] [PubMed]
- Pearson-Stuttard, J.; Bennett, J.; Cheng, Y.J.; Vamos, E.P.; Cross, A.J.; Ezzati, M.; Gregg, E.W. Trends in predominant causes of death in individuals with and without diabetes in England from 2001 to 2018: An epidemiological analysis of linked primary care records. Lancet Diabetes Endocrinol. 2021, 9, 165–173. [Google Scholar] [CrossRef] [PubMed]
- Liu, C.; Yuan, Y.C.; Guo, M.N.; Xin, Z.; Chen, G.J.; Bentley, A.R.; Hua, L.; Zheng, J.P.; Ekoru, K.; Yang, J.K. Incidence of Type 1 Diabetes May Be Underestimated in the Chinese Population: Evidence From 21.7 Million People Between 2007 and 2017. Diabetes Care 2021, 44, 2503–2509. [Google Scholar] [CrossRef] [PubMed]
- Smolina, K.; Wotton, C.J.; Goldacre, M.J. Risk of dementia in patients hospitalised with type 1 and type 2 diabetes in England, 1998-2011: A retrospective national record linkage cohort study. Diabetologia 2015, 58, 942–950. [Google Scholar] [CrossRef] [PubMed] [Green Version]
- Hetz, C.; Saxena, S. ER stress and the unfolded protein response in neurodegeneration. Nat. Rev. Neurol. 2017, 13, 477–491. [Google Scholar] [CrossRef] [PubMed]
- Hetz, C.; Mollereau, B. Disturbance of endoplasmic reticulum proteostasis in neurodegenerative diseases. Nat. Rev. Neurosci. 2014, 15, 233–249. [Google Scholar] [CrossRef] [PubMed]
- Hotamisligil, G.S. Endoplasmic reticulum stress and the inflammatory basis of metabolic disease. Cell 2010, 140, 900–917. [Google Scholar] [CrossRef] [Green Version]
- Wu, N.H.; Ye, Y.; Wan, B.B.; Yu, Y.D.; Liu, C.; Chen, Q.J. Emerging Benefits: Pathophysiological Functions and Target Drugs of the Sigma-1 Receptor in Neurodegenerative Diseases. Mol. Neurobiol. 2021, 58, 5649–5666. [Google Scholar] [CrossRef] [PubMed]
- Zhemkov, V.; Geva, M.; Hayden, M.R.; Bezprozvanny, I. Sigma-1 Receptor (S1R) Interaction with Cholesterol: Mechanisms of S1R Activation and Its Role in Neurodegenerative Diseases. Int. J. Mol. Sci. 2021, 22, 4082. [Google Scholar] [CrossRef]
- Penke, B.; Fulop, L.; Szucs, M.; Frecska, E. The Role of Sigma-1 Receptor, an Intracellular Chaperone in Neurodegenerative Diseases. Curr. Neuropharmacol. 2018, 16, 97–116. [Google Scholar] [CrossRef]
- Jia, J.; Cheng, J.; Wang, C.; Zhen, X. Sigma-1 Receptor-Modulated Neuroinflammation in Neurological Diseases. Front. Cell. Neurosci. 2018, 12, 314. [Google Scholar] [CrossRef] [PubMed] [Green Version]
- Tsai, S.Y.; Pokrass, M.J.; Klauer, N.R.; De Credico, N.E.; Su, T.P. Sigma-1 receptor chaperones in neurodegenerative and psychiatric disorders. Expert Opin. Ther. Targets 2014, 18, 1461–1476. [Google Scholar] [CrossRef] [PubMed] [Green Version]
- Ajmo, C.T., Jr.; Vernon, D.O.; Collier, L.; Pennypacker, K.R.; Cuevas, J. Sigma receptor activation reduces infarct size at 24 hours after permanent middle cerebral artery occlusion in rats. Curr. Neurovasc. Res. 2006, 3, 89–98. [Google Scholar] [CrossRef] [PubMed]
- Peviani, M.; Salvaneschi, E.; Bontempi, L.; Petese, A.; Manzo, A.; Rossi, D.; Salmona, M.; Collina, S.; Bigini, P.; Curti, D. Neuroprotective effects of the Sigma-1 receptor (S1R) agonist PRE-084, in a mouse model of motor neuron disease not linked to SOD1 mutation. Neurobiol. Dis. 2014, 62, 218–232. [Google Scholar] [CrossRef] [PubMed]
- Engström, G.; Hedblad, B.; Eriksson, K.F.; Janzon, L.; Lindgärde, F. Complement C3 is a risk factor for the development of diabetes: A population-based cohort study. Diabetes 2005, 54, 570–575. [Google Scholar] [CrossRef] [PubMed] [Green Version]
- Borné, Y.; Muhammad, I.F.; Lorés-Motta, L.; Hedblad, B.; Nilsson, P.M.; Melander, O.; de Jong, E.K.; Blom, A.M.; den Hollander, A.I.; Engström, G. Complement C3 Associates With Incidence of Diabetes, but No Evidence of a Causal Relationship. J. Clin. Endocrinol. Metab. 2017, 102, 4477–4485. [Google Scholar] [CrossRef] [Green Version]
- Biessels, G.J.; Nobili, F.; Teunissen, C.E.; Simó, R.; Scheltens, P. Understanding multifactorial brain changes in type 2 diabetes: A biomarker perspective. Lancet Neurol. 2020, 19, 699–710. [Google Scholar] [CrossRef]
- Litvinchuk, A.; Wan, Y.W.; Swartzlander, D.B.; Chen, F.; Cole, A.; Propson, N.E.; Wang, Q.; Zhang, B.; Liu, Z.; Zheng, H. Complement C3aR Inactivation Attenuates Tau Pathology and Reverses an Immune Network Deregulated in Tauopathy Models and Alzheimer’s Disease. Neuron 2018, 100, 1337–1353.e1335. [Google Scholar] [CrossRef]
- Lian, H.; Litvinchuk, A.; Chiang, A.C.; Aithmitti, N.; Jankowsky, J.L.; Zheng, H. Astrocyte-Microglia Cross Talk through Complement Activation Modulates Amyloid Pathology in Mouse Models of Alzheimer’s Disease. J. Neurosci. 2016, 36, 577–589. [Google Scholar] [CrossRef] [Green Version]
- Sun, W.; Li, H.; Gu, J. Up-regulation of microRNA-574 attenuates lipopolysaccharide- or cecal ligation and puncture-induced sepsis associated with acute lung injury. Cell Biochem. Funct. 2020, 38, 847–858. [Google Scholar] [CrossRef]
- Wang, X.; Xin, H.; Xing, M.; Gu, X.; Hao, Y. Acute Endoplasmic Reticulum Stress Induces Inflammation Reaction, Complement System Activation, and Lipid Metabolism Disorder of Piglet Livers: A Proteomic Approach. Front. Physiol. 2022, 13, 857853. [Google Scholar] [CrossRef]
- Propson, N.E.; Gedam, M.; Zheng, H. Complement in Neurologic Disease. Annu. Rev. Pathol. 2021, 16, 277–298. [Google Scholar] [CrossRef]
- Lian, H.; Yang, L.; Cole, A.; Sun, L.; Chiang, A.C.; Fowler, S.W.; Shim, D.J.; Rodriguez-Rivera, J.; Taglialatela, G.; Jankowsky, J.L.; et al. NFκB-activated astroglial release of complement C3 compromises neuronal morphology and function associated with Alzheimer’s disease. Neuron 2015, 85, 101–115. [Google Scholar] [CrossRef] [PubMed] [Green Version]
- Zhao, Y.; Luo, C.; Chen, J.; Sun, Y.; Pu, D.; Lv, A.; Zhu, S.; Wu, J.; Wang, M.; Zhou, J.; et al. High glucose-induced complement component 3 up-regulation via RAGE-p38MAPK-NF-κB signalling in astrocytes: In vivo and in vitro studies. J. Cell. Mol. Med. 2018, 22, 6087–6098. [Google Scholar] [CrossRef] [Green Version]
- Shi, Q.; Colodner, K.J.; Matousek, S.B.; Merry, K.; Hong, S.; Kenison, J.E.; Frost, J.L.; Le, K.X.; Li, S.; Dodart, J.C.; et al. Complement C3-Deficient Mice Fail to Display Age-Related Hippocampal Decline. J. Neurosci. 2015, 35, 13029–13042. [Google Scholar] [CrossRef] [PubMed] [Green Version]
- Liddelow, S.A.; Guttenplan, K.A.; Clarke, L.E.; Bennett, F.C.; Bohlen, C.J.; Schirmer, L.; Bennett, M.L.; Münch, A.E.; Chung, W.S.; Peterson, T.C.; et al. Neurotoxic reactive astrocytes are induced by activated microglia. Nature 2017, 541, 481–487. [Google Scholar] [CrossRef] [PubMed] [Green Version]
- Wu, T.; Dejanovic, B.; Gandham, V.D.; Gogineni, A.; Edmonds, R.; Schauer, S.; Srinivasan, K.; Huntley, M.A.; Wang, Y.; Wang, T.M.; et al. Complement C3 Is Activated in Human AD Brain and Is Required for Neurodegeneration in Mouse Models of Amyloidosis and Tauopathy. Cell Rep. 2019, 28, 2111–2123.e2116. [Google Scholar] [CrossRef] [Green Version]
- Shi, Q.; Chowdhury, S.; Ma, R.; Le, K.X.; Hong, S.; Caldarone, B.J.; Stevens, B.; Lemere, C.A. Complement C3 deficiency protects against neurodegeneration in aged plaque-rich APP/PS1 mice. Sci. Transl. Med. 2017, 9, eaaf6295. [Google Scholar] [CrossRef] [Green Version]
- Rom, S.; Zuluaga-Ramirez, V.; Gajghate, S.; Seliga, A.; Winfield, M.; Heldt, N.A.; Kolpakov, M.A.; Bashkirova, Y.V.; Sabri, A.K.; Persidsky, Y. Hyperglycemia-Driven Neuroinflammation Compromises BBB Leading to Memory Loss in Both Diabetes Mellitus (DM) Type 1 and Type 2 Mouse Models. Mol. Neurobiol. 2019, 56, 1883–1896. [Google Scholar] [CrossRef]
- Watanabe, S.; Ilieva, H.; Tamada, H.; Nomura, H.; Komine, O.; Endo, F.; Jin, S.; Mancias, P.; Kiyama, H.; Yamanaka, K. Mitochondria-associated membrane collapse is a common pathomechanism in SIGMAR1- and SOD1-linked ALS. EMBO Mol. Med. 2016, 8, 1421–1437. [Google Scholar] [CrossRef]
- Stoica, R.; De Vos, K.J.; Paillusson, S.; Mueller, S.; Sancho, R.M.; Lau, K.F.; Vizcay-Barrena, G.; Lin, W.L.; Xu, Y.F.; Lewis, J.; et al. ER-mitochondria associations are regulated by the VAPB-PTPIP51 interaction and are disrupted by ALS/FTD-associated TDP-43. Nat. Commun. 2014, 5, 3996. [Google Scholar] [CrossRef] [Green Version]
- Spat, A.; Szanda, G.; Csordas, G.; Hajnoczky, G. High- and low-calcium-dependent mechanisms of mitochondrial calcium signalling. Cell Calcium 2008, 44, 51–63. [Google Scholar] [CrossRef] [PubMed] [Green Version]
- Li, Z.Z.; Han, W.J.; Sun, Z.C.; Chen, Y.; Sun, J.Y.; Cai, G.H.; Liu, W.N.; Wang, T.Z.; Xie, Y.D.; Mao, H.H.; et al. Extracellular matrix protein laminin β1 regulates pain sensitivity and anxiodepression-like behaviors in mice. J. Clin. Investig. 2021, 131, e146323. [Google Scholar] [CrossRef] [PubMed]
- Arruda, A.P.; Pers, B.M.; Parlakgul, G.; Guney, E.; Inouye, K.; Hotamisligil, G.S. Chronic enrichment of hepatic endoplasmic reticulum-mitochondria contact leads to mitochondrial dysfunction in obesity. Nat. Med. 2014, 20, 1427–1435. [Google Scholar] [CrossRef] [PubMed] [Green Version]
- Wu, S.; Lu, Q.; Ding, Y.; Wu, Y.; Qiu, Y.; Wang, P.; Mao, X.; Huang, K.; Xie, Z.; Zou, M.H. Hyperglycemia-Driven Inhibition of AMP-Activated Protein Kinase alpha2 Induces Diabetic Cardiomyopathy by Promoting Mitochondria-Associated Endoplasmic Reticulum Membranes In Vivo. Circulation 2019, 139, 1913–1936. [Google Scholar] [CrossRef]
- Zhao, L.; Lu, T.; Gao, L.; Fu, X.; Zhu, S.; Hou, Y. Enriched endoplasmic reticulum-mitochondria interactions result in mitochondrial dysfunction and apoptosis in oocytes from obese mice. J. Anim. Sci. Biotechnol. 2017, 8, 62. [Google Scholar] [CrossRef]
- Zhemkov, V.; Ditlev, J.A.; Lee, W.R.; Wilson, M.; Liou, J.; Rosen, M.K.; Bezprozvanny, I. The role of sigma 1 receptor in organization of endoplasmic reticulum signaling microdomains. eLife 2021, 10, e65192. [Google Scholar] [CrossRef]
- Delprat, B.; Crouzier, L.; Su, T.P.; Maurice, T. At the Crossing of ER Stress and MAMs: A Key Role of Sigma-1 Receptor? Adv. Exp. Med. Biol. 2020, 1131, 699–718. [Google Scholar] [CrossRef]
- Vallese, F.; Barazzuol, L.; Maso, L.; Brini, M.; Calì, T. ER-Mitochondria Calcium Transfer, Organelle Contacts and Neurodegenerative Diseases. Adv. Exp. Med. Biol. 2020, 1131, 719–746. [Google Scholar] [CrossRef]
- Liu, Q.; Guo, Q.; Fang, L.P.; Yao, H.; Scheller, A.; Kirchhoff, F.; Huang, W. Specific detection and deletion of the sigma-1 receptor widely expressed in neurons and glial cells in vivo. J. Neurochem. 2022; early view. [Google Scholar] [CrossRef]
- Maurice, T.; Volle, J.N.; Strehaiano, M.; Crouzier, L.; Pereira, C.; Kaloyanov, N.; Virieux, D.; Pirat, J.L. Neuroprotection in non-transgenic and transgenic mouse models of Alzheimer’s disease by positive modulation of σ(1) receptors. Pharmacol. Res. 2019, 144, 315–330. [Google Scholar] [CrossRef]
- Weng, T.Y.; Hung, D.T.; Su, T.P.; Tsai, S.A. Loss of Sigma-1 Receptor Chaperone Promotes Astrocytosis and Enhances the Nrf2 Antioxidant Defense. Oxid. Med. Cell. Longev. 2017, 2017, 4582135. [Google Scholar] [CrossRef] [PubMed] [Green Version]
- Hong, J.; Sha, S.; Zhou, L.; Wang, C.; Yin, J.; Chen, L. Sigma-1 receptor deficiency reduces MPTP-induced parkinsonism and death of dopaminergic neurons. Cell Death Dis. 2015, 6, e1832. [Google Scholar] [CrossRef]
- Zhang, Y.; Lv, X.; Bai, Y.; Zhu, X.; Wu, X.; Chao, J.; Duan, M.; Buch, S.; Chen, L.; Yao, H. Involvement of sigma-1 receptor in astrocyte activation induced by methamphetamine via up-regulation of its own expression. J. Neuroinflamm. 2015, 12, 29. [Google Scholar] [CrossRef] [PubMed] [Green Version]
- Mishina, M.; Ohyama, M.; Ishii, K.; Kitamura, S.; Kimura, Y.; Oda, K.; Kawamura, K.; Sasaki, T.; Kobayashi, S.; Katayama, Y.; et al. Low density of sigma1 receptors in early Alzheimer’s disease. Ann. Nucl. Med. 2008, 22, 151–156. [Google Scholar] [CrossRef] [PubMed]
- Hedskog, L.; Pinho, C.M.; Filadi, R.; Rönnbäck, A.; Hertwig, L.; Wiehager, B.; Larssen, P.; Gellhaar, S.; Sandebring, A.; Westerlund, M.; et al. Modulation of the endoplasmic reticulum-mitochondria interface in Alzheimer’s disease and related models. Proc. Natl. Acad. Sci. USA 2013, 110, 7916–7921. [Google Scholar] [CrossRef] [Green Version]
- Mishina, M.; Ishiwata, K.; Ishii, K.; Kitamura, S.; Kimura, Y.; Kawamura, K.; Oda, K.; Sasaki, T.; Sakayori, O.; Hamamoto, M.; et al. Function of sigma1 receptors in Parkinson’s disease. Acta Neurol. Scand. 2005, 112, 103–107. [Google Scholar] [CrossRef] [PubMed]
- Hong, J.; Wang, L.; Zhang, T.; Zhang, B.; Chen, L. Sigma-1 receptor knockout increases α-synuclein aggregation and phosphorylation with loss of dopaminergic neurons in substantia nigra. Neurobiol. Aging 2017, 59, 171–183. [Google Scholar] [CrossRef]
- Maurice, T.; Strehaiano, M.; Duhr, F.; Chevallier, N. Amyloid toxicity is enhanced after pharmacological or genetic invalidation of the σ(1) receptor. Behav. Brain Res. 2018, 339, 1–10. [Google Scholar] [CrossRef]
- Francardo, V.; Bez, F.; Wieloch, T.; Nissbrandt, H.; Ruscher, K.; Cenci, M.A. Pharmacological stimulation of sigma-1 receptors has neurorestorative effects in experimental parkinsonism. Brain 2014, 137, 1998–2014. [Google Scholar] [CrossRef]
- Lahmy, V.; Meunier, J.; Malmström, S.; Naert, G.; Givalois, L.; Kim, S.H.; Villard, V.; Vamvakides, A.; Maurice, T. Blockade of Tau hyperphosphorylation and Aβ1–42 generation by the aminotetrahydrofuran derivative ANAVEX2-73, a mixed muscarinic and σ₁ receptor agonist, in a nontransgenic mouse model of Alzheimer’s disease. Neuropsychopharmacology 2013, 38, 1706–1723. [Google Scholar] [CrossRef] [PubMed]
- Meunier, J.; Ieni, J.; Maurice, T. The anti-amnesic and neuroprotective effects of donepezil against amyloid beta25-35 peptide-induced toxicity in mice involve an interaction with the sigma1 receptor. Br. J. Pharmacol. 2006, 149, 998–1012. [Google Scholar] [CrossRef] [PubMed] [Green Version]
- Villard, V.; Espallergues, J.; Keller, E.; Alkam, T.; Nitta, A.; Yamada, K.; Nabeshima, T.; Vamvakides, A.; Maurice, T. Antiamnesic and neuroprotective effects of the aminotetrahydrofuran derivative ANAVEX1-41 against amyloid beta(25-35)-induced toxicity in mice. Neuropsychopharmacology 2009, 34, 1552–1566. [Google Scholar] [CrossRef] [PubMed] [Green Version]
- Yang, R.; Chen, L.; Wang, H.; Xu, B.; Tomimoto, H.; Chen, L. Anti-amnesic effect of neurosteroid PREGS in Aβ25-35-injected mice through σ1 receptor- and α7nAChR-mediated neuroprotection. Neuropharmacology 2012, 63, 1042–1050. [Google Scholar] [CrossRef] [PubMed]
- Behensky, A.A.; Yasny, I.E.; Shuster, A.M.; Seredenin, S.B.; Petrov, A.V.; Cuevas, J. Afobazole activation of σ-1 receptors modulates neuronal responses to amyloid-β25-35. J. Pharmacol. Exp. Ther. 2013, 347, 468–477. [Google Scholar] [CrossRef]
- Marrazzo, A.; Caraci, F.; Salinaro, E.T.; Su, T.P.; Copani, A.; Ronsisvalle, G. Neuroprotective effects of sigma-1 receptor agonists against beta-amyloid-induced toxicity. Neuroreport 2005, 16, 1223–1226. [Google Scholar] [CrossRef]
- Kim, W.S.; Fu, Y.; Dobson-Stone, C.; Hsiao, J.T.; Shang, K.; Hallupp, M.; Schofield, P.R.; Garner, B.; Karl, T.; Kwok, J.B.J. Effect of Fluvoxamine on Amyloid-β Peptide Generation and Memory. J. Alzheimers Dis. 2018, 62, 1777–1787. [Google Scholar] [CrossRef]
- Ryskamp, D.; Wu, L.; Wu, J.; Kim, D.; Rammes, G.; Geva, M.; Hayden, M.; Bezprozvanny, I. Pridopidine stabilizes mushroom spines in mouse models of Alzheimer’s disease by acting on the sigma-1 receptor. Neurobiol. Dis. 2019, 124, 489–504. [Google Scholar] [CrossRef]
- Salminen, A.; Kaarniranta, K.; Kauppinen, A. ER stress activates immunosuppressive network: Implications for aging and Alzheimer’s disease. J. Mol. Med. 2020, 98, 633–650. [Google Scholar] [CrossRef] [Green Version]
- Zhao, J.; Veeranan-Karmegam, R.; Baker, F.C.; Mysona, B.A.; Bagchi, P.; Liu, Y.; Smith, S.B.; Gonsalvez, G.B.; Bollinger, K.E. Defining the Ligand-dependent Interactome of the Sigma 1 Receptor. bioRxiv 2022. [Google Scholar] [CrossRef]
- Berry, K.P.; Nedivi, E. Spine Dynamics: Are They All the Same? Neuron 2017, 96, 43–55. [Google Scholar] [CrossRef] [PubMed] [Green Version]
- Albayrak, Y.; Hashimoto, K. Sigma-1 Receptor Agonists and Their Clinical Implications in Neuropsychiatric Disorders. Adv. Exp. Med. Biol. 2017, 964, 153–161. [Google Scholar] [CrossRef] [PubMed]
- Ye, N.; Qin, W.; Tian, S.; Xu, Q.; Wold, E.A.; Zhou, J.; Zhen, X.C. Small Molecules Selectively Targeting Sigma-1 Receptor for the Treatment of Neurological Diseases. J. Med. Chem. 2020, 63, 15187–15217. [Google Scholar] [CrossRef]
- Maurice, T. Bi-phasic dose response in the preclinical and clinical developments of sigma-1 receptor ligands for the treatment of neurodegenerative disorders. Expert Opin. Drug Discov. 2021, 16, 373–389. [Google Scholar] [CrossRef] [PubMed]


Disclaimer/Publisher’s Note: The statements, opinions and data contained in all publications are solely those of the individual author(s) and contributor(s) and not of MDPI and/or the editor(s). MDPI and/or the editor(s) disclaim responsibility for any injury to people or property resulting from any ideas, methods, instructions or products referred to in the content. |
© 2023 by the authors. Licensee MDPI, Basel, Switzerland. This article is an open access article distributed under the terms and conditions of the Creative Commons Attribution (CC BY) license (https://creativecommons.org/licenses/by/4.0/).
Share and Cite
Du, M.; Jiang, T.; He, S.; Cheng, B.; Zhang, X.; Li, L.; Yang, L.; Gao, W.; Li, Y.; Wang, Q. Sigma-1 Receptor as a Protective Factor for Diabetes-Associated Cognitive Dysfunction via Regulating Astrocytic Endoplasmic Reticulum-Mitochondrion Contact and Endoplasmic Reticulum Stress. Cells 2023, 12, 197. https://doi.org/10.3390/cells12010197
Du M, Jiang T, He S, Cheng B, Zhang X, Li L, Yang L, Gao W, Li Y, Wang Q. Sigma-1 Receptor as a Protective Factor for Diabetes-Associated Cognitive Dysfunction via Regulating Astrocytic Endoplasmic Reticulum-Mitochondrion Contact and Endoplasmic Reticulum Stress. Cells. 2023; 12(1):197. https://doi.org/10.3390/cells12010197
Chicago/Turabian StyleDu, Mengyu, Tao Jiang, Shuxuan He, Bo Cheng, Xin Zhang, Liya Li, Lan Yang, Wei Gao, Yansong Li, and Qiang Wang. 2023. "Sigma-1 Receptor as a Protective Factor for Diabetes-Associated Cognitive Dysfunction via Regulating Astrocytic Endoplasmic Reticulum-Mitochondrion Contact and Endoplasmic Reticulum Stress" Cells 12, no. 1: 197. https://doi.org/10.3390/cells12010197