
CBP and p300 Jointly Maintain Neural Progenitor Viability but Play Unique Roles in the Differentiation of Neural Lineages
 , , and
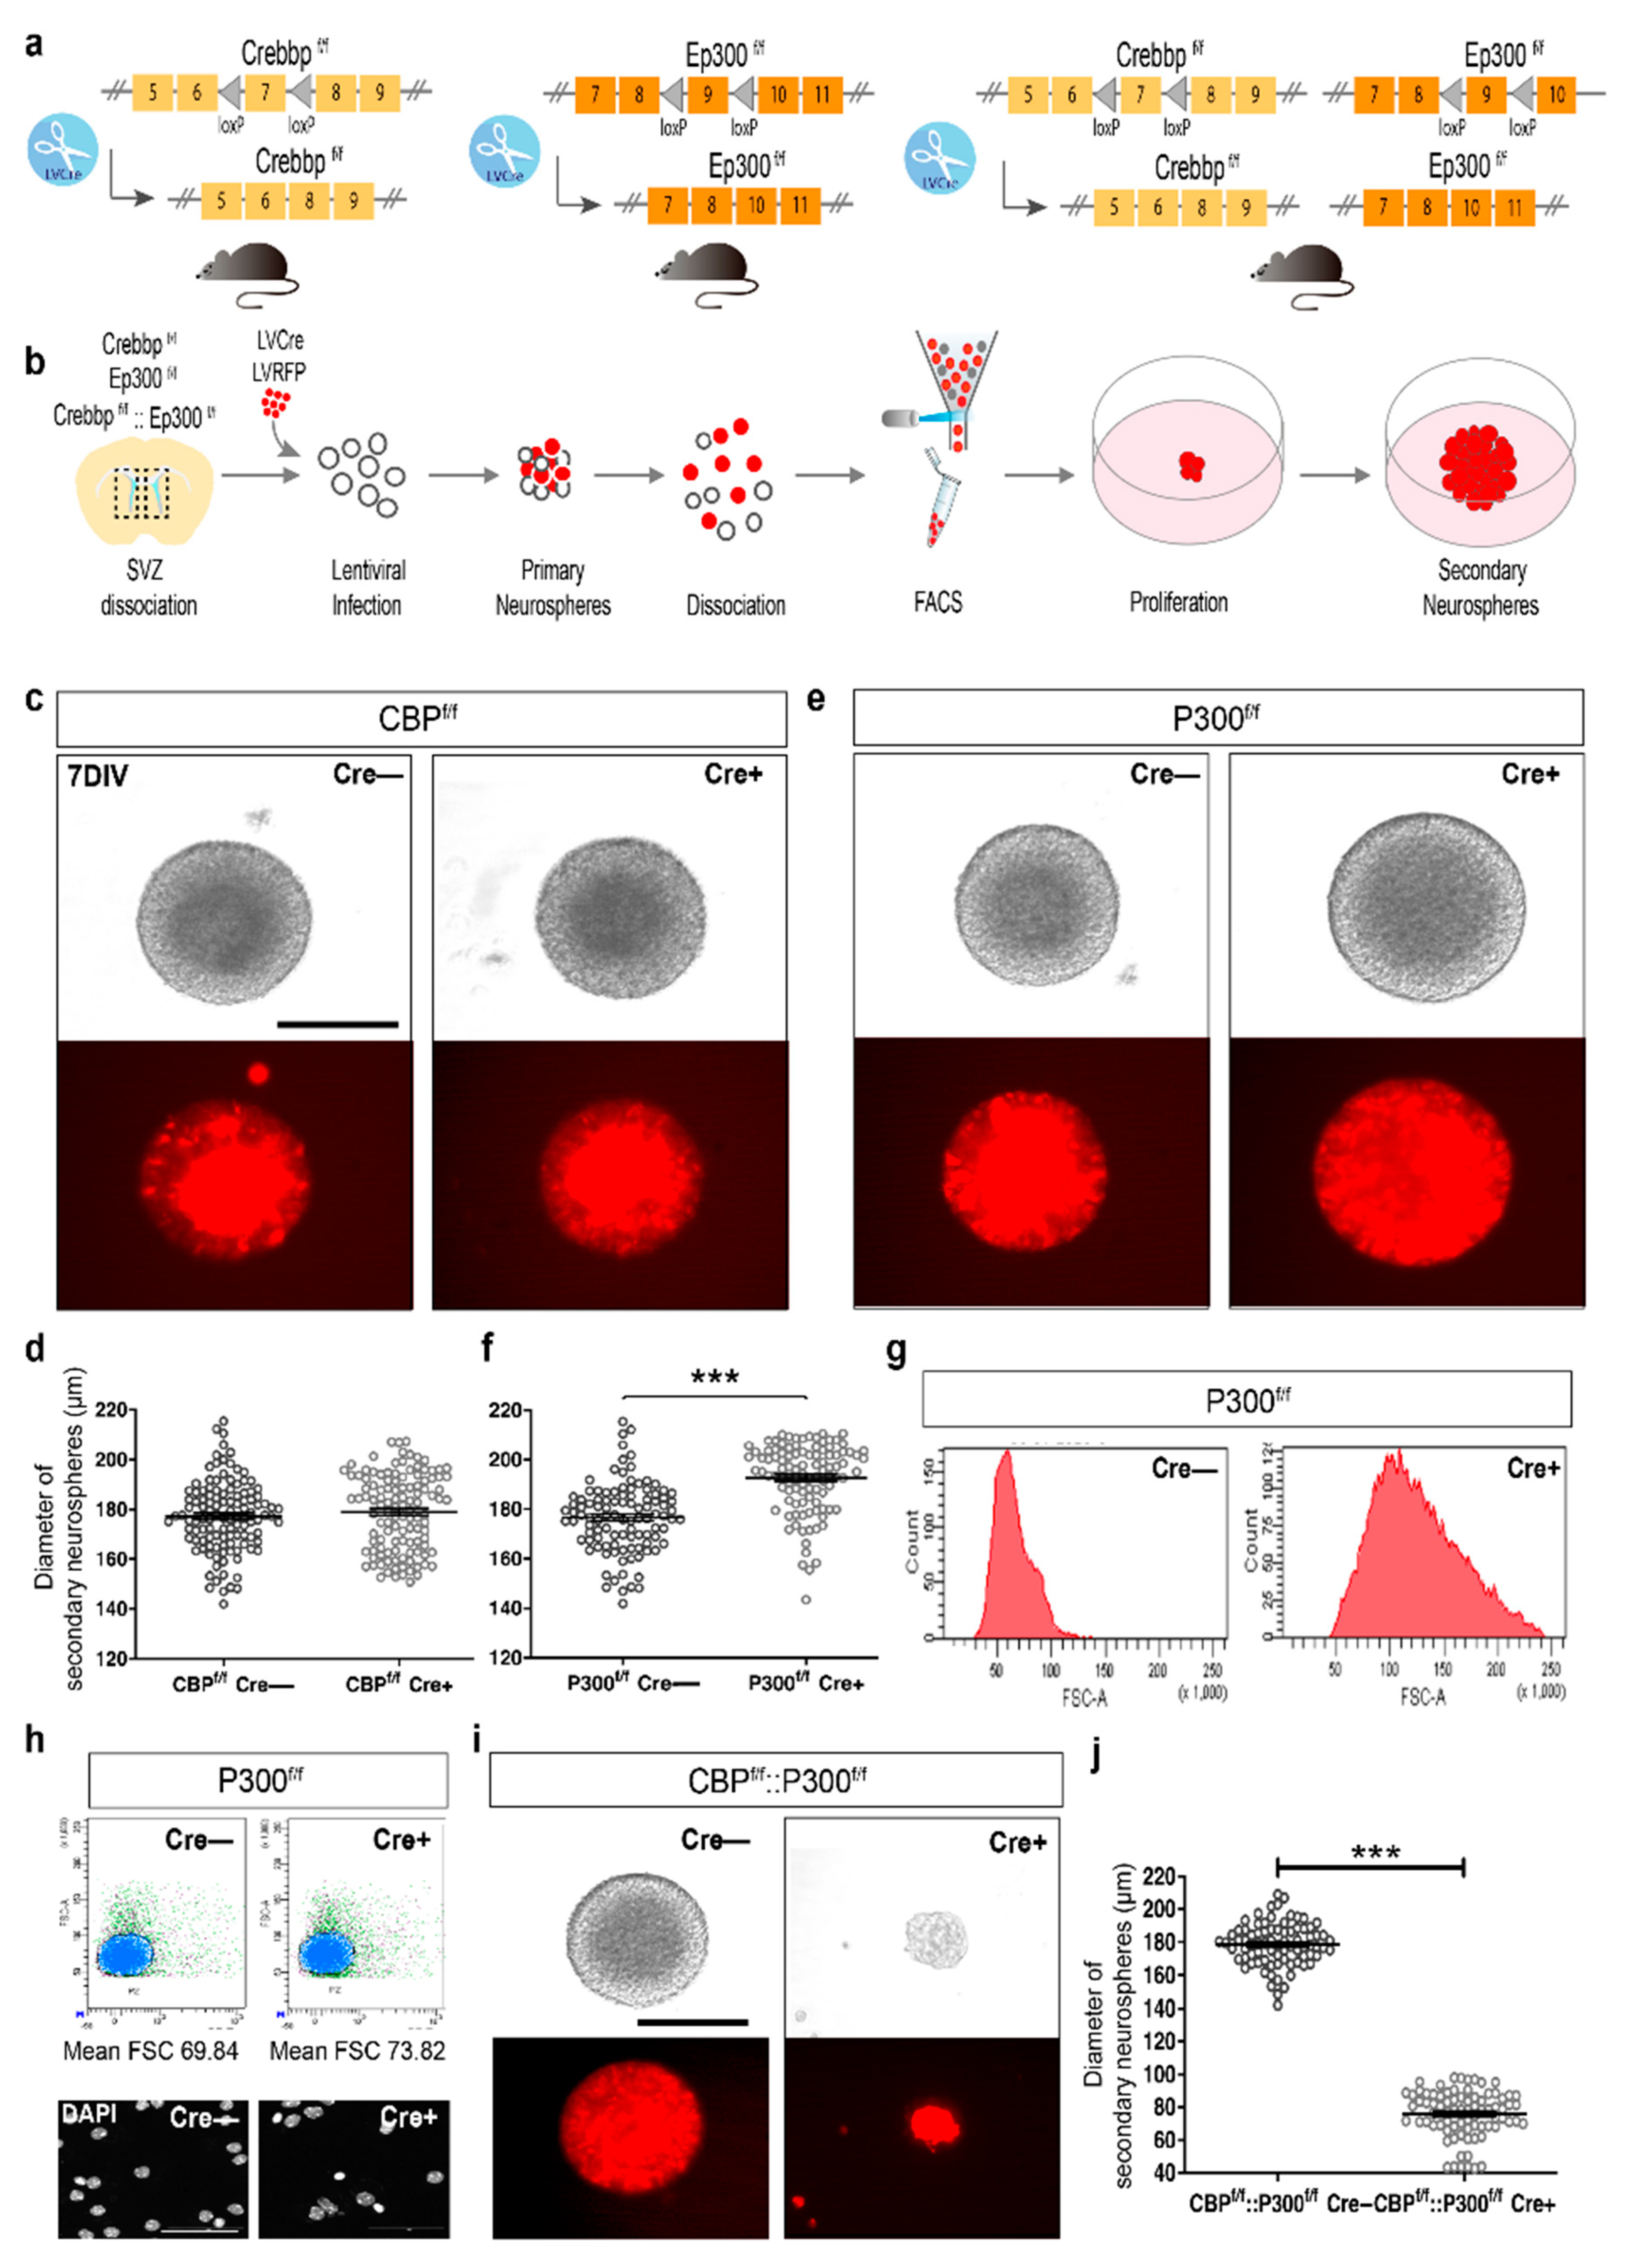
Abstract
:1. Introduction
2. Materials and Methods
2.1. Animals
2.2. Establishment of a Primary Neural Stem Cell (NSC) Culture
2.3. Lentiviral Production and Infection of NSC Cultures
2.4. Clonal Differentiation of Neurospheres
2.5. Immunocytochemistry and Immunohistochemistry
2.6. Image Analysis and Quantification
2.7. Single-Nucleus RNA Sequencing (snRNA-Seq) and Analysis
2.8. Statistical Analyses
3. Results
3.1. NCS Proliferation Is Preserved in the Absence of CBP or p300 but Impaired When Neither KAT3 Protein Is Present
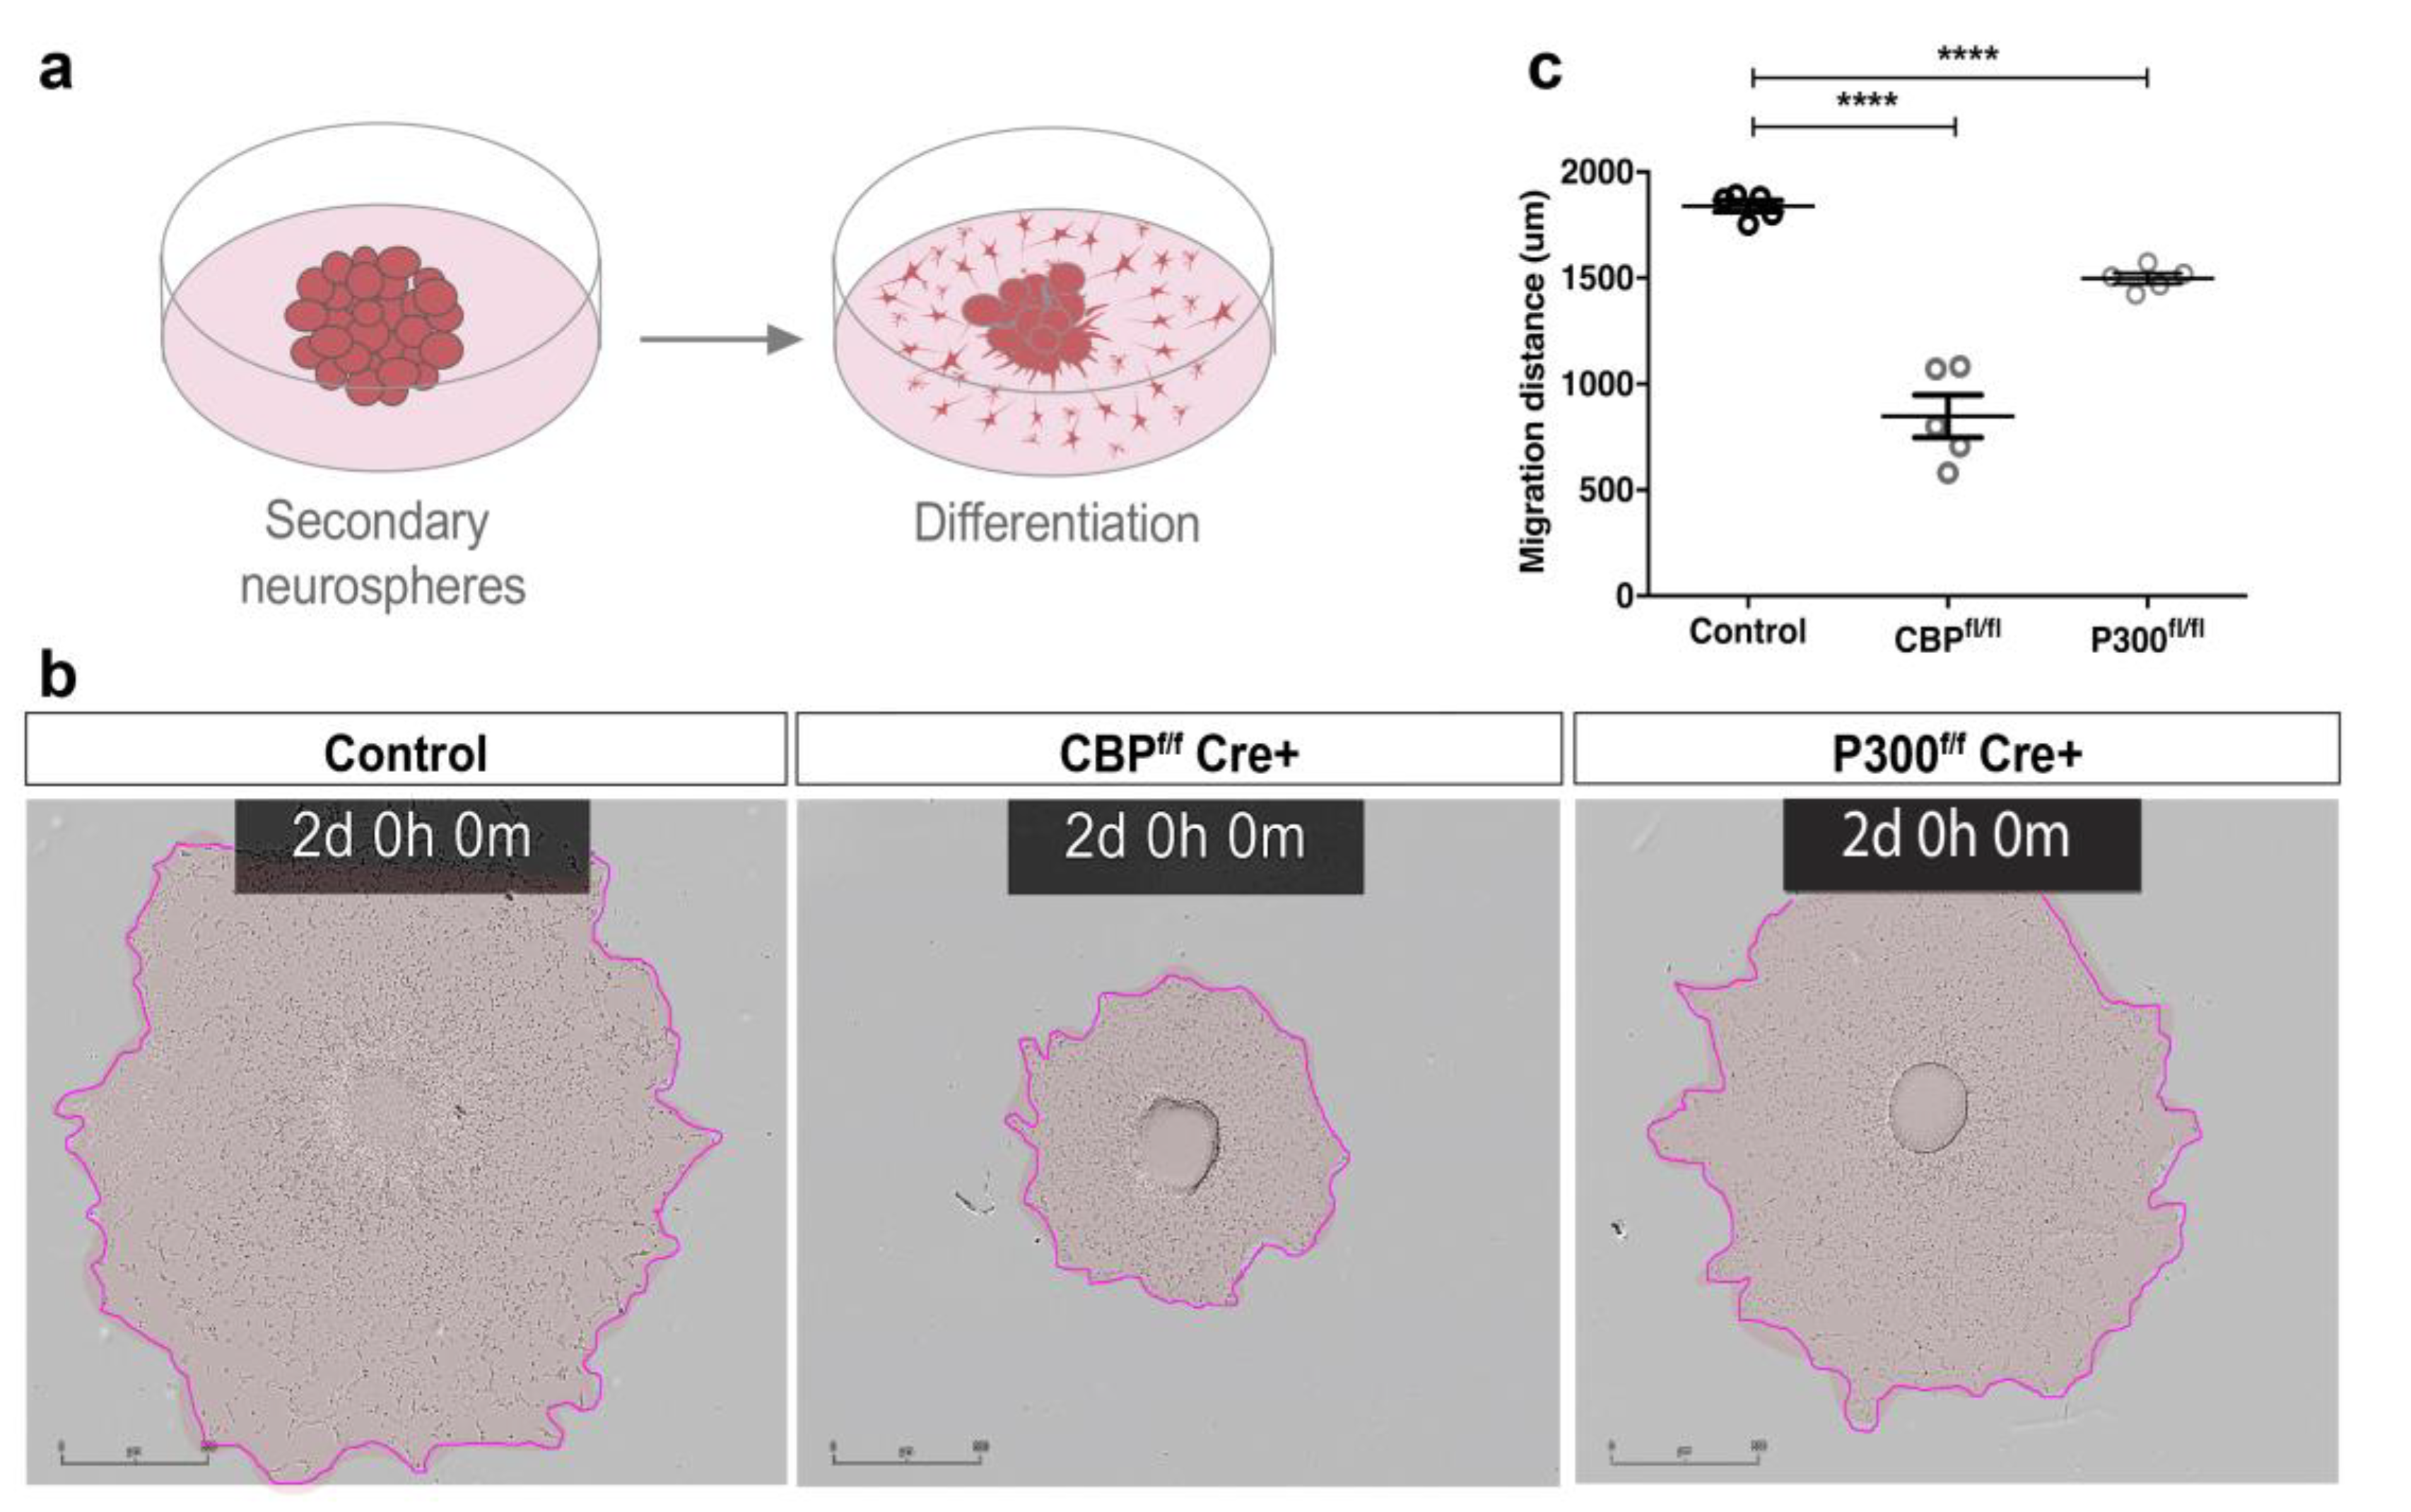
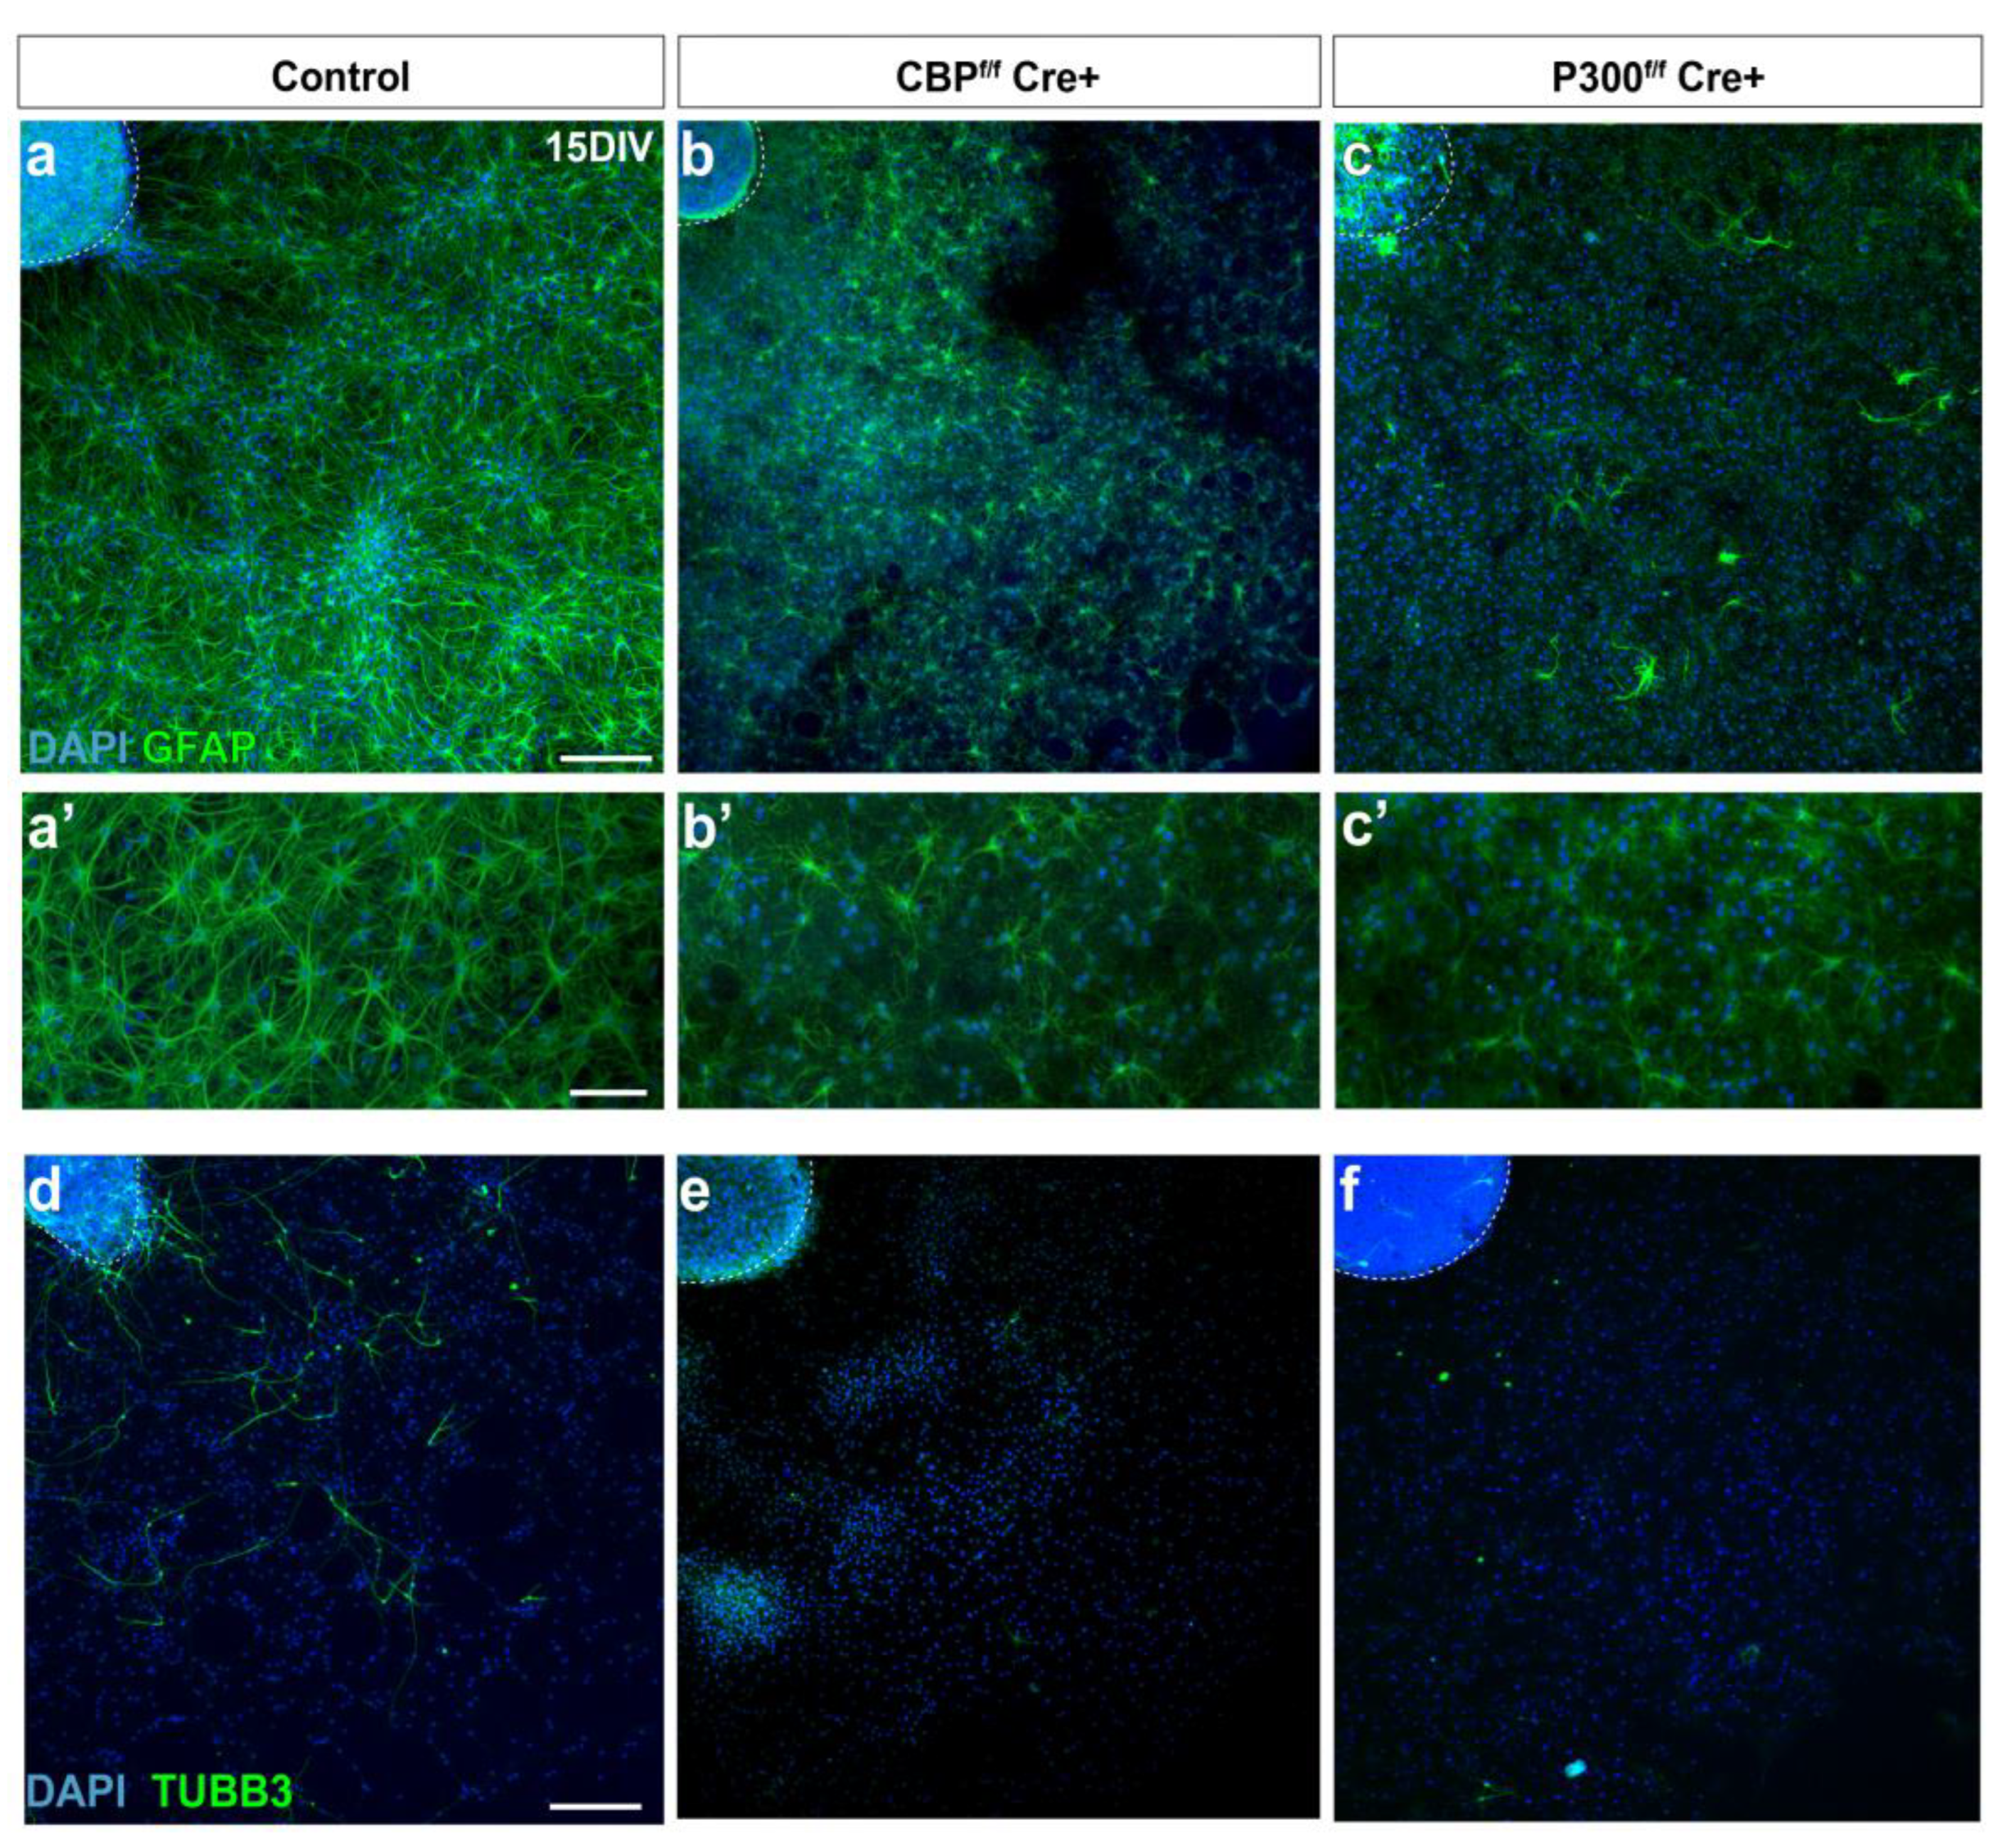
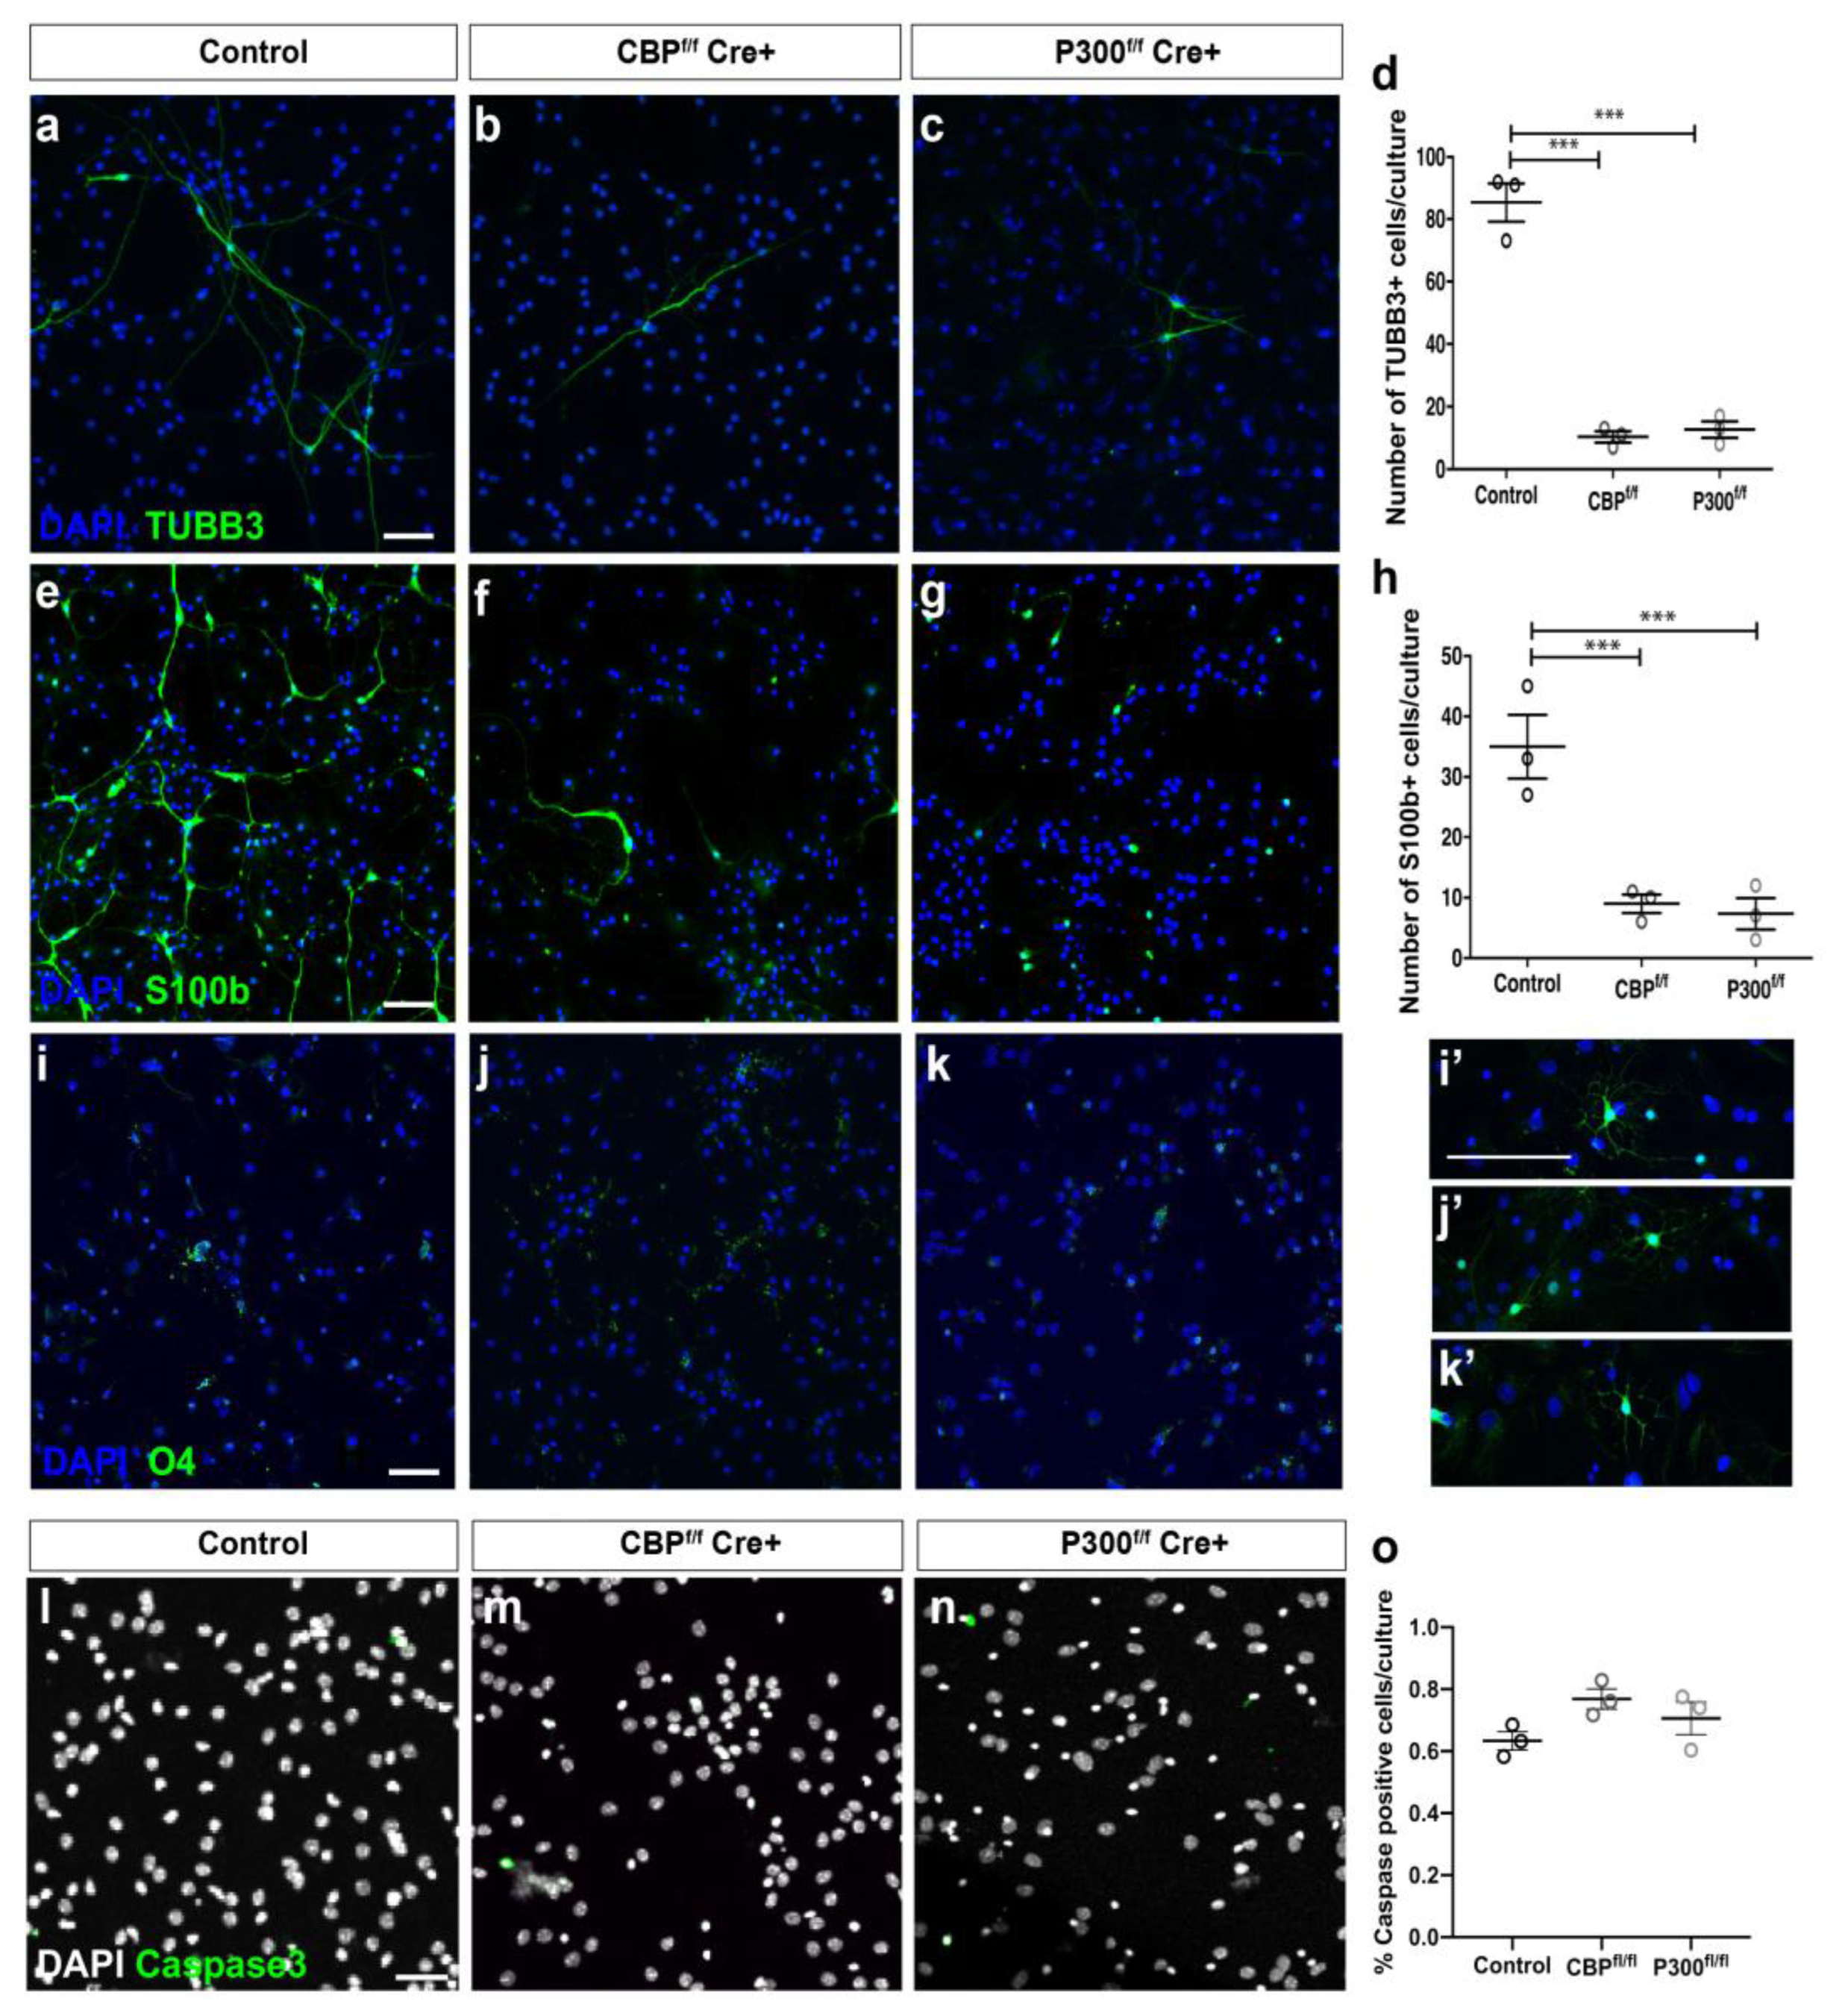
3.2. CBP and P300 Are Individually Required for Proper NSC Differentiation
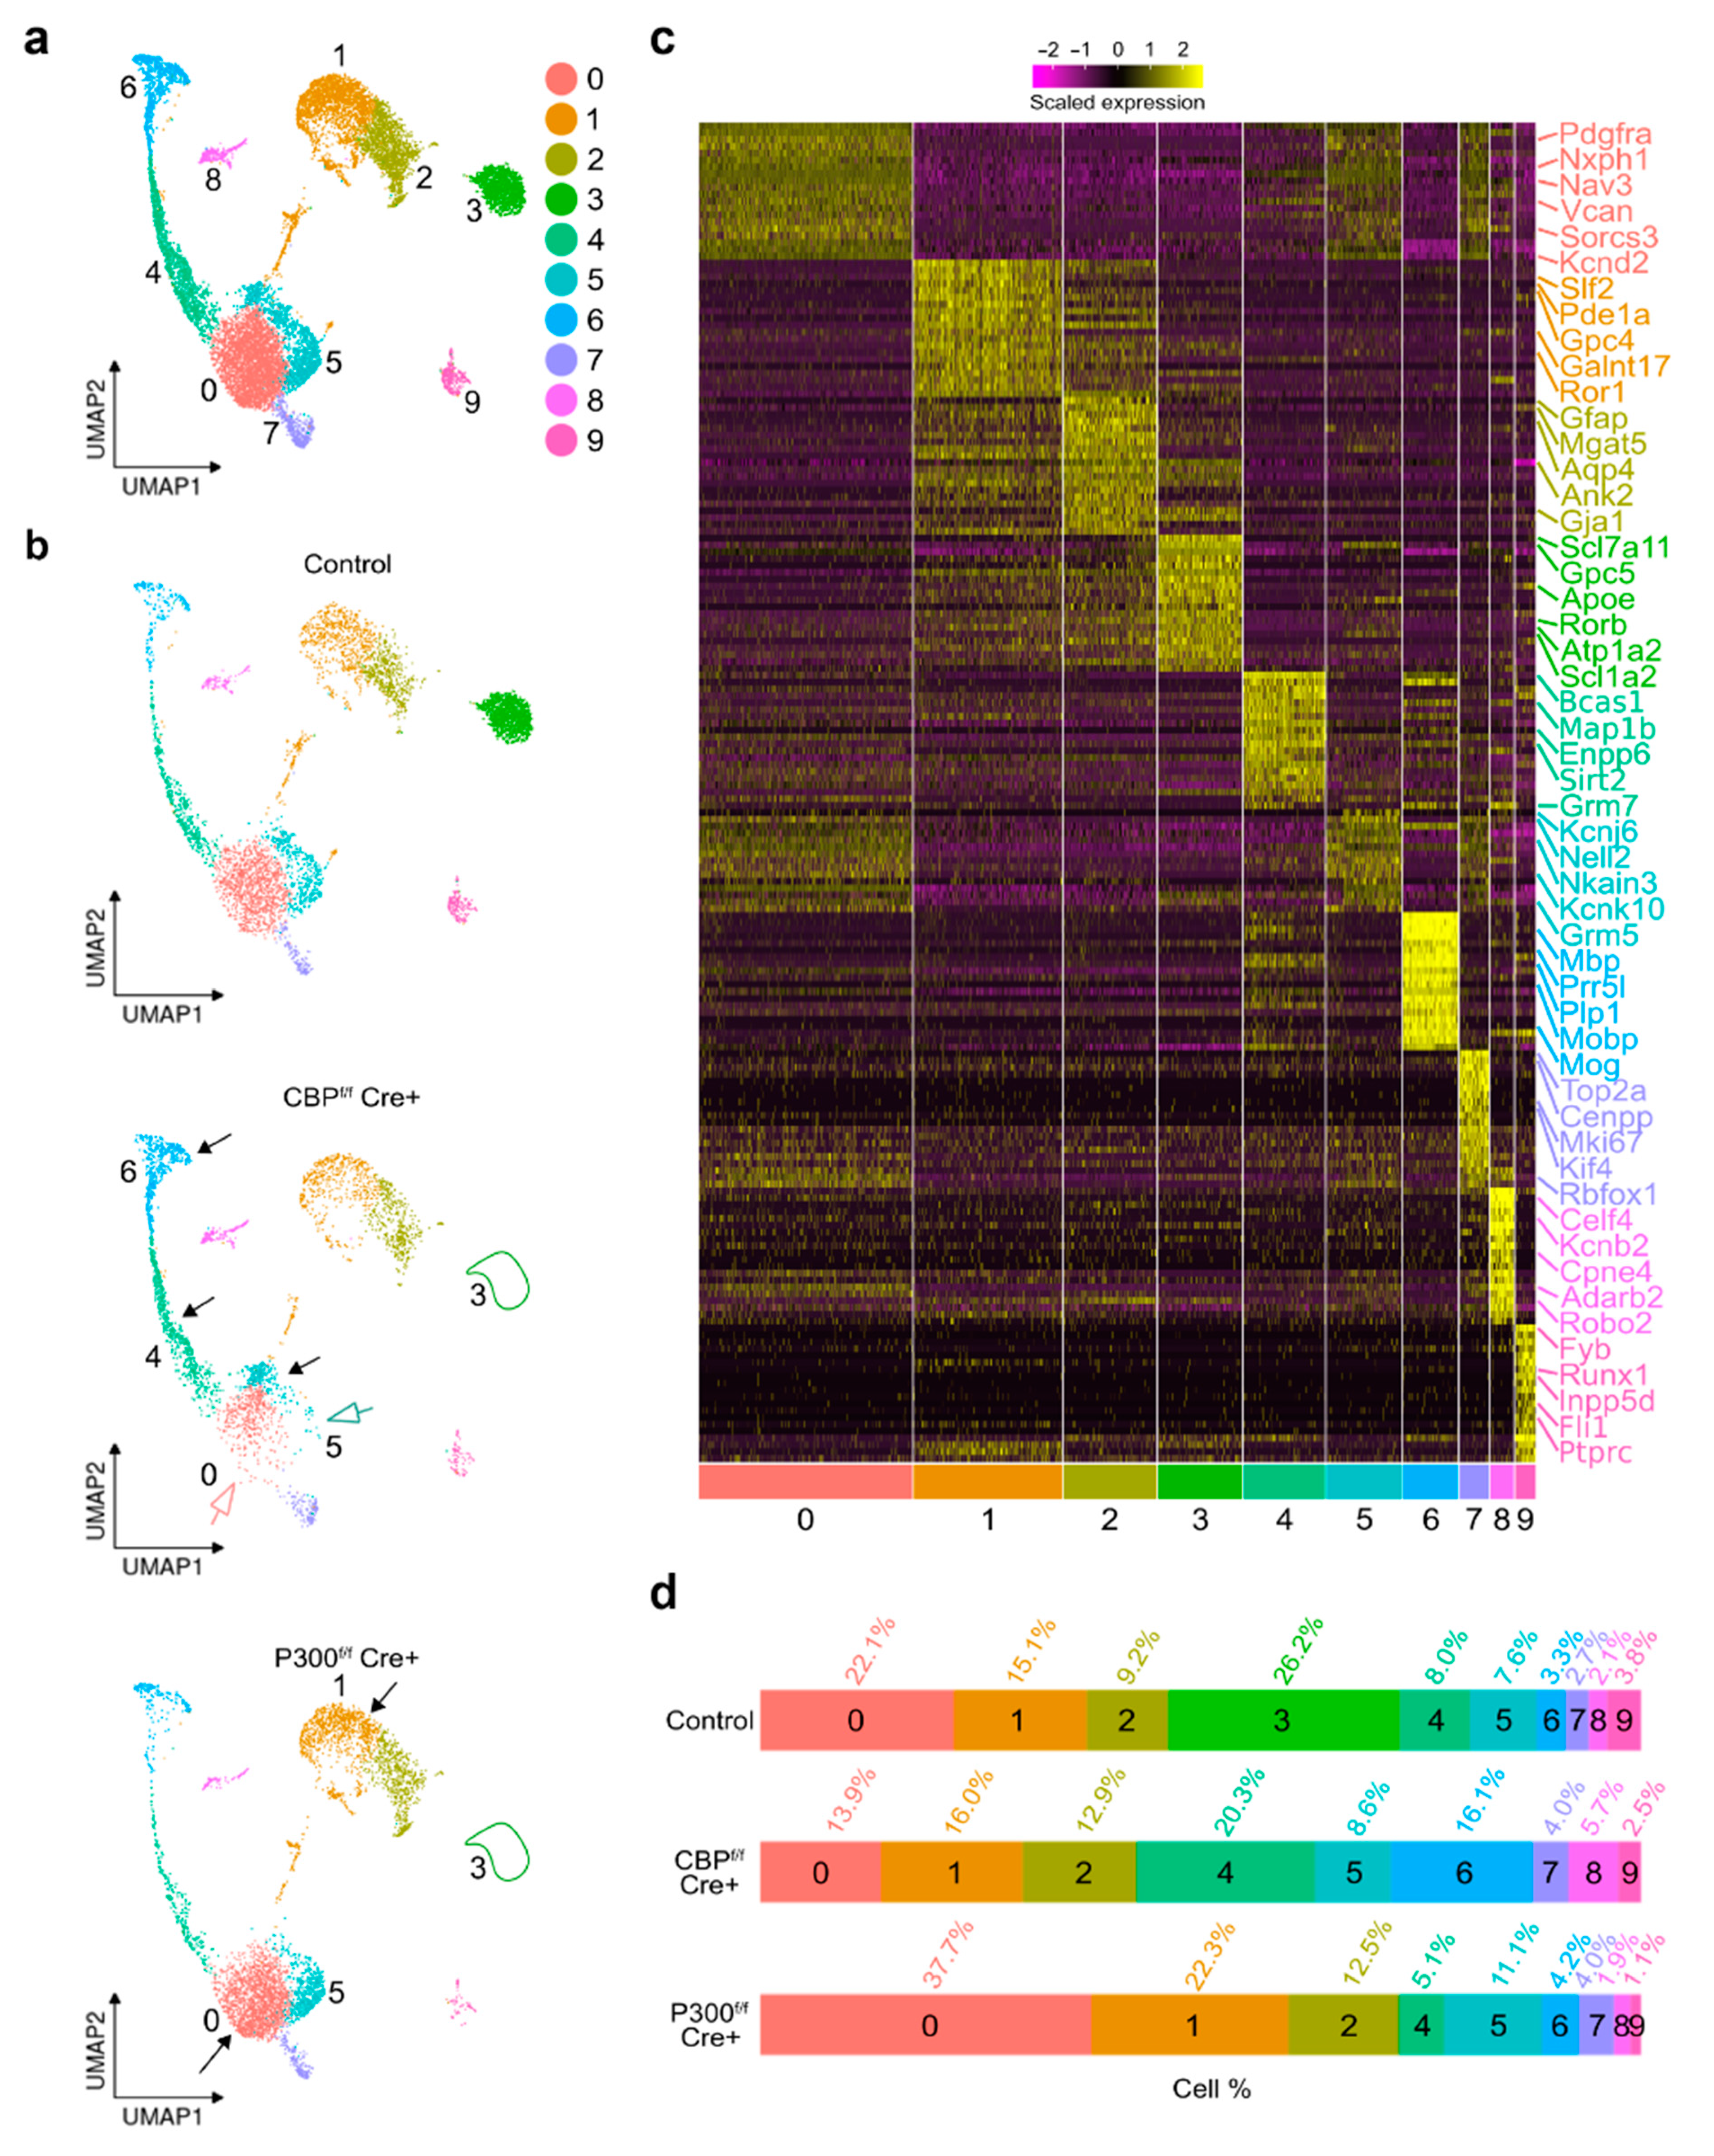
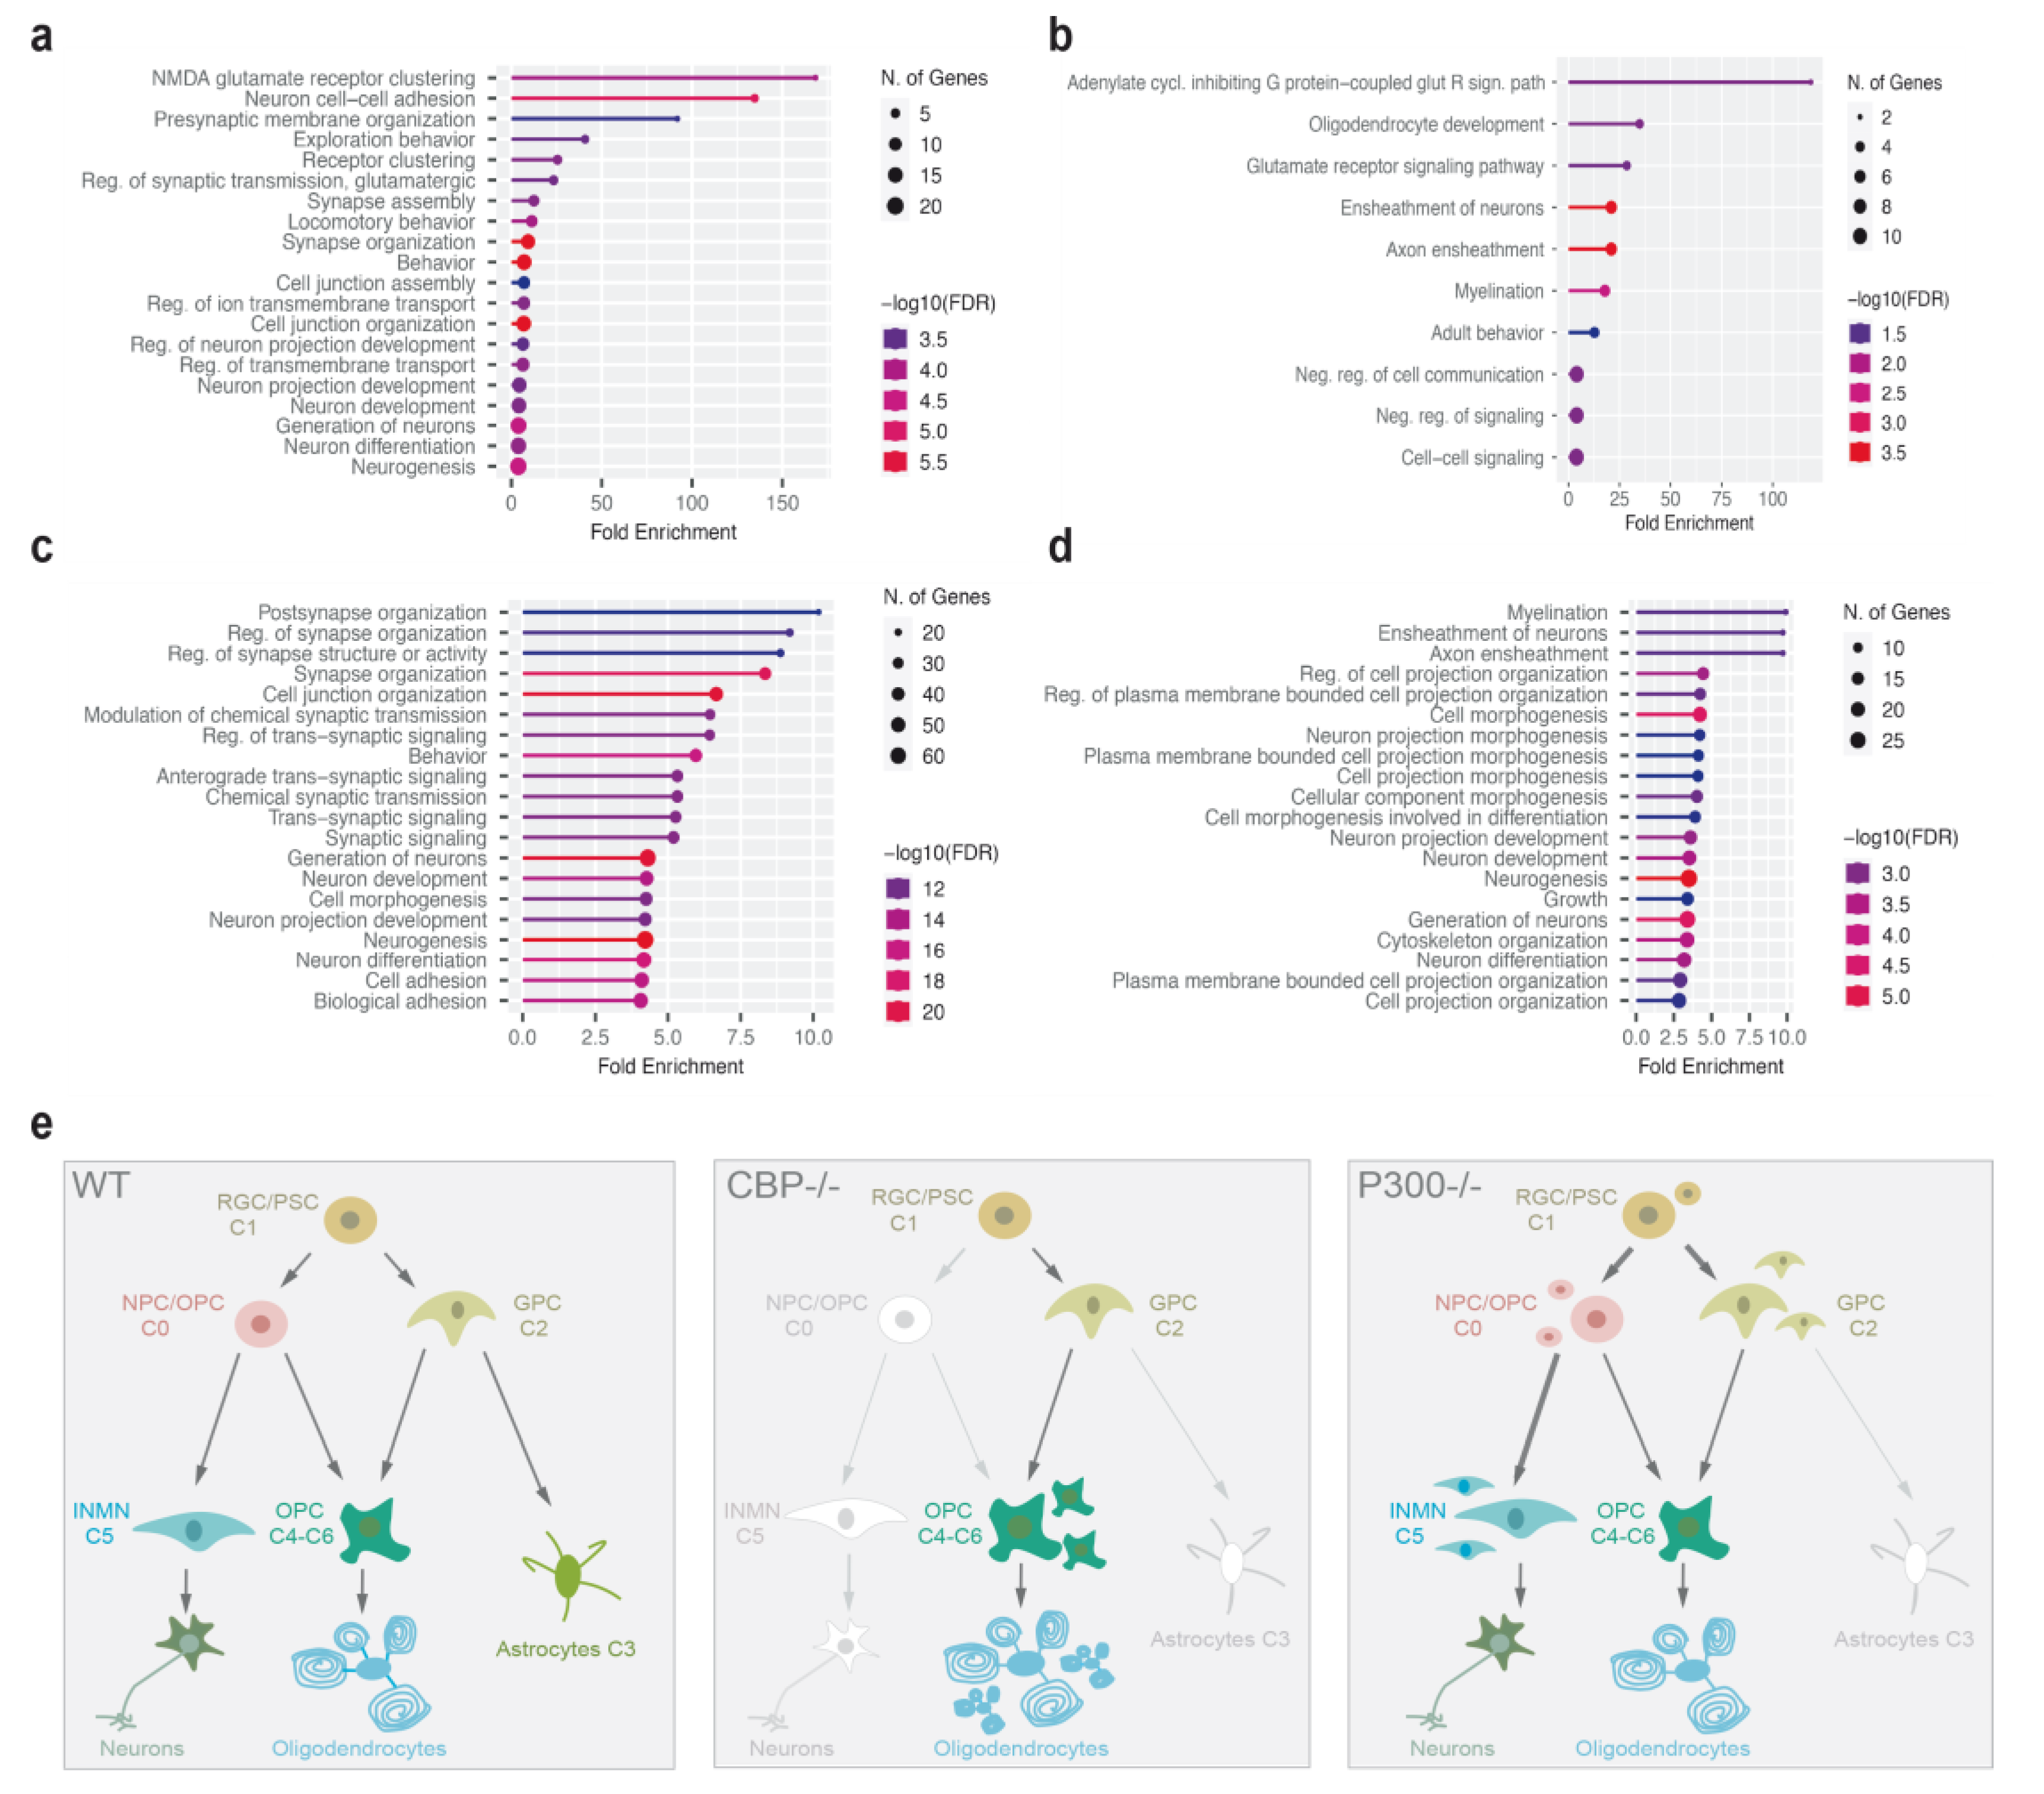
3.3. Single-Nucleus RNA Sequencing Analysis of Neurospheres-Derived Cultures Revealed Differential Alterations after Removal of CBP or P300
4. Discussion
Supplementary Materials
Author Contributions
Funding
Institutional Review Board Statement
Data Availability Statement
Acknowledgments
Conflicts of Interest
References
- Shahbazian, M.D.; Grunstein, M. Functions of Site-Specific Histone Acetylation and Deacetylation. Annu. Rev. Biochem. 2007, 76, 75–100. [Google Scholar] [CrossRef] [PubMed]
- Lopez-Atalaya, J.P.; Ito, S.; Valor, L.M.; Benito, E.; Barco, A. Genomic Targets, and Histone Acetylation and Gene Expression Profiling of Neural HDAC Inhibition. Nucleic Acids Res. 2013, 41, 8072–8084. [Google Scholar] [CrossRef] [PubMed] [Green Version]
- Lipinski, M.; del Blanco, B.; Barco, A. CBP/P300 in Brain Development and Plasticity: Disentangling the KAT’s Cradle. Curr. Opin. Neurobiol. 2019, 59, 1–8. [Google Scholar] [CrossRef] [PubMed]
- Yao, T.P.; Oh, S.P.; Fuchs, M.; Zhou, N.D.; Ch’ng, L.E.; Newsome, D.; Bronson, R.T.; Li, E.; Livingston, D.M.; Eckner, R. Gene Dosage-Dependent Embryonic Development and Proliferation Defects in Mice Lacking the Transcriptional Integrator P300. Cell 1998, 93, 361–372. [Google Scholar] [CrossRef] [Green Version]
- Tanaka, Y.; Naruse, I.; Hongo, T.; Xu, M.J.; Nakahata, T.; Maekawa, T.; Ishii, S. Extensive Brain Hemorrhage and Embryonic Lethality in a Mouse Null Mutant of CREB-Binding Protein. Mech. Dev. 2000, 95, 133–145. [Google Scholar] [CrossRef]
- Reynolds, B.A.; Weiss, S. Generation of Neurons and Astrocytes from Isolated Cells of the Adult Mammalian Central Nervous System. Science 1992, 255, 1707–1710. [Google Scholar] [CrossRef] [Green Version]
- Kasper, L.H.; Fukuyama, T.; Biesen, M.A.; Boussouar, F.; Tong, C.; de Pauw, A.; Murray, P.J.; van Deursen, J.M.A.; Brindle, P.K. Conditional Knockout Mice Reveal Distinct Functions for the Global Transcriptional Coactivators CBP and P300 in T-Cell Development. Mol. Cell. Biol. 2006, 26, 789–809. [Google Scholar] [CrossRef] [Green Version]
- Tropepe, V.; Sibilia, M.; Ciruna, B.G.; Rossant, J.; Wagner, E.F.; Van Der Kooy, D. Distinct Neural Stem Cells Proliferate in Response to EGF and FGF in the Developing Mouse Telencephalon. Dev. Biol. 1999, 208, 166–188. [Google Scholar] [CrossRef] [Green Version]
- Belenguer, G.; Domingo-Muelas, A.; Ferrón, S.R.; Morante-Redolat, J.M.; Fariñas, I. Isolation, Culture and Analysis of Adult Subependymal Neural Stem Cells. Differentiation 2016, 91, 28–41. [Google Scholar] [CrossRef]
- Ferrón, S.R.; Andreu-Agulló, C.; Mira, H.; Sánchez, P.; Ángeles Marqués-Torrejón, M.; Fariñas, I. A Combined Ex/in Vivo Assay to Detect Effects of Exogenously Added Factors in Neural Stem Cells. Nat. Protoc. 2007, 2, 849–859. [Google Scholar] [CrossRef]
- Vernerey, J.; Macchi, M.; Magalon, K.; Cayre, M.; Durbec, P. Ciliary Neurotrophic Factor Controls Progenitor Migration during Remyelination in the Adult Rodent Brain. J. Neurosci. 2013, 33, 3240–3250. [Google Scholar] [CrossRef] [PubMed] [Green Version]
- Xiong, F.; Gao, H.; Zhen, Y.; Chen, X.; Lin, W.; Shen, J.; Yan, Y.; Wang, X.; Liu, M.; Gao, Y. Optimal Time for Passaging Neurospheres Based on Primary Neural Stem Cell Cultures. Cytotechnology 2011, 63, 621–631. [Google Scholar] [CrossRef] [PubMed] [Green Version]
- Lipinski, M.; Muñoz-Viana, R.; del Blanco, B.; Marquez-Galera, A.; Medrano-Relinque, J.; Caramés, J.M.; Szczepankiewicz, A.A.; Fernandez-Albert, J.; Navarrón, C.M.; Olivares, R.; et al. KAT3-Dependent Acetylation of Cell Type-Specific Genes Maintains Neuronal Identity in the Adult Mouse Brain. Nat. Commun. 2020, 11, 2588. [Google Scholar] [CrossRef] [PubMed]
- Cid, E.; Marquez-galera, A.; Valero, M.; Gal, B.; Medeiros, D.C.; Navarron, C.M.; Ballesteros-Esteban, L.; Reig-Viader, R.; Morales, A.V.; Fernandez-Lamo, I.; et al. Article Sublayer- and Cell-Type-Specific Neurodegenerative Transcriptional Trajectories in Hippocampal Sclerosis Ll Ll Sublayer- and Cell-Type-Specific Neurodegenerative Transcriptional Trajectories in Hippocampal Sclerosis. Cell Rep. 2021, 35, 109229. [Google Scholar] [CrossRef]
- Butler, A.; Hoffman, P.; Smibert, P.; Papalexi, E.; Satija, R. Integrating Single-Cell Transcriptomic Data across Different Conditions, Technologies, and Species. Nat. Biotechnol. 2018, 36, 411–420. [Google Scholar] [CrossRef]
- Stuart, T.; Butler, A.; Hoffman, P.; Hafemeister, C.; Papalexi, E.; Mauck, W.M., III; Hao, Y.; Stoeckius, M.; Smibert, P.; Satija, R. Comprehensive Integration of Single-Cell Data. Cell 2019, 177, 1888–1902.e21. [Google Scholar] [CrossRef]
- Van der Maaten, L.; Hinton, G. Visualizing Data Using T-SNE. J. Mach. Learn. Res. 2008, 9, 2579–2605. [Google Scholar]
- McInnes, L.; Healy, J.; Saul, N.; Großberger, L. UMAP: Uniform Manifold Approximation and Projection. J. Open Source Softw. 2018, 3, 861. [Google Scholar] [CrossRef]
- Yao, Z.; van Velthoven, C.T.J.; Nguyen, T.N.; Goldy, J.; Sedeno-Cortes, A.E.; Baftizadeh, F.; Bertagnolli, D.; Casper, T.; Chiang, M.; Crichton, K.; et al. A Taxonomy of Transcriptomic Cell Types across the Isocortex and Hippocampal Formation. Cell 2021, 184, 3222–3241.e26. [Google Scholar] [CrossRef]
- La Manno, G.; Siletti, K.; Furlan, A.; Gyllborg, D.; Vinsland, E.; Albiach, A.M.; Langseth, C.M.; Khven, I.; Lederer, A.R.; Dratva, L.M.; et al. Molecular Architecture of the Developing Mouse Brain. Nature 2021, 596, 92–96. [Google Scholar] [CrossRef]
- Zhang, Z.; Hofmann, C.; Casanova, E.; Schütz, G.; Lutz, B. Generation of a Conditional Allele of the CBP Gene in Mouse. Genesis 2004, 40, 82–89. [Google Scholar] [CrossRef] [PubMed]
- Ohtsuka, T.; Sakamoto, M.; Guillemot, F.; Kageyama, R. Roles of the Basic Helix-Loop-Helix Genes Hes1 and Hes5 in Expansion of Neural Stem Cells of the Developing Brain. J. Biol. Chem. 2001, 276, 30467–30474. [Google Scholar] [CrossRef] [PubMed] [Green Version]
- Singec, I.; Knoth, R.; Meyer, R.P.; Maciaczyk, J.; Volk, B.; Nikkhah, G.; Frotscher, M.; Snyder, E.Y. Defining the Actual Sensitivity and Specificity of the Neurosphere Assay in Stem Cell Biology. Nat. Methods 2006, 3, 801–806. [Google Scholar] [CrossRef] [PubMed]
- Chaddah, R.; Arntfield, M.; Runciman, S.; Clarke, L.; van der Kooy, D. Clonal Neural Stem Cells from Human Embryonic Stem Cell Colonies. J. Neurosci. 2012, 32, 7771–7781. [Google Scholar] [CrossRef] [Green Version]
- Breen, M.E.; Mapp, A.K. Modulating the Masters: Chemical Tools to Dissect CBP and P300 Function. Curr. Opin. Chem. Biol. 2018, 45, 195–203. [Google Scholar] [CrossRef]
- Roth, J.F.; Shikama, N.; Henzen, C.; Desbaillets, I.; Lutz, W.; Marino, S.; Wittwer, J.; Schorle, H.; Gassmann, M.; Eckner, R. Differential Role of P300 and CBP Acetyltransferase during Myogenesis: P300 Acts Upstream of MyoD and Myf5. EMBO J. 2003, 22, 5186–5196. [Google Scholar] [CrossRef] [Green Version]
- Shikama, N.; Lutz, W.; Kretzschmar, R.; Sauter, N.; Roth, J.F.; Marino, S.; Wittwer, J.; Scheidweiler, A.; Eckner, R. Essential Function of P300 Acetyltransferase Activity in Heart, Lung and Small Intestine Formation. EMBO J. 2003, 22, 5175–5185. [Google Scholar] [CrossRef] [Green Version]
- Lee, S.; Lee, B.; Lee, J.W.; Lee, S.K. Retinoid Signaling and Neurogenin2 Function Are Coupled for the Specification of Spinal Motor Neurons through a Chromatin Modifier CBP. Neuron 2009, 62, 641–654. [Google Scholar] [CrossRef] [Green Version]
- Wang, J.; Weaver, I.C.G.; Gauthier-Fisher, A.; Wang, H.; He, L.; Yeomans, J.; Wondisford, F.; Kaplan, D.R.; Miller, F.D. CBP Histone Acetyltransferase Activity Regulates Embryonic Neural Differentiation in the Normal and Rubinstein-Taybi Syndrome Brain. Dev. Cell 2010, 18, 114–125. [Google Scholar] [CrossRef] [Green Version]
- Calzari, L.; Barcella, M.; Alari, V.; Braga, D.; Muñoz-Viana, R.; Barlassina, C.; Finelli, P.; Gervasini, C.; Barco, A.; Russo, S.; et al. Transcriptome Analysis of IPSC-Derived Neurons from Rubinstein-Taybi Patients Reveals Deficits in Neuronal Differentiation. Mol. Neurobiol. 2020, 57, 3685–3701. [Google Scholar] [CrossRef]
- Campos, L.S. Neurospheres: Insights into Neural Stem Cell Biology. J. Neurosci. Res. 2004, 78, 761–769. [Google Scholar] [CrossRef] [PubMed]
- Deleyrolle, L.P.; Rietze, R.L.; Reynolds, B.A. The Neurosphere Assay, a Method under Scrutiny. Acta Neuropsychiatr. 2008, 20, 2–8. [Google Scholar] [CrossRef] [PubMed]
- Edgar, R.; Domrachev, M.; Lash, A.E. Gene Expression Omnibus: NCBI Gene Expression and Hybridization Array Data Repository. Nucleic Acids Res. 2002, 30, 207–210. [Google Scholar] [CrossRef] [PubMed]


Publisher’s Note: MDPI stays neutral with regard to jurisdictional claims in published maps and institutional affiliations. |
© 2022 by the authors. Licensee MDPI, Basel, Switzerland. This article is an open access article distributed under the terms and conditions of the Creative Commons Attribution (CC BY) license (https://creativecommons.org/licenses/by/4.0/).
Share and Cite
González-Martínez, R.; Márquez-Galera, A.; Del Blanco, B.; López-Atalaya, J.P.; Barco, A.; Herrera, E. CBP and p300 Jointly Maintain Neural Progenitor Viability but Play Unique Roles in the Differentiation of Neural Lineages. Cells 2022, 11, 4118. https://doi.org/10.3390/cells11244118
González-Martínez R, Márquez-Galera A, Del Blanco B, López-Atalaya JP, Barco A, Herrera E. CBP and p300 Jointly Maintain Neural Progenitor Viability but Play Unique Roles in the Differentiation of Neural Lineages. Cells. 2022; 11(24):4118. https://doi.org/10.3390/cells11244118
Chicago/Turabian StyleGonzález-Martínez, Rocío, Angel Márquez-Galera, Beatriz Del Blanco, Jose P. López-Atalaya, Angel Barco, and Eloísa Herrera. 2022. "CBP and p300 Jointly Maintain Neural Progenitor Viability but Play Unique Roles in the Differentiation of Neural Lineages" Cells 11, no. 24: 4118. https://doi.org/10.3390/cells11244118