Article

SGAEMDA: Predicting miRNA-Disease Associations Based on Stacked Graph Autoencoder

1
College of Computer Science and Technology, Qingdao Institute of Software, China University of Petroleum, Qingdao 266580, China
2
School of Information and Control Engineering, Qingdao University of Technology, Qingdao 266525, China
*
Author to whom correspondence should be addressed.
Cells 2022, 11(24), 3984; https://doi.org/10.3390/cells11243984
Submission received: 14 November 2022 / Revised: 30 November 2022 / Accepted: 7 December 2022 / Published: 9 December 2022
(This article belongs to the Special Issue Advances of Deep Learning in Cell Biology)

Abstract

:
MicroRNA (miRNA)-disease association (MDA) prediction is critical for disease prevention, diagnosis, and treatment. Traditional MDA wet experiments, on the other hand, are inefficient and costly.Therefore, we proposed a multi-layer collaborative unsupervised training base model called SGAEMDA (Stacked Graph Autoencoder-Based Prediction of Potential miRNA-Disease Associations). First, from the original miRNA and disease data, we defined two types of initial features: similarity features and association features. Second, stacked graph autoencoder is then used to learn unsupervised low-dimensional representations of meaningful higher-order similarity features, and we concatenate the association features with the learned low-dimensional representations to obtain the final miRNA-disease pair features. Finally, we used a multilayer perceptron (MLP) to predict scores for unknown miRNA-disease associations. SGAEMDA achieved a mean area under the ROC curve of 0.9585 and 0.9516 in 5-fold and 10-fold cross-validation, which is significantly higher than the other baseline methods. Furthermore, case studies have shown that SGAEMDA can accurately predict candidate miRNAs for brain, breast, colon, and kidney neoplasms.

1. Introduction

MicroRNA (miRNA) is a single-stranded small molecule RNA with a length of about 19–25 nucleotides that is encoded by endogenous genes [1,2]. MiRNAs are linked to and play a crucial part in many vital human body processes, such as cell proliferation, differentiation, immunity, and metabolism [3]. As a result, miRNAs have received increased attention, particularly in the field of associations between miRNAs and complex human diseases. Overexpression and downregulation of miRNA expression in humans have been linked to a variety of complex diseases, according to research [4,5]. Upregulation of miR-17-5p expression, for example, has a greater effect on pancreatic cancer cell proliferation and significantly increases the number of invading cells [6]. When compared to normal breast tissue, abnormal expression of miRNAs such as mir-125b, mir-145, mir-21, and mir-155 causes human breast cancer [7]. Cressatti et al. [8] discovered that miR-153 and miR-223 could be used as biomarkers for Parkinson’s disease (PD) diagnosis through paired regulation of α -synuclein. MiR-34, miR-124a, -146, miR-187, miR-199a-5p, miR-203, miR-210, and miR-383 dysregulation all have a negative impact on pancreatic β -cell viability and function, which leads to uncontrolled proliferation of insulin-secreting cells and the development of diabetes [9,10]. In conclusion, miRNAs have been shown to be inextricably linked to the emergence of many human complex diseases, making the prediction of potential miRNA-disease association (MDA) a promising area of research. It can help researchers comprehend the pathological mechanisms of complex diseases, which can be beneficial in both the treatment and diagnosis of complex diseases.
Traditional biological wet experiments, such as anchored polymerase chain reaction and reverse transcription polymerase chain reaction, were used in the early years to identify the relationship between miRNAs and diseases, but they all have drawbacks such as complicated experiments, long time periods, and high costs [11,12,13]. Several studies in the field of bioinformatics have been developed in recent years, such as drug–drug interactions [14], drug–target interactions [15], lncRNA–disease association prediction [16], and lncRNA–miRNA interaction [17]. Each of these studies has added to our understanding of computational approaches for predicting miRNA–disease connections. Many superior computational methods for predicting potential miRNA–disease associations have been proposed as more biological data sets have been collected, which not only saves significant money and time but also provides researchers with a new perspective to further validate the predicted potential associations. These MDA prediction computational approaches can be roughly categorized into three categories [18]: machine learning-based prediction models, deep learning-based prediction models, and matrix transformation-based prediction models.
Machine learning has been widely applied in all areas, and numerous machine learning models for predicting MDA have produced positive results. As there are not enough known miRNA–disease connections, existing prediction models perform poorly, Zhou et al. [19] presented a new model combining gradient boosting decision tree and logistic regression (GBDT-LR) to rank miRNA candidates for diseases. The model can extract features and then score them using logistic regression. Peng et al. [20] proposed a new prediction model called Ensemble of Kernel Ridge Regression-based MiRNA-Disease Association prediction (EKRRMDA), which used KRR to build two classifiers in miRNA space and disease space, respectively, and combined them with ensemble learning to improve model prediction accuracy. Liu et al. [21] created a computational model for the SMALF by learning potential features from the original miRNA–disease association matrix and then predicting unknown miRNA–disease associations using XGBoost. Tang et al. [22] developed an ensemble learning method (PMDFI) based on higher-order feature interactions to predict potential miRNA–disease associations. It uses stacked autoencoders to learn higher-order features from the similarity matrix and then uses an integrated model combining multiple random forests with logistic regression to predict an association. Liu et al. [23] proposed an autoencoder-based deep forest ensemble learning model (DFELMDA), which was further validated through case studies of colon, breast, and lung tumors with varying disease types. Both PMDFI and DFELMDA use automatic encoders, but as they do not consider graph structure information, they cannot learn the miRNA and disease feature representation well. Although machine learning-based methods have demonstrated good performance, they typically require domain knowledge to build sample features.
With the advent of Deep Learning, many methods of end-to-end computing have been developed, and this novel prediction method predicts better than earlier traditional machine learning methods. Xuan et al. [24] developed CNNMDA, a deep learning method that uses two convolutional neural networks to efficiently learn the potential relationship between miRNAs and diseases (CNN). Li et al. [25] created a GAEMDA model that takes miRNA and disease similarity as feature information, aggregates it using a graph neural network-based encoder to generate a low-dimensional representation of the nodes, and finally predicts it using a bilinear decoder. Zhou et al. [26] proposed a deep self-coding multicore learning approach (DAEMKL) the following year, which uses multicore learning to build miRNA-disease heterogeneous networks and then uses regression models to learn their feature representations. Li et al. [27] designed a computational framework based on graph attention network fusion of multi-source information (GATMDA). It utilized the graph attention network to aggregate information from neighbors with different weights to extract nonlinear features of diseases and miRNAs, and then predicted MDA by efficiently fusing linear and nonlinear features of diseases and miRNAs through a random forest algorithm. Han et al. [28] proposed that LAGCN build a heterogeneous network by integrating miRNA similarity, disease similarity, and miRNA-disease association information, and then use the attention mechanism to synthesize multiple CNNs to learn miRNA and disease embedding. Although deep learning-based methods can learn feature representations automatically and improve model prediction performance to some extent, they require a large number of training samples and do not incorporate graph structure information, making it difficult to capture neighborhood information in the network.
Furthermore, in recent years, several MDA prediction algorithms based on matrix transformation have appeared. Yu et al. [29] proposed a prediction model based on matrix completion and label propagation (MCLPMDA). It used matrix completion to reconstruct a new miRNA and disease similarity matrix based on the miRNA-disease association matrix, and then used the label propagation algorithm to predict MDA. Gao et al. [30] proposed the Nearest Profile-based Collaborative Matrix Factorization (NPCMF) algorithm, which uses L2,1-norm to complete the unknown association, using miRNA and disease nearest neighbor information to construct similarity functions and thus find new MDAs. Chen et al. [31] proposed the neighborhood constraint matrix completion algorithm (NCMCMDA), which combined neighborhood constraints with matrix completion for assisted prediction before transforming the prediction task into an optimization problem that could be solved by a rapid iterative algorithm. Yin et al. [32] created a new computational model called Logistic Weighted Profile-based Collaborative Matrix Factorization by combining two methods, weighted profile and collaborative matrix factorization (LWPCMF). The findings show that LWPCMF can accurately predict potential MDA. Although the matrix transformation-based method overcomes the problem of feature representation using vectors in high-dimensional space, its results are highly dependent on the initial solution selection, and it often fails to converge, which is time-consuming.
Although the models presented above predicted MDA well, they do have certain limitations. In recent years, autoencoders have been widely used in various fields [33,
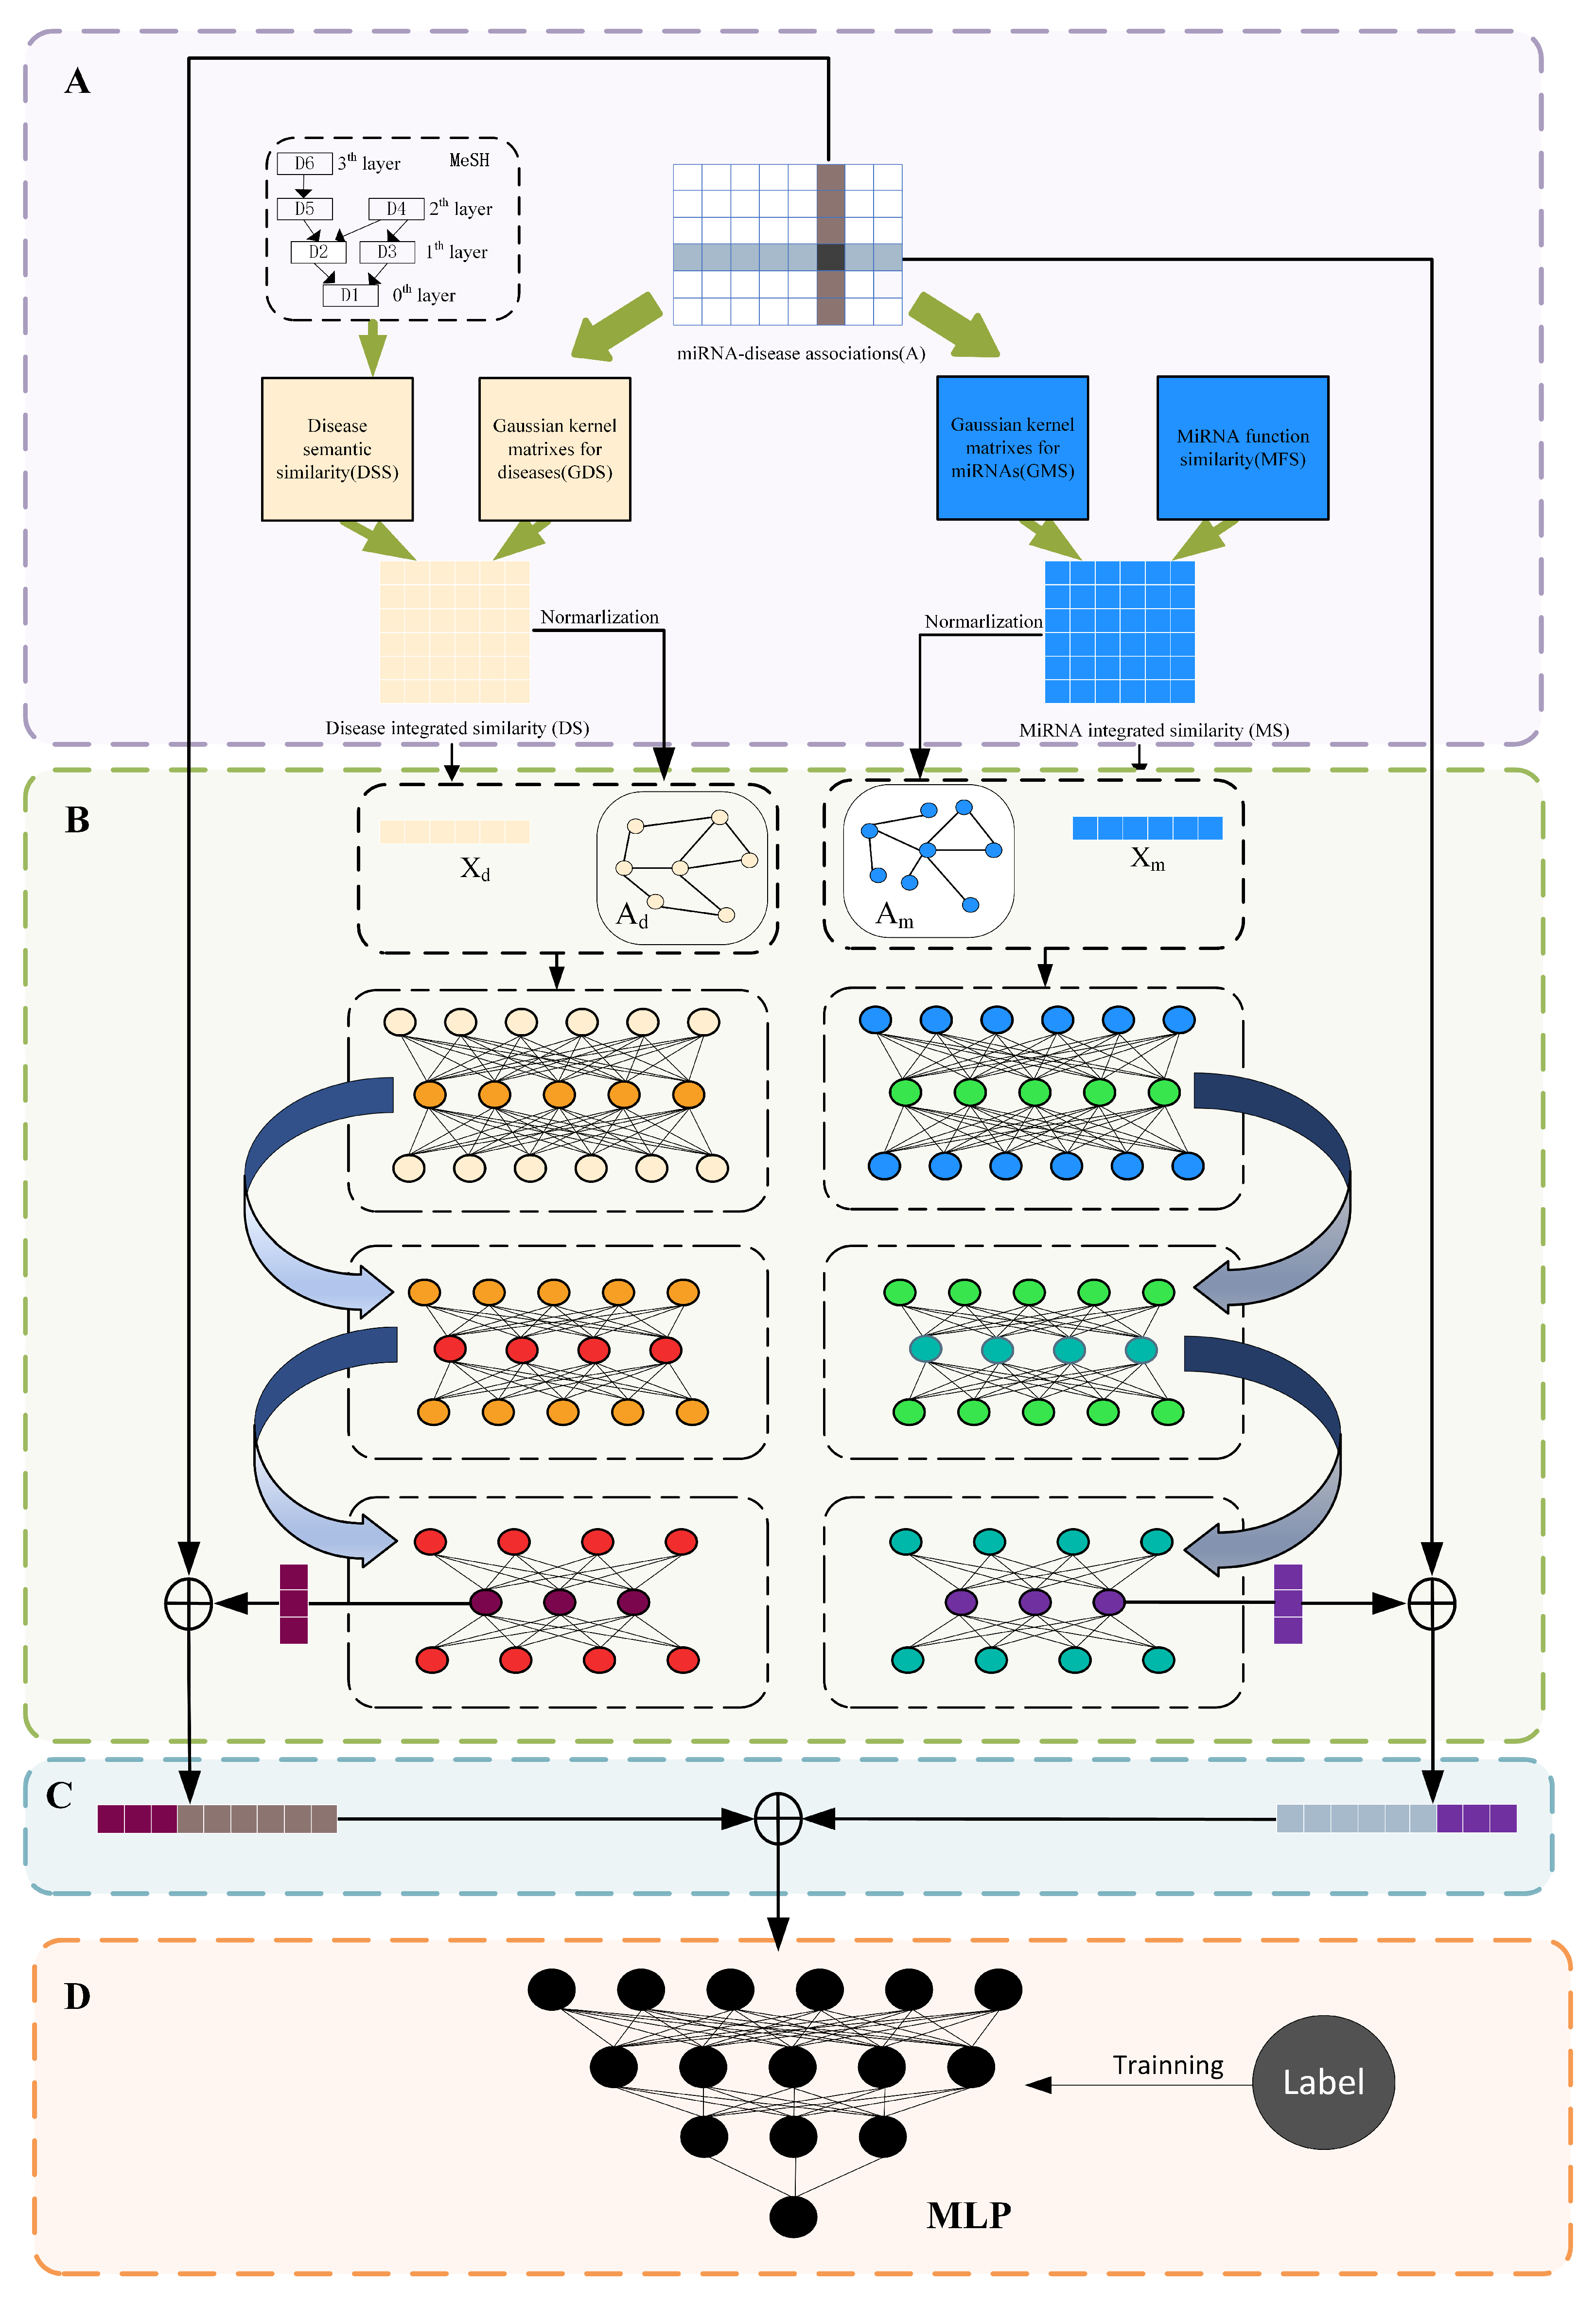
34] to efficiently learn the feature representation of miRNAs and diseases without losing the graph structure topology information, we propose a stacked graph autoencoder-based miRNA-disease association prediction algorithm (SGAEMDA), as shown in 
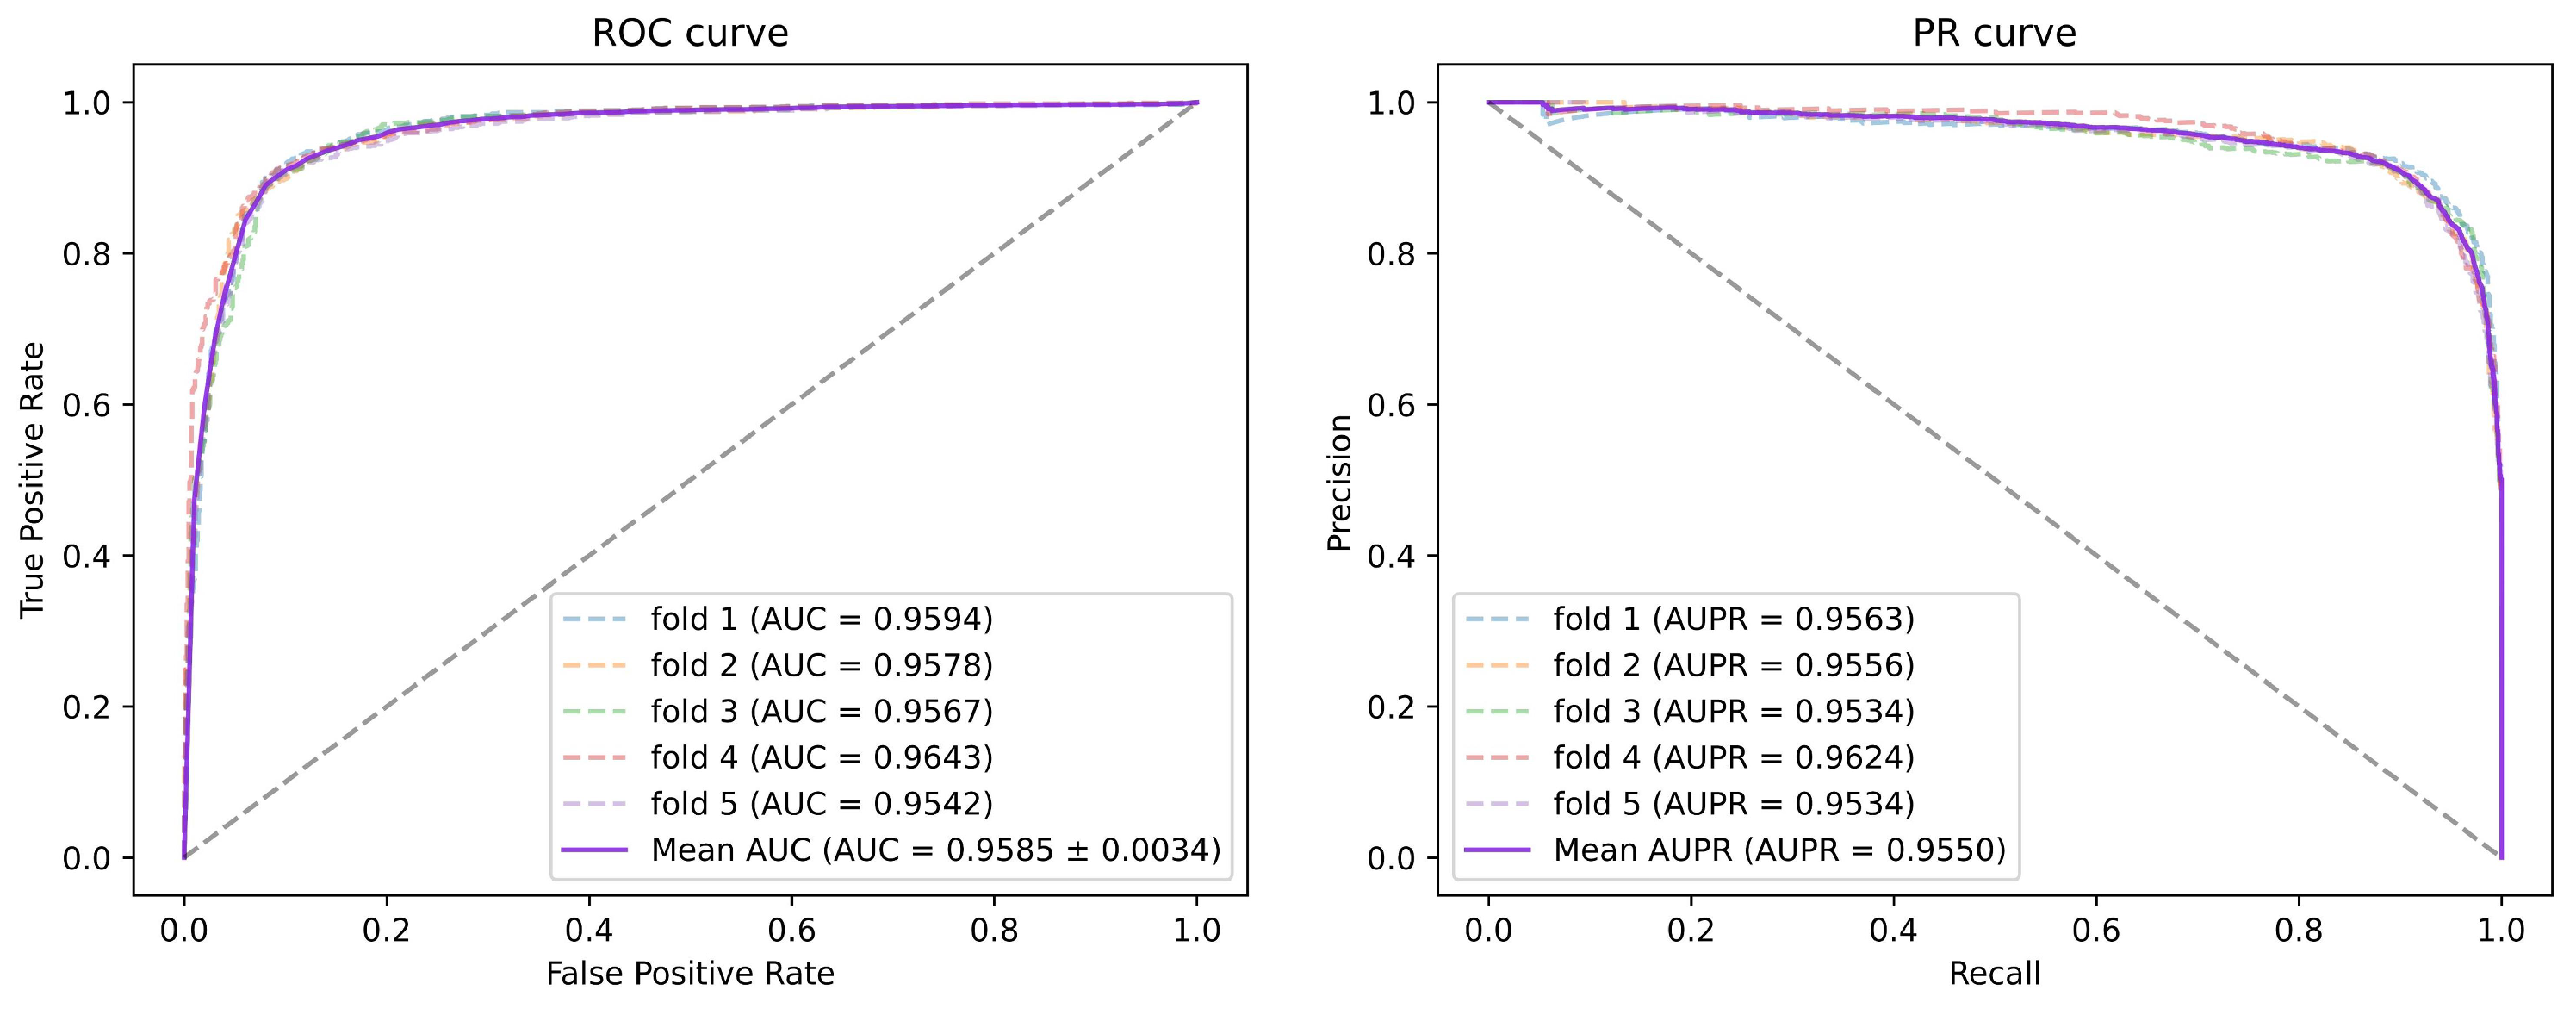
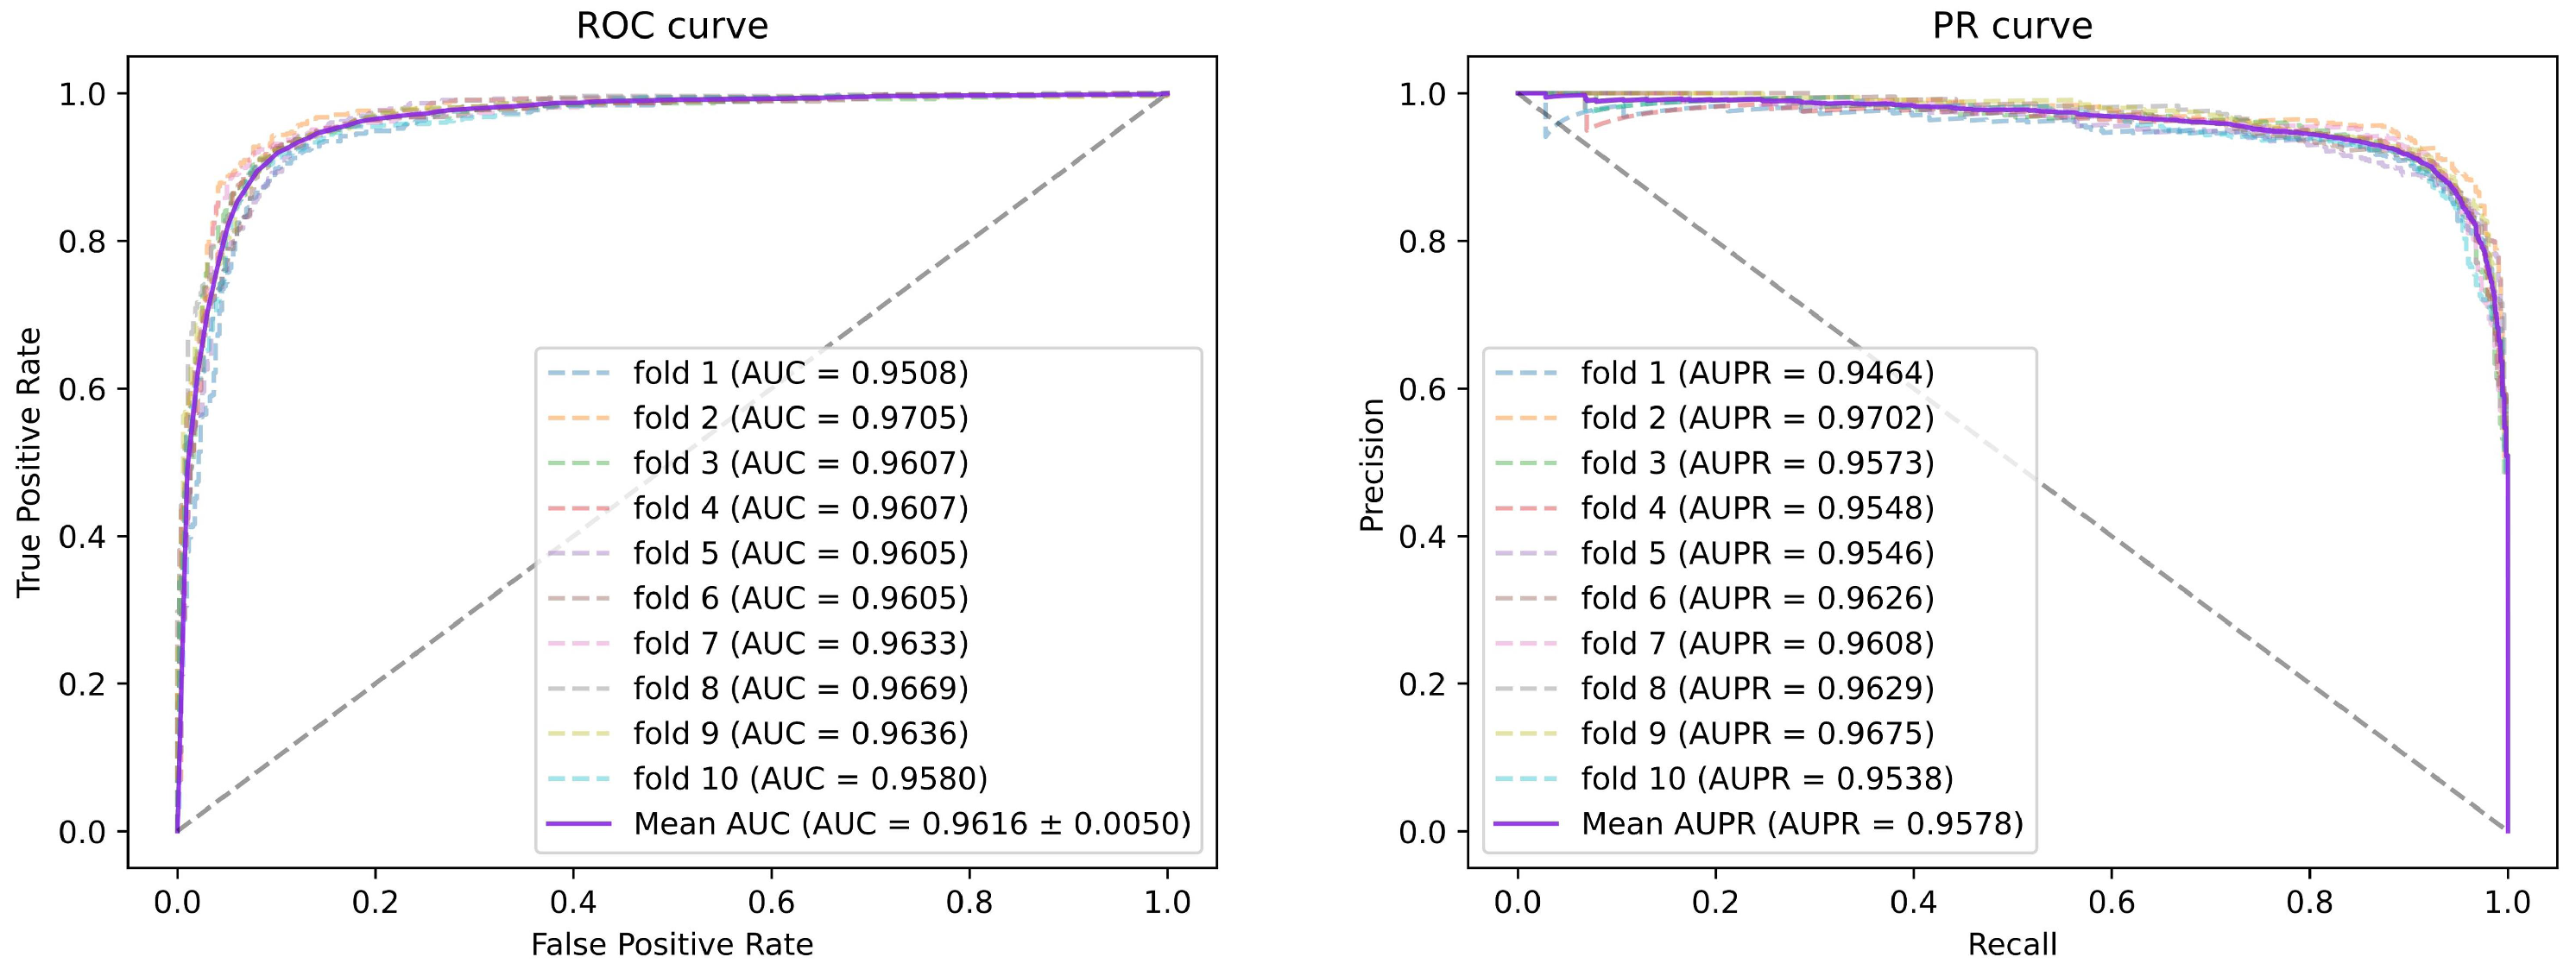
Figure 1. All miRNA features were then concatenated with disease features as miRNA-disease pair features. We employed 5-fold and 10-fold cross-validation to evaluate the prediction performance of our method. As a consequence, the AUCs of SGAEMDA in 5-fold and 10-fold cross-validation were 0.9585 and 0.9616, respectively, much higher than the other baseline methods. In addition, to demonstrate SGAEMDA’s performance, we conducted case studies on brain neoplasms, breast neoplasms, colon neoplasms, and kidney neoplasms. According to the findings, the bulk of our predicted possible miRNA-disease associations were verified by the dbDEMC and miRCancer databases. This paper’s significant contributions are summarized as follows.
(1)
We integrated both association information and similarity information to construct the initial features and could better learn the potential information in miRNA-disease pairs.
(2)
We propose a stacked graph autoencoder prediction framework. Unlike previous stacked autoencoders, which used layer-by-layer training, the stacked graph autoencoder uses multi-layer collaborative unsupervised training. It is capable of effectively extracting potential, deep, and unknown feature information from the similarity network to compensate for the shortcomings of previous models’ prediction results, which are biased toward miRNAs and diseases with known associations.
(3)
We use a multilayer perceptron (MLP) for prediction of the final results, which has high fault tolerance and can learn feature information from miRNA-disease pairs rapidly and efficiently to improve model prediction performance.
Figure 1. SGAEMDA flowchart. (A) Construction of initial features and data processing. (B) Pre-training to extract low-dimensional similarity features of miRNA and disease. (C) Fusion of learned miRNA and disease features to generate miRNA-disease pair feature vector. (D) Association prediction score by MLP.
Cells 11 03984 g001

2. Materials and Methods

2.1. Datasets for MDA Prediction

The Human miRNA-disease association dataset we used was downloaded from the HMDDv2.0 database [35]. It contains 5430 known associations of 383 complex diseases and 495 miRNAs, and the rest are unknown associations. In the follow-up experiments, we used a binary adjacency matrix A with n m rows and n d columns to storage all known and unknown associations. Where n m and n d are the number of miRNAs and diseases in this dataset, respectively. Specifically, this binary association matrix A is defined as follows:
A ( i , j ) = 1 , if miRNA m i is associated to disease d j 0 , otherwise ,

2.2. MiRNA and Disease Informaton

2.2.1. MiRNA Function Similarity

Wang et al. [36] proposed a method to measure miRNA functional similarity and a method to construct miRNA functional similarity networks based on the hypothesis that functionally similar miRNAs are often associated with similar diseases. The functional similarity information of miRNAs can be obtained from http://www.cuilab.cn/files/images/cuilab/misim.zip (accessed on 23 May 2022). Then, based on the obtained information, we built the miRNA functional similarity matrix MFS with n d rows and n d columns. Where M F S ( m i , m j ) denotes the functional similarity score between miRNA m i and miRNA m j .

2.2.2. Disease Semantic Similarity

Based on a previous study [37], disease semantic similarity was obtained based on statistics disease ontology information. Specifically, all disease semantic similarities can be calculated using medical subject headings (MeSH), where each disease d i can be described by several directed acyclic graphs (DAGs). The directed acyclic graph can be defined as D A G ( d i ) = ( d i , T ( d i ) , E ( d i ) ) , where d i denotes a specific disease, T ( d i ) denotes the set containing the disease node d i and all its ancestor nodes, and E ( d i ) denotes the set of corresponding edges. According to the constructed directed acyclic graph of disease d i , we can calculate the semantic contribution value of disease d k to disease d i as follows:
D d i 1 d k = 1 , if d k = d i max δ D d i 1 d d children of d k , if d k d i ,
where δ is the semantic contribution decay factor and based on a previous study, we set δ to 0.5. We can then calculate the semantic value of the disease d i .
D V 1 d i = d k T d i D d i 1 d k .
Based on the assumption that the more the overlapping parts of the DAGs of two diseases are, the more similar they are. We can calculate the disease semantic similarity between diseases d i and d j , and define it as follows:
D S 1 d i , d j = d T d i T d j D d i 1 d + D d j 1 d D V 1 d i + D V 1 d j ,
where D S 1 is for storing the semantic similarity of the first kind of diseases.
However, the above calculation method has a disadvantage in that it does not account for the different contributions of two diseases in the same layer of the DAG, and the disease with a low frequency should contribute more than the disease with a high frequency. As a result, we developed a second semantic similarity model. Specifically, we can calculate the semantic contribution value of disease d k to disease d i as follows:
D d i 2 = log the number of DAGs including d k the number of diseases .
Likewise, we can obtain the semantic value of disease d i :
D V 2 d i = d k T d i D d i 2 d k .
Based on the previously mentioned assumptions, we can calculate the second kind of disease semantic similarity between diseases d i and d j , which is defined as follows:
D S 2 d i , d j = d T d i T d j D d i 2 d + D d j 2 d D V 2 d i + D V 2 d j ,
where D S 2 is for storing the second kind of disease semantic similarity. To obtain the sound disease semantic similarity, we combined the two types of disease semantic similarity to obtain the final disease semantic similarity, and the final disease semantic similarity between diseases d i and d j can be calculated according to the following equation:
DSS d i , d j = D S 1 d i , d j + D S 1 d i , d j 2 .

2.2.3. Gaussian Interaction Profile Kernel Similarity of miRNAs and Diseases

Inspired by past studies [38], based on the hypothesis that functionally similar miRNAs may be associated with phenotypically similar diseases. We used Gaussian spectral kernel similarity to calculate the similarity between each pair of miRNAs and between each pair of diseases, which in turn complements the similarity information of miRNAs and diseases. Specifically, the Gaussian interaction profile kernel similarity between miRNAs m i and m j was calculated as follows:
GMS m i , m j = exp γ m I P m i I P m j 2 ,
γ m = γ m / 1 n m i = 1 n m I P m i 2 ,
where the parameter γ m controls the kernel bandwidth, which can be obtained based on the hyperparameter γ m normalized by the average number of interactions for each miRNA. According to previous studies, γ m is set to 1. For diseases, similar to miRNAs, the Gaussian interaction profile kernel similarity between diseases d i and d j is calculated as follows:
GDS d i , d j = exp γ d I P d i I P d j 2 ,
γ d = γ d / 1 n d i = 1 n d I P d i 2 ,
where, γ d is set to 1.

2.2.4. Integration of miRNAs and Diseases Similarity

Considering that some miRNAs have no function similarity to each other, and similarly, some diseases have no semantic similarity to each other, this can lead to a large number of sparse values in the miRNA function similarity matrix and disease semantic similarity matrix. To solve the above problem, we define the integrated similarity between miRNA m i and m j and the integrated similarity between diseases d i and d j by integrating the Gaussian interaction profile kernel similarity obtained from prior calculations as follows:
S m m i , m j = M F S m i , m j , if m i and m j have function similarity G M S m i , m j , otherwise ,
S d d i , d j = D S S d i , d j , if d i and d j have semantic similarity G D S d i , d j , otherwise .

2.3. SGAEMDA

To predict the potential association of miRNAs with diseases, we propose the stacked graph autoencoder miRNA–disease association prediction model (SGAEMDA) in this study. To successfully extract potential information in the similarity network and forecast miRNA–disease associations, the model integrates a graph convolutional network-based autoencoder with a multilayer perceptron. SGAEMDA is typically comprised of the following steps: (1) Construct initial features. (2) Pre-train stacked graph autoencoder to extract miRNA and disease similarity potential features. (3) Concatenate potential features and association features. (4) Predict miRNA-disease.
(1)
Construct initial features
We construct the initial features of miRNAs and diseases from two different perspectives: Association information and similarity information. First, for the miRNA-disease association matrix A, each row can be regarded as the association feature of miRNA and each column as the association feature of disease. For the miRNA integrative similarity matrix S m and the disease integrative similarity matrix S d , each row of S m can be regarded as the similarity feature of miRNA, and each row of S d can be regarded as the similarity feature of disease. Specifically, the two initial feature vectors of miRNAs and diseases are shown as follows:
F ϕ = v 1 , v 2 , v 3 , , v n ϕ ,
where { 1 , 2 } , when = 1 , F ϕ 1 denotes the association feature of miRNA or disease, and when = 2 , F ϕ 2 denotes the functional similarity feature of miRNA or semantic similarity feature of disease. ϕ { m , d } , ϕ = m represents miRNA features and ϕ = d represents disease features, and n m 1 , n d 1 , n m 2 , n d 2 are the number of columns and rows of A, the number of columns of S m , and the number of columns of S d , i.e., 383, 495, 495, and 383, respectively.
(2)
Pre-train stacked graph autoencoder
Referring to a previous study [39], graph autoencoder can learn the low-dimensional feature representation of graph nodes to find the appropriate embedding. Since the information in the similarity features of miRNAs and diseases is high-dimensional, this could affect the prediction accuracy of the prediction model. We propose the stacked graph autoencoder to extract the low-dimensional similarity potential features from it, which has a stronger feature extraction ability than the traditional graph autoencoder. The graph autoencoder is particularly suitable for datasets with large numbers of unlabeled data and small numbers of labeled data due to its unsupervised training method. Specifically, the encoder and decoder for each layer of the autoencoder are defined as follows:
Enc ( A , Y ) = tanh A · ReLU A Y W 0 W 1 ,
and
Dec ( A , Y ) = sigmoid A · ReLU A Y W 2 W 3 ,
where A , Y , W denote the adjacency matrix, feature matrix of the node, and the learnable parameter matrix. Therefore, the feature representation of miRNA, Z m l can be learned by the above encoder–decoder structure as follows:
Z m l = Enc m ( A m , Z m l 1 ) ,
and
X m l = Dec m ( A m , Z m l ) ,
where l denotes the number of layers of the graph autoencoder, l = 1 , 2 L , Z m l denotes the low-dimensional feature representation learned by the lth layer of the graph autoencoder, when 1 = 1 , Z m 0 , i.e., F m 2 , X m l denotes the miRNA feature representation reconstructed by the lth layer of the autoencoder, and A m denotes the Laplace-normalized miRNA adjacency matrix. The formula is as follows:
A m = D m 1 / 2 S m D m 1 / 2 ,
where D m is the degree matrix of miRNA-integrated similarity matrix S m .
Similarly, we learn the low-dimensional feature representation Z d l of the disease by the stacked graph autoencoder of the same architecture as follows:
Z d l = Enc d A d , Z d l 1 ,
and
X d l = Dec d ( A d , Z d l ) ,
where Z d l denotes the low-dimensional feature representation learned by the lth layer graph autoencoder, when l = 1 , Z d 0 , i.e., F d 2 , X d l denotes the disease feature representation reconstructed by the lth autoencoder, and A d denotes the Laplace-normalized adjacency matrix of the disease. The formula is as follows:
A d = D d 1 / 2 S d D d 1 / 2 .
In this study, SGAE is constructed by stacking three graph autoencoders, i.e., L = 3 . Specifically, the feature representation generated by the first graph autoencoder is taken as input to the second autoencoder, which generates another feature representation of lower dimensionality, and so on, until L graph autoencoders are constructed. Multiple graph autoencoders are trained collaboratively based on the reconstruction loss function to generate the final low-dimensional similarity feature representations of miRNA and disease, Z m L and Z d L , with the following equations:
Loss m = l = 1 L Z m l 1 X m l 2 ,
Loss d = l = 1 L Z d l 1 X d l 2 .
(3)
Concatenate potential features and association features
We set the final embedding dimension to 64 in pre-training, and the training obtained a low-dimensional similarity representation of all miRNAs and diseases, denoted as Z m L , Z d L , respectively. To include more potential information in the feature representations of miRNAs and diseases, we concatenated Z m L and Z d L with the association feature F m 1 of miRNAs and the association feature F d 1 of diseases, respectively, and finally obtained a 447-dimensional miRNA embedding and a 559-dimensional disease embedding, as follows:
V m = concatenating Z m L , F m 1 ,
and
V d = concatenating Z d L , F d 1 ,
where V m denotes the final embedding of miRNA and V d denotes the final embedding of disease.
(4)
Predict miRNA-disease association by multilayer perceptron
After obtaining the embedding of miRNAs and diseases, we concatenate the embedding V m i for each miRNA and V d j for each disease to form our complete dataset X , where X R ( 495 383 ) × ( 447 + 559 ) , as follows:
X i j = concatenating V m i , V d j ,
where X i j denotes the characteristics of miRNA-disease pairs of miRNA m i and disease d j . Then, we used a multilayer perceptron (MLP) to score the final miRNA-disease association for prediction, as follows:
X l = ReLU X l 1 W l + b l ,
and
y ^ i j = Sigmoid X 2 W 3 + b 3 ,
where l [ 1 , 2 ] denotes the number of layers of the hidden layer, X l denotes the output of the lth hidden layer, and W l , b l are the learnable parameter matrix and bias of the lth hidden layer, respectively. y ^ i j is the prediction score of the final miRNA-disease pair. Finally, the model is trained by minimizing the error of the Binary Cross-Entropy Loss function:
L o s s = 1 N ( i , j ) y + y i j log y ^ i j + ( i , j ) y 1 y i j log 1 y ^ i j ,
where ( i , j ) denotes the pair for miRNA m i and disease d j . y + and y subtables denote the positive and negative sample sets. N denotes the number of all miRNA-disease pairs in the positive and negative sample sets.

3. Results

3.1. Experiment Details

In our experiments, the SGAEMDA model is implemented based on the pytorch framework and the scikit-learn framework. The Adam optimizer is adopted to minimize the loss function both during the pre-training process and the MLP training process. Due to the significant imbalance of positive and negative samples in the database of HMDD v 2.0 , the number of known miRNA–disease associations is 5430 (positive samples), and the rest of the 184,155 pairs are unknown associations (negative samples), and the number of negative samples is about 34 times the positive samples. In order to have good robustness of our model, we randomly selected negative samples equal to the positive samples for MLP training, and randomly selected 10 times in the subsequent experiments to ensure the reliability of our experiments. Our source code of HSSG is available online: https://github.com/Lynn0424/SGAEMDA (accessed on 5 December 2022).

3.2. Evaluation Metrics

The area under the receiver operating characteristic curve (AUC) and area under precision–recall curve (AUPR) were our main metrics to evaluate the overall model performance. In classification problems, AUC is an essential method to evaluate the overall performance of a model, and for unbalanced data sets, AUPR can evaluate the model better than AUC. In order to be more comprehensive in evaluating the performance of the SGAEMDA model, we also used several common evaluation metrics such as accuracy (Acc), precision (Pre), recall (Rec), and F1-score. Several metrics are calculated as follows:
Acc = T P + T N T P + T N + F P + F N ,
Pre = T P T P + F P ,
Rec = T P T P + F N ,
F 1 - score = 2 × Pre × Rec Pre + Rec ,
where TP, TN, FP, FN denote true positive, false negative, false positive, and true negative, respectively.

3.3. Prediction of miRNA–Disease Association Based on SGAEMDA

To obtain reliable experimental results of the model, we performed 5-fold cross-validation and 10-fold cross-validation to evaluate the model performance of SGAEMDA. In 5-fold CV (10-fold CV ) , all the training samples are randomly divided into 5 (10) subsets of approximately the same number, 4 (9) of them are chosen for training and the remaining 1 is chosen for testing, and the process is repeated until all the subsets have been used for the test set, and finally the obtained results are averaged as the final result. Figure 2 and Figure 3 show the ROC curves and PR curves for the 5-fold CV and 10-fold CV and the area under their curves. It can be seen that our model has an AUC above 0.95 for both 5-fold CV and 10-fold CV , indicating the effectiveness of the model in predicting the potential miRNA-disease association and implying that the model performance is not affected by the amount of training data and test data in cross-validation. Table 1 shows the average results of other evaluation metrics and their standard deviations for 5-fold CV and 10-fold CV , indicating the ACC, Pre, Rec, F1-score of SGAEMDA at 5-fold CV (10-fold CV ) of 0.9045 (0.9087), 0.9037 (0.8949), 0.9056 (0.9272), 0.9046 (0.9104). The SGAEMDA model was further demonstrated to be effective for association prediction.

3.4. Effect of Similarity Feature Dimensions

To further illustrate the effect of the final dimensionality of the similarity features on the model prediction performance, we set the dimensionality of the similarity features learned by the stacked graph autoencoder to 16, 32, 64, 128, 256 for comparison experiments, and calculate their AUC and AUPR, respectively. The experimental results are shown in Figure 4, and both AUC and AUPR reach the highest value when the dimension is 64. Therefore, we set the final learned similarity feature dimension to 64. In addition, we can infer that if the dimension is too small, it cannot fully learn the similarity information; while if the dimension is too large, there may be original redundant and noisy information, leading to lower model performance.

3.5. Effect of Stacked Graph Autoencoder Pre-Training

In SGAEMDA, to verify the validity of our proposed stacked graph autoencoder for miRNA–disease potential association prediction. We designed three groups of experiments. The first one uses only the potential similarity features Z m L and Z d L obtained by pre-training and uses them directly as the final embedding of miRNAs and diseases for prediction, denoted as only-pre-training. The second group is a direct concatenation of the original similarity features F m 2 and F d 2 and association features F m 1 and F d 1 for prediction without using stacked graph autoencoder, denoted as non-pre-training. The third group uses only the original association features F m 1 and F d 1 to predict the potential association, which is denoted as only-original feature. The fourth group of experiments uses pre-trained features Z m L and Z d L and association features F m 1 and F d 1 , i.e., the SGAEMDA model.
Figure 5 and Table 2 show the prediction results of the four models. We can see that the SGAEMDA model is only slightly lower than the only-original feature model in Recall, but reaches the highest value in all the rest of the metrics. AUC and AUPR are more reflective of the overall performance of the model, so integrating the features learned by stacked autoencoder and association features can enable the model to achieve better performance.

3.6. Comparison of Different Classifier Models

In the SGAEMDA model, we used a multilayer perceptron (MLP) classifier to predict the potential miRNA–disease association. To confirm the reasonability of our adopted MLP, we used cross-validation with the same dataset for comparison with four common classifier models, which are random forest (RF), support vector machine (SVM), K-nearest neighbor (KNN), and XGBoost algorithm. We refer to the Liu et al. [21] proposed model to select the best parameters for different classifiers. In the RF algorithm, we set the maximum depth of the tree to 10, the maximum features to 100, and the rest of the parameters to default values. In the SVM algorithm, we use the RBF kernel and set C to 50. In the XGBoost algorithm, we set the number of trees to 1000, the learning rate to 0.1, and the rest of the parameters to their default values. For the KNN classifier, we performed a parameter sensitivity analysis and finally set the K value to 4, the p-value to 2, and the rest of the parameters to their default values. Table 3 shows the prediction performance of these classifiers. It can be seen that SGAEMDA achieves the highest results in four of the five evaluated metrics, and only in the accuracy rate it is 2.07% lower than the KNN classifier. However, in terms of potential association prediction, AUC and AUPR are more likely to show the overall model performance. Therefore, we selected MLP as our final classifier.

3.7. Comparisons with Existing SOTA Methods

To further prove the predictive performance of our proposed SGAEMDA model, we compare it with nine state-of-the-art existing computational models, namely LAGCN [28], GBDT-LR [19], EKRRMDA [20], MCLPMDA [29], GAEMDA [25], PMDFI [22], SMALF [21], DAEMKL [26], and DFELMDA [23]. Since the AUC values provide a comprehensive measure of the overall predictive performance of the models, we selected the AUC as a metric to evaluate the performance of these models (all AUC values were selected from their papers by taking their best values). In addition, the above models are all evaluated based on HMDDv2.0 on the five-fold cross-validation basis. Table 4 shows the comparative results of the models. From the table, we see that SGAEMDA achieved the highest AUC value among the 10 models, which is 3.3% higher than the second-best model (DFELMDA). In conclusion, SGAEMDA has very good results in predicting potential miRNA–disease associations.

3.8. Case Studies

We selected four neoplastic diseases as case studies: brain neoplasms (Table 5), breast neoplasms (Table 6), colon neoplasms (Table 7), and kidney neoplasms (Table 8). Specifically, there are 5430 known miRNA-disease associations in the HMDDv2.0 database, while the remaining 184,155 associations are unknown. The known associations obtained from the database were used as the training set for SGAEMDA, and then we prioritized the candidate miRNAs for several neoplasms based on the prediction scores and selected the top 20 candidate miRNAs. We verified the predicted experimental results one by one by using the dbDEMCv3.0 database [40] and the miRCancer database [41] as validation sets.
Brain neoplasms are defined as a neoplasm growing in the cranial cavity, also known as brain cancer and intracranial neoplasm. They are generally divided into two categories: primary and secondary [42]. Statistics show that the incidence of brain neoplasm has been increasing in recent years, and brain neoplasm accounts for about 5% of the total body neoplasms, other malignant neoplasms in the body have a 20–30% probability to metastasize into the skull, once the neoplasm occupies a certain space in the skull, regardless of benign or malignant neoplasm, it will endanger the life of patients. According to statistics, the incidence of brain neoplasms has been increasing in recent years. Brain neoplasms account for about 5% of the whole-body neoplasms, and all other malignant tumors in the body have a 20–30% chance of metastasizing to the skull. Therefore, a research priority was given to investigate miRNAs that may be associated with brain cancer. The results are shown in Table 5. Among the top 20 miRNAs associated with brain cancer, 19 of them are confirmed by dbDEMC or miRCancer.
It is estimated that breast neoplasms account for 7–10% of all malignant tumors in the body. Its incidence is generally associated with genetics and is higher in women between 40–60 years of age [43,44]. Thus, the discovery of potential miRNAs associated with breast neoplasms provides direction for the treatment and diagnosis of breast neoplasms. The results are shown in Table 6 and all 20 of the predicted miRNAs associated with breast cancer are confirmed.
Colon cancer, also known as colorectal cancer, is a malignant neoplasm of the gastrointestinal tract that occurs in the colon area. The incidence of colon neoplasms is statistically second only to gastric and esophageal cancers [45]. As shown in Table 7, it can be seen that 19 of the top 20 miRNAs predicted to be potentially associated with colon cancer are confirmed.
Kidney neoplasms have a high incidence in western countries [46]. In addition, about 95% of renal neoplasms are malignant, the pathology of kidney tumors is more complex, and it is more challenging to treat kidney tumors. Table 8 shows that 19 of the top 20 miRNAs were validated by the database.
In addition, to further validate the performance of our model, we downloaded miRNAseq data for BRCA (breast invasive carcinoma) and COADREAD (colorectal cancer) from the TCGA database. Based on the downloaded data, we compared the differential expression between the top 10 miRNA paracancer sample groups that we predicted. The results of differential expression are shown in Figure 6.

4. Discussion

In the past, many studies have shown that aberrant miRNA expression is often associated with many biological processes as well as the occurrence of complex diseases in humans with considerable impact. Thus, predicting potential miRNA-disease associations can help medical professionals provide molecular insight into the pathogenesis of various complex diseases and thus develop relevant new drugs. In this paper, we propose the SGAEMDA model, a novel model based on a stacked graph autoencoder. Unlike previous stacked-autoencoders, SGAE is not trained layer-by-layer but in collaboration with each layer, which makes up for the drawback of weak coding ability due to greedy training of previous stacked-autoencoders. It can extract potential feature representations from miRNA similarity networks and disease similarity networks at a deeper level. The extracted features are concatenated with the corresponding association features and then MLP is used to predict the association between miRNA and diseases. After experiments, it is shown that the highest AUC value of SGAEMDA, which reached 0.9585 under the 5-fold and 10-fold cross-validation. is much higher than the other baseline methods. The case study analysis experimentally confirmed that our model can effectively predict the potential miRNA-disease association. However, our work still has some areas for improvement:
(1)
The model is not trained end-to-end, and our model may be lower in robustness.
(2)
The data used in the experiments are fewer and unable to extract more information about miRNAs and diseases from more perspectives.
In future studies, we will fuse more miRNA and disease similarity information to further improve the performance of our prediction models. Moreover, we will utilize a scheme similar to the EGES model [47] to allow embedding to cover more miRANs and diseases, thus addressing the cold-start problem in genetic disease association prediction.

Author Contributions

Conceptualization, S.W. and B.L.; methodology, B.L. and Y.Z.; software, B.L.; validation, B.L. and F.W.; investigation, W.W. and C.R.; resources, S.W.; data curation, B.L. and C.R.; writing—original draft preparation, B.L.; writing—review and editing, Y.Z.; visualization, F.W. and W.W.; supervision, B.L. and S.Q.; project administration, S.W. and S.Q.; funding acquisition, S.W. All authors have read and agreed to the published version of the manuscript.

Funding

This work was partially supported by the National Natural Science Foundation of China [Grant Nos. 61902430, 61873281].

Institutional Review Board Statement

Not applicable.

Informed Consent Statement

Not applicable.

Data Availability Statement

Known miRNA–disease association data were taken from database HMDD 2.0 (http://www.cuilab.cn/hmdd, accessed on 23 May 2022), human microRNA functional similarity (http://www.lirmed.com/misim/, accessed on 23 May 2022), and disease semantic similarity (https://www.nlm.nih.gov/mesh/, accessed on 23 May 2022).

Conflicts of Interest

The authors declare no conflict of interest.

Abbreviations

The following abbreviations are used in this manuscript:
MDAMiRNA-disease association
MLPMultilayer perceptron
CVCross-validation
DAGDirected acyclic graph
GCNGraph convolutional networks
AUCArea under curve
AUPRArea under precision-recall

References

  1. Ponting, C.P.; Oliver, P.L.; Reik, W. Evolution and functions of long noncoding RNAs. Cell 2009, 136, 629–641. [Google Scholar] [CrossRef] [Green Version]
  2. Esteller, M. Non-coding RNAs in human disease. Nat. Rev. Genet. 2011, 12, 861–874. [Google Scholar] [CrossRef]
  3. Ambros, V. The functions of animal microRNAs. Nature 2004, 431, 350–355. [Google Scholar] [CrossRef]
  4. Lynam-Lennon, N.; Maher, S.G.; Reynolds, J.V. The roles of microRNA in cancer and apoptosis. Biol. Rev. Camb. Philos. Soc. 2009, 84, 55–71. [Google Scholar] [CrossRef]
  5. Sayed, D.; Abdellatif, M. MicroRNAs in development and disease. Physiol. Rev. 2011, 91, 827–887. [Google Scholar] [CrossRef]
  6. Yu, J.; Moriyama, T.; Ohuchida, K.; Cui, L.; Nakamura, M.; Takahata, S.; Nagai, E.; Mizumoto, K.; Tanaka, M. 430 Micro RNA (miR-17-5p) is Overexpressed in Pancreatic Cancer, and Upregulation of miR-17-5p Enhanced Cancer Cell Proliferation and Invasion In Vitro. Gastroenterology 2008, 134, A-62. [Google Scholar] [CrossRef]
  7. Iorio, M.V.; Ferracin, M.; Liu, C.G.; Veronese, A.; Spizzo, R.; Sabbioni, S.; Magri, E.; Pedriali, M.; Fabbri, M.; Campiglio, M.; et al. MicroRNA gene expression deregulation in human breast cancer. Cancer Res. 2005, 65, 7065–7070. [Google Scholar] [CrossRef] [Green Version]
  8. Cressatti, M.; Juwara, L.; Galindez, J.M.; Velly, A.M.; Schipper, H.M. Salivary microR-153 and microR-223 Levels as Potential Diagnostic Biomarkers of Idiopathic Parkinson’s Disease. Mov. Disord. 2019, 35, 468–477. [Google Scholar] [CrossRef]
  9. Guay, C.; Regazzi, R. MicroRNAs and the functional β cell mass: For better or worse. Diabetes Metab. 2015, 41, 369–377. [Google Scholar] [CrossRef] [Green Version]
  10. Horsham, J.L.; Ganda, C.; Kalinowski, F.C.; Brown, R.A.M.; Epis, M.R.; Leedman, P.J. MicroRNA-7: A miRNA with expanding roles in development and disease. Int. J. Biochem. Cell Biol. 2015, 69, 215–224. [Google Scholar] [CrossRef]
  11. Romsos, E.L.; Vallone, P.M. Rapid PCR of STR markers: Applications to human identification. Forensic Sci. Int. Genet. 2015, 18, 90–99. [Google Scholar] [CrossRef]
  12. Zhang, X.; Ping, X.; Zhuang, H. Ultrasensitive Nano-rt-iPCR for Determination of Polybrominated Diphenyl Ethers in Natural Samples. Sci. Rep. 2017, 7, 12031. [Google Scholar] [CrossRef] [Green Version]
  13. Rupprom, K.; Chavalitshewinkoon-Petmitr, P.; Diraphat, P.; Kittigul, L. Evaluation of real-time RT-PCR assays for detection and quantification of norovirus genogroups I and II. Virol. Sin. 2017, 139–146. [Google Scholar] [CrossRef]
  14. Zhang, X.; Wang, G.; Meng, X.; Wang, S.; Zhang, Y.; Rodriguez-Paton, A.; Wang, J.; Wang, X. Molormer: A lightweight self-attention-based method focused on spatial structure of molecular graph for drug–drug interactions prediction. Brief. Bioinform. 2022, 23, bbac296. [Google Scholar] [CrossRef]
  15. Song, T.; Zhang, X.; Ding, M.; Rodriguez-Paton, A.; Wang, S.; Wang, G. DeepFusion: A deep learning based multi-scale feature fusion method for predicting drug-target interactions. Methods 2022, 204, 269–277. [Google Scholar] [CrossRef]
  16. Yu, Z.; Huang, F.; Zhao, X.; Xiao, W.; Zhang, W. Predicting drug–disease associations through layer attention graph convolutional network. Brief. Bioinform. 2020, 22, bbaa243. [Google Scholar] [CrossRef]
  17. Fan, Y.; Cui, J.; Zhu, Q. Heterogeneous graph inference based on similarity network fusion for predicting lncRNA–miRNA interaction. RSC Adv. 2020, 10, 11634–11642. [Google Scholar] [CrossRef] [Green Version]
  18. Yu, L.; Zheng, Y.; Ju, B.; Ao, C.; Gao, L. Research progress of miRNA–disease association prediction and comparison of related algorithms. Brief. Bioinform. 2022, 10, bbac066. [Google Scholar] [CrossRef]
  19. Zhou, S.; Wang, S.; Wu, Q.; Azim, R.; Li, W. Predicting potential miRNA-disease associations by combining gradient boosting decision tree with logistic regression. Comput. Biol. Chem. 2020, 85, 107200. [Google Scholar] [CrossRef]
  20. Peng, L.; Zhou, L.; Chen, X.; Piao, X. A Computational Study of Potential miRNA-Disease Association Inference Based on Ensemble Learning and Kernel Ridge Regression. Front. Bioeng. Biotechnol. 2020, 8, 40. [Google Scholar] [CrossRef] [PubMed]
  21. Liu, D.; Huang, Y.; Nie, W.; Zhang, J.; Deng, L. SMALF: miRNA-disease associations prediction based on stacked autoencoder and XGBoost. BMC Bioinform. 2021, 22, 219. [Google Scholar] [CrossRef] [PubMed]
  22. Tang, M.; Liu, C.; Liu, D.; Liu, J.; Liu, J.; Deng, L. PMDFI: Predicting miRNA–Disease Associations Based on High-Order Feature Interaction. Front. Genet. 2021, 12, 656107. [Google Scholar] [CrossRef]
  23. Liu, W.; Lin, H.; Huang, L.; Peng, L.; Tang, T.; Zhao, Q.; Yang, L. Identification of miRNA–disease associations via deep forest ensemble learning based on autoencoder. Brief. Bioinform. 2022, 23, bbac104. [Google Scholar] [CrossRef]
  24. Xuan, P.; Sun, H.; Wang, X.; Zhang, T.; Pan, S. Inferring the Disease-Associated miRNAs Based on Network Representation Learning and Convolutional Neural Networks. Int. J. Mol. Sci. 2019, 20, 3648. [Google Scholar] [CrossRef] [Green Version]
  25. Li, Z.; Li, J.; Nie, R.; You, Z.H.; Bao, W. A graph auto-encoder model for miRNA-disease associations prediction. Brief. Bioinform. 2021, 22, bbaa240. [Google Scholar] [CrossRef] [PubMed]
  26. Zhou, F.; Yin, M.M.; Jiao, C.N.; Zhao, J.X.; Zheng, C.H.; Liu, J.X. Predicting miRNA-Disease Associations Through Deep Autoencoder with Multiple Kernel Learning. IEEE Trans. Neural Netw. Learn. Syst. 2021. [Google Scholar] [CrossRef] [PubMed]
  27. Li, G.; Fang, T.; Zhang, Y.; Liang, C.; Xiao, Q.; Luo, J. Predicting miRNA-disease associations based on graph attention network with multi-source information. BMC Bioinform. 2022, 23, 244. [Google Scholar] [CrossRef]
  28. Han, H.; Zhu, R.; Liu, J.X.; Dai, L.Y. Predicting miRNA-disease associations via layer attention graph convolutional network model. BMC Med. Inform. Decis. Mak. 2022, 22, 69. [Google Scholar] [CrossRef]
  29. Yu, S.P.; Liang, C.; Xiao, Q.; Li, G.H.; Ding, P.J.; Luo, J.W. MCLPMDA: A novel method for mi RNA-disease association prediction based on matrix completion and label propagation. J. Cell. Mol. Med. 2019, 23, 1427–1438. [Google Scholar] [CrossRef]
  30. Gao, Y.L.; Cui, Z.; Liu, J.X.; Wang, J.; Zheng, C.H. NPCMF: Nearest profile-based collaborative matrix factorization method for predicting miRNA-disease associations. BMC Bioinform. 2019, 20, 353. [Google Scholar] [CrossRef]
  31. Chen, X.; Sun, L.G.; Zhao, Y. NCMCMDA: miRNA–disease association prediction through neighborhood constraint matrix completion. Brief. Bioinform. 2021, 22, 485–496. [Google Scholar] [CrossRef] [PubMed]
  32. Yin, M.M.; Cui, Z.; Gao, M.M.; Liu, J.X.; Gao, Y.L. LWPCMF: Logistic weighted profile-based collaborative matrix factorization for predicting MiRNA-disease associations. IEEE/ACM Trans. Comput. Biol. Bioinform. 2019, 18, 1122–1129. [Google Scholar] [CrossRef] [PubMed]
  33. Yu, S.; Wang, M.; Pang, S.; Song, L.; Zhai, X.; Zhao, Y. TDMSAE: A transferable decoupling multi-scale autoencoder for mechanical fault diagnosis. Mech. Syst. Signal Process. 2023, 185, 109789. [Google Scholar] [CrossRef]
  34. Yu, S.; Wang, M.; Pang, S.; Song, L.; Qiao, S. Intelligent fault diagnosis and visual interpretability of rotating machinery based on residual neural network. Measurement 2022, 196, 111228. [Google Scholar] [CrossRef]
  35. Li, Y.; Qiu, C.; Tu, J.; Geng, B.; Yang, J.; Jiang, T.; Cui, Q. HMDD v2.0: A database for experimentally supported human microRNA and disease associations. Nucleic Acids Res. 2014, 42, D1070–D1074. [Google Scholar] [CrossRef] [Green Version]
  36. Wang, D.; Wang, J.; Lu, M.; Song, F.; Cui, Q. Inferring the human microRNA functional similarity and functional network based on microRNA-associated diseases. Bioinformatics 2010, 26, 1644–1650. [Google Scholar] [CrossRef] [Green Version]
  37. Xuan, P.; Han, K.; Guo, M.; Guo, Y.; Li, J.; Ding, J.; Liu, Y.; Dai, Q.; Li, J.; Teng, Z.; et al. Prediction of microRNAs associated with human diseases based on weighted k most similar neighbors. PLoS ONE 2013, 8, e70204. [Google Scholar] [CrossRef]
  38. Van Laarhoven, T.; Nabuurs, S.B.; Marchiori, E. Gaussian interaction profile kernels for predicting drug–target interaction. Bioinformatics 2011, 27, 3036–3043. [Google Scholar] [CrossRef] [Green Version]
  39. Kipf, T.N.; Welling, M. Variational graph auto-encoders. arXiv 2016, arXiv:1611.07308. [Google Scholar]
  40. Xu, F.; Wang, Y.; Ling, Y.; Zhou, C.; Wang, H.; Teschendorff, A.E.; Zhao, Y.; Zhao, H.; He, Y.; Zhang, G.; et al. dbDEMC 3.0: Functional exploration of differentially expressed miRNAs in cancers of human and model organisms. Genom. Proteom. Bioinform. 2022. [Google Scholar] [CrossRef]
  41. Xie, B.; Ding, Q.; Han, H.; Wu, D. miRCancer: A microRNA–cancer association database constructed by text mining on literature. Bioinformatics 2013, 29, 638–644. [Google Scholar] [CrossRef] [PubMed]
  42. Galderisi, U.; Cipollaro, M.; Giordano, A. Stem cells and brain cancer. Cell Death Differ. 2006, 13, 5–11. [Google Scholar] [CrossRef] [PubMed] [Green Version]
  43. Bray, F.; Ferlay, J.; Soerjomataram, I.; Siegel, R.L.; Torre, L.A.; Jemal, A. Global cancer statistics 2018: GLOBOCAN estimates of incidence and mortality worldwide for 36 cancers in 185 countries. CA Cancer J. Clin. 2018, 68, 394–424. [Google Scholar] [CrossRef] [PubMed] [Green Version]
  44. Anastasiadi, Z.; Lianos, G.D.; Ignatiadou, E.; Harissis, H.V.; Mitsis, M. Breast cancer in young women: An overview. Updat. Surg. 2017, 69, 313–317. [Google Scholar] [CrossRef]
  45. Pita-Fernández, S.; Pértega-Díaz, S.; López-Calviño, B.; Seoane-Pillado, T.; Gago-García, E.; Seijo-Bestilleiro, R.; González-Santamaría, P.; Pazos-Sierra, A. Diagnostic and treatment delay, quality of life and satisfaction with care in colorectal cancer patients: A study protocol. Health Qual. Life Outcomes 2013, 11, 117. [Google Scholar] [CrossRef] [PubMed] [Green Version]
  46. Chow, W.H.; Dong, L.M.; Devesa, S.S. Epidemiology and risk factors for kidney cancer. Nat. Rev. Urol. 2010, 7, 245–257. [Google Scholar] [CrossRef] [Green Version]
  47. Wang, J.; Huang, P.; Zhao, H.; Zhang, Z.; Zhao, B.; Lee, D.L. Billion-scale commodity embedding for e-commerce recommendation in alibaba. In Proceedings of the 24th ACM SIGKDD International Conference on Knowledge Discovery & Data Mining, London, UK, 19–23 August 2018; pp. 839–848. [Google Scholar]
Figure 2. The 5-fold cross-validated ROC curve and PR curve of SGAEMDA model with AUC of 95.85% and AUPR of 95.50%.
Cells 11 03984 g002
Figure 3. The 10-fold cross-validated ROC curve and PR curve of SGAEMDA model with 96.16% AUC and 95.78% AUPR.
Cells 11 03984 g003
Figure 4. AUC and AUPR in different similarity feature dimensions under 5-fold CV.
Cells 11 03984 g004
Figure 5. Comparison of the prediction effect of different models.
Cells 11 03984 g005
Figure 6. The result of the miRNA differential expression. (a) miRNAs ranked 1–10 for breast cancer. (b) miRNAs ranked 1–10 for colon cancer.
Cells 11 03984 g006
Table 1. The 5-fold and 10-fold cross-validation results of the SGAEMDA model.
Cross-
Validation
AccPreRecF1-Score
5-fold CV0.9045 ± 0.0030.9037 ± 0.0080.9056 ± 0.0100.9046 ± 0.004
10-fold CV0.9087 ± 0.0070.8949 ± 0.0220.9272 ± 0.0160.9104 ± 0.006
Table 2. Comparison table of each evaluation metric for different models.
AUCAUPRPreRecF1-Score
only-pre-training0.90310.90710.83940.85820.8486
non-pre-training0.94020.94090.85300.89670.8739
only-original feature0.94220.94420.89200.90760.899
SGAEMDA0.95850.95620.90370.90560.9046
Table 3. Five types of classifier evaluation metrics.
AUCAUPRPreRecF1-Score
RF0.93560.93510.85050.8720.8611
SVM0.9340.9330.86010.85060.8553
KNN0.92820.93990.92440.77030.8401
XGBoost0.95380.95450.88760.88330.8854
SGAEMDA0.95850.95620.90370.90560.9046
Table 4. Comparison of different methods based on 5-fold cross-validation.
MethodAUC(%)
LAGCN90.91
GBDT-LR92.74
EKRRMDA92.75
MCLPMDA93.20
GAEMDA93.56
PMDFI94.04
SMALF95.03
DAEMKL95.38
DFELMDA95.52
SGAEMDA95.85
Table 5. Top 20 brain neoplasm-related miRNAs predicted by SGAEMDA based on HMDD v2.0.
TOP 1-10 miRNAdbDEMCmiRCancerTOP 11-20 miRNAdbDEMCmiRCancer
hsa-mir-221ComfirmedComfirmedhsa-mir-101ComfirmedUncomfirmed
hsa-mir-26bComfirmedUncomfirmedhsa-mir-184ComfirmedUncomfirmed
hsa-mir-106bComfirmedUncomfirmedhsa-mir-218ComfirmedUncomfirmed
hsa-mir-181aComfirmedUncomfirmedhsa-mir-146aComfirmedUncomfirmed
hsa-mir-155ComfirmedUncomfirmedhsa-mir-302bComfirmedUncomfirmed
hsa-mir-148aComfirmedUncomfirmedhsa-mir-206ComfirmedUncomfirmed
hsa-mir-125bComfirmedUncomfirmedhsa-mir-197ComfirmedUncomfirmed
hsa-mir-195ComfirmedUncomfirmedhsa-mir-196aComfirmedUncomfirmed
hsa-mir-210ComfirmedUncomfirmedhsa-mir-410ComfirmedUncomfirmed
hsa-mir-200cUncomfirmedUncomfirmedhsa-mir-214ComfirmedUncomfirmed
Table 6. Top 20 breast neoplasm-related miRNAs predicted by SGAEMDA based on HMDD v2.0.
TOP 1-10 miRNAdbDEMCmiRCancerTOP 11-20 miRNAdbDEMCmiRCancer
hsa-mir-192ComfirmedUncomfirmedhsa-mir-144ComfirmedComfirmed
hsa-mir-212ComfirmedComfirmedhsa-mir-185ComfirmedComfirmed
hsa-mir-138ComfirmedComfirmedhsa-mir-449aComfirmedComfirmed
hsa-mir-15bComfirmedUncomfirmedhsa-mir-98ComfirmedComfirmed
hsa-mir-150ComfirmedComfirmedhsa-mir-542ComfirmedUncomfirmed
hsa-mir-449bComfirmedComfirmedhsa-mir-424ComfirmedUncomfirmed
hsa-mir-106aComfirmedComfirmedhsa-mir-92bComfirmedUncomfirmed
hsa-mir-99aComfirmedComfirmedhsa-mir-181dComfirmedUncomfirmed
hsa-mir-99bComfirmedUncomfirmedhsa-mir-186ComfirmedComfirmed
hsa-mir-130aComfirmedComfirmedhsa-mir-376aComfirmedComfirmed
Table 7. Top 20 colon neoplasm-related miRNAs predicted by SGAEMDA based on HMDD v2.0.
TOP 1-10 miRNAdbDEMCmiRCancerTOP 11-20 miRNAdbDEMCmiRCancer
hsa-mir-15aComfirmedComfirmedhsa-mir-19bComfirmedComfirmed
hsa-mir-106bComfirmedUncomfirmedhsa-mir-195ComfirmedComfirmed
hsa-mir-29bComfirmedUncomfirmedhsa-mir-122ComfirmedUncomfirmed
hsa-mir-92aComfirmedUncomfirmedhsa-mir-26aUncomfirmedUncomfirmed
hsa-mir-20aComfirmedComfirmedhsa-mir-125aComfirmedComfirmed
hsa-mir-16UncomfirmedComfirmedhsa-mir-93ComfirmedComfirmed
hsa-mir-214ComfirmedComfirmedhsa-mir-141ComfirmedComfirmed
hsa-mir-18aComfirmedComfirmedhsa-mir-20bComfirmedUncomfirmed
hsa-mir-148aComfirmedUncomfirmedhsa-mir-10aComfirmedUncomfirmed
hsa-mir-21ComfirmedComfirmedhsa-mir-30bComfirmedUncomfirmed
Table 8. Top 20 kidney neoplasm-related miRNAs predicted by SGAEMDA based on HMDD v2.0.
TOP 1-10 miRNAdbDEMCmiRCancerTOP 11-20 miRNAdbDEMCmiRCancer
hsa-mir-145ComfirmedComfirmedhsa-mir-200bComfirmedUncomfirmed
hsa-mir-29bComfirmedUncomfirmedhsa-mir-126ComfirmedUncomfirmed
hsa-mir-214ComfirmedUncomfirmedhsa-mir-210ComfirmedComfirmed
hsa-mir-106bComfirmedUncomfirmedhsa-mir-195ComfirmedUncomfirmed
hsa-mir-122ComfirmedUncomfirmedhsa-mir-23aComfirmedUncomfirmed
hsa-mir-15bComfirmedUncomfirmedhsa-mir-155ComfirmedUncomfirmed
hsa-mir-106aComfirmedUncomfirmedhsa-mir-375ComfirmedComfirmed
hsa-mir-143ComfirmedUncomfirmedhsa-mir-31ComfirmedUncomfirmed
hsa-mir-1UncomfirmedUncomfirmedhsa-mir-223ComfirmedComfirmed
hsa-mir-429ComfirmedUncomfirmedhsa-mir-212ComfirmedUncomfirmed
Publisher’s Note: MDPI stays neutral with regard to jurisdictional claims in published maps and institutional affiliations.

