
Oxidative Stress and Extracellular Matrix Remodeling Are Signature Pathways of Extracellular Vesicles Released upon Morphine Exposure on Human Brain Microvascular Endothelial Cells
 , , , , and
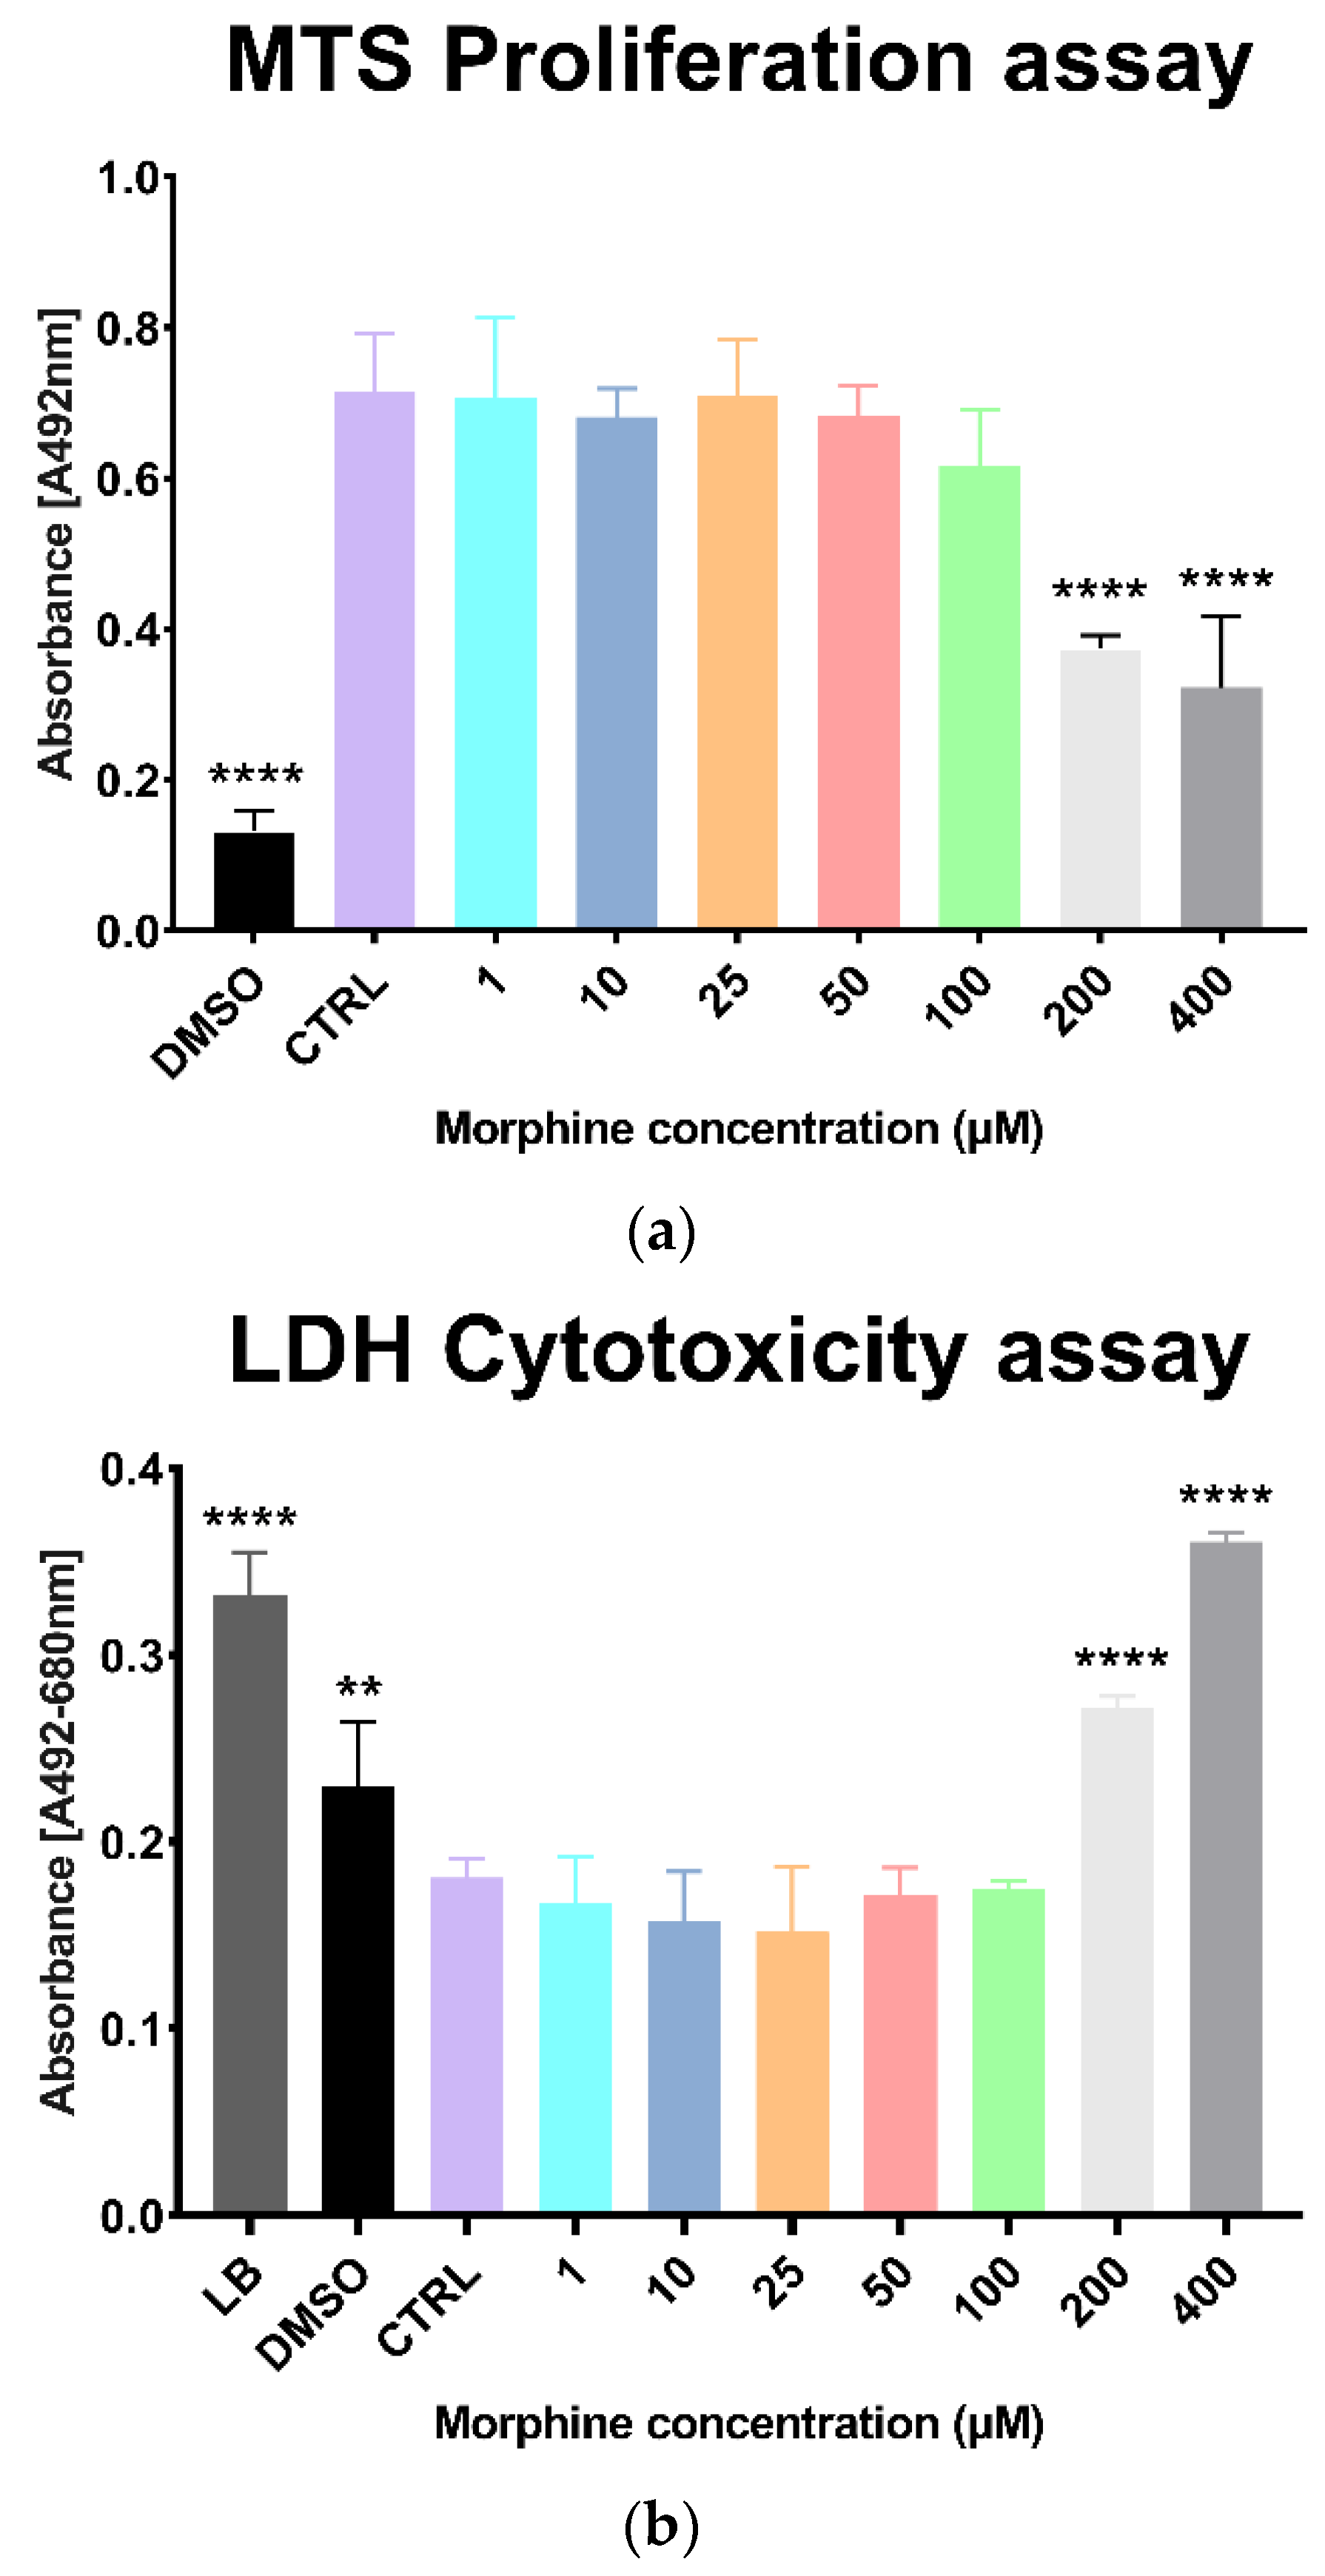
Abstract
:1. Introduction
2. Materials and Methods
2.1. Cell Culture
2.2. EV Isolation
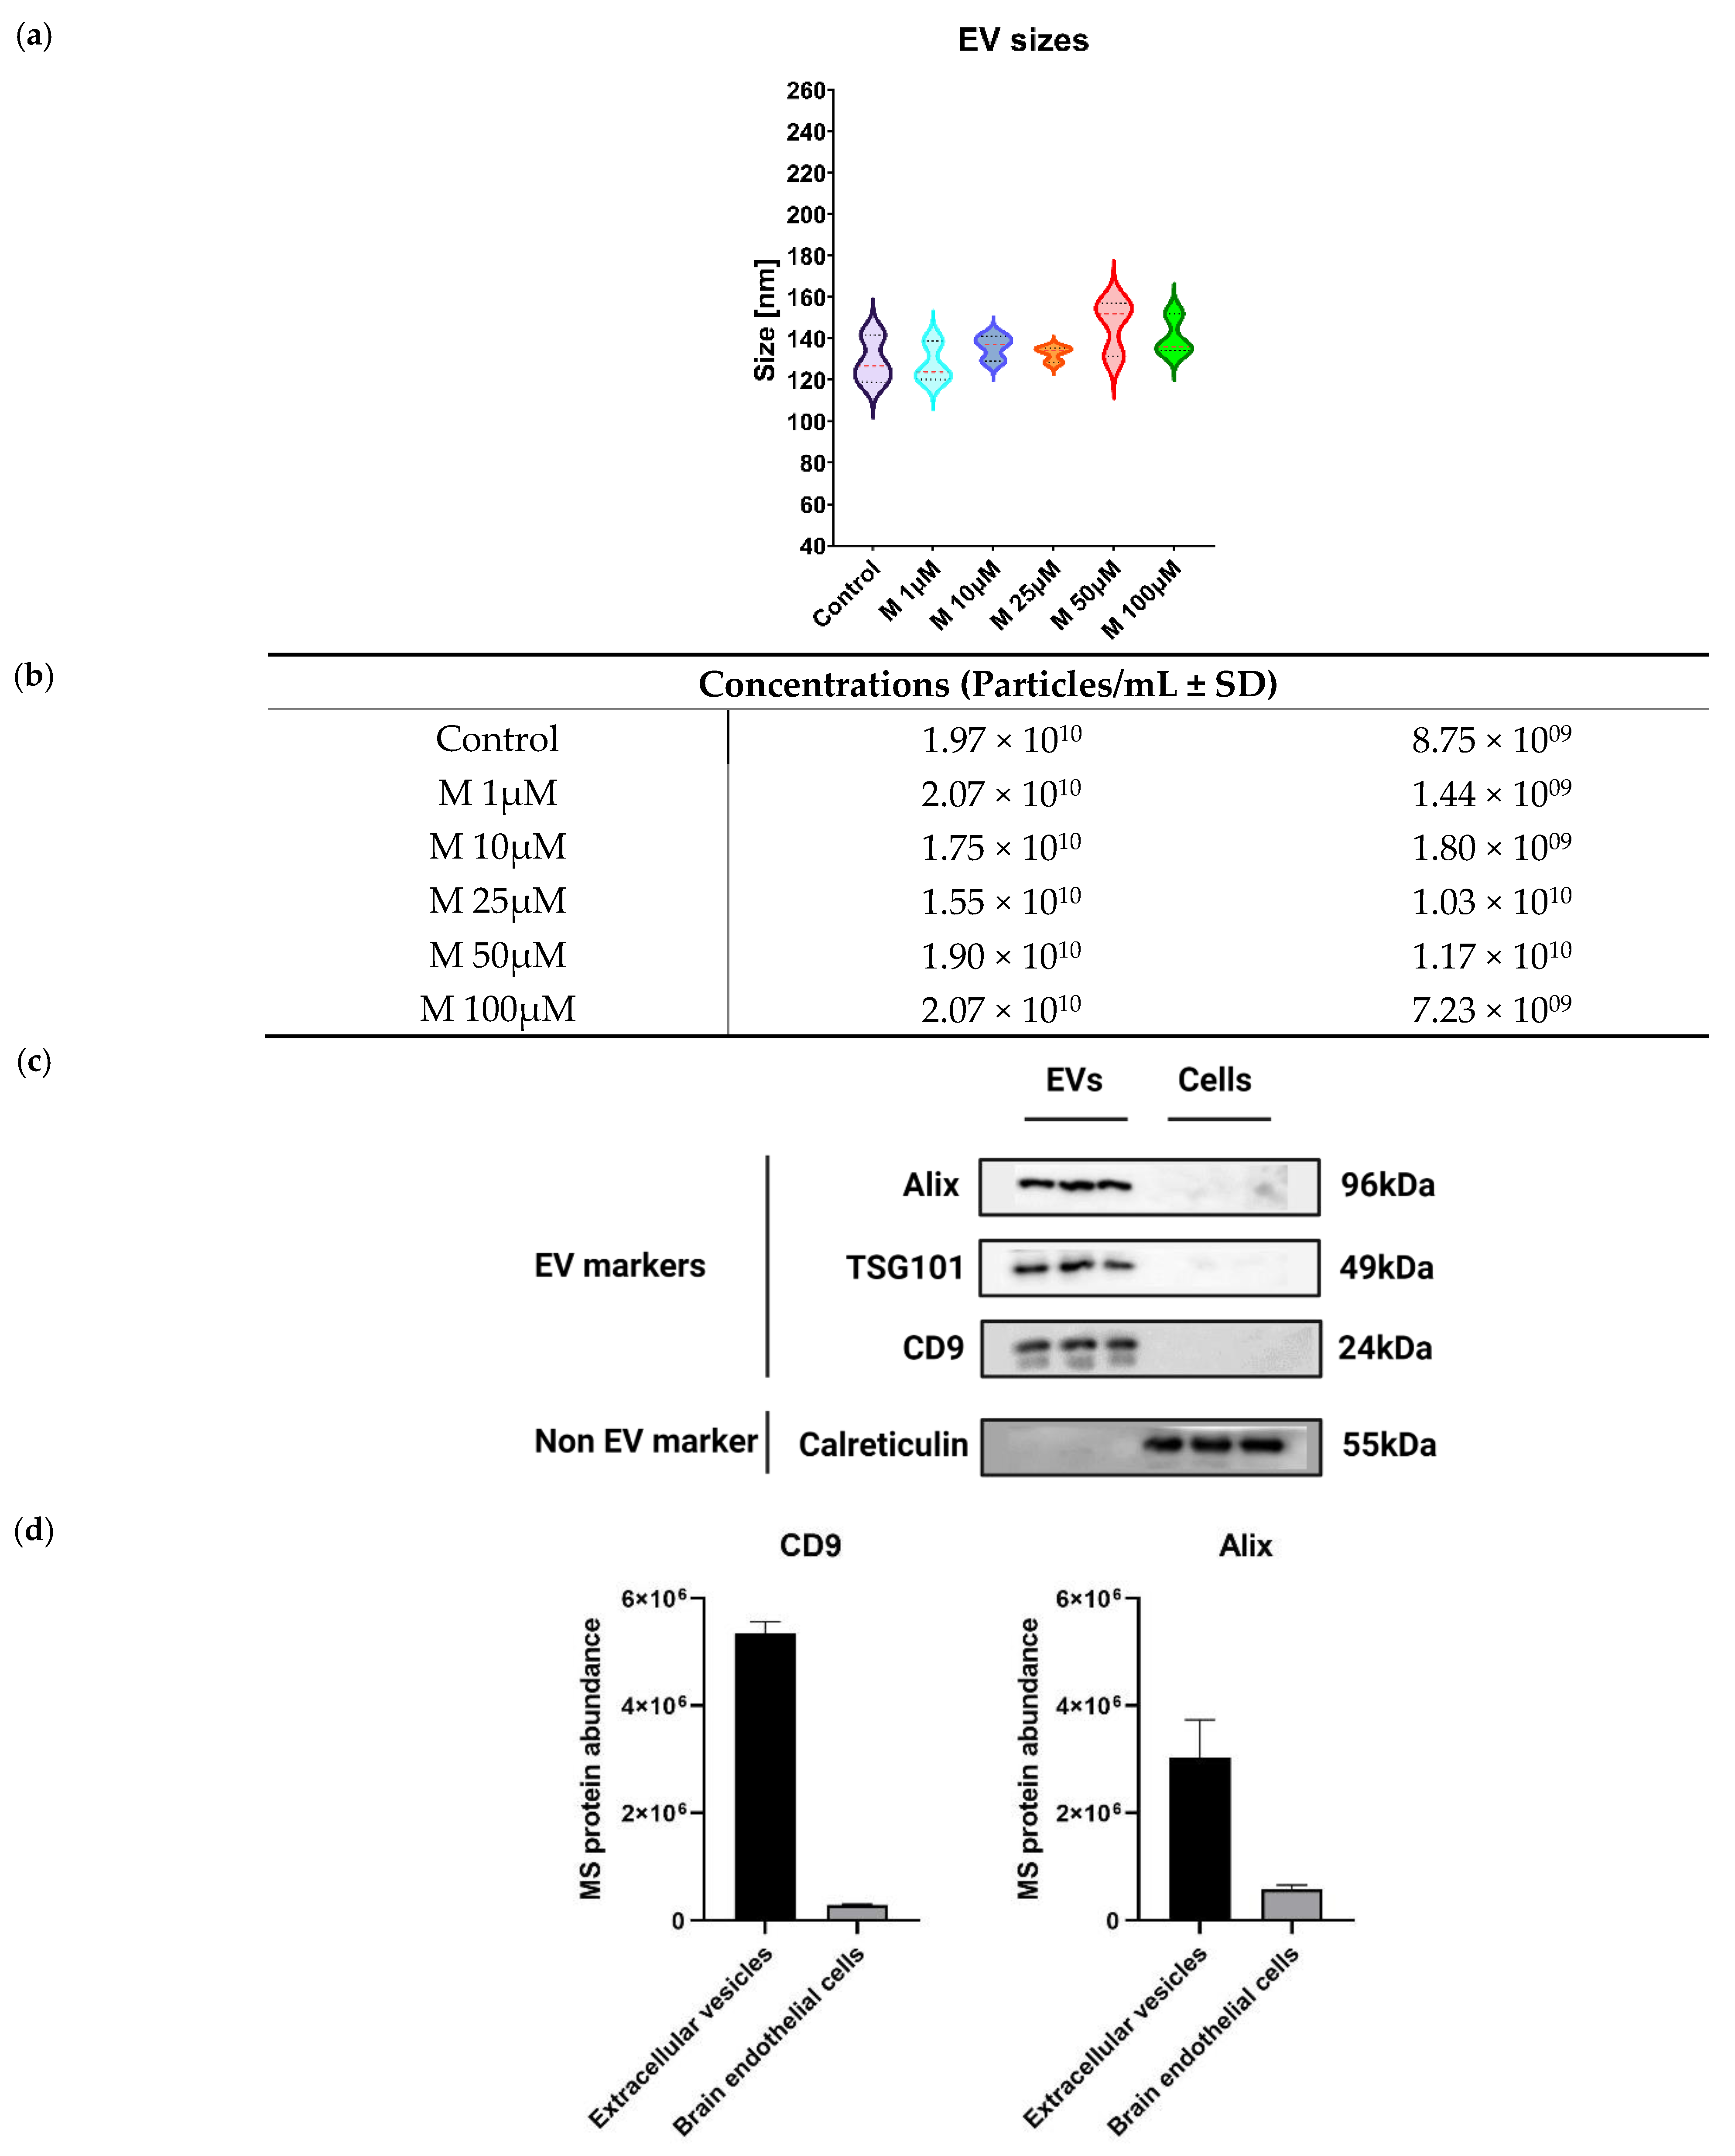
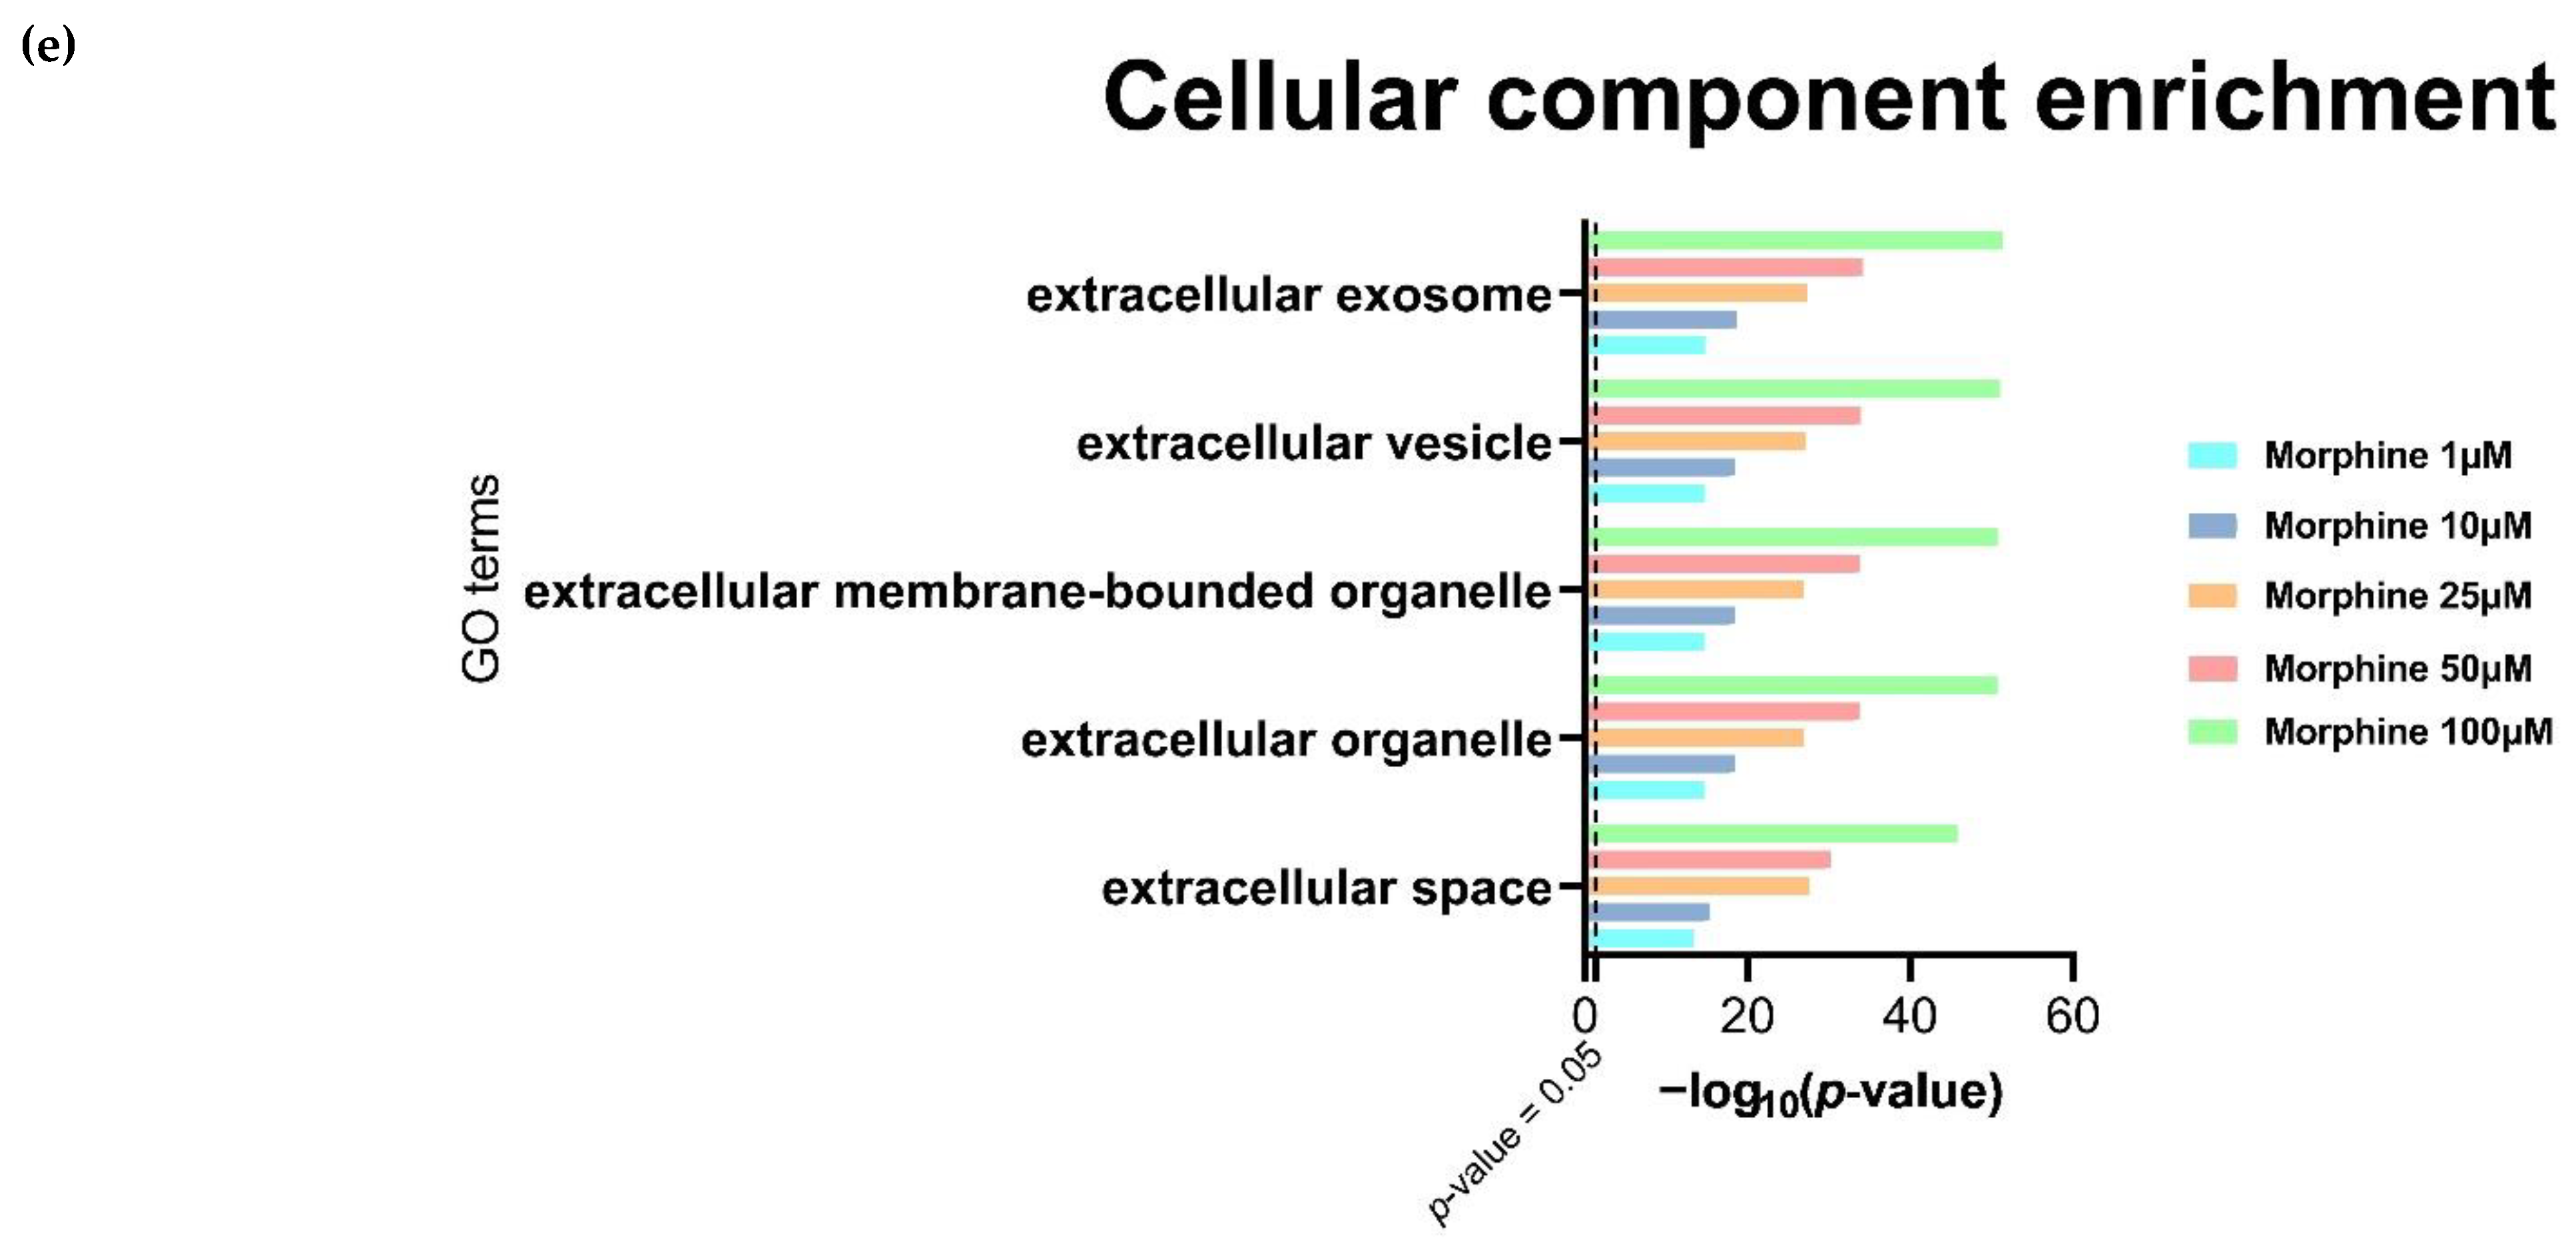
2.3. Nanoparticle Tracking Analysis (NTA)
2.4. Protein Extraction and Quantification
2.5. Western Blot Analysis
2.6. Sample Preparation for Mass Spectrometry-Based Omics
2.7. MS Data Acquisition and Analysis
2.8. Enrichment Pathway Analysis
2.9. MST Proliferation and LDH Cytotoxicity Assay
2.10. Statistical Analysis
3. Results
3.1. Morphine Doses Determination on Primary Human Brain Microvascular Endothelial Cells
3.2. Characterization of Extracellular Vesicles from Morphine-Treated Human Brain Microvascular Endothelial Cells
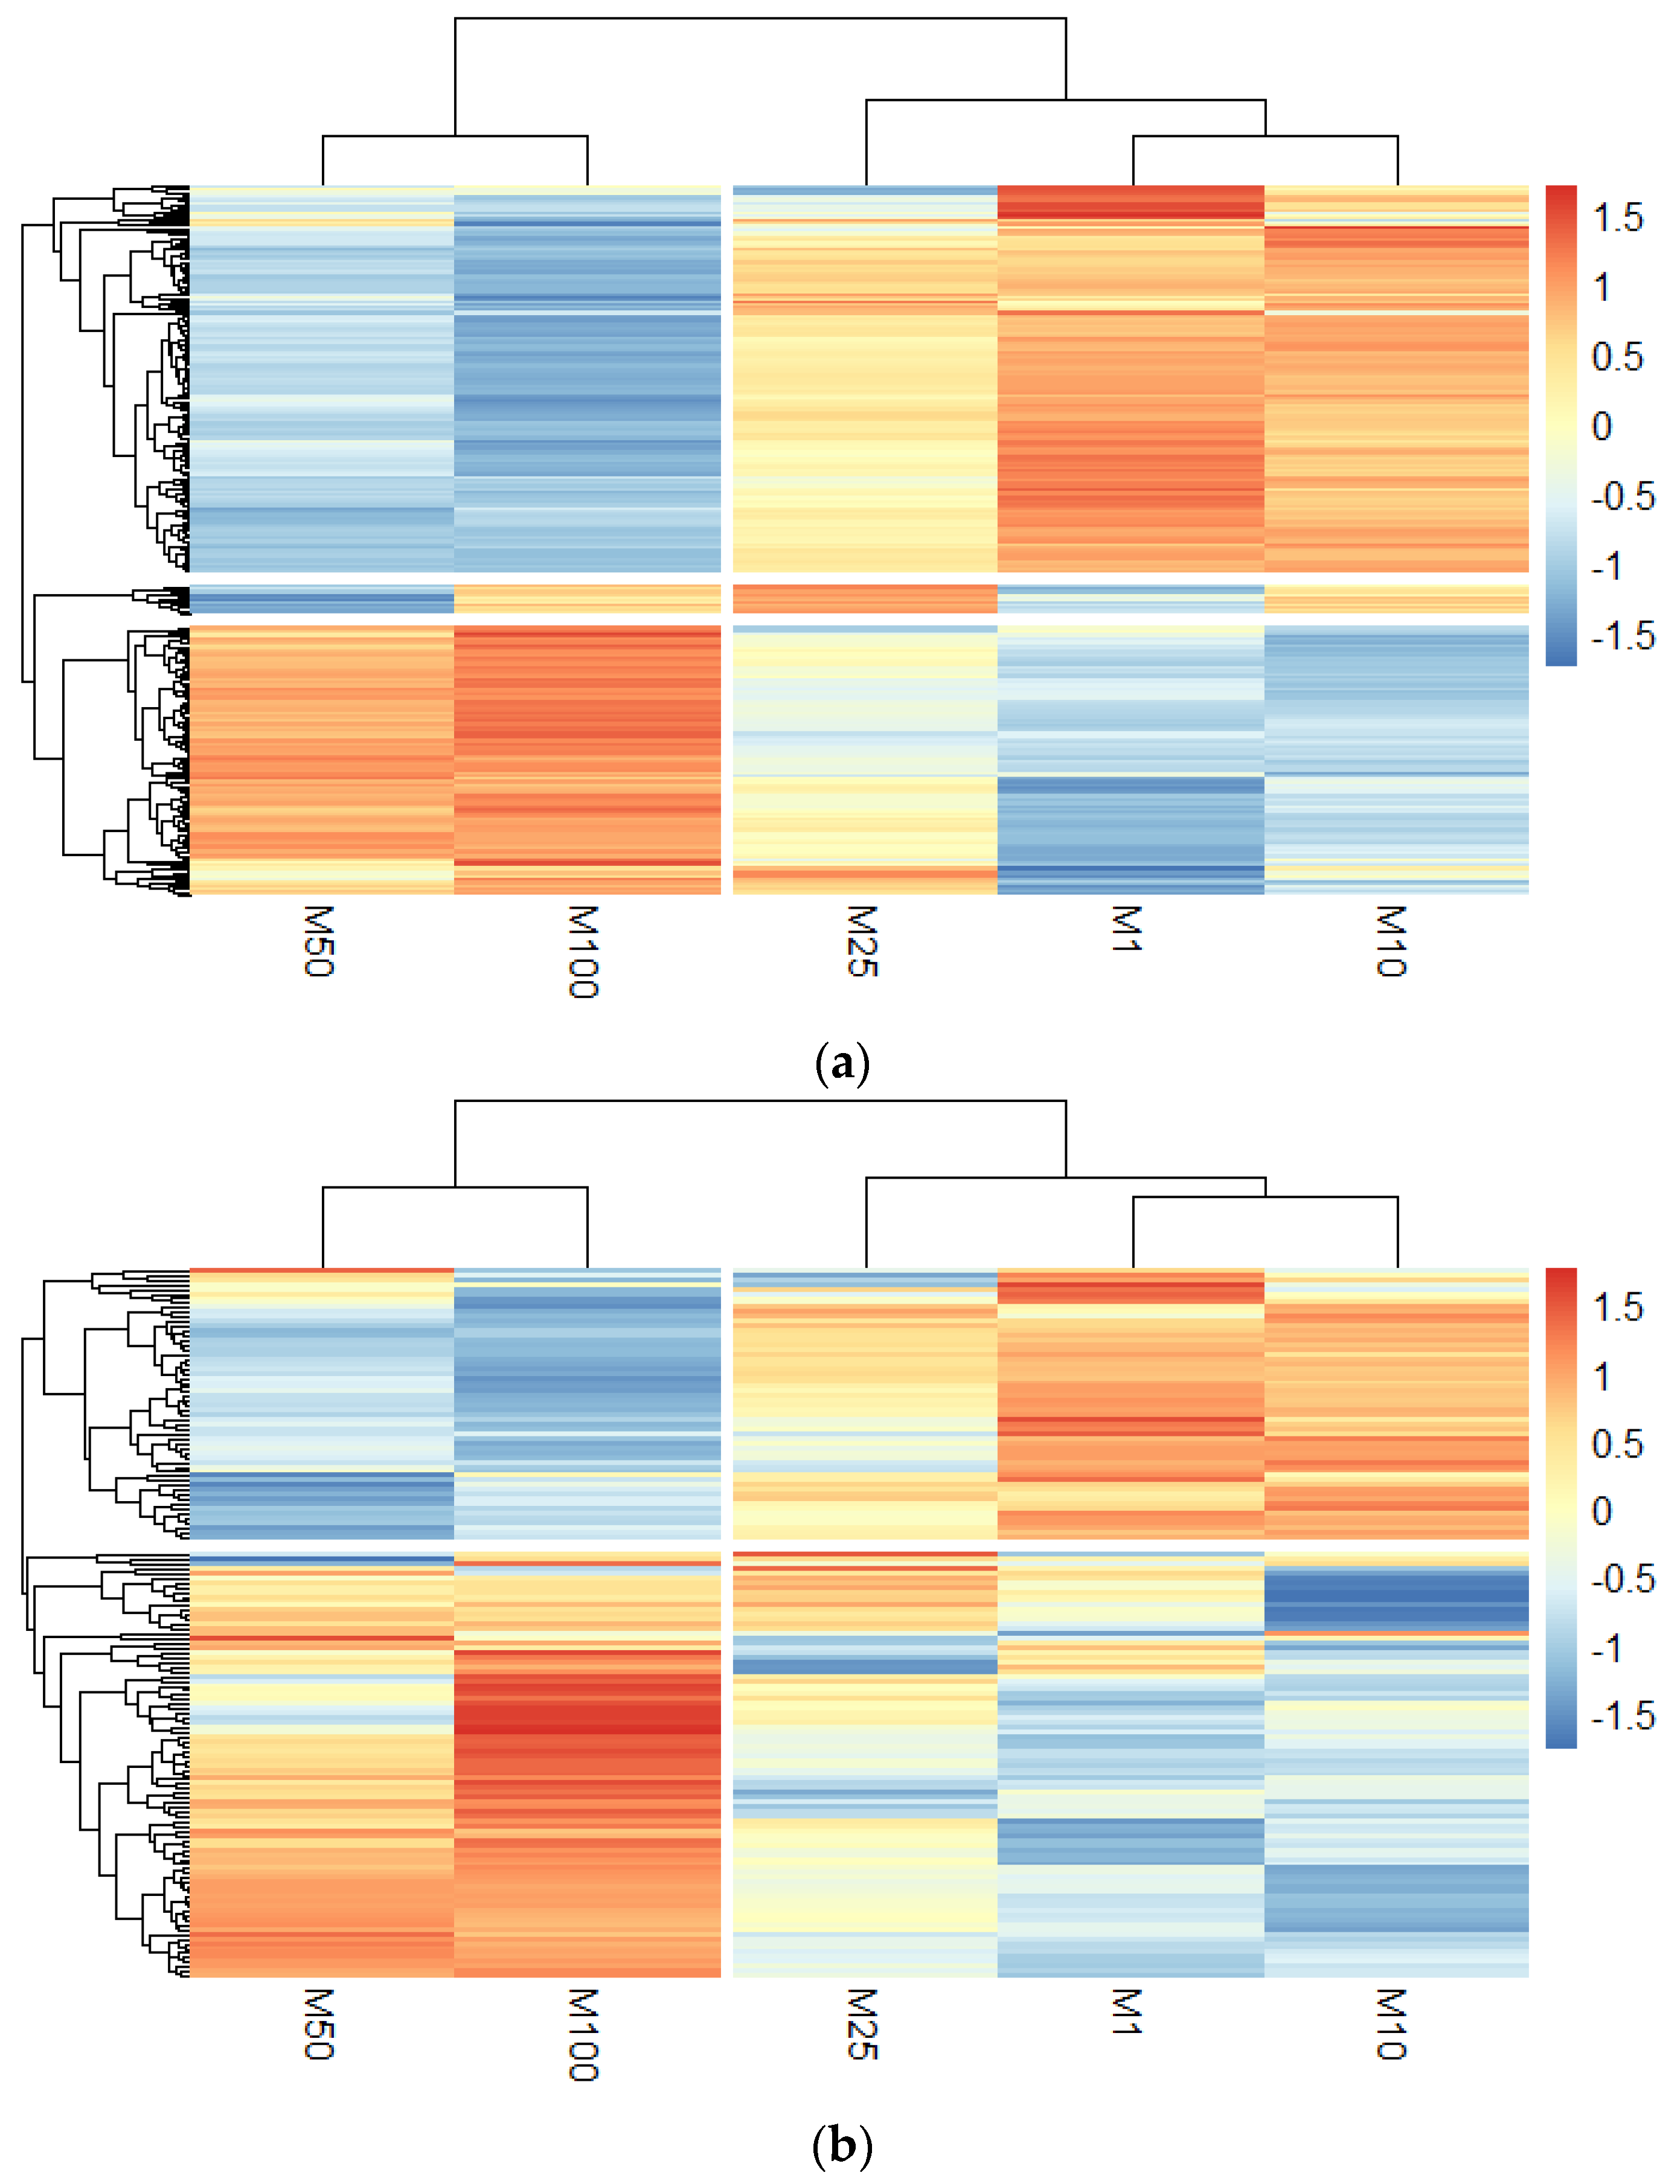
3.3. Quantitative Proteomics Analysis to Study Morphine-Induced Protein Modulations in HMBECs and HBMECs-Derived EVs
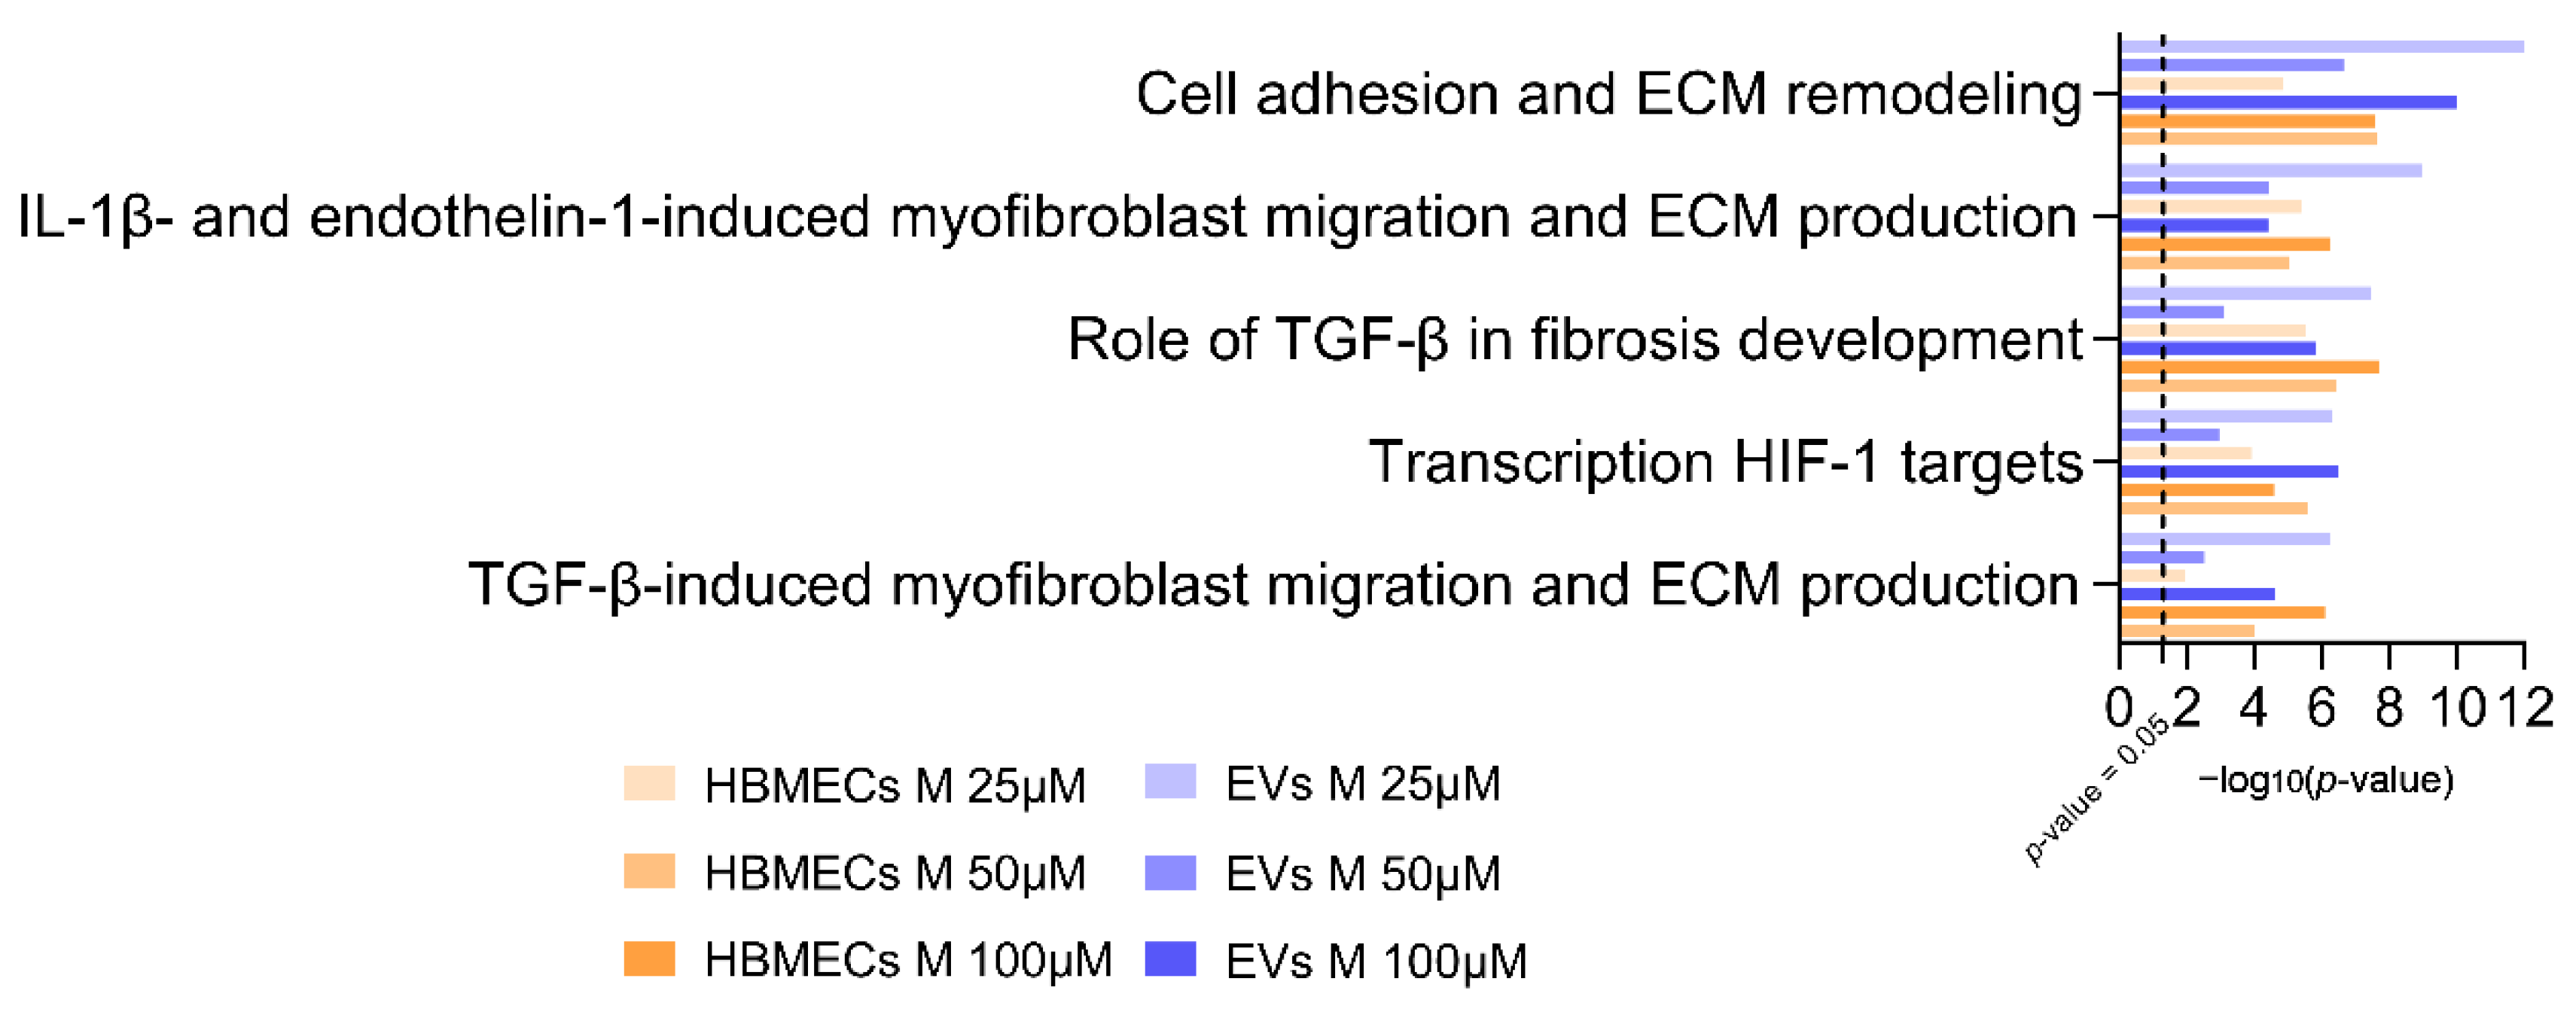
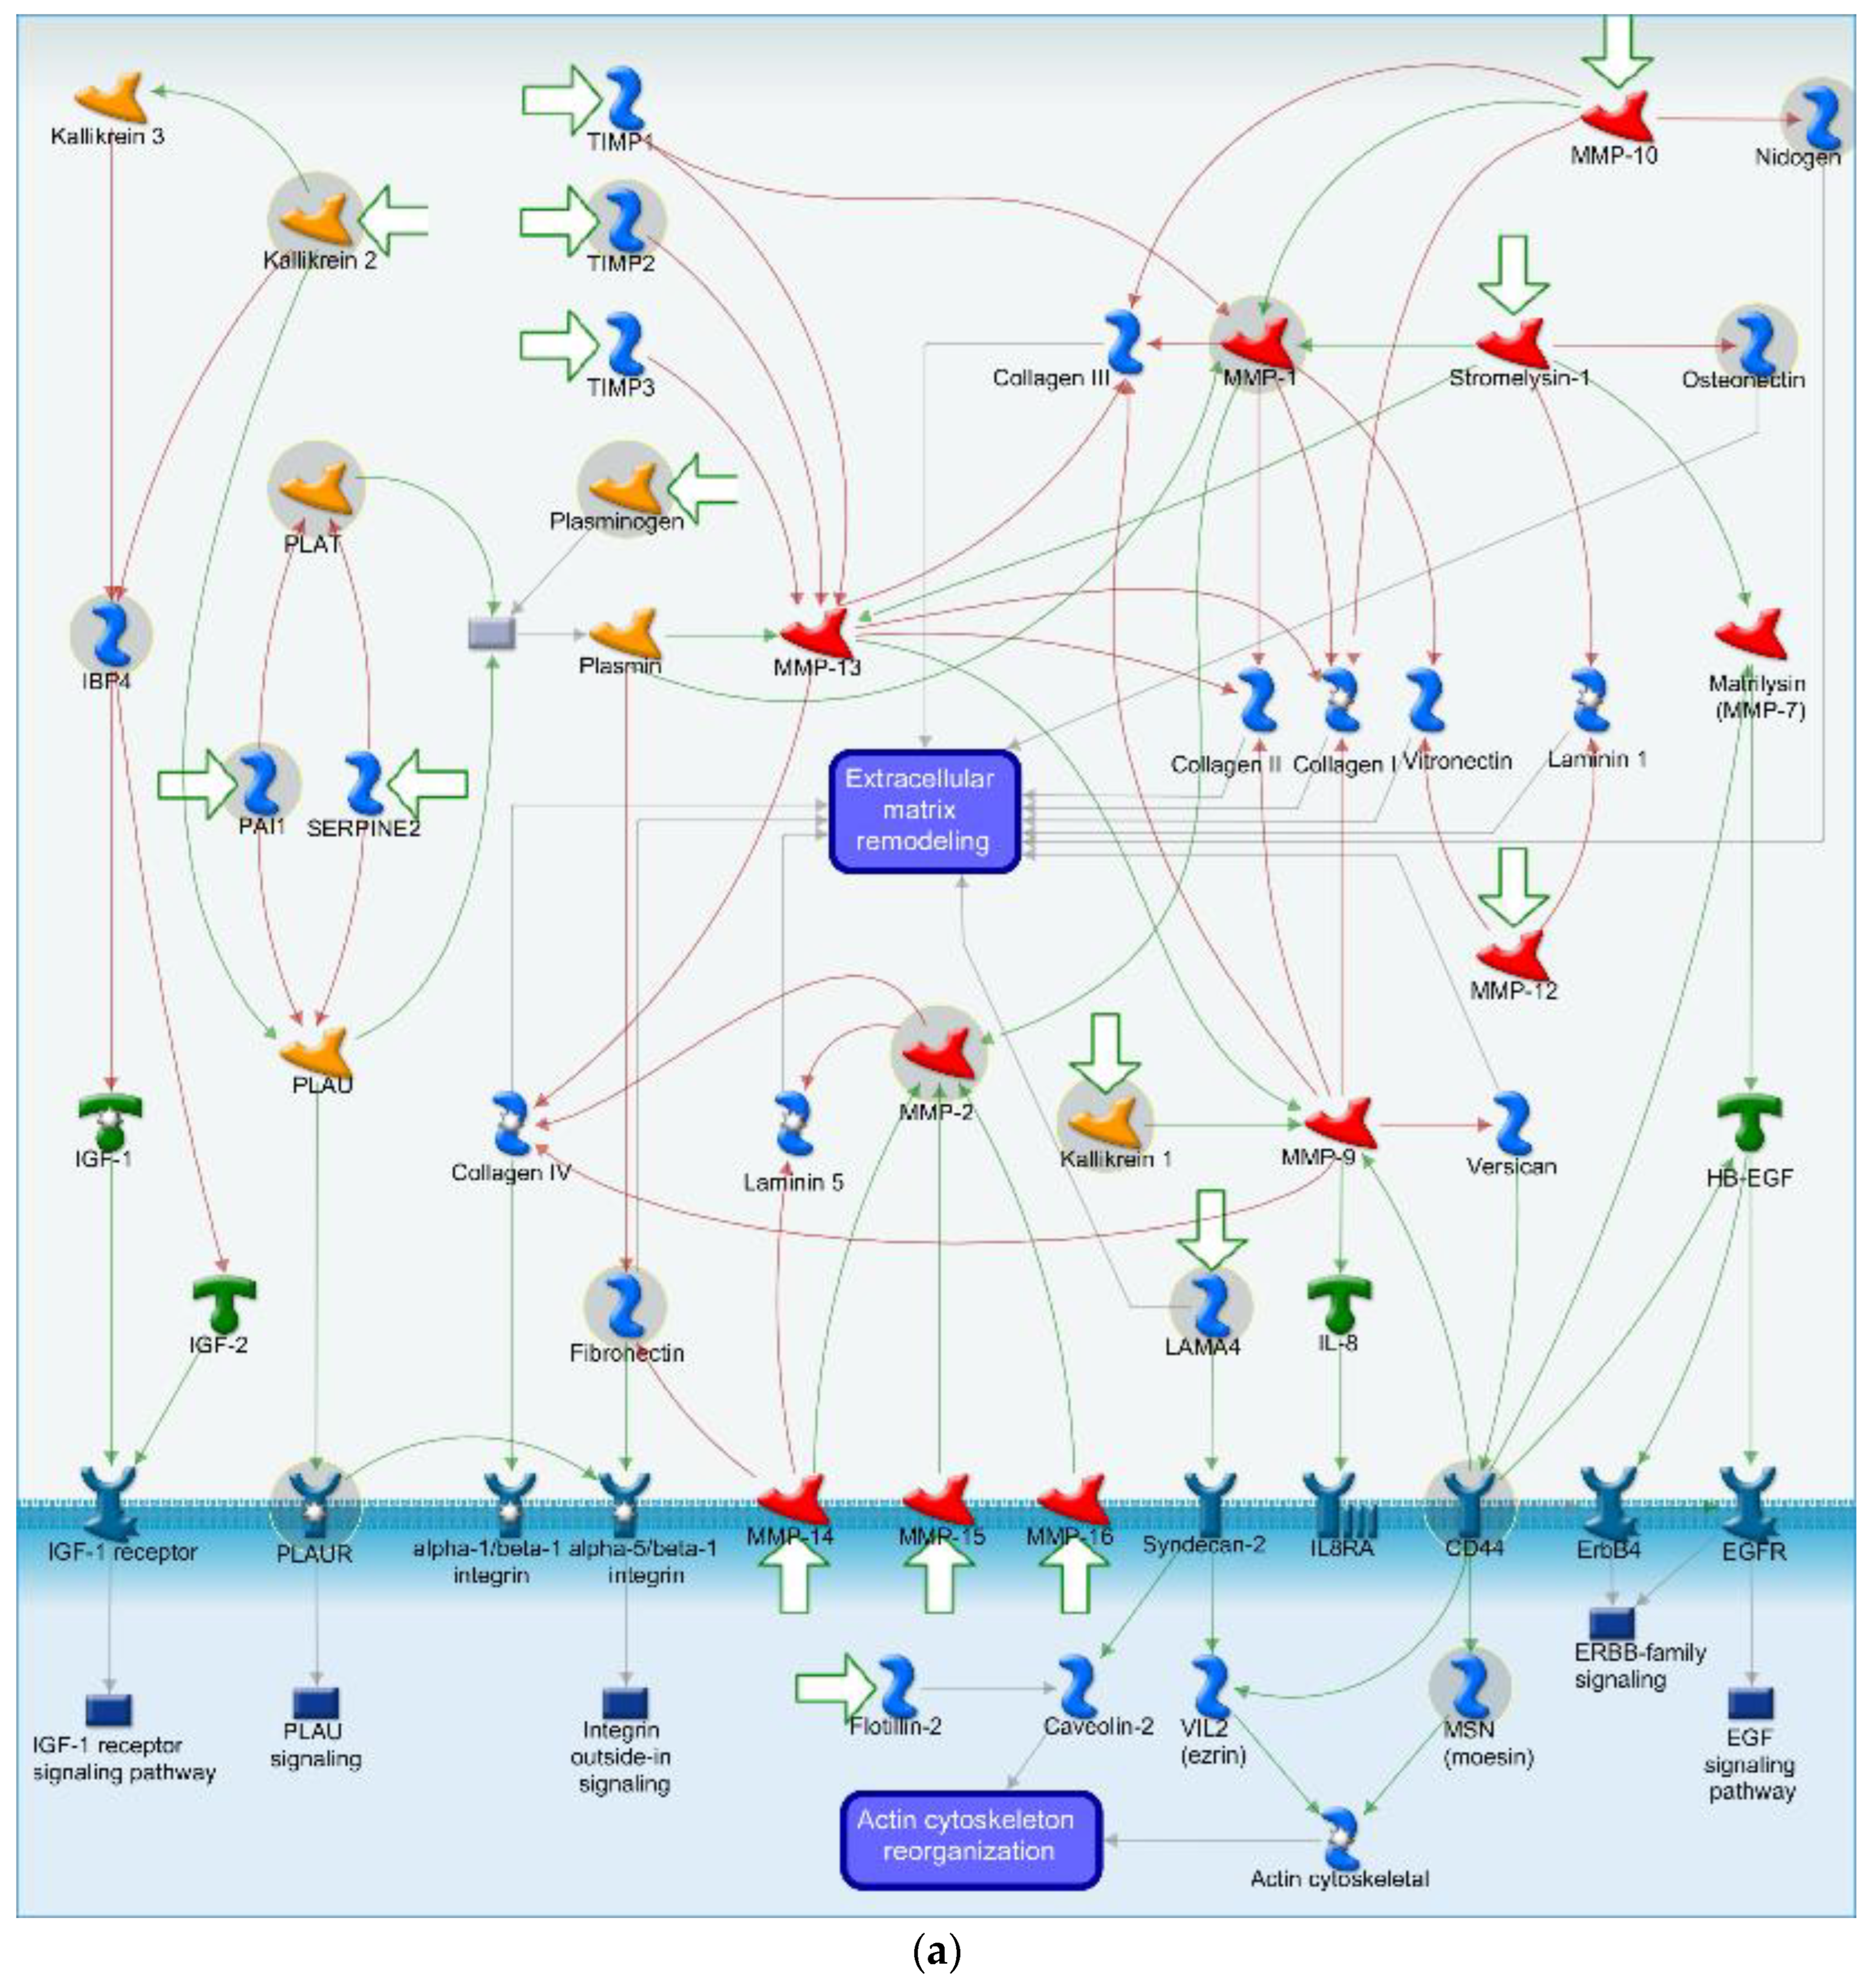
3.4. Morphine Induces Specific Pathway Modulation in HBMECs and Associated EVs
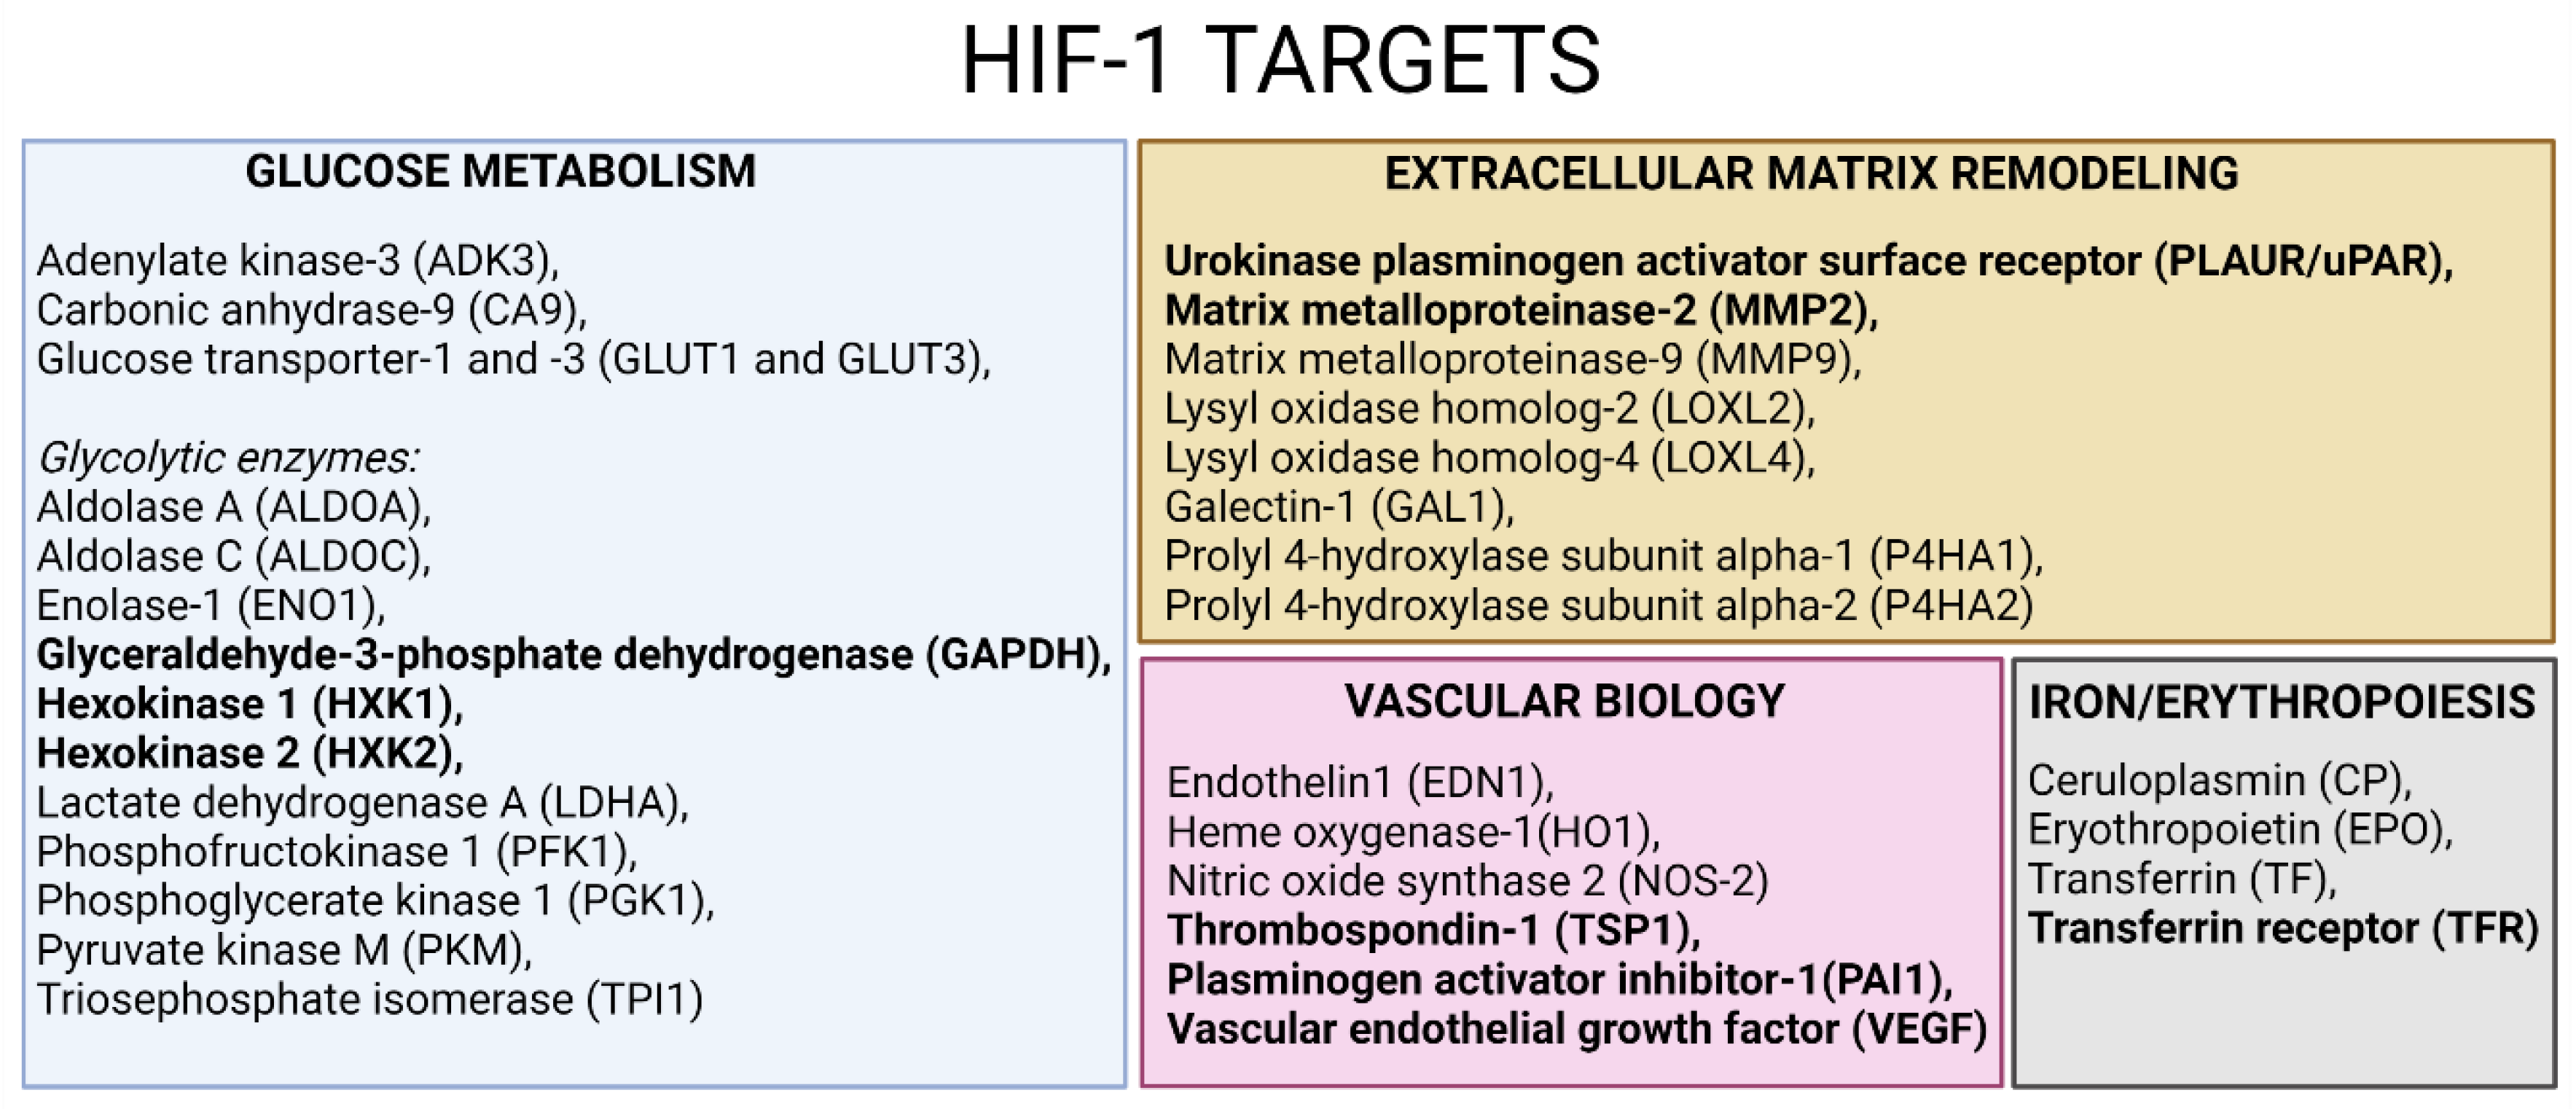
3.5. Confirmatory Experiments of Morphine-Induced Biological Pathways Related to HIF1 Target and ECM Remodeling by Metabolomics
4. Discussion
4.1. Oxidative Stress Related Pathway
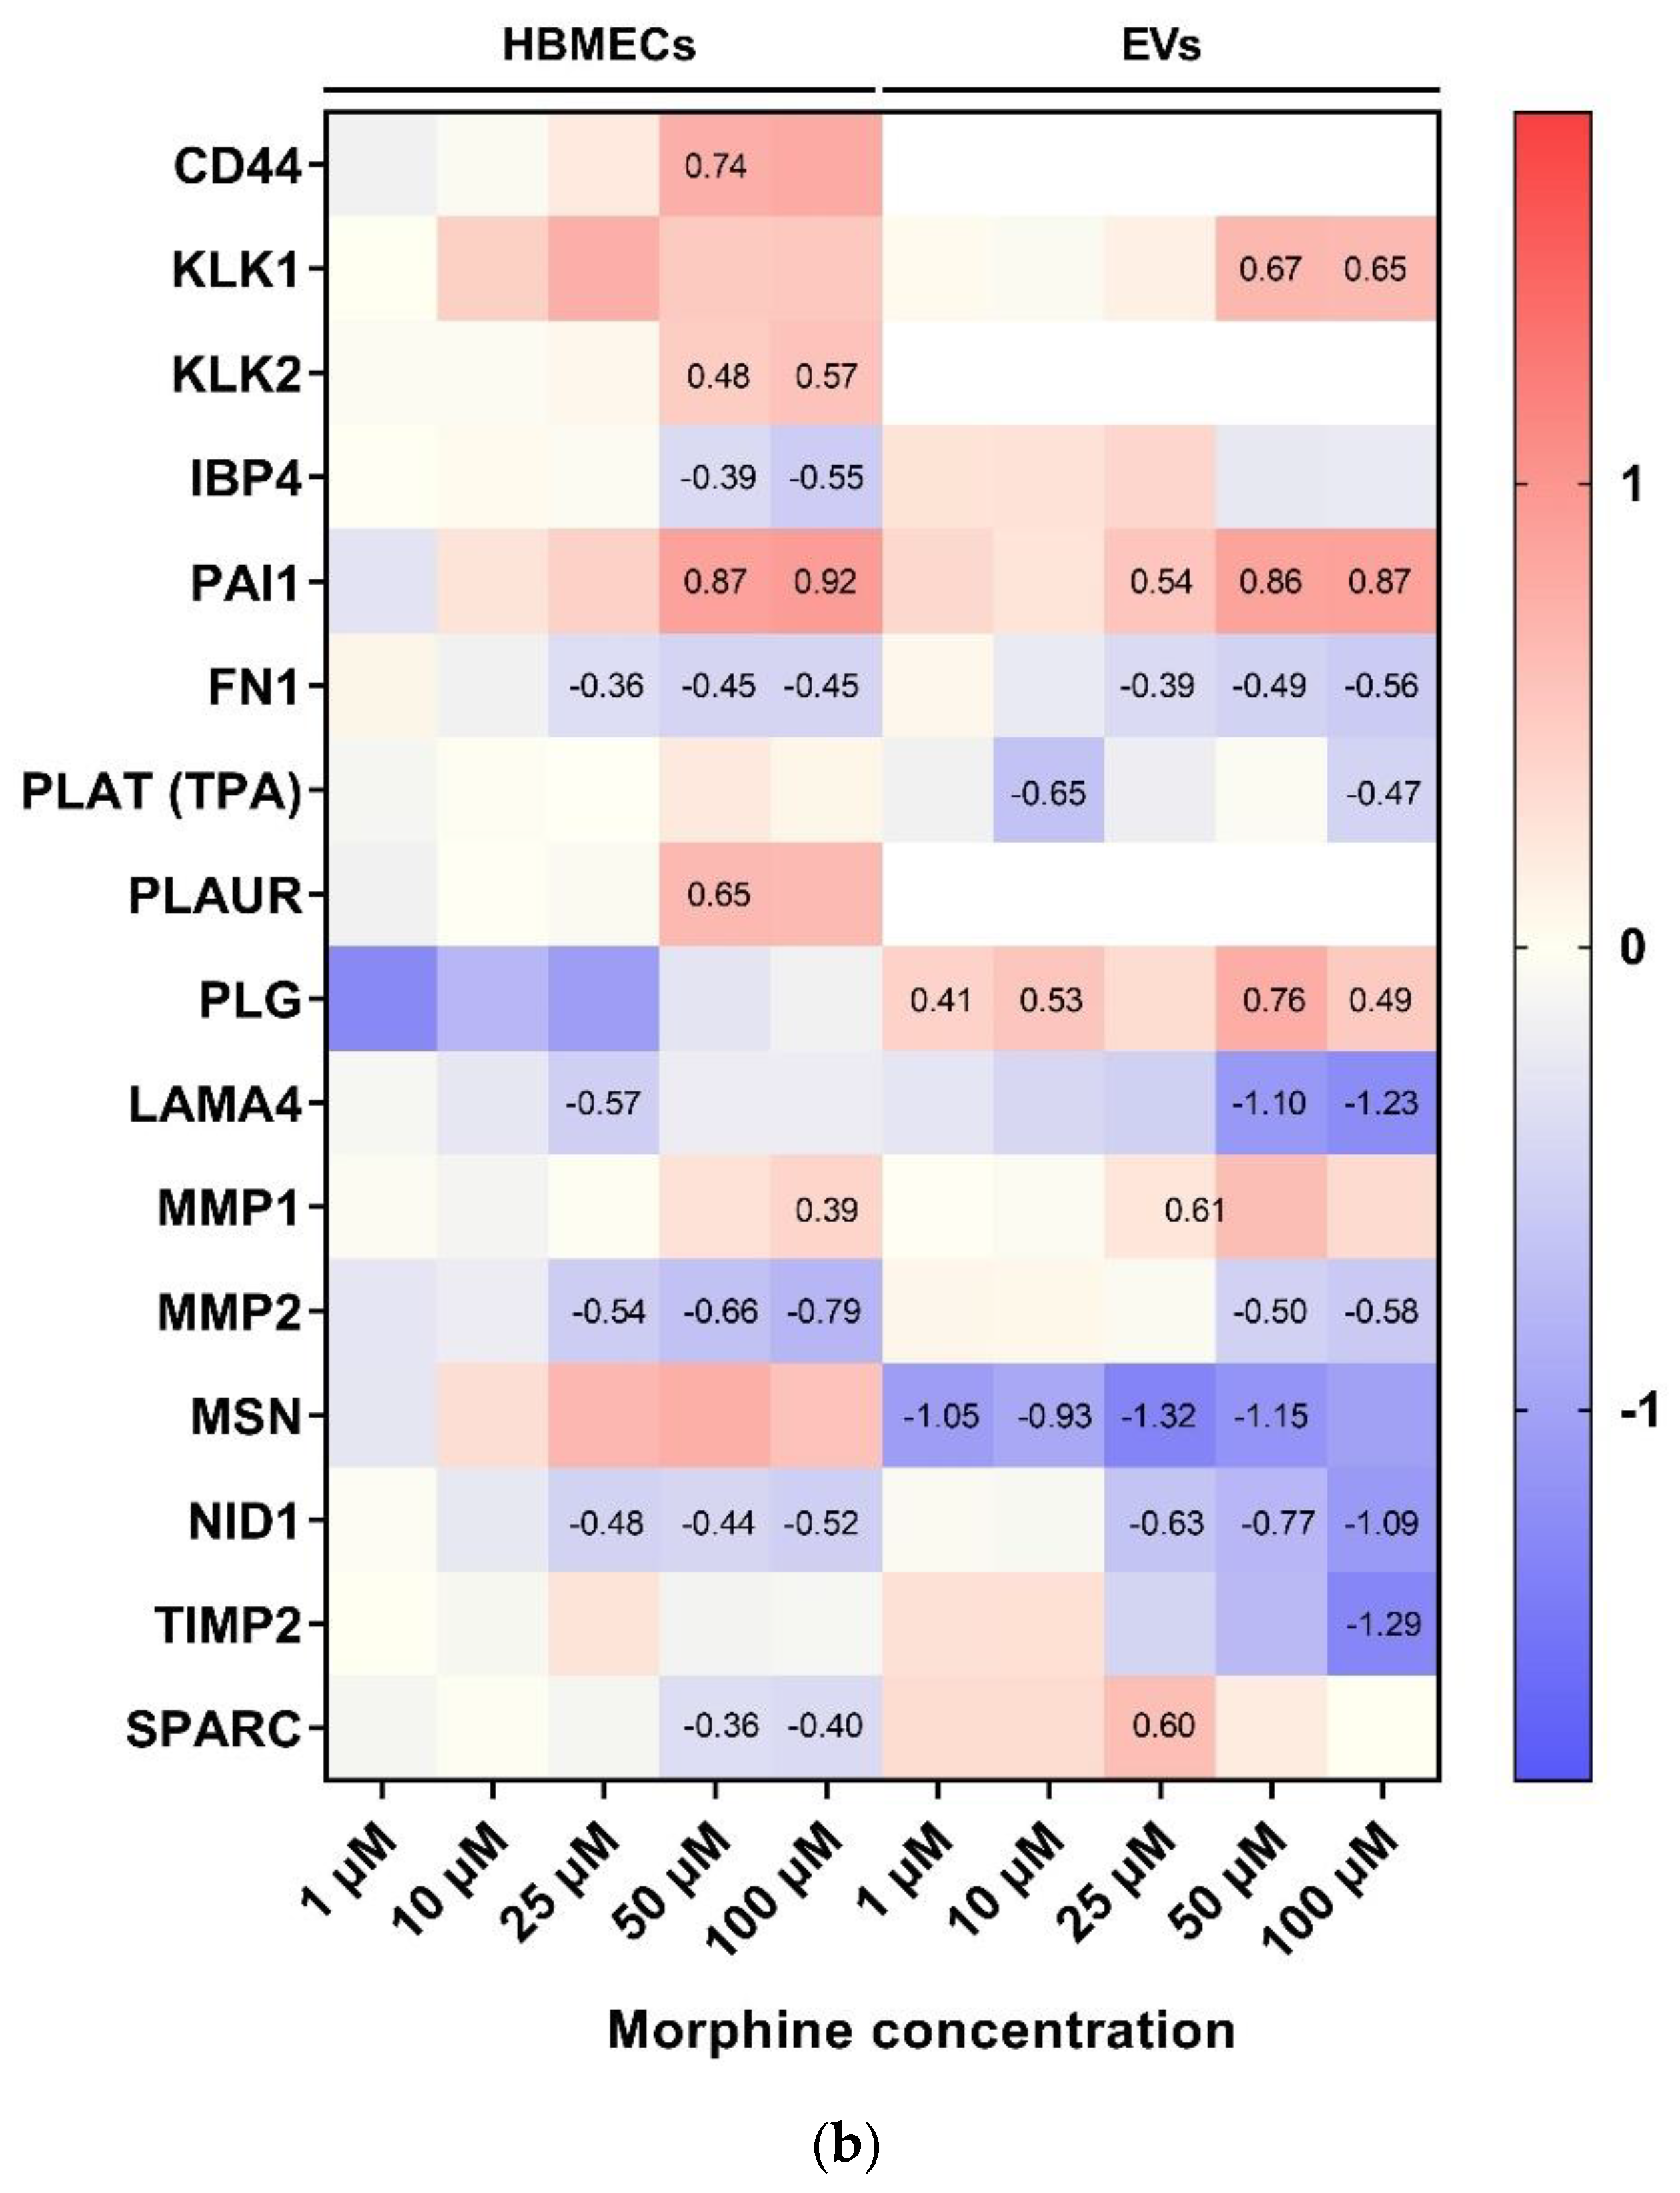
4.2. Cell Adhesion and ECM Remodeling Related Pathway
5. Conclusions
Supplementary Materials
Author Contributions
Funding
Institutional Review Board Statement
Informed Consent Statement
Data Availability Statement
Acknowledgments
Conflicts of Interest
References
- Rosenblum, A.; Marsch, L.A.; Joseph, H.; Portenoy, R.K. Opioids and the treatment of chronic pain: Controversies, current status, and future directions. Exp. Clin. Psychopharmacol. 2008, 16, 405–416. [Google Scholar] [CrossRef] [PubMed] [Green Version]
- Zhang, Y.T.; Zheng, Q.S.; Pan, J.; Zheng, R.L. Oxidative damage of biomolecules in mouse liver induced by morphine and protected by antioxidants. Basic Clin. Pharmacol. Toxicol. 2004, 95, 53–58. [Google Scholar] [CrossRef]
- Abdel-Zaher, A.O.; Abdel-Rahman, M.S.; FM, E.L. Blockade of nitric oxide overproduction and oxidative stress by Nigella sativa oil attenuates morphine-induced tolerance and dependence in mice. Neurochem. Res. 2010, 35, 1557–1565. [Google Scholar] [CrossRef]
- Sumathi, T.; Nathiya, V.C.; Sakthikumar, M. Protective Effect of Bacoside-A against Morphine-Induced Oxidative Stress in Rats. Ind. J. Pharm. Sci. 2011, 73, 409–415. [Google Scholar] [CrossRef]
- Payabvash, S.; Beheshtian, A.; Salmasi, A.H.; Kiumehr, S.; Ghahremani, M.H.; Tavangar, S.M.; Sabzevari, O.; Dehpour, A.R. Chronic morphine treatment induces oxidant and apoptotic damage in the mice liver. Life Sci. 2006, 79, 972–980. [Google Scholar] [CrossRef] [PubMed]
- Guzmán, D.C.; Vázquez, I.E.; Brizuela, N.O.; Alvarez, R.G.; Mejía, G.B.; García, E.H.; Santamaría, D.; de Apreza, M.; Olguín, H.J. Assessment of oxidative damage induced by acute doses of morphine sulfate in postnatal and adult rat brain. Neurochem. Res. 2006, 31, 549–554. [Google Scholar] [CrossRef]
- Murlanova, K.; Jouroukhin, Y.; Huseynov, S.; Pletnikova, O.; Morales, M.J.; Guan, Y.; Baraban, J.M.; Bergles, D.E.; Pletnikov, M.V. Deficient mitochondrial respiration in astrocytes impairs trace fear conditioning and increases naloxone-precipitated aversion in morphine-dependent mice. Glia 2022, 70, 1289–1300. [Google Scholar] [CrossRef]
- Podhaizer, E.M.; Zou, S.; Fitting, S.; Samano, K.L.; El-Hage, N.; Knapp, P.E.; Hauser, K.F. Morphine and gp120 toxic interactions in striatal neurons are dependent on HIV-1 strain. J. Neuroimmune. Pharmacol. 2012, 7, 877–891. [Google Scholar] [CrossRef] [Green Version]
- Jasmin, L.; Wang, H.; Tarczy-Hornoch, K.; Levine, J.D.; Basbaum, A.I. Differential effects of morphine on noxious stimulus-evoked fos-like immunoreactivity in subpopulations of spinoparabrachial neurons. J. Neurosci. 1994, 14, 7252–7260. [Google Scholar] [CrossRef]
- Christie, M.J. Chapter 14—Mechanisms of opioid actions on neurons of the locus coeruleus. In Progress in Brain Research; Barnes, C.D., Pompeiano, O., Eds.; Elsevier: Amsterdam, The Netherlands, 1991; Volume 88, pp. 197–205. [Google Scholar]
- Reymond, S.; Vujić, T.; Schvartz, D.; Sanchez, J.C. Morphine-induced modulation of Nrf2-antioxidant response element signaling pathway in primary human brain microvascular endothelial cells. Sci. Rep. 2022, 12, 4588. [Google Scholar] [CrossRef]
- Banks, W.A.; Sharma, P.; Bullock, K.M.; Hansen, K.M.; Ludwig, N.; Whiteside, T.L. Transport of Extracellular Vesicles across the Blood-Brain Barrier: Brain Pharmacokinetics and Effects of Inflammation. Int. J. Mol. Sci. 2020, 21, 4407. [Google Scholar] [CrossRef] [PubMed]
- Basso, M.; Bonetto, V. Extracellular Vesicles and a Novel Form of Communication in the Brain. Front. Neurosci. 2016, 10, 127. [Google Scholar] [CrossRef] [PubMed] [Green Version]
- Chiaradia, E.; Tancini, B.; Emiliani, C.; Delo, F.; Pellegrino, R.M.; Tognoloni, A.; Urbanelli, L.; Buratta, S. Extracellular Vesicles under Oxidative Stress Conditions: Biological Properties and Physiological Roles. Cells 2021, 10, 1763. [Google Scholar] [CrossRef] [PubMed]
- Meister, I.; Zhang, P.; Sinha, A.; Sköld, C.M.; Wheelock, Å.M.; Izumi, T.; Chaleckis, R.; Wheelock, C.E. High-Precision Automated Workflow for Urinary Untargeted Metabolomic Epidemiology. Anal Chem. 2021, 93, 5248–5258. [Google Scholar] [CrossRef]
- Pezzatti, J.; González-Ruiz, V.; Codesido, S.; Gagnebin, Y.; Joshi, A.; Guillarme, D.; Schappler, J.; Picard, D.; Boccard, J.; Rudaz, S. A scoring approach for multi-platform acquisition in metabolomics. J. Chromatogr. A 2019, 1592, 47–54. [Google Scholar] [CrossRef] [PubMed]
- Wu, X.; Li, L.; Iliuk, A.; Tao, W.A. Highly Efficient Phosphoproteome Capture and Analysis from Urinary Extracellular Vesicles. J. Proteome Res. 2018, 17, 3308–3316. [Google Scholar] [CrossRef]
- Iliuk, A.; Wu, X.; Li, L.; Sun, J.; Hadisurya, M.; Boris, R.S.; Tao, W.A. Plasma-Derived Extracellular Vesicle Phosphoproteomics through Chemical Affinity Purification. J. Proteome Res. 2020, 19, 2563–2574. [Google Scholar] [CrossRef]
- Théry, C.; Witwer, K.W.; Aikawa, E.; Alcaraz, M.J.; Anderson, J.D.; Andriantsitohaina, R.; Antoniou, A.; Arab, T.; Archer, F.; Atkin-Smith, G.K.; et al. Minimal information for studies of extracellular vesicles 2018 (MISEV2018): A position statement of the International Society for Extracellular Vesicles and update of the MISEV2014 guidelines. J. Extracell. Vesicles 2018, 7, 1535750. [Google Scholar] [CrossRef] [Green Version]
- Men, Y.; Yelick, J.; Jin, S.; Tian, Y.; Chiang, M.S.R.; Higashimori, H.; Brown, E.; Jarvis, R.; Yang, Y. Exosome reporter mice reveal the involvement of exosomes in mediating neuron to astroglia communication in the CNS. Nat. Commun. 2019, 10, 4136. [Google Scholar] [CrossRef] [Green Version]
- Yoshioka, Y.; Konishi, Y.; Kosaka, N.; Katsuda, T.; Kato, T.; Ochiya, T. Comparative marker analysis of extracellular vesicles in different human cancer types. J. Extracell. Vesicles 2013, 2, 20424. [Google Scholar] [CrossRef]
- Teo, G.; Kim, S.; Tsou, C.-C.; Collins, B.; Gingras, A.-C.; Nesvizhskii, A.I.; Choi, H. mapDIA: Preprocessing and statistical analysis of quantitative proteomics data from data independent acquisition mass spectrometry. J. Proteom. 2015, 129, 108–120. [Google Scholar] [CrossRef] [PubMed] [Green Version]
- Walzer, M.; García-Seisdedos, D.; Prakash, A.; Brack, P.; Crowther, P.; Graham, R.L.; George, N.; Mohammed, S.; Moreno, P.; Papatheodorou, I.; et al. Implementing the reuse of public DIA proteomics datasets: From the PRIDE database to Expression Atlas. Sci. Data 2022, 9, 335. [Google Scholar] [CrossRef] [PubMed]
- Gach, K.; Szemraj, J.; Wyrębska, A.; Janecka, A. The influence of opioids on matrix metalloproteinase-2 and -9 secretion and mRNA levels in MCF-7 breast cancer cell line. Mol. Biol. Rep. 2011, 38, 1231–1236. [Google Scholar] [CrossRef]
- Chen, J.-K.; Zhan, Y.-J.; Yang, C.-S.; Tzeng, S.-F. Oxidative stress-induced attenuation of thrombospondin-1 expression in primary rat astrocytes. J. Cell. Biochem. 2011, 112, 59–70. [Google Scholar] [CrossRef] [PubMed]
- Görlach, A.; Berchner-Pfannschmidt, U.; Wotzlaw, C.; Cool, R.H.; Fandrey, J.; Acker, H.; Jungermann, K.; Kietzmann, T. Reactive oxygen species modulate HIF-1 mediated PAI-1 expression: Involvement of the GTPase Rac1. Thromb. Haemost. 2003, 89, 926–935. [Google Scholar] [PubMed]
- Zhang, L.; Wang, F.; Li, D.; Yan, Y.; Wang, H. Transferrin receptor-mediated reactive oxygen species promotes ferroptosis of KGN cells via regulating NADPH oxidase 1/PTEN induced kinase 1/acyl-CoA synthetase long chain family member 4 signaling. Bioengineered 2021, 12, 4983–4994. [Google Scholar] [CrossRef] [PubMed]
- Semenza, G.L. HIF-1, O2, and the 3 PHDs: How Animal Cells Signal Hypoxia to the Nucleus. Cell 2001, 107, 1–3. [Google Scholar] [CrossRef] [Green Version]
- Alge-Priglinger, C.S.; Kreutzer, T.; Obholzer, K.; Wolf, A.; Mempel, M.; Kernt, M.; Kampik, A.; Priglinger, S.G. Oxidative Stress-Mediated Induction of MMP-1 and MMP-3 in Human RPE Cells. Investig. Ophthalmol. Vis. Sci. 2009, 50, 5495–5503. [Google Scholar] [CrossRef] [Green Version]
- Hansson, E.; Westerlund, A.; Björklund, U.; Olsson, T. μ-Opioid agonists inhibit the enhanced intracellular Ca2+ responses in inflammatory activated astrocytes co-cultured with brain endothelial cells. Neuroscience 2008, 155, 1237–1249. [Google Scholar] [CrossRef]
- Vidal, E.L.; Patel, N.A.; Wu, G.-d.; Fiala, M.; Chang, S.L. Interleukin-1 induces the expression of μ opioid receptors in endothelial cells. Immunopharmacology 1998, 38, 261–266. [Google Scholar] [CrossRef]
- Chang, S.L.; Felix, B.; Jiang, Y.; Fiala, M. Actions of endotoxin and morphine. Adv. Exp. Med. Biol. 2001, 493, 187–196. [Google Scholar] [CrossRef] [PubMed]
- Redondo, A.; Chamorro, P.A.F.; Riego, G.; Leánez, S.; Pol, O. Treatment with Sulforaphane Produces Antinociception and Improves Morphine Effects during Inflammatory Pain in Mice. J. Pharmacol. Exp. Ther 2017, 363, 293–302. [Google Scholar] [CrossRef] [PubMed] [Green Version]
- Marino, J.; Maubert, M.E.; Lawrence, J.M.; Wigdahl, B.; Nonnemacher, M.R. Chronic Low Dose Morphine Does Not Alter Two In Vitro BBB Models. Brain Sci. 2022, 12, 888. [Google Scholar] [CrossRef]
- Strazza, M.; Pirrone, V.; Wigdahl, B.; Dampier, W.; Lin, W.; Feng, R.; Maubert, M.E.; Weksler, B.; Romero, I.A.; Couraud, P.-O.; et al. Prolonged Morphine Exposure Induces Increased Firm Adhesion in an in Vitro Model of the Blood–Brain Barrier. Int. J. Mol. Sci. 2016, 17, 916. [Google Scholar] [CrossRef] [Green Version]
- Mahajan, S.D.; Aalinkeel, R.; Sykes, D.E.; Reynolds, J.L.; Bindukumar, B.; Fernandez, S.F.; Chawda, R.; Shanahan, T.C.; Schwartz, S.A. Tight Junction Regulation by Morphine and HIV-1 Tat Modulates Blood–Brain Barrier Permeability. J. Clin. Immunol. 2008, 28, 528–541. [Google Scholar] [CrossRef]
- Cai, Y.; Yang, L.; Hu, G.; Chen, X.; Niu, F.; Yuan, L.; Liu, H.; Xiong, H.; Arikkath, J.; Buch, S. Regulation of morphine-induced synaptic alterations: Role of oxidative stress, ER stress, and autophagy. J. Cell Biol. 2016, 215, 245–258. [Google Scholar] [CrossRef] [PubMed] [Green Version]
- Almeida, M.B.; Costa-Malaquias, A.; Nascimento, J.L.; Oliveira, K.R.; Herculano, A.M.; Crespo-López, M.E. Therapeutic concentration of morphine reduces oxidative stress in glioma cell line. Braz. J. Med. Biol. Res. 2014, 47, 398–402. [Google Scholar] [CrossRef] [Green Version]
- Dozio, V.; Daali, Y.; Desmeules, J.; Sanchez, J.C. Deep proteomics and phosphoproteomics reveal novel biological pathways perturbed by morphine, morphine-3-glucuronide and morphine-6-glucuronide in human astrocytes. J. Neurosci. Res. 2020, 100, 220–236. [Google Scholar] [CrossRef]
- Wang, B.; Su, C.-J.; Liu, T.-T.; Zhou, Y.; Feng, Y.; Huang, Y.; Liu, X.; Wang, Z.-H.; Chen, L.-H.; Luo, W.-F.; et al. The Neuroprotection of Low-Dose Morphine in Cellular and Animal Models of Parkinson’s Disease Through Ameliorating Endoplasmic Reticulum (ER) Stress and Activating Autophagy. Front Mol. Neurosci. 2018, 11, 120. [Google Scholar] [CrossRef]
- Lam, C.-F.; Liu, Y.-C.; Tseng, F.-L.; Sung, Y.-H.; Huang, C.-C.; Jiang, M.-J.; Tsai, Y.-C. High-dose Morphine Impairs Vascular Endothelial Function by Increased Production of Superoxide Anions. Anesthesiology 2007, 106, 532–537. [Google Scholar] [CrossRef]
- Stam, J.; Bartel, S.; Bischoff, R.; Wolters, J.C. Isolation of extracellular vesicles with combined enrichment methods. J. Chromatogr. B 2021, 1169, 122604. [Google Scholar] [CrossRef] [PubMed]
- Onódi, Z.; Pelyhe, C.; Terézia Nagy, C.; Brenner, G.B.; Almási, L.; Kittel, Á.; Manček-Keber, M.; Ferdinandy, P.; Buzás, E.I.; Giricz, Z. Isolation of High-Purity Extracellular Vesicles by the Combination of Iodixanol Density Gradient Ultracentrifugation and Bind-Elute Chromatography From Blood Plasma. Front. Physiol. 2018, 9, 1479. [Google Scholar] [CrossRef] [PubMed] [Green Version]
- Benedikter, B.J.; Bouwman, F.G.; Vajen, T.; Heinzmann, A.C.A.; Grauls, G.; Mariman, E.C.; Wouters, E.F.M.; Savelkoul, P.H.; Lopez-Iglesias, C.; Koenen, R.R.; et al. Ultrafiltration combined with size exclusion chromatography efficiently isolates extracellular vesicles from cell culture media for compositional and functional studies. Sci. Rep. 2017, 7, 15297. [Google Scholar] [CrossRef] [PubMed] [Green Version]
- Corso, G.; Mäger, I.; Lee, Y.; Görgens, A.; Bultema, J.; Giebel, B.; Wood, M.J.A.; Nordin, J.Z.; Andaloussi, S.E.L. Reproducible and scalable purification of extracellular vesicles using combined bind-elute and size exclusion chromatography. Sci. Rep. 2017, 7, 11561. [Google Scholar] [CrossRef]
- Zhao, K.; Bleackley, M.; Chisanga, D.; Gangoda, L.; Fonseka, P.; Liem, M.; Kalra, H.; Al Saffar, H.; Keerthikumar, S.; Ang, C.S.; et al. Extracellular vesicles secreted by Saccharomyces cerevisiae are involved in cell wall remodelling. Commun. Biol. 2019, 2, 305. [Google Scholar] [CrossRef] [Green Version]
- Brackmann, L.K.; Poplawski, A.; Grandt, C.L.; Schwarz, H.; Hankeln, T.; Rapp, S.; Zahnreich, S.; Galetzka, D.; Schmitt, I.; Grad, C.; et al. Comparison of time and dose dependent gene expression and affected pathways in primary human fibroblasts after exposure to ionizing radiation. Mol. Med. 2020, 26, 85. [Google Scholar] [CrossRef]
- Skrabalova, J.; Drastichova, Z.; Novotny, J. Morphine as a Potential Oxidative Stress-Causing Agent. Mini. Rev. Org. Chem. 2013, 10, 367–372. [Google Scholar] [CrossRef] [Green Version]
- Zeng, X.; Geng, W.-S.; Wang, Z.; Jia, J. Morphine Addiction and Oxidative Stress: The Potential Effects of Thioredoxin-1. Front. Pharmacol. 2020, 11, 82. [Google Scholar] [CrossRef] [Green Version]
- Calderón-Guzmán, D.; Osnaya-Brizuela, N.; García-Alvarez, R.; Hernández-García, E.; Juárez-Olguín, H. Oxidative stress induced by morphine in brain of rats fed with a protein deficient diet. Hum. Exp. Toxicol. 2009, 28, 577–582. [Google Scholar] [CrossRef]
- Sies, H. Oxidative Stress: Concept and Some Practical Aspects. Antioxidants 2020, 9, 852. [Google Scholar] [CrossRef]
- Skulachev, V.P. Cytochrome c in the apoptotic and antioxidant cascades. FEBS Lett. 1998, 423, 275–280. [Google Scholar] [CrossRef] [PubMed] [Green Version]
- Hockenbery, D.M.; Oltvai, Z.N.; Yin, X.-M.; Milliman, C.L.; Korsmeyer, S.J. Bcl-2 functions in an antioxidant pathway to prevent apoptosis. Cell 1993, 75, 241–251. [Google Scholar] [CrossRef] [PubMed]
- Hensley, K.; Robinson, K.A.; Gabbita, S.P.; Salsman, S.; Floyd, R.A. Reactive oxygen species, cell signaling, and cell injury. Free. Radic. Biol. Med. 2000, 28, 1456–1462. [Google Scholar] [CrossRef] [PubMed]
- Forrester, S.J.; Kikuchi, D.S.; Hernandes, M.S.; Xu, Q.; Griendling, K.K. Reactive Oxygen Species in Metabolic and Inflammatory Signaling. Circ. Res. 2018, 122, 877–902. [Google Scholar] [CrossRef] [PubMed]
- Chelombitko, M.A. Role of Reactive Oxygen Species in Inflammation: A Minireview. Mosc. Univ. Biol. Sci. Bull. 2018, 73, 199–202. [Google Scholar] [CrossRef] [Green Version]
- Yang, J. The role of reactive oxygen species in angiogenesis and preventing tissue injury after brain ischemia. Microvasc. Res. 2019, 123, 62–67. [Google Scholar] [CrossRef]
- Ushio-Fukai, M. Redox signaling in angiogenesis: Role of NADPH oxidase. Cardiovasc. Res. 2006, 71, 226–235. [Google Scholar] [CrossRef] [Green Version]
- Singh, A.; Kukreti, R.; Saso, L.; Kukreti, S. Oxidative Stress: A Key Modulator in Neurodegenerative Diseases. Molecules 2019, 24, 1583. [Google Scholar] [CrossRef] [Green Version]
- Lee, Y.M.; He, W.; Liou, Y.-C. The redox language in neurodegenerative diseases: Oxidative post-translational modifications by hydrogen peroxide. Cell Death Dis. 2021, 12, 58. [Google Scholar] [CrossRef]
- Reactive Oxygen Species and Their Impact in Neurodegenerative Diseases: Literature Landscape Analysis. Antioxid. Redox Signal. 2021, 34, 402–420. [CrossRef]
- Gandhi, S.; Abramov, A.Y. Mechanism of Oxidative Stress in Neurodegeneration. Oxidative Med. Cell. Longev. 2012, 2012, 428010. [Google Scholar] [CrossRef] [PubMed] [Green Version]
- Corcoran, S.E.; O’Neill, L.A. HIF1α and metabolic reprogramming in inflammation. J. Clin. Invest 2016, 126, 3699–3707. [Google Scholar] [CrossRef] [PubMed] [Green Version]
- Fulda, S.; Debatin, K.M. HIF-1-regulated glucose metabolism: A key to apoptosis resistance? Cell Cycle 2007, 6, 790–792. [Google Scholar] [CrossRef] [PubMed] [Green Version]
- Ujcikova, H.; Cechova, K.; Jagr, M.; Roubalova, L.; Vosahlikova, M.; Svoboda, P. Proteomic analysis of protein composition of rat hippocampus exposed to morphine for 10 days; comparison with animals after 20 days of morphine withdrawal. PLoS ONE 2020, 15, e0231721. [Google Scholar] [CrossRef] [Green Version]
- Kim, S.Y.; Chudapongse, N.; Lee, S.M.; Levin, M.C.; Oh, J.T.; Park, H.J.; Ho, I.K. Proteomic analysis of phosphotyrosyl proteins in morphine-dependent rat brains. Brain Res. Mol. Brain Res. 2005, 133, 58–70. [Google Scholar] [CrossRef]
- Huang, Q.; Lan, F.; Zheng, Z.; Xie, F.; Han, J.; Dong, L.; Xie, Y.; Zheng, F. Akt2 kinase suppresses glyceraldehyde-3-phosphate dehydrogenase (GAPDH)-mediated apoptosis in ovarian cancer cells via phosphorylating GAPDH at threonine 237 and decreasing its nuclear translocation. J. Biol. Chem. 2011, 286, 42211–42220. [Google Scholar] [CrossRef] [Green Version]
- Tristan, C.; Shahani, N.; Sedlak, T.W.; Sawa, A. The diverse functions of GAPDH: Views from different subcellular compartments. Cell Sign. 2011, 23, 317–323. [Google Scholar] [CrossRef] [Green Version]
- Hwang, N.R.; Yim, S.-H.; Kim, Y.M.; Jeong, J.; Song, E.J.; Lee, Y.; Lee, J.H.; Choi, S.; Lee, K.-J. Oxidative modifications of glyceraldehyde-3-phosphate dehydrogenase play a key role in its multiple cellular functions. Biochemical. J. 2009, 423, 253–264. [Google Scholar] [CrossRef] [Green Version]
- Flores-Díaz, M.; Alape-Girón, A.; Persson, B.; Pollesello, P.; Moos, M.; von Eichel-Streiber, C.; Thelestam, M.; Florin, I. Cellular UDP-Glucose Deficiency Caused by a Single Point Mutation in the UDP-Glucose Pyrophosphorylase Gene. J. Biol. Chem. 1997, 272, 23784–23791. [Google Scholar] [CrossRef] [Green Version]
- Dienel, G.A. Brain Glucose Metabolism: Integration of Energetics with Function. Physiol. Rev. 2019, 99, 949–1045. [Google Scholar] [CrossRef]
- Ali, M.A.; Schulz, R. Activation of MMP-2 as a key event in oxidative stress injury to the heart. Front Biosci. 2009, 14, 699–716. [Google Scholar] [CrossRef] [Green Version]
- Valentin, F.; Bueb, J.L.; Kieffer, P.; Tschirhart, E.; Atkinson, J. Oxidative stress activates MMP-2 in cultured human coronary smooth muscle cells. Fundam. Clin. Pharmacol. 2005, 19, 661–667. [Google Scholar] [CrossRef] [PubMed]
- Kowluru, R.A.; Kanwar, M. Oxidative stress and the development of diabetic retinopathy: Contributory role of matrix metalloproteinase-2. Free. Radic. Biol. Med. 2009, 46, 1677–1685. [Google Scholar] [CrossRef] [PubMed] [Green Version]
- Kandasamy, A.D.; Chow, A.K.; Ali, M.A.M.; Schulz, R. Matrix metalloproteinase-2 and myocardial oxidative stress injury: Beyond the matrix. Cardiovasc. Res. 2009, 85, 413–423. [Google Scholar] [CrossRef] [PubMed] [Green Version]
- Kameda, K.; Matsunaga, T.; Abe, N.; Hanada, H.; Ishizaka, H.; Ono, H.; Saitoh, M.; Fukui, K.; Fukuda, I.; Osanai, T.; et al. Correlation of oxidative stress with activity of matrix metalloproteinase in patients with coronary artery disease: Possible role for left ventricular remodelling. Eur. Heart J. 2003, 24, 2180–2185. [Google Scholar] [CrossRef] [PubMed]
- Rosenberg, G.A.; Navratil, M.; Barone, F.; Feuerstein, G. Proteolytic cascade enzymes increase in focal cerebral ischemia in rat. J. Cereb. Blood Flow Metab. 1996, 16, 360–366. [Google Scholar] [CrossRef]
- Romanic, A.M.; White, R.F.; Arleth, A.J.; Ohlstein, E.H.; Barone, F.C. Matrix Metalloproteinase Expression Increases After Cerebral Focal Ischemia in Rats. Stroke 1998, 29, 1020–1030. [Google Scholar] [CrossRef] [Green Version]
- Rosenberg, G.A.; Estrada, E.Y.; Dencoff, J.E. Matrix metalloproteinases and TIMPs are associated with blood-brain barrier opening after reperfusion in rat brain. Stroke 1998, 29, 2189–2195. [Google Scholar] [CrossRef] [Green Version]
- Gasche, Y.; Copin, J.C.; Sugawara, T.; Fujimura, M.; Chan, P.H. Matrix metalloproteinase inhibition prevents oxidative stress-associated blood-brain barrier disruption after transient focal cerebral ischemia. J. Cereb. Blood Flow Metab. 2001, 21, 1393–1400. [Google Scholar] [CrossRef] [Green Version]
- Lou, J.; Gasche, Y.; Zheng, L.; Giroud, C.; Morel, P.; Clements, J.; Ythier, A.; Grau, G.E. Interferon-beta inhibits activated leukocyte migration through human brain microvascular endothelial cell monolayer. Lab. Invest. 1999, 79, 1015–1025. [Google Scholar]
- Lee, K.W.; Kim, S.J.; Park, J.B.; Lee, K.J. Relationship between depression anxiety stress scale (DASS) and urinary hydroxyproline and proline concentrations in hospital workers. J. Prev. Med. Public Health 2011, 44, 9–13. [Google Scholar] [CrossRef]
- Murphy, J.M.; Murch, S.J.; Ball, R.O. Proline is synthesized from glutamate during intragastric infusion but not during intravenous infusion in neonatal piglets. J. Nutr. 1996, 126, 878–886. [Google Scholar] [CrossRef] [Green Version]
- Berretta, S. Extracellular matrix abnormalities in schizophrenia. Neuropharmacology 2012, 62, 1584–1597. [Google Scholar] [CrossRef] [Green Version]
- Bonello, S.; Zähringer, C.; BelAiba, R.S.; Djordjevic, T.; Hess, J.; Michiels, C.; Kietzmann, T.; Görlach, A. Reactive oxygen species activate the HIF-1alpha promoter via a functional NFkappaB site. Arterioscler. Thromb. Vasc. Biol. 2007, 27, 755–761. [Google Scholar] [CrossRef] [Green Version]
- Biasutto, L.; Chiechi, A.; Couch, R.; Liotta, L.A.; Espina, V. Retinal pigment epithelium (RPE) exosomes contain signaling phosphoproteins affected by oxidative stress. Exp. Cell Res. 2013, 319, 2113–2123. [Google Scholar] [CrossRef] [Green Version]
- Eldh, M.; Ekström, K.; Valadi, H.; Sjöstrand, M.; Olsson, B.; Jernås, M.; Lötvall, J. Exosomes communicate protective messages during oxidative stress; possible role of exosomal shuttle RNA. PLoS ONE 2010, 5, e15353. [Google Scholar] [CrossRef] [Green Version]
- Liao, K.; Niu, F.; Hu, G.; Yang, L.; Dallon, B.; Villarreal, D.; Buch, S. Morphine-mediated release of miR-138 in astrocyte-derived extracellular vesicles promotes microglial activation. J. Extracell. Vesicles 2020, 10, e12027. [Google Scholar] [CrossRef]
- Burger, D.; Kwart, D.G.; Montezano, A.C.; Read, N.C.; Kennedy, C.R.; Thompson, C.S.; Touyz, R.M. Microparticles induce cell cycle arrest through redox-sensitive processes in endothelial cells: Implications in vascular senescence. J. Am. Heart Assoc. 2012, 1, e001842. [Google Scholar] [CrossRef] [Green Version]
- Loyer, X.; Vion, A.C.; Tedgui, A.; Boulanger, C.M. Microvesicles as cell-cell messengers in cardiovascular diseases. Circ. Res. 2014, 114, 345–353. [Google Scholar] [CrossRef] [Green Version]
- Cai, Z.Y.; Xiao, M.; Quazi, S.H.; Ke, Z.Y. Exosomes: A novel therapeutic target for Alzheimer’s disease? Neural. Regen. Res. 2018, 13, 930–935. [Google Scholar] [CrossRef]
- Tian, C.; Gao, L.; Zucker, I.H. Regulation of Nrf2 signaling pathway in heart failure: Role of extracellular vesicles and non-coding RNAs. Free. Radic. Biol. Med. 2021, 167, 218–231. [Google Scholar] [CrossRef] [PubMed]
- Ho, J.; Chaiswing, L.; St Clair, D.K. Extracellular Vesicles and Cancer Therapy: Insights into the Role of Oxidative Stress. Antioxidants 2022, 11, 1194. [Google Scholar] [CrossRef] [PubMed]
- Ma, J.; Shi, X.; Li, M.; Chen, S.; Gu, Q.; Zheng, J.; Li, D.; Wu, S.; Yang, H.; Li, X. MicroRNA-181a–2–3p shuttled by mesenchymal stem cell-secreted extracellular vesicles inhibits oxidative stress in Parkinson’s disease by inhibiting EGR1 and NOX4. Cell Death Discov. 2022, 8, 33. [Google Scholar] [CrossRef] [PubMed]
- Garnier, D.; Jabado, N.; Rak, J. Extracellular vesicles as prospective carriers of oncogenic protein signatures in adult and paediatric brain tumours. Proteomics 2013, 13, 1595–1607. [Google Scholar] [CrossRef] [PubMed]
- Martins, S.G.; Zilhão, R.; Thorsteinsdóttir, S.; Carlos, A.R. Linking Oxidative Stress and DNA Damage to Changes in the Expression of Extracellular Matrix Components. Front. Genet. 2021, 12, 673002. [Google Scholar] [CrossRef]
- Verstappen, J.; Von den Hoff, J.W. Tissue inhibitors of metalloproteinases (TIMPs): Their biological functions and involvement in oral disease. J. Dent. Res. 2006, 85, 1074–1084. [Google Scholar] [CrossRef]
- Hannas, A.R.; Pereira, J.C.; Granjeiro, J.M.; Tjäderhane, L. The role of matrix metalloproteinases in the oral environment. Acta Odontol. Scand. 2007, 65, 1–13. [Google Scholar] [CrossRef]
- Mehra, A.; Ali, C.; Parcq, J.; Vivien, D.; Docagne, F. The plasminogen activation system in neuroinflammation. Biochim. Biophys. Acta Mol. Basis Dis. 2016, 1862, 395–402. [Google Scholar] [CrossRef]
- Wardlaw, J.M.; Murray, V.; Berge, E.; del Zoppo, G.J. Thrombolysis for acute ischaemic stroke. Cochrane Database Syst. Rev. 2014, 2014, CD000213. [Google Scholar] [CrossRef]
- Lee, M.H.; Vosburgh, E.; Anderson, K.; McDonagh, J. Deficiency of plasma plasminogen activator inhibitor 1 results in hyperfibrinolytic bleeding. Blood 1993, 81, 2357–2362. [Google Scholar] [CrossRef] [Green Version]
- Fay, W.P.; Parker, A.C.; Condrey, L.R.; Shapiro, A.D. Human plasminogen activator inhibitor-1 (PAI-1) deficiency: Characterization of a large kindred with a null mutation in the PAI-1 gene. Blood 1997, 90, 204–208. [Google Scholar] [CrossRef] [PubMed]
- Jankun, J.; Aleem, A.M.; Selman, S.H.; Skrzypczak-Jankun, E.; Lysiak-Szydlowska, W.; Grafos, N.; Fryer, H.J.; Greenfield, R.S. Highly stable plasminogen activator inhibitor type one (VLHL PAI-1) protects fibrin clots from tissue plasminogen activator-mediated fibrinolysis. Int. J. Mol. Med. 2007, 20, 683–687. [Google Scholar] [PubMed] [Green Version]
- Simpson, A.J.; Booth, N.A.; Moore, N.R.; Bennett, B. Distribution of plasminogen activator inhibitor (PAI-1) in tissues. J. Clin. Pathol. 1991, 44, 139–143. [Google Scholar] [CrossRef] [PubMed] [Green Version]
- Wilhelm, C.J.; Hashimoto, J.G.; Roberts, M.L.; Zhang, X.; Goeke, C.M.; Bloom, S.H.; Guizzetti, M. Plasminogen activator system homeostasis and its dysregulation by ethanol in astrocyte cultures and the developing brain. Neuropharmacology 2018, 138, 193–209. [Google Scholar] [CrossRef]
- Wang, W.; Jia, L. Regulatory Mechanism of MicroRNA-30b on Neonatal Hypoxic-Ischemic Encephalopathy (HIE). J. Stroke Cerebrovasc. Dis. 2021, 30, 105553. [Google Scholar] [CrossRef]
- González, A.; Pariente, J.A.; Salido, G.M. Ethanol stimulates ROS generation by mitochondria through Ca2+ mobilization and increases GFAP content in rat hippocampal astrocytes. Brain Res. 2007, 1178, 28–37. [Google Scholar] [CrossRef]
- Alfonso-Loeches, S.; Ureña-Peralta, J.R.; Morillo-Bargues, M.J.; Oliver-De La Cruz, J.; Guerri, C. Role of mitochondria ROS generation in ethanol-induced NLRP3 inflammasome activation and cell death in astroglial cells. Front Cell Neurosci. 2014, 8, 216. [Google Scholar] [CrossRef] [Green Version]
- Bailey, S.M.; Pietsch, E.C.; Cunningham, C.C. Ethanol stimulates the production of reactive oxygen species at mitochondrial complexes I and III. Free. Radic. Biol. Med. 1999, 27, 891–900. [Google Scholar] [CrossRef]
- Tafani, M.; Sansone, L.; Limana, F.; Arcangeli, T.; De Santis, E.; Polese, M.; Fini, M.; Russo, M.A. The Interplay of Reactive Oxygen Species, Hypoxia, Inflammation, and Sirtuins in Cancer Initiation and Progression. Oxidative Med. Cell. Longev. 2016, 2016, 3907147. [Google Scholar] [CrossRef] [Green Version]
- Chen, R.; Lai, U.H.; Zhu, L.; Singh, A.; Ahmed, M.; Forsyth, N.R. Reactive Oxygen Species Formation in the Brain at Different Oxygen Levels: The Role of Hypoxia Inducible Factors. Front Cell Dev. Biol. 2018, 6, 132. [Google Scholar] [CrossRef] [Green Version]
- Chandel, N.S.; Maltepe, E.; Goldwasser, E.; Mathieu, C.E.; Simon, M.C.; Schumacker, P.T. Mitochondrial reactive oxygen species trigger hypoxia-induced transcription. Proc. Natl. Acad. Sci. USA 1998, 95, 11715–11720. [Google Scholar] [CrossRef] [PubMed]
- Shi, Y.; Yuan, S.; Tang, S.J. Reactive Oxygen Species (ROS) are Critical for Morphine Exacerbation of HIV-1 gp120-Induced Pain. J. Neuroimmune. Pharmacol. 2021, 16, 581–591. [Google Scholar] [CrossRef] [PubMed]
- Guizzetti, M.; Zhang, X.; Goeke, C.; Gavin, D.P. Glia and Neurodevelopment: Focus on Fetal Alcohol Spectrum Disorders. Front. Pediatr. 2014, 2, 123. [Google Scholar] [CrossRef] [PubMed] [Green Version]
- Zhang, F.; Zhang, Y.; Da, J.; Jia, Z.; Wu, H.; Gu, K. Downregulation of SPARC Expression Decreases Cell Migration and Invasion Involving Epithelial-Mesenchymal Transition through the p-FAK/p-ERK Pathway in Esophageal Squamous Cell Carcinoma. J. Cancer 2020, 11, 414–420. [Google Scholar] [CrossRef]
- Wang, J.; Yin, L.; Chen, Z. New insights into the altered fibronectin matrix and extrasynaptic transmission in the aging brain. J. Clin. Gerontol. Geriatr. 2011, 2, 35–41. [Google Scholar] [CrossRef]
- Alkabie, S.; Basivireddy, J.; Zhou, L.; Roskams, J.; Rieckmann, P.; Quandt, J.A. SPARC expression by cerebral microvascular endothelial cells in vitro and its influence on blood-brain barrier properties. J. Neuroinflamm. 2016, 13, 225. [Google Scholar] [CrossRef]


Publisher’s Note: MDPI stays neutral with regard to jurisdictional claims in published maps and institutional affiliations. |
© 2022 by the authors. Licensee MDPI, Basel, Switzerland. This article is an open access article distributed under the terms and conditions of the Creative Commons Attribution (CC BY) license (https://creativecommons.org/licenses/by/4.0/).
Share and Cite
Vujić, T.; Schvartz, D.; Furlani, I.L.; Meister, I.; González-Ruiz, V.; Rudaz, S.; Sanchez, J.-C. Oxidative Stress and Extracellular Matrix Remodeling Are Signature Pathways of Extracellular Vesicles Released upon Morphine Exposure on Human Brain Microvascular Endothelial Cells. Cells 2022, 11, 3926. https://doi.org/10.3390/cells11233926
Vujić T, Schvartz D, Furlani IL, Meister I, González-Ruiz V, Rudaz S, Sanchez J-C. Oxidative Stress and Extracellular Matrix Remodeling Are Signature Pathways of Extracellular Vesicles Released upon Morphine Exposure on Human Brain Microvascular Endothelial Cells. Cells. 2022; 11(23):3926. https://doi.org/10.3390/cells11233926
Chicago/Turabian StyleVujić, Tatjana, Domitille Schvartz, Izadora Liranço Furlani, Isabel Meister, Víctor González-Ruiz, Serge Rudaz, and Jean-Charles Sanchez. 2022. "Oxidative Stress and Extracellular Matrix Remodeling Are Signature Pathways of Extracellular Vesicles Released upon Morphine Exposure on Human Brain Microvascular Endothelial Cells" Cells 11, no. 23: 3926. https://doi.org/10.3390/cells11233926