
Rnd3 Is a Crucial Mediator of the Invasive Phenotype of Glioblastoma Cells Downstream of Receptor Tyrosine Kinase Signalling
 , and
, and 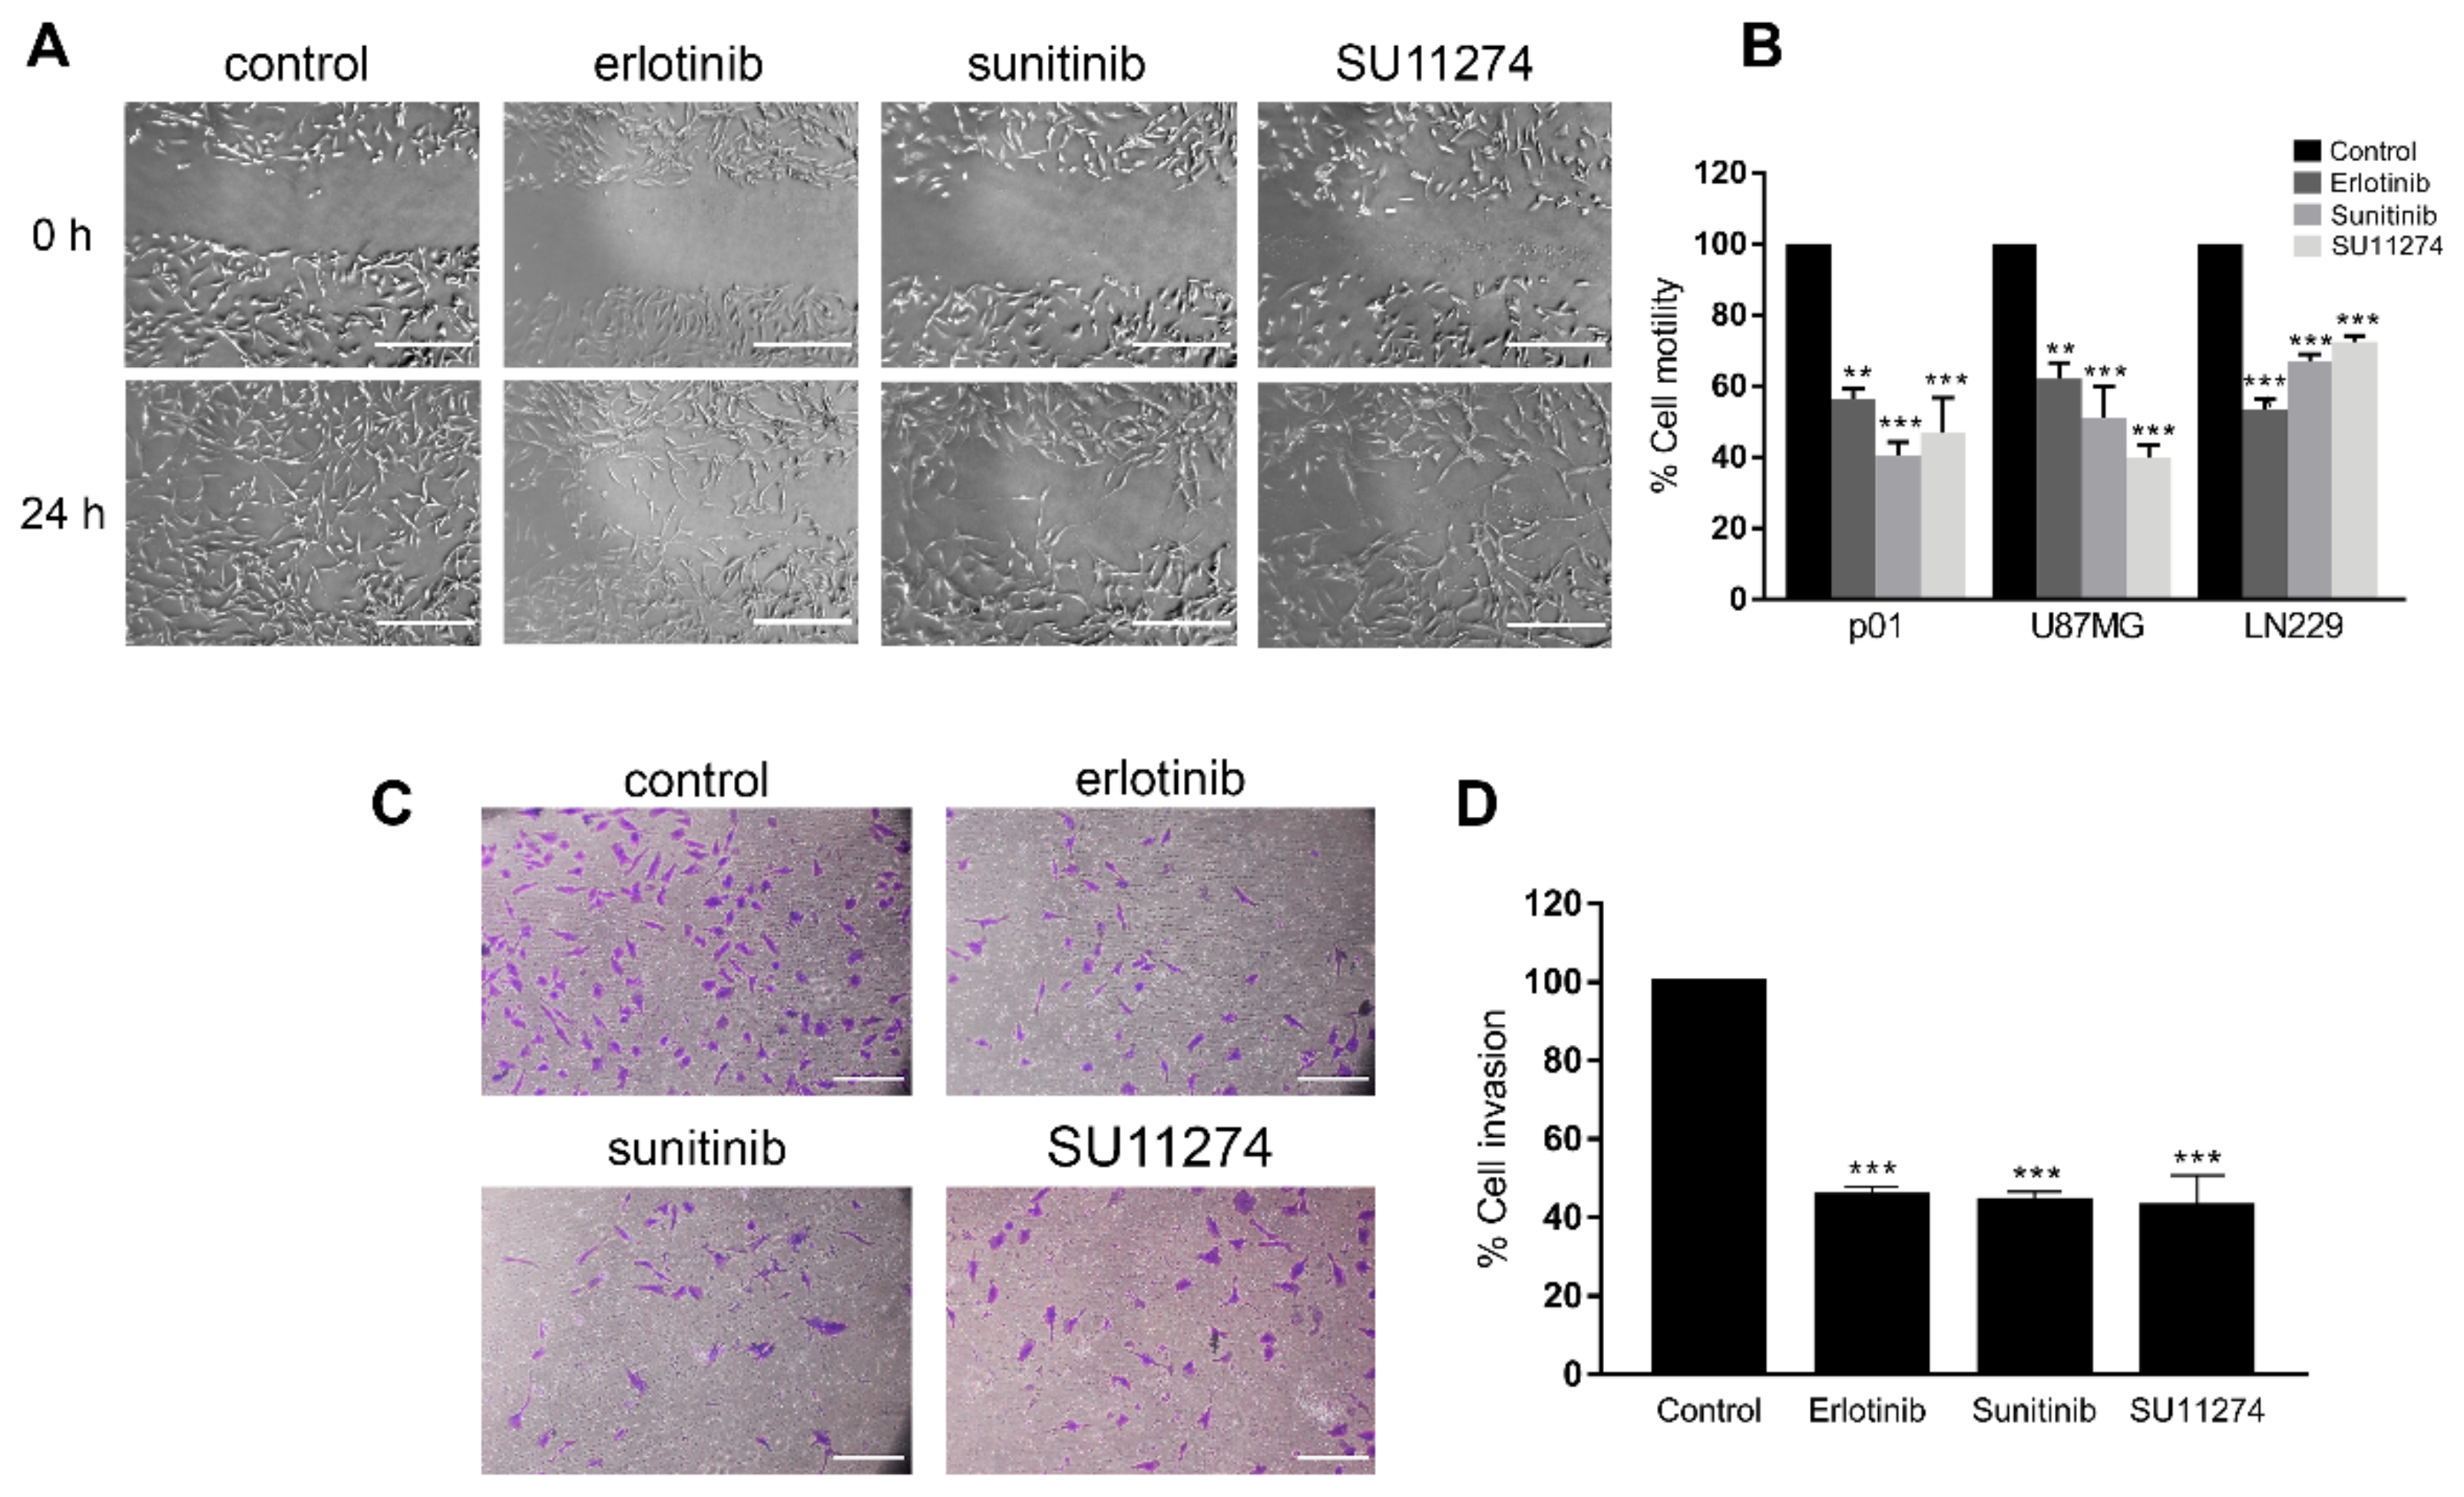
Abstract
:1. Introduction
2. Materials and Methods
2.1. Cell Culture and Drug Treatment
2.2. Expression Vectors, Transfection and shRNA-Mediated Gene Silencing
2.3. Cell Proliferation
2.4. Motility and Invasion Assays
2.5. Immunofluorescence
2.6. Gel Electrophoresis and Immunoblotting
2.7. Measurement of Rho GTPase Activity
2.8. Statistical Analysis
3. Results
3.1. Receptor Tyrosine Kinase Inhibition in GBM Cells Reduces Cell Motility and Invasion and Promotes Actin Cytoskeleton Reorganization
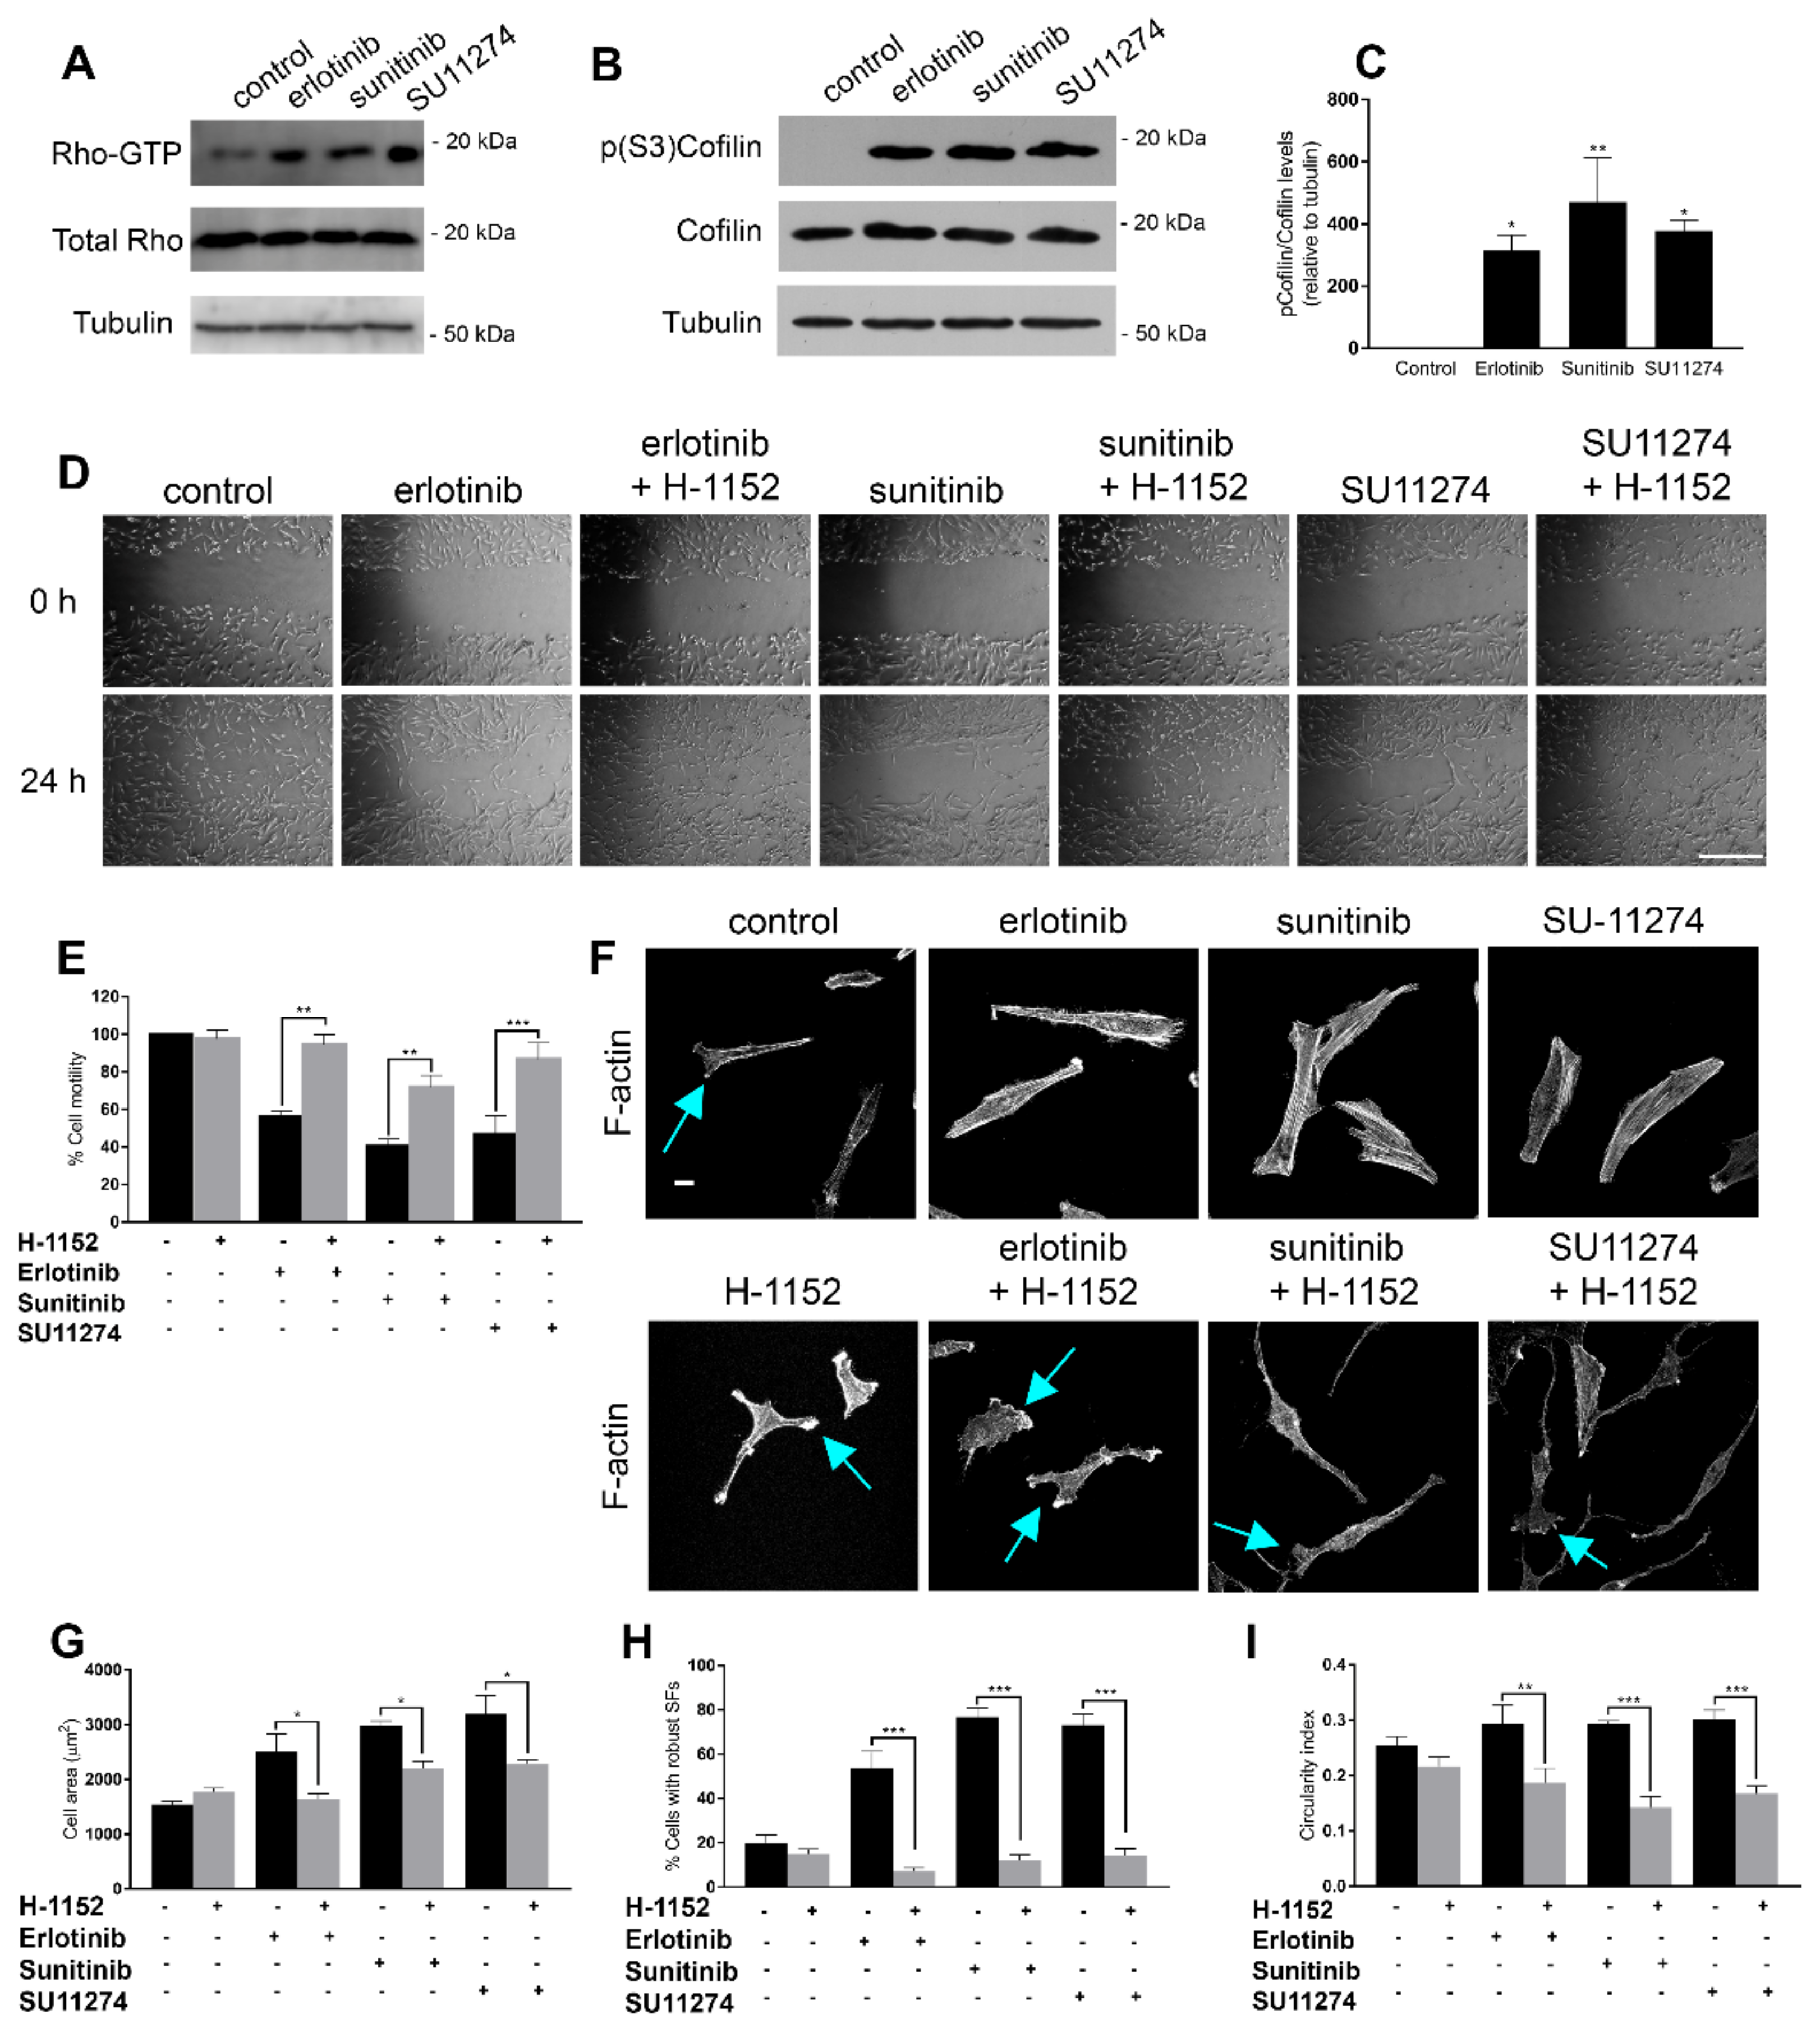
3.2. Receptor Tyrosine Kinase Inhibition in GBM Cells Regulates Cell Motility and Actin Cytoskeleton Reorganization through Modulation of Rho/ROCK Activity
3.3. Rnd3 Is a Downstream Target of RTK Signalling That Participates in Actin Cytoskeleton Reorganization
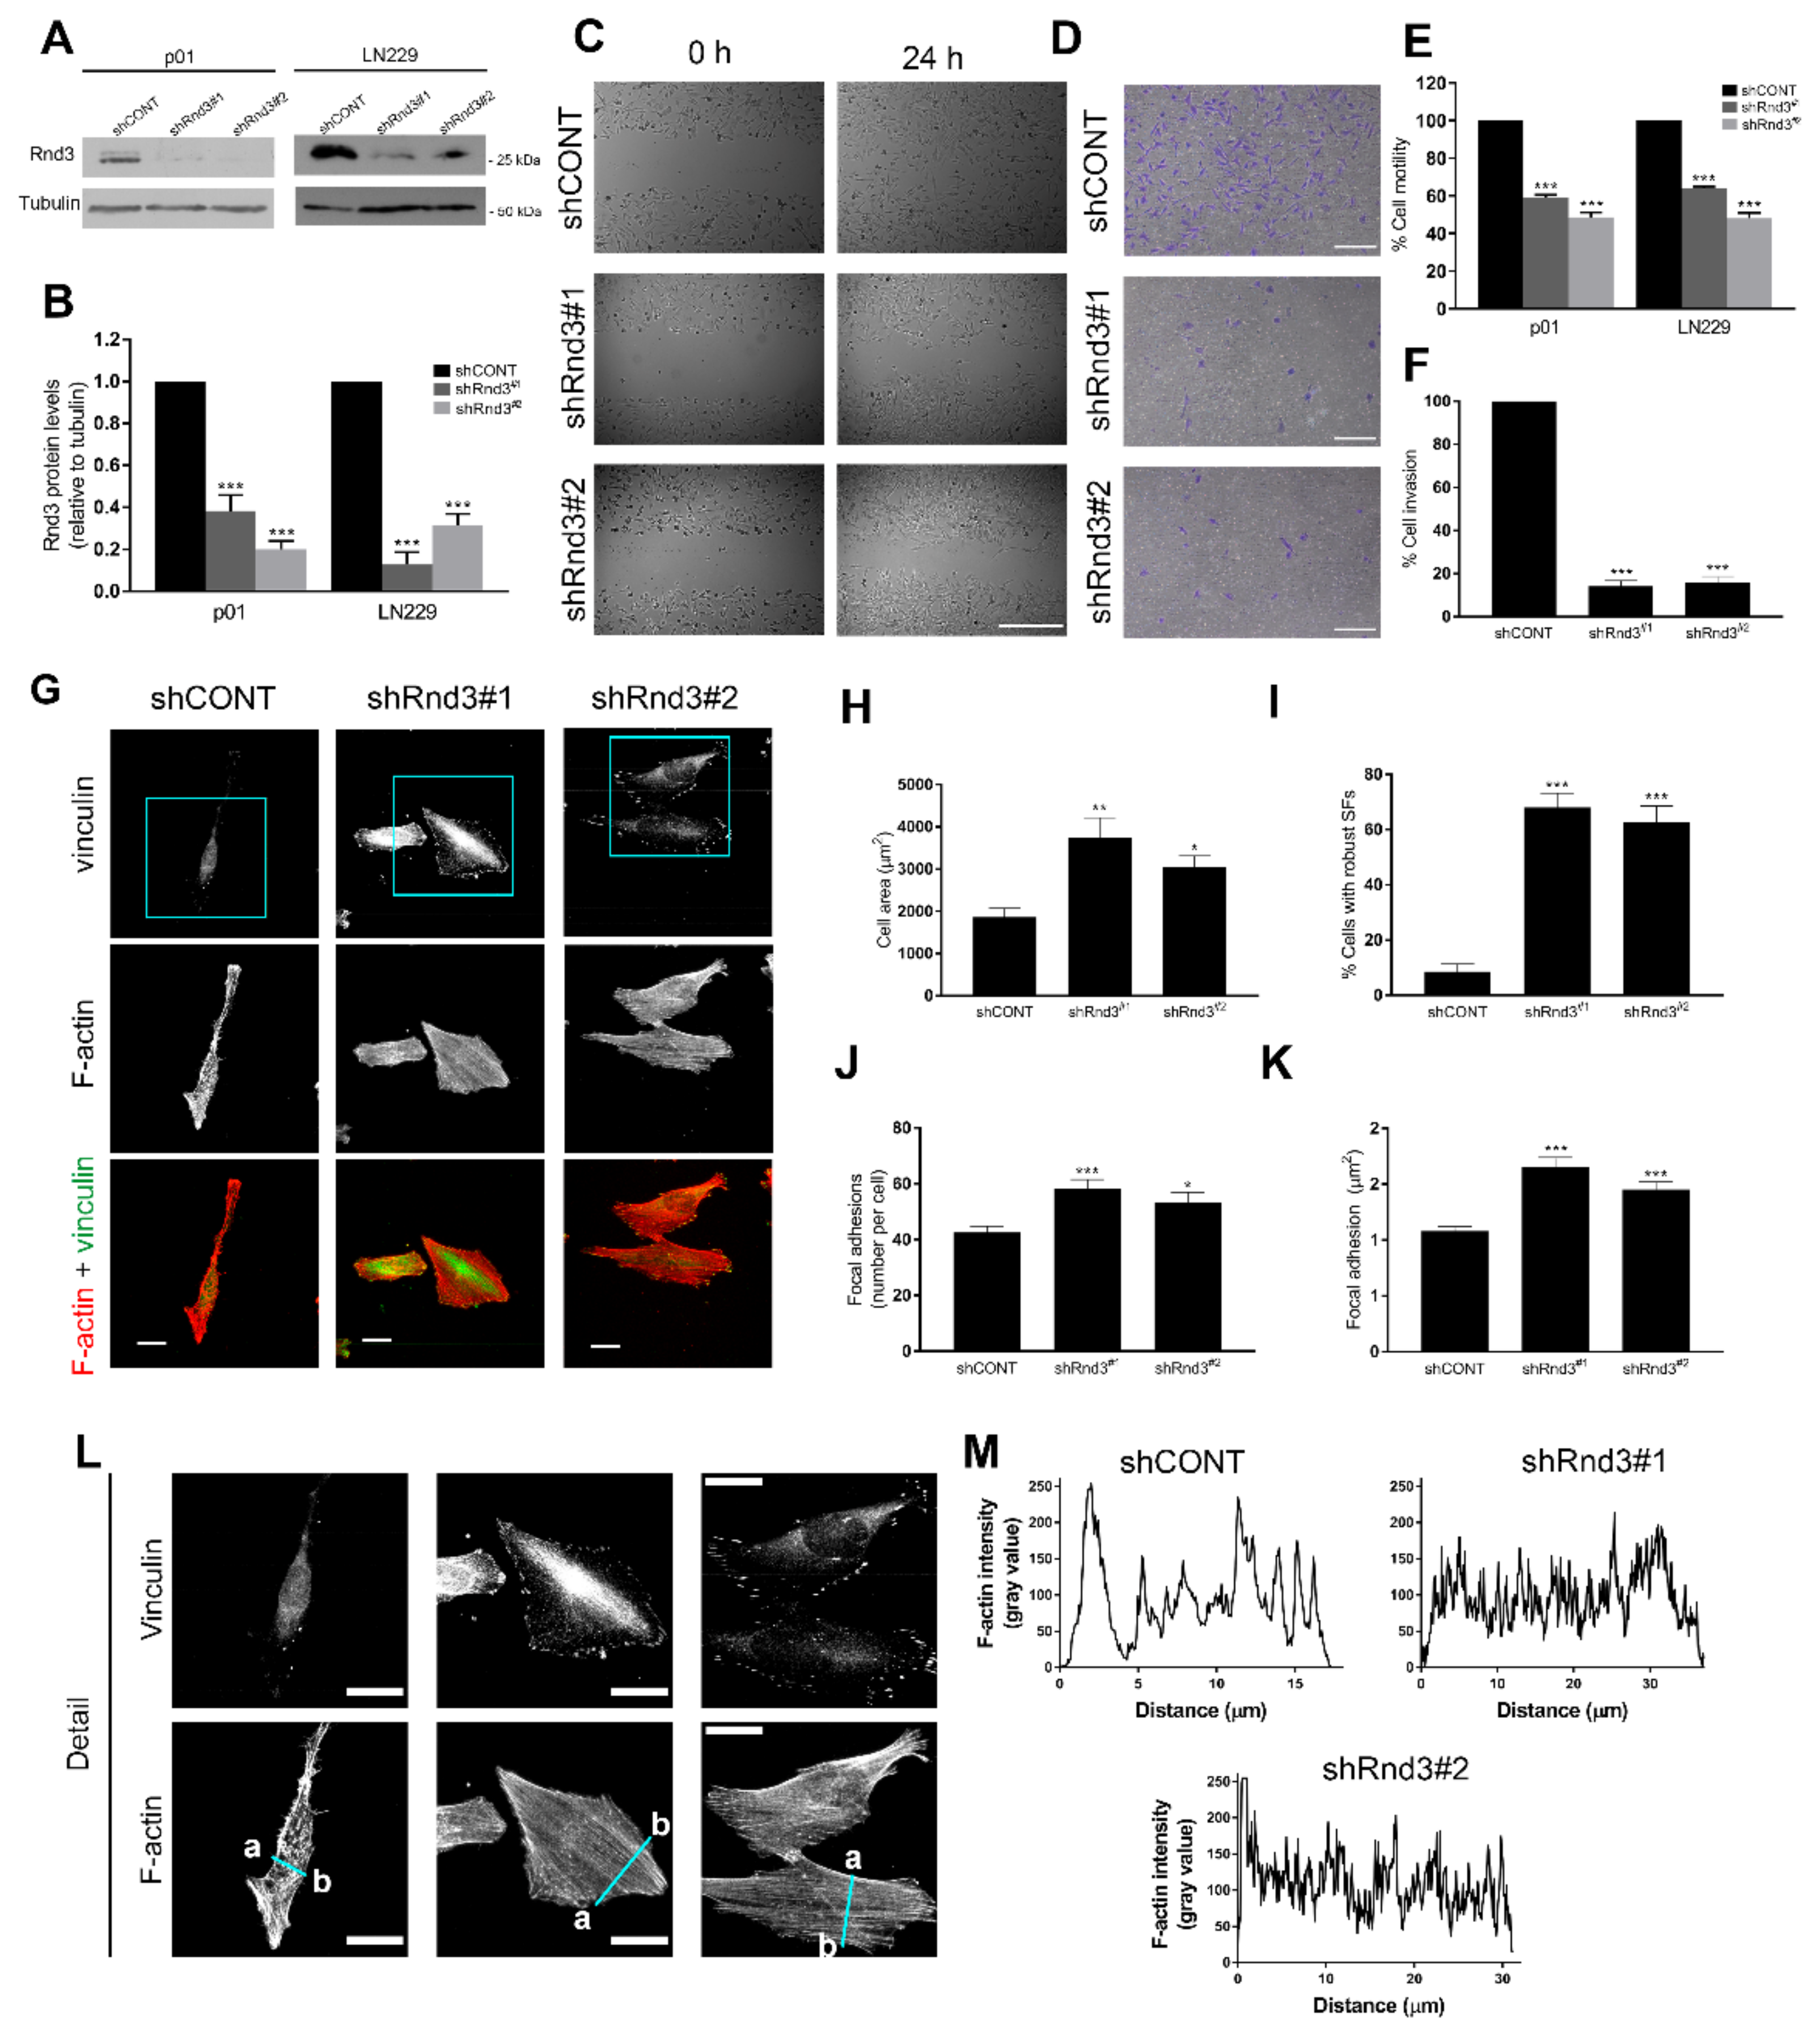
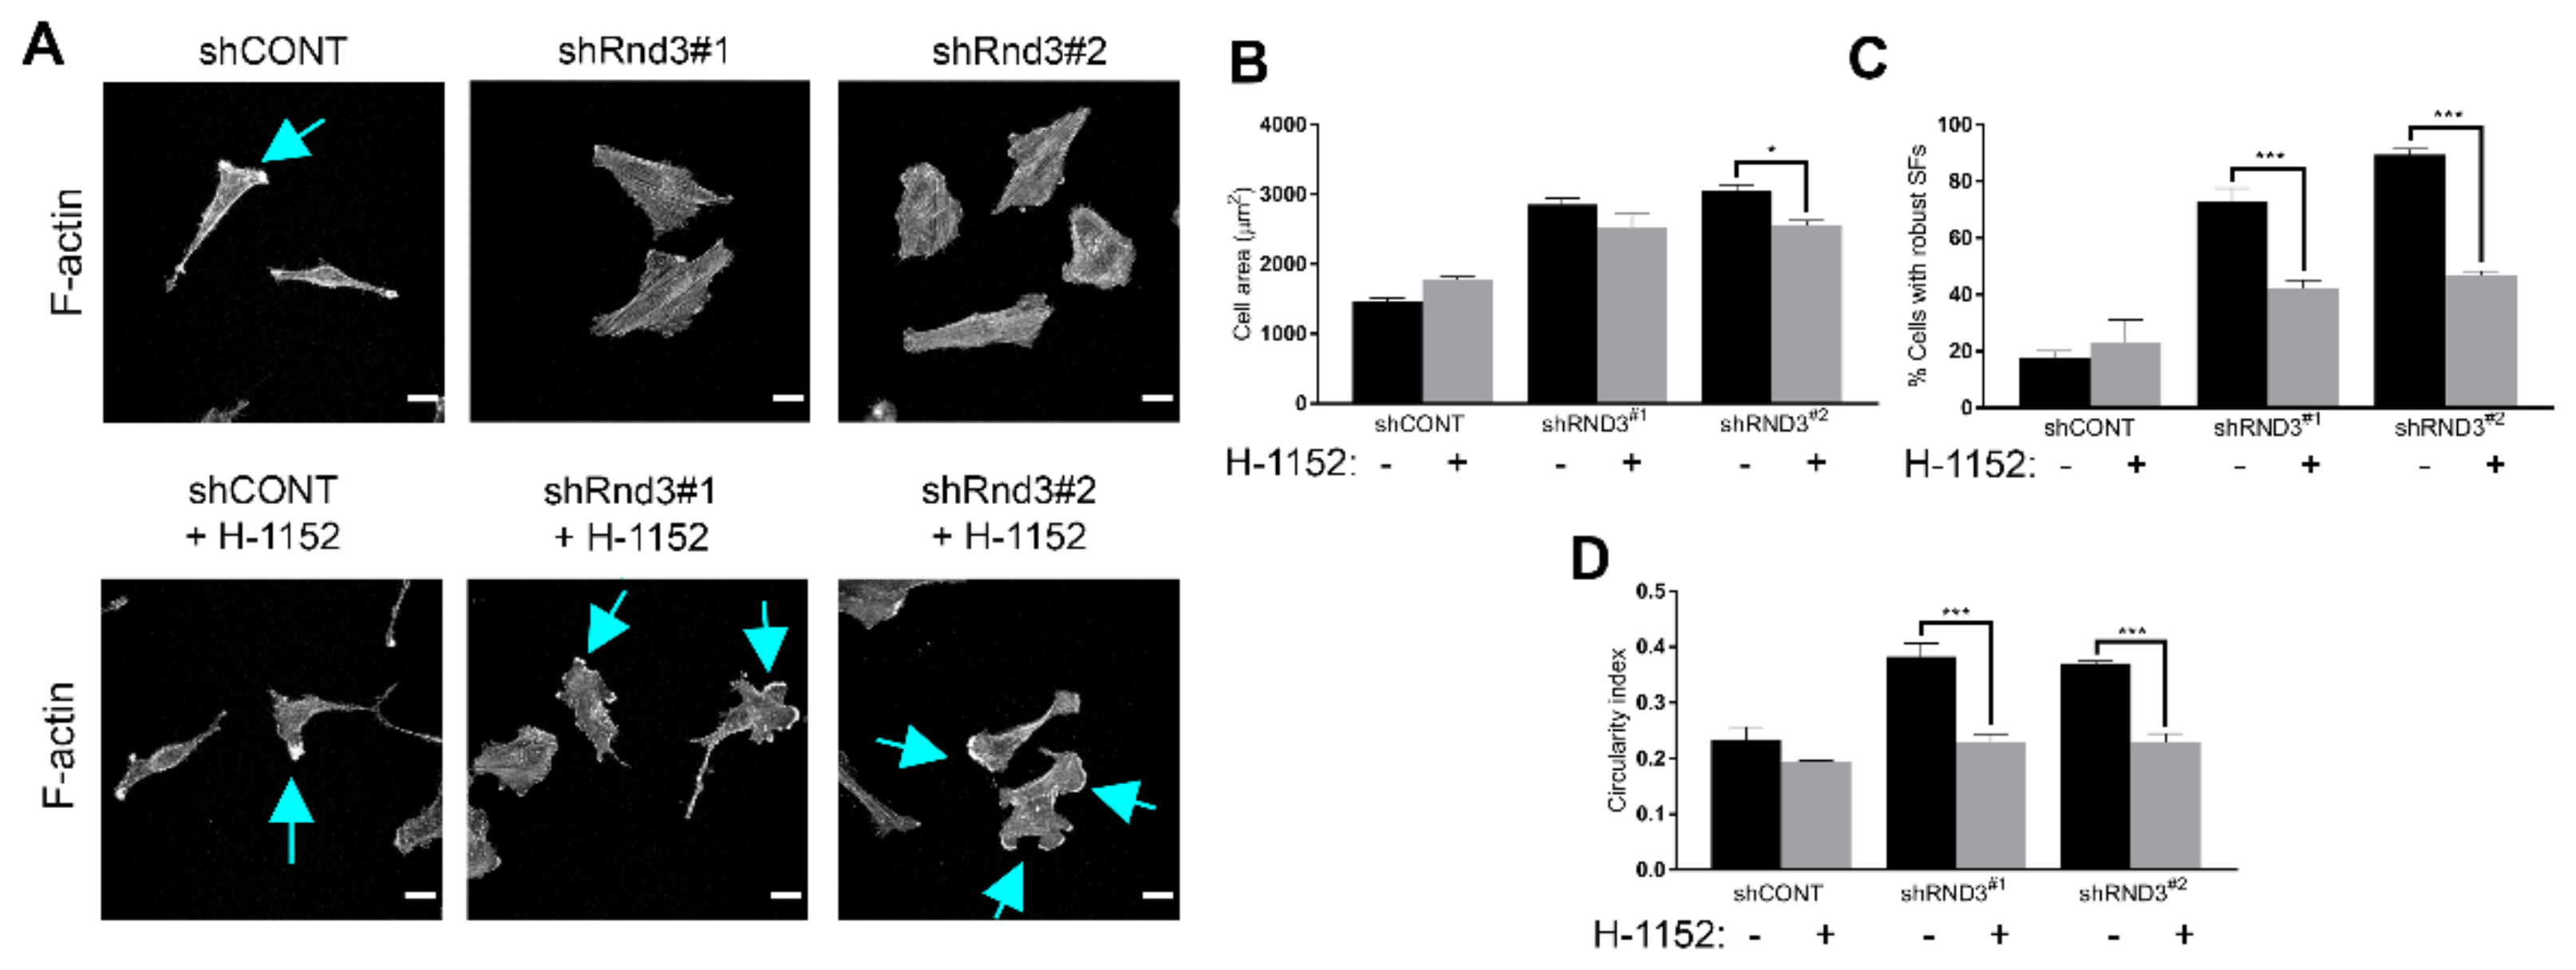
3.4. Rnd3 Silencing Recapitulates the Effects of RTK Inhibition on Cell Motility and Actin Cytoskeleton Organization
4. Discussion
Supplementary Materials
Author Contributions
Funding
Informed Consent Statement
Data Availability Statement
Acknowledgments
Conflicts of Interest
References
- Maher, E.A.; Furnari, F.B.; Bachoo, R.M.; Rowitch, D.H.; Louis, D.N.; Cavenee, W.K.; DePinho, R.A. Malignant glioma: Genetics and biology of a grave matter. Genes Dev. 2001, 15, 1311–1333. [Google Scholar] [CrossRef] [PubMed] [Green Version]
- Giese, A.; Bjerkvig, R.; Berens, M.E.; Westphal, M. Cost of migration: Invasion of malignant gliomas and implications for treatment. J. Clin. Oncol. 2003, 21, 1624–1636. [Google Scholar] [CrossRef] [PubMed]
- The Cancer Genome Atlas Research Network. Comprehensive genomic characterization defines human glioblastoma genes and core pathways. Nature 2008, 455, 1061–1068. [Google Scholar] [CrossRef] [PubMed] [Green Version]
- Dunn, G.P.; Rinne, M.L.; Wykosky, J.; Genovese, G.; Quayle, S.N.; Dunn, I.F.; Agarwalla, P.K.; Chheda, M.G.; Campos, B.; Wang, A.; et al. Emerging insights into the molecular and cellular basis of glioblastoma. Genes Dev. 2012, 26, 756–784. [Google Scholar] [CrossRef] [PubMed] [Green Version]
- Halatsch, M.E.; Schmidt, U.; Behnke-Mursch, J.; Unterberg, A.; Wirtz, C.R. Epidermal growth factor receptor inhibition for the treatment of glioblastoma multiforme and other malignant brain tumours. Cancer Treat. Rev. 2006, 32, 74–89. [Google Scholar] [CrossRef]
- Nishikawa, R.; Ji, X.D.; Harmon, R.C.; Lazar, C.S.; Gill, G.N.; Cavenee, W.K.; Huang, H.J. A mutant epidermal growth factor receptor common in human glioma confers enhanced tumorigenicity. Proc. Natl. Acad. Sci. USA 1994, 91, 7727–7731. [Google Scholar] [CrossRef] [Green Version]
- Hermanson, M.; Funa, K.; Hartman, M.; Claesson-Welsh, L.; Heldin, C.H.; Westermark, B.; Nister, M. Platelet-derived growth factor and its receptors in human glioma tissue: Expression of messenger RNA and protein suggests the presence of autocrine and paracrine loops. Cancer Res. 1992, 52, 3213–3219. [Google Scholar]
- Lamszus, K.; Ulbricht, U.; Matschke, J.; Brockmann, M.A.; Fillbrandt, R.; Westphal, M. Levels of soluble vascular endothelial growth factor (VEGF) receptor 1 in astrocytic tumors and its relation to malignancy, vascularity, and VEGF-A. Clin. Cancer Res. 2003, 9, 1399–1405. [Google Scholar]
- Mulcahy, E.Q.X.; Colomicronn, R.R.; Abounader, R. HGF/MET Signaling in Malignant Brain Tumors. Int. J. Mol. Sci. 2020, 21, 7546. [Google Scholar] [CrossRef]
- Tilak, M.; Holborn, J.; New, L.A.; Lalonde, J.; Jones, N. Receptor Tyrosine Kinase Signaling and Targeting in Glioblastoma Multiforme. Int. J. Mol. Sci. 2021, 22, 1831. [Google Scholar] [CrossRef]
- Ridley, A.J. Rho GTPase signalling in cell migration. Curr. Opin. Cell Biol. 2015, 36, 103–112. [Google Scholar] [CrossRef] [Green Version]
- Ridley, A.J.; Hall, A. The small GTP-binding protein rho regulates the assembly of focal adhesions and actin stress fibers in response to growth factors. Cell 1992, 70, 389–399. [Google Scholar] [CrossRef]
- Ridley, A.J.; Paterson, H.F.; Johnston, C.L.; Diekmann, D.; Hall, A. The small GTP-binding protein rac regulates growth factor-induced membrane ruffling. Cell 1992, 70, 401–410. [Google Scholar] [CrossRef]
- Fortin Ensign, S.P.; Mathews, I.T.; Symons, M.H.; Berens, M.E.; Tran, N.L. Implications of Rho GTPase Signaling in Glioma Cell Invasion and Tumor Progression. Front. Oncol. 2013, 3, 241. [Google Scholar] [CrossRef] [Green Version]
- Tran, N.L.; McDonough, W.S.; Savitch, B.A.; Fortin, S.P.; Winkles, J.A.; Symons, M.; Nakada, M.; Cunliffe, H.E.; Hostetter, G.; Hoelzinger, D.B.; et al. Increased fibroblast growth factor-inducible 14 expression levels promote glioma cell invasion via Rac1 and nuclear factor-kappaB and correlate with poor patient outcome. Cancer Res. 2006, 66, 9535–9542. [Google Scholar] [CrossRef] [Green Version]
- Goldberg, L.; Kloog, Y. A Ras inhibitor tilts the balance between Rac and Rho and blocks phosphatidylinositol 3-kinase-dependent glioblastoma cell migration. Cancer Res. 2006, 66, 11709–11717. [Google Scholar] [CrossRef] [Green Version]
- Okura, H.; Golbourn, B.J.; Shahzad, U.; Agnihotri, S.; Sabha, N.; Krieger, J.R.; Figueiredo, C.A.; Chalil, A.; Landon-Brace, N.; Riemenschneider, A.; et al. A role for activated Cdc42 in glioblastoma multiforme invasion. Oncotarget 2016, 7, 56958–56975. [Google Scholar] [CrossRef]
- Kwiatkowska, A.; Didier, S.; Fortin, S.; Chuang, Y.; White, T.; Berens, M.E.; Rushing, E.; Eschbacher, J.; Tran, N.L.; Chan, A.; et al. The small GTPase RhoG mediates glioblastoma cell invasion. Mol. Cancer 2012, 11, 65. [Google Scholar] [CrossRef] [Green Version]
- Riou, P.; Villalonga, P.; Ridley, A.J. Rnd proteins: Multifunctional regulators of the cytoskeleton and cell cycle progression. Bioessays 2010, 32, 986–992. [Google Scholar] [CrossRef]
- Foster, R.; Hu, K.Q.; Lu, Y.; Nolan, K.M.; Thissen, J.; Settleman, J. Identification of a novel human Rho protein with unusual properties: GTPase deficiency and in vivo farnesylation. Mol. Cell. Biol. 1996, 16, 2689–2699. [Google Scholar] [CrossRef] [Green Version]
- Chardin, P. Function and regulation of Rnd proteins. Nat. Rev. Mol. Cell Biol. 2006, 7, 54–62. [Google Scholar] [CrossRef] [PubMed]
- Wennerberg, K.; Forget, M.A.; Ellerbroek, S.M.; Arthur, W.T.; Burridge, K.; Settleman, J.; Der, C.J.; Hansen, S.H. Rnd proteins function as RhoA antagonists by activating p190 RhoGAP. Curr. Biol. 2003, 13, 1106–1115. [Google Scholar] [CrossRef]
- Riento, K.; Guasch, R.M.; Garg, R.; Jin, B.; Ridley, A.J. RhoE binds to ROCK I and inhibits downstream signaling. Mol. Cell. Biol. 2003, 23, 4219–4229. [Google Scholar] [CrossRef] [PubMed] [Green Version]
- Guasch, R.M.; Scambler, P.; Jones, G.E.; Ridley, A.J. RhoE regulates actin cytoskeleton organization and cell migration. Mol. Cell. Biol. 1998, 18, 4761–4771. [Google Scholar] [CrossRef] [PubMed] [Green Version]
- Villalonga, P.; Guasch, R.M.; Riento, K.; Ridley, A.J. RhoE inhibits cell cycle progression and Ras-induced transformation. Mol. Cell. Biol. 2004, 24, 7829–7840. [Google Scholar] [CrossRef] [PubMed] [Green Version]
- Poch, E.; Minambres, R.; Mocholi, E.; Ivorra, C.; Perez-Arago, A.; Guerri, C.; Perez-Roger, I.; Guasch, R.M. RhoE interferes with Rb inactivation and regulates the proliferation and survival of the U87 human glioblastoma cell line. Exp. Cell Res. 2007, 313, 719–731. [Google Scholar] [CrossRef]
- Paysan, L.; Piquet, L.; Saltel, F.; Moreau, V. Rnd3 in Cancer: A Review of the Evidence for Tumor Promoter or Suppressor. Mol. Cancer Res. 2016, 14, 1033–1044. [Google Scholar] [CrossRef] [Green Version]
- Clarke, K.; Daubon, T.; Turan, N.; Soulet, F.; Mohd Zahari, M.; Ryan, K.R.; Durant, S.; He, S.; Herbert, J.; Ankers, J.; et al. Inference of Low and High-Grade Glioma Gene Regulatory Networks Delineates the Role of Rnd3 in Establishing Multiple Hallmarks of Cancer. PLoS Genet. 2015, 11, e1005325. [Google Scholar] [CrossRef]
- Liu, B.; Dong, H.; Lin, X.; Yang, X.; Yue, X.; Yang, J.; Li, Y.; Wu, L.; Zhu, X.; Zhang, S.; et al. RND3 promotes Snail 1 protein degradation and inhibits glioblastoma cell migration and invasion. Oncotarget 2016, 7, 82411–82423. [Google Scholar] [CrossRef] [Green Version]
- Demircan, T.; Yavuz, M.; Kaya, E.; Akgul, S.; Altuntas, E. Cellular and Molecular Comparison of Glioblastoma Multiform Cell Lines. Cureus 2021, 13, e16043. [Google Scholar] [CrossRef]
- Ramis, G.; Villalonga-Planells, R.; Serra-Sitjar, M.; Brell, M.; Fernandez de Mattos, S.; Villalonga, P. The tumor suppressor FOXO3a mediates the response to EGFR inhibition in glioblastoma cells. Cell. Oncol. 2019, 42, 521–536. [Google Scholar] [CrossRef]
- Dimitropoulos, K.; Giannopoulou, E.; Argyriou, A.A.; Zolota, V.; Petsas, T.; Tsiata, E.; Kalofonos, H.P. The effects of anti-VEGFR and anti-EGFR agents on glioma cell migration through implication of growth factors with integrins. Anticancer Res. 2010, 30, 4987–4992. [Google Scholar]
- Li, Y.; Li, A.; Glas, M.; Lal, B.; Ying, M.; Sang, Y.; Xia, S.; Trageser, D.; Guerrero-Cazares, H.; Eberhart, C.G.; et al. c-Met signaling induces a reprogramming network and supports the glioblastoma stem-like phenotype. Proc. Natl. Acad. Sci. USA 2011, 108, 9951–9956. [Google Scholar] [CrossRef]
- Riento, K.; Villalonga, P.; Garg, R.; Ridley, A. Function and regulation of RhoE. Biochem. Soc. Trans. 2005, 33 Pt 4, 649–651. [Google Scholar] [CrossRef] [Green Version]
- Feng, H.; Hu, B.; Vuori, K.; Sarkaria, J.N.; Furnari, F.B.; Cavenee, W.K.; Cheng, S.Y. EGFRvIII stimulates glioma growth and invasion through PKA-dependent serine phosphorylation of Dock180. Oncogene 2014, 33, 2504–2512. [Google Scholar] [CrossRef] [Green Version]
- Feng, H.; Hu, B.; Liu, K.W.; Li, Y.; Lu, X.; Cheng, T.; Yiin, J.J.; Lu, S.; Keezer, S.; Fenton, T.; et al. Activation of Rac1 by Src-dependent phosphorylation of Dock180(Y1811) mediates PDGFR alpha-stimulated glioma tumorigenesis in mice and humans. J. Clin. Investig. 2011, 121, 4670–4684. [Google Scholar] [CrossRef] [Green Version]
- Li, W.; Xiong, X.; Abdalla, A.; Alejo, S.; Zhu, L.; Lu, F.; Sun, H. HGF-induced formation of the MET-AXL-ELMO2-DOCK180 complex promotes RAC1 activation, receptor clustering, and cancer cell migration and invasion. J. Biol. Chem. 2018, 293, 15397–15418. [Google Scholar] [CrossRef] [Green Version]
- Xiong, W.; Yin, A.; Mao, X.; Zhang, W.; Huang, H.; Zhang, X. Resveratrol suppresses human glioblastoma cell migration and invasion via activation of RhoA/ROCK signaling pathway. Oncol. Lett. 2016, 11, 484–490. [Google Scholar] [CrossRef]
- Sander, E.E.; ten Klooster, J.P.; van Delft, S.; van der Kammen, R.A.; Collard, J.G. Rac downregulates Rho activity: Reciprocal balance between both GTPases determines cellular morphology and migratory behavior. J. Cell Biol. 1999, 147, 1009–1022. [Google Scholar] [CrossRef]
- Klein, R.M.; Spofford, L.S.; Abel, E.V.; Ortiz, A.; Aplin, A.E. B-RAF regulation of Rnd3 participates in actin cytoskeletal and focal adhesion organization. Mol. Biol. Cell 2008, 19, 498–508. [Google Scholar] [CrossRef] [Green Version]
- Liu, B.; Lin, X.; Yang, X.; Dong, H.; Yue, X.; Andrade, K.C.; Guo, Z.; Yang, J.; Wu, L.; Zhu, X.; et al. Downregulation of RND3/RhoE in glioblastoma patients promotes tumorigenesis through augmentation of notch transcriptional complex activity. Cancer Med. 2015, 4, 1404–1416. [Google Scholar] [CrossRef] [PubMed]


Publisher’s Note: MDPI stays neutral with regard to jurisdictional claims in published maps and institutional affiliations. |
© 2022 by the authors. Licensee MDPI, Basel, Switzerland. This article is an open access article distributed under the terms and conditions of the Creative Commons Attribution (CC BY) license (https://creativecommons.org/licenses/by/4.0/).
Share and Cite
Almarán, B.; Ramis, G.; Fernández de Mattos, S.; Villalonga, P. Rnd3 Is a Crucial Mediator of the Invasive Phenotype of Glioblastoma Cells Downstream of Receptor Tyrosine Kinase Signalling. Cells 2022, 11, 3716. https://doi.org/10.3390/cells11233716
Almarán B, Ramis G, Fernández de Mattos S, Villalonga P. Rnd3 Is a Crucial Mediator of the Invasive Phenotype of Glioblastoma Cells Downstream of Receptor Tyrosine Kinase Signalling. Cells. 2022; 11(23):3716. https://doi.org/10.3390/cells11233716
Chicago/Turabian StyleAlmarán, Beatriz, Guillem Ramis, Silvia Fernández de Mattos, and Priam Villalonga. 2022. "Rnd3 Is a Crucial Mediator of the Invasive Phenotype of Glioblastoma Cells Downstream of Receptor Tyrosine Kinase Signalling" Cells 11, no. 23: 3716. https://doi.org/10.3390/cells11233716