

NMR-Based Chromatography Readouts: Indispensable Tools to “Translate” Analytical Features into Molecular Structures

Abstract
:1. Introduction
1.1. The Need for Structure Elucidation
1.2. Mass Spectrometry-Based Analysis Readout
1.3. NMR Spectroscopy-Based Analysis Readout
1.4. NMR Data Quality and Structure Elucidation
2. Molecule-Centered Plant Biochemistry and Phytochemistry
2.1. Need of Structure Elucidation in Plant Biochemistry and Phytochemistry
2.2. Limitations of Multi-Analyte Approaches in Plant Biochemistry and Phytochemistry Research
3. Fundamentals of NMR Spectroscopy
3.1. Information Content of NMR Spectra
3.2. NMR Experiments
3.2.1. 1D-NMR Experiments
3.2.2. 2D-NMR Experiments
3.2.3. Non-Uniform Sampling (NUS) in 2D-NMR Experiments
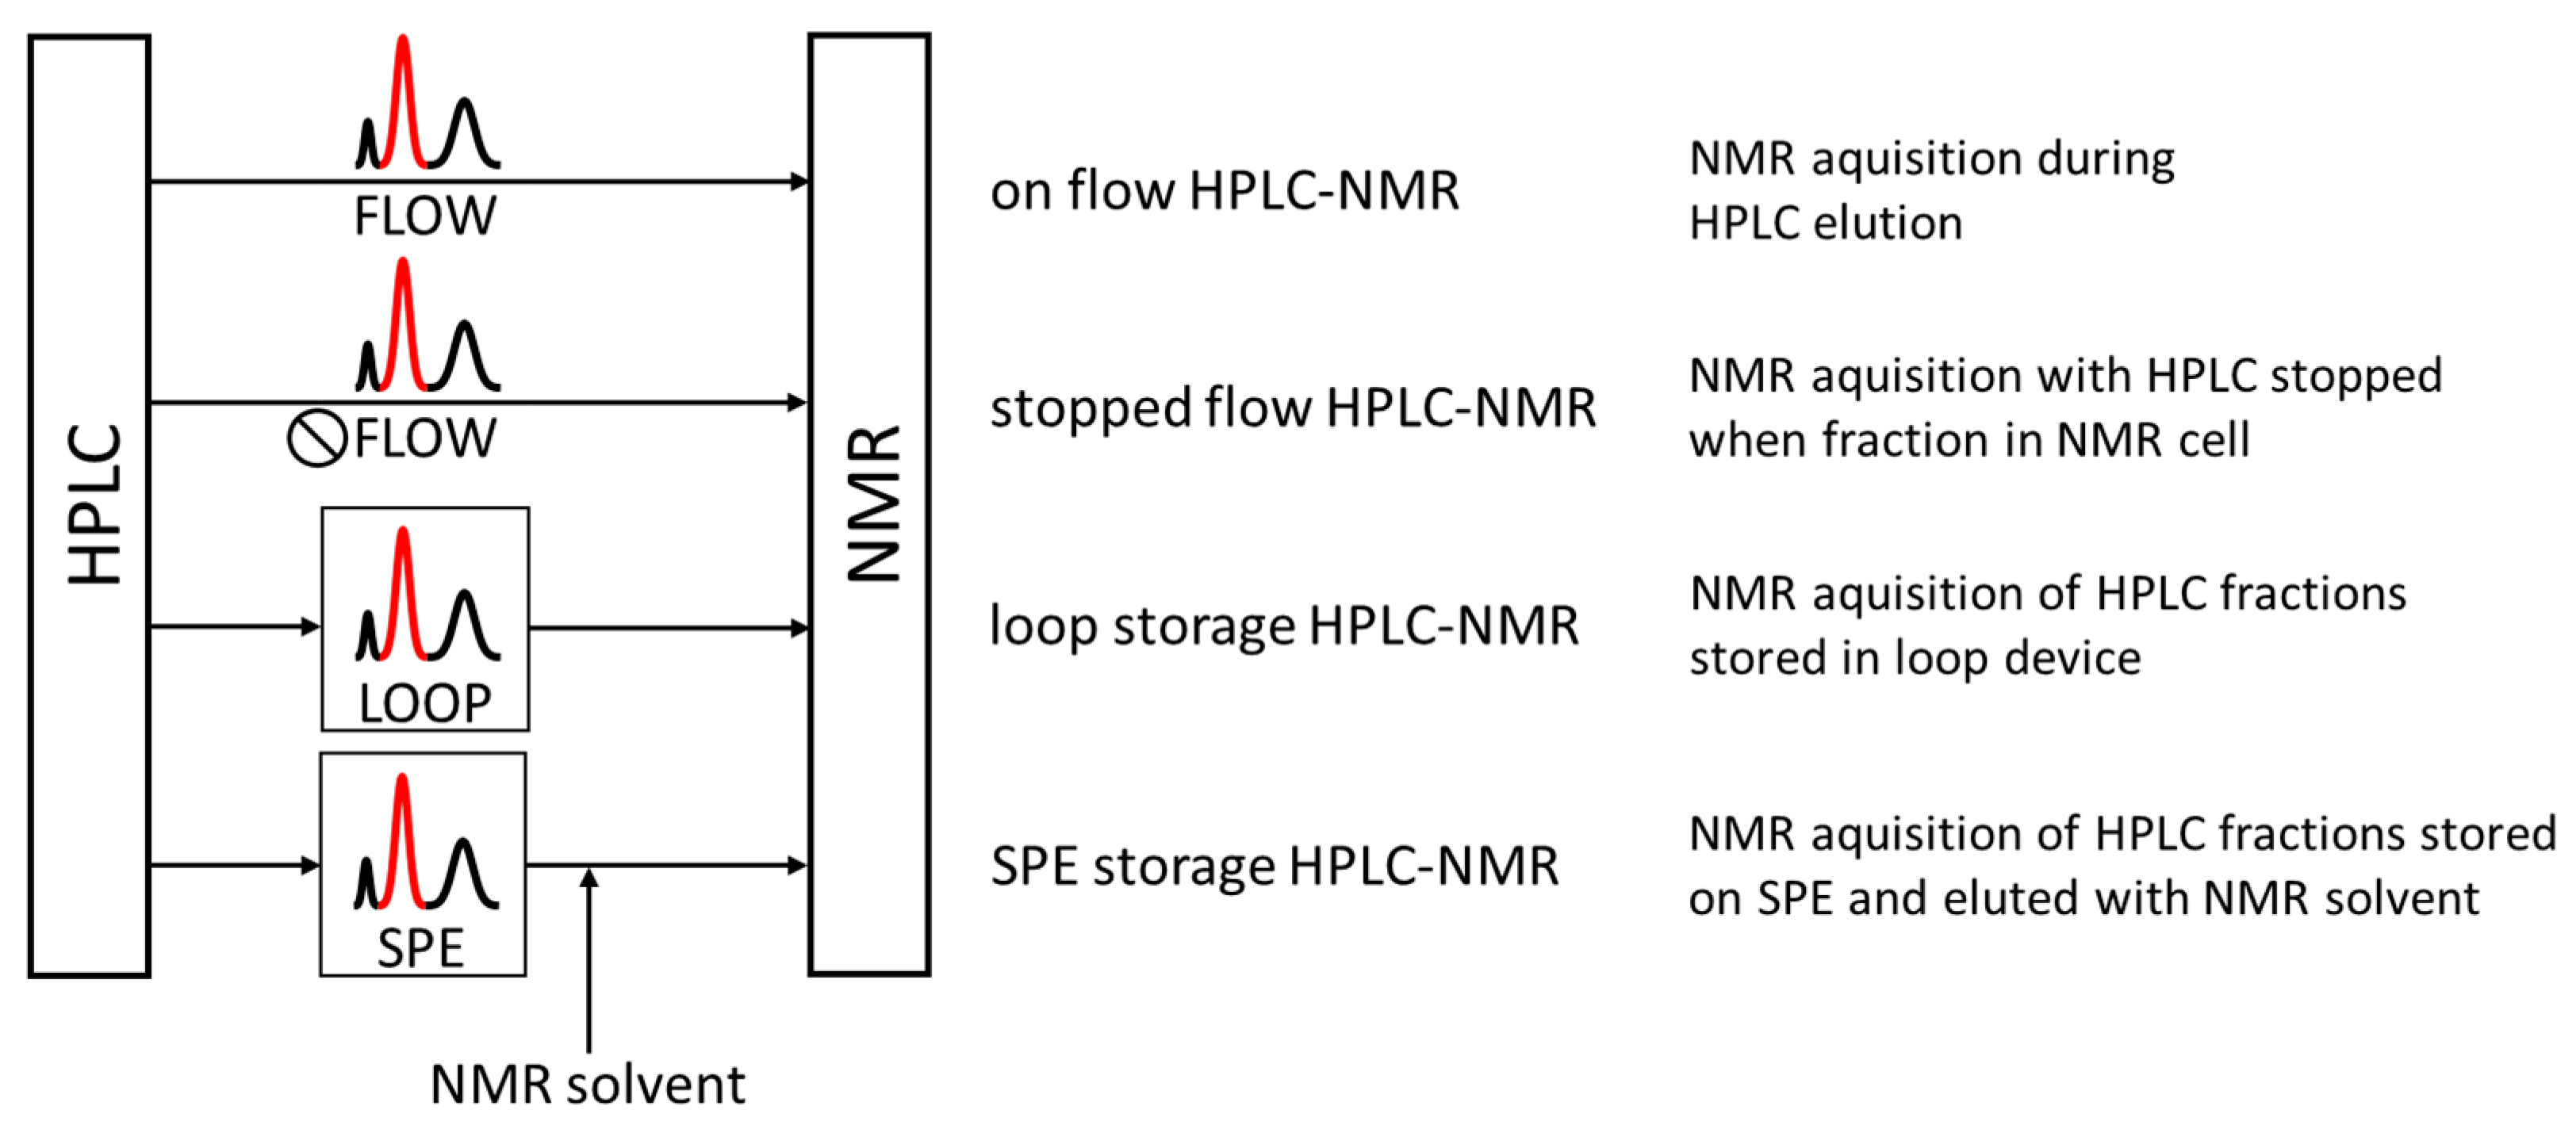
4. NMR Spectrometers as Detectors in Chromatography
4.1. HPLC-NMR
4.2. Capillary NMR
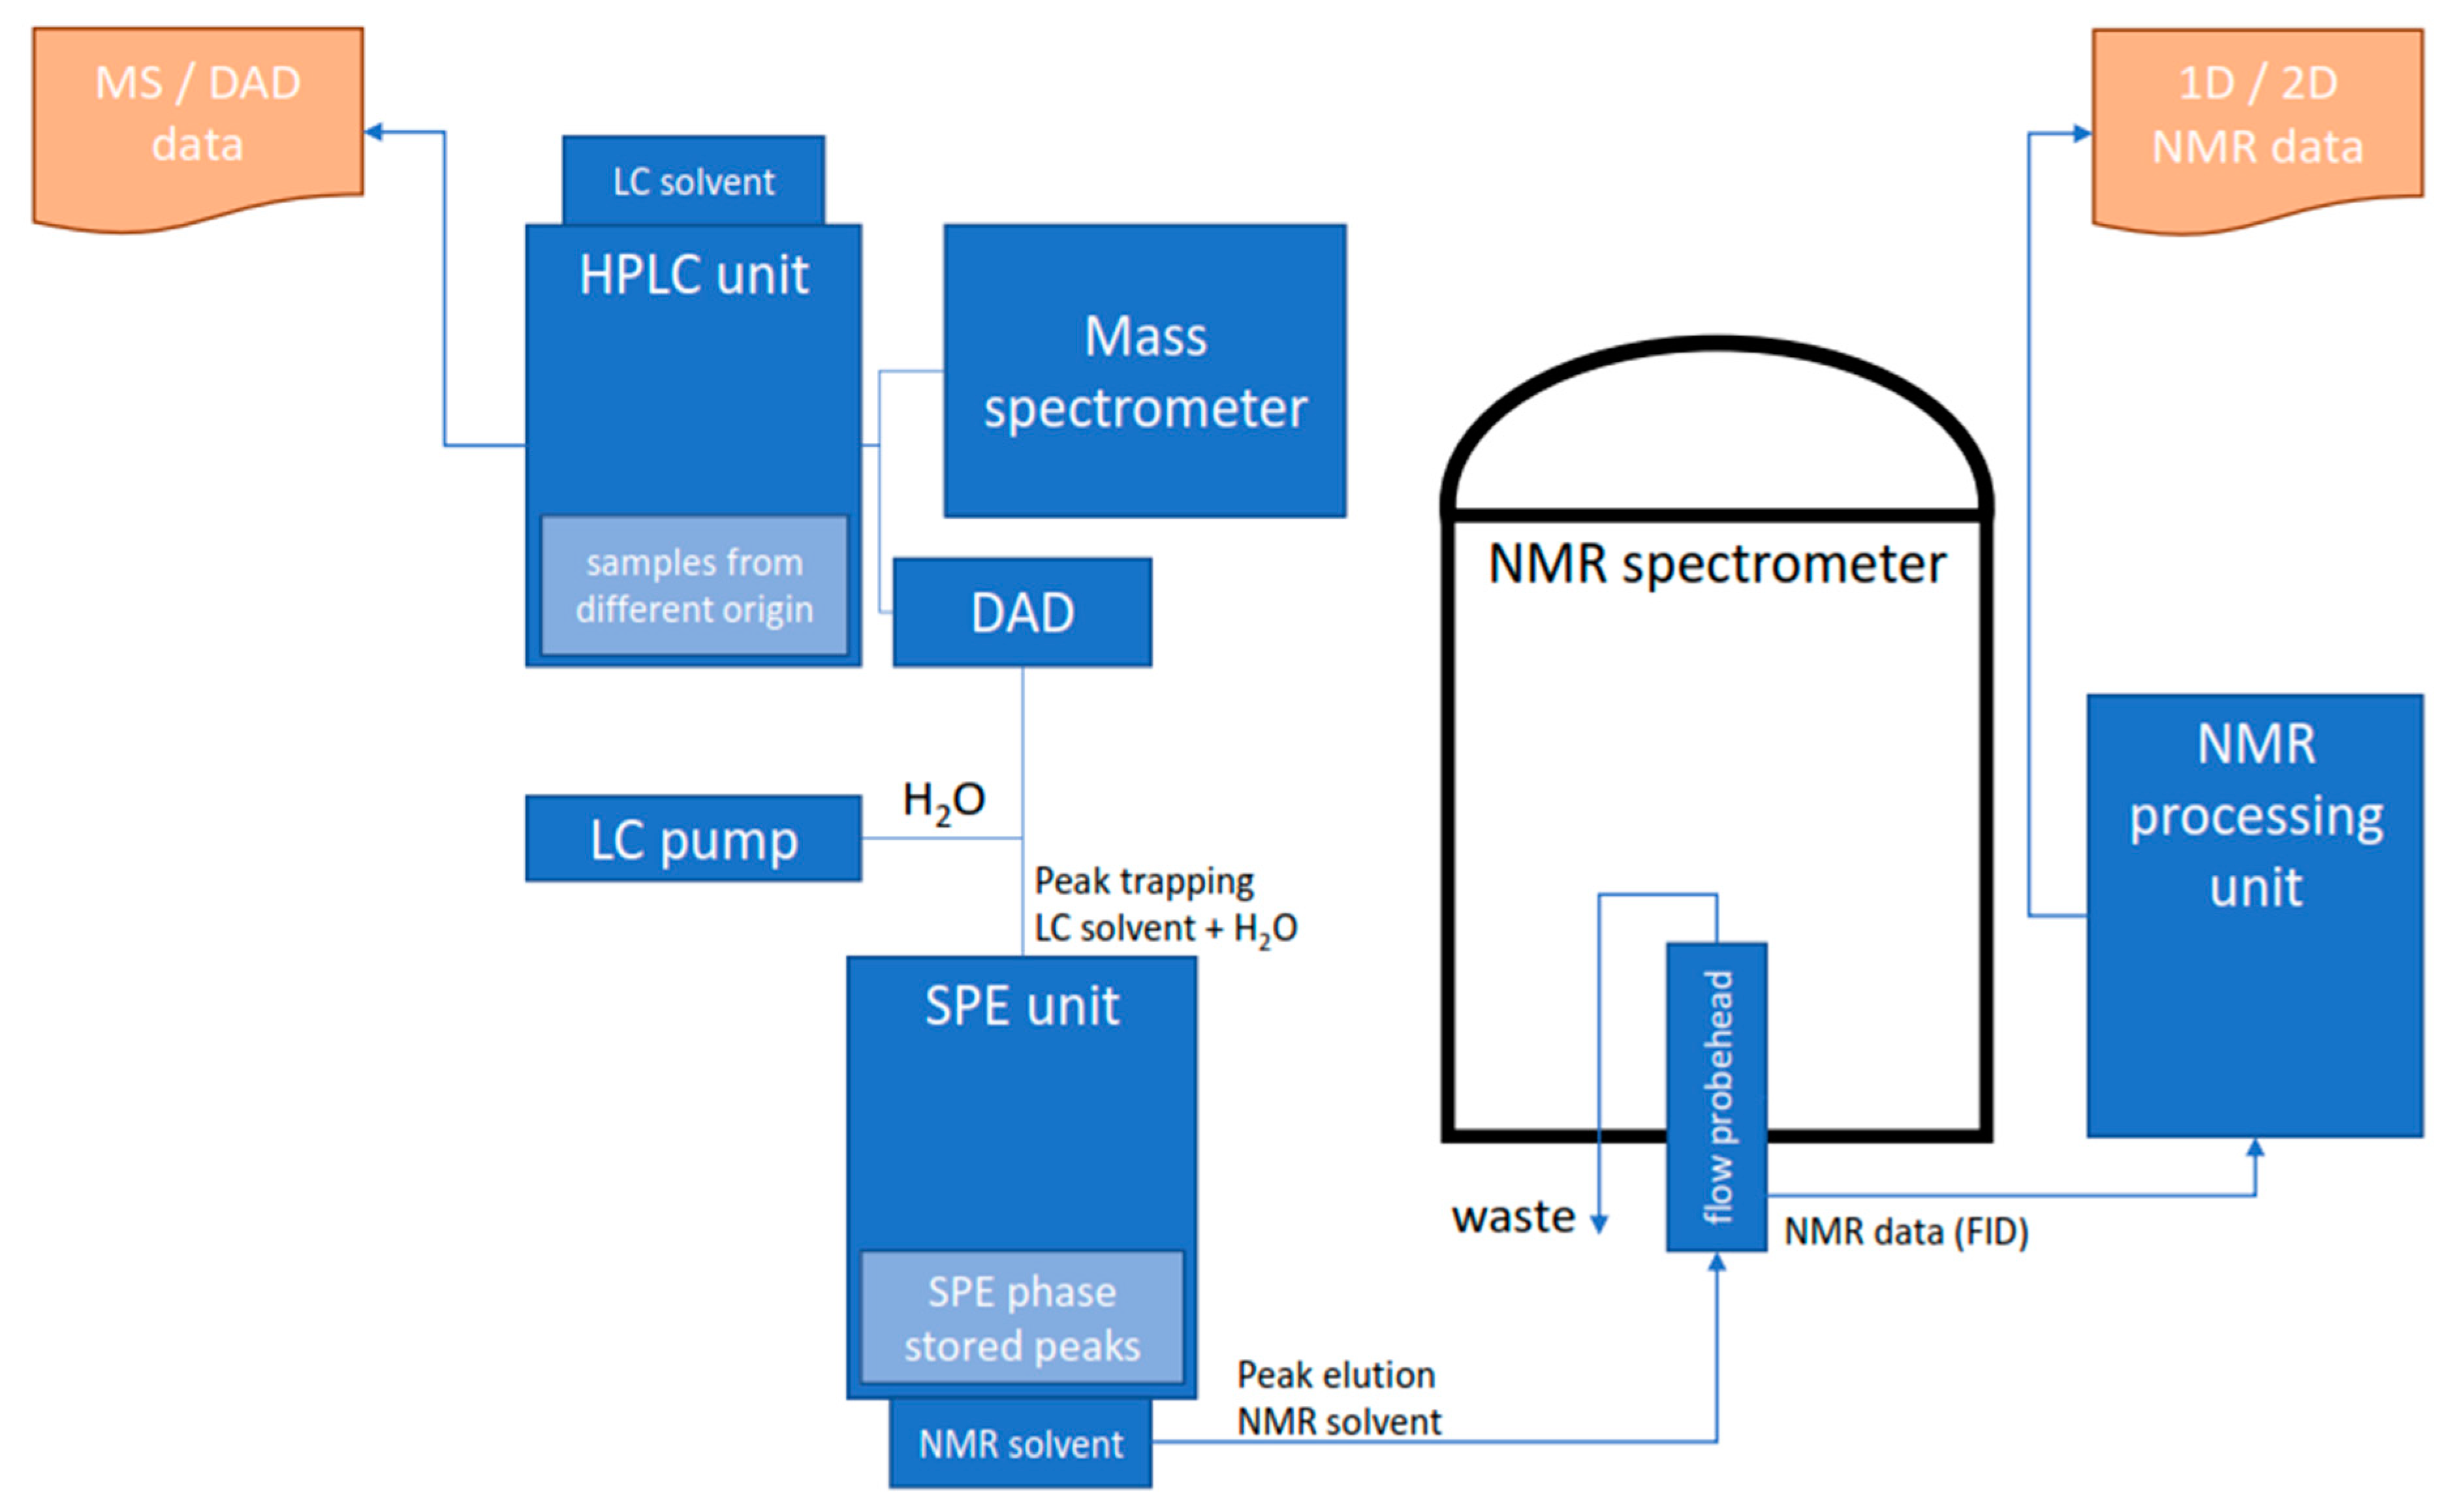
4.3. HPLC-SPE-NMR
5. Applications Examples
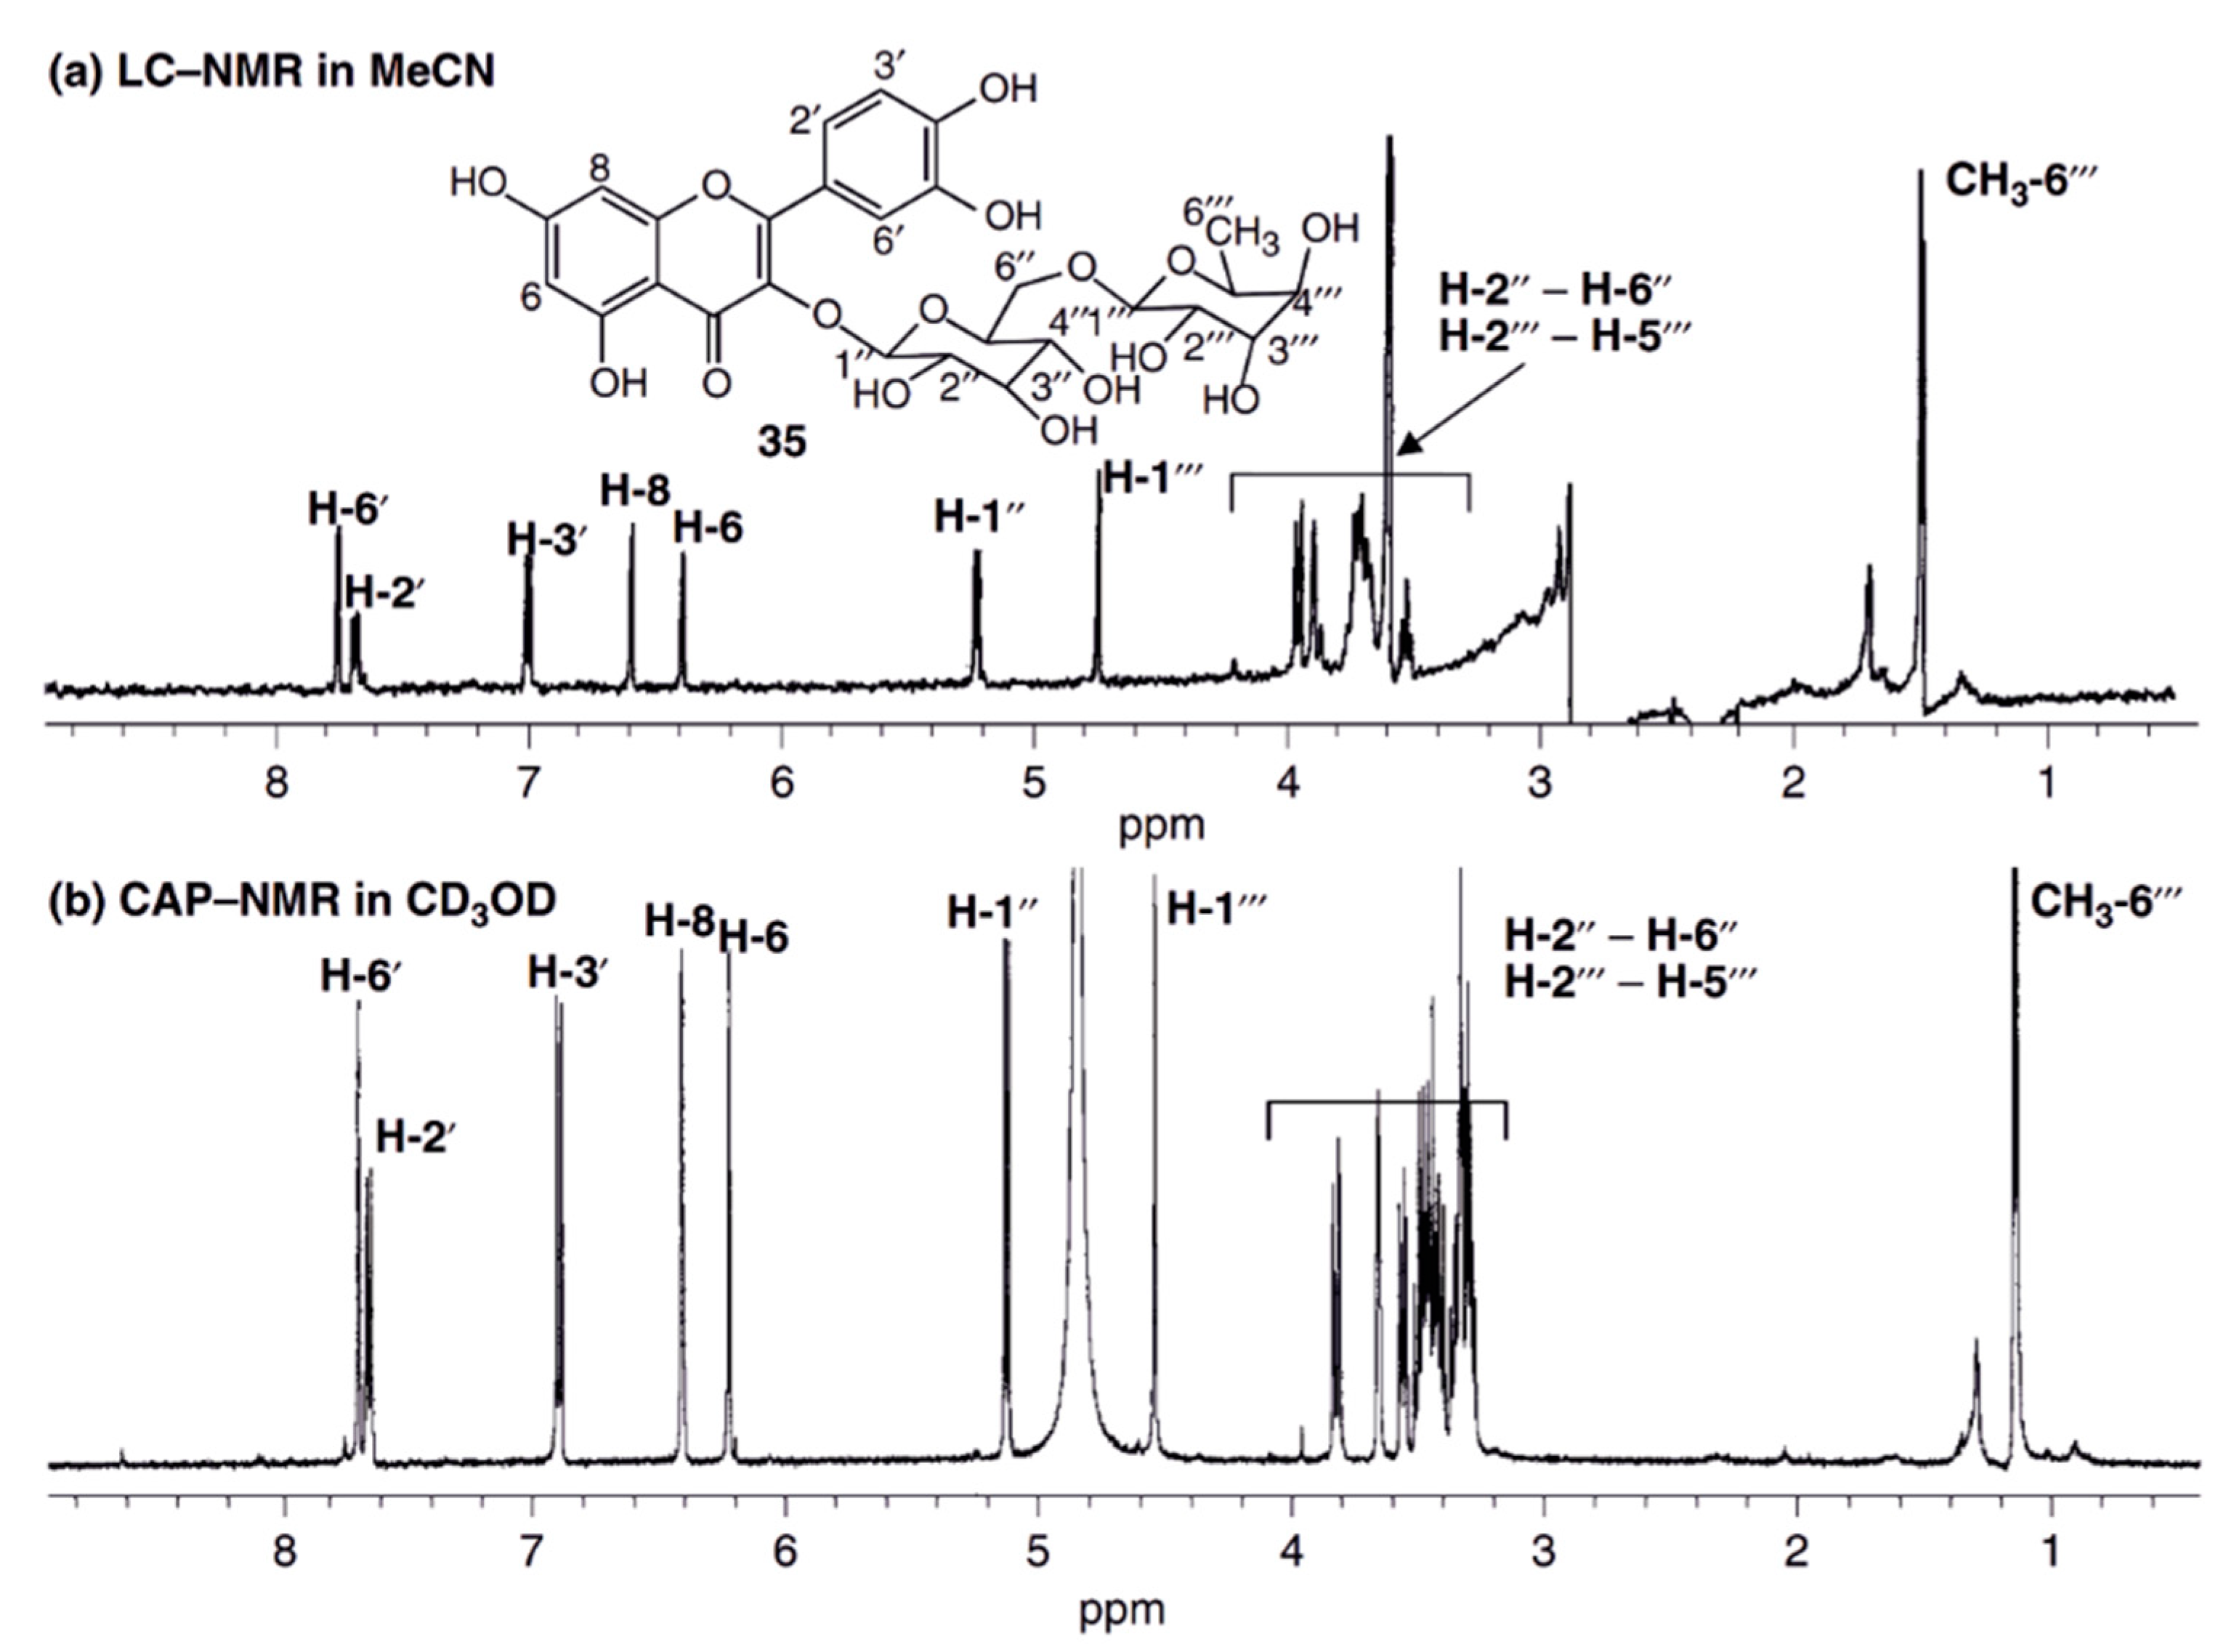
5.1. HPLC-NMR
5.2. Capillary NMR
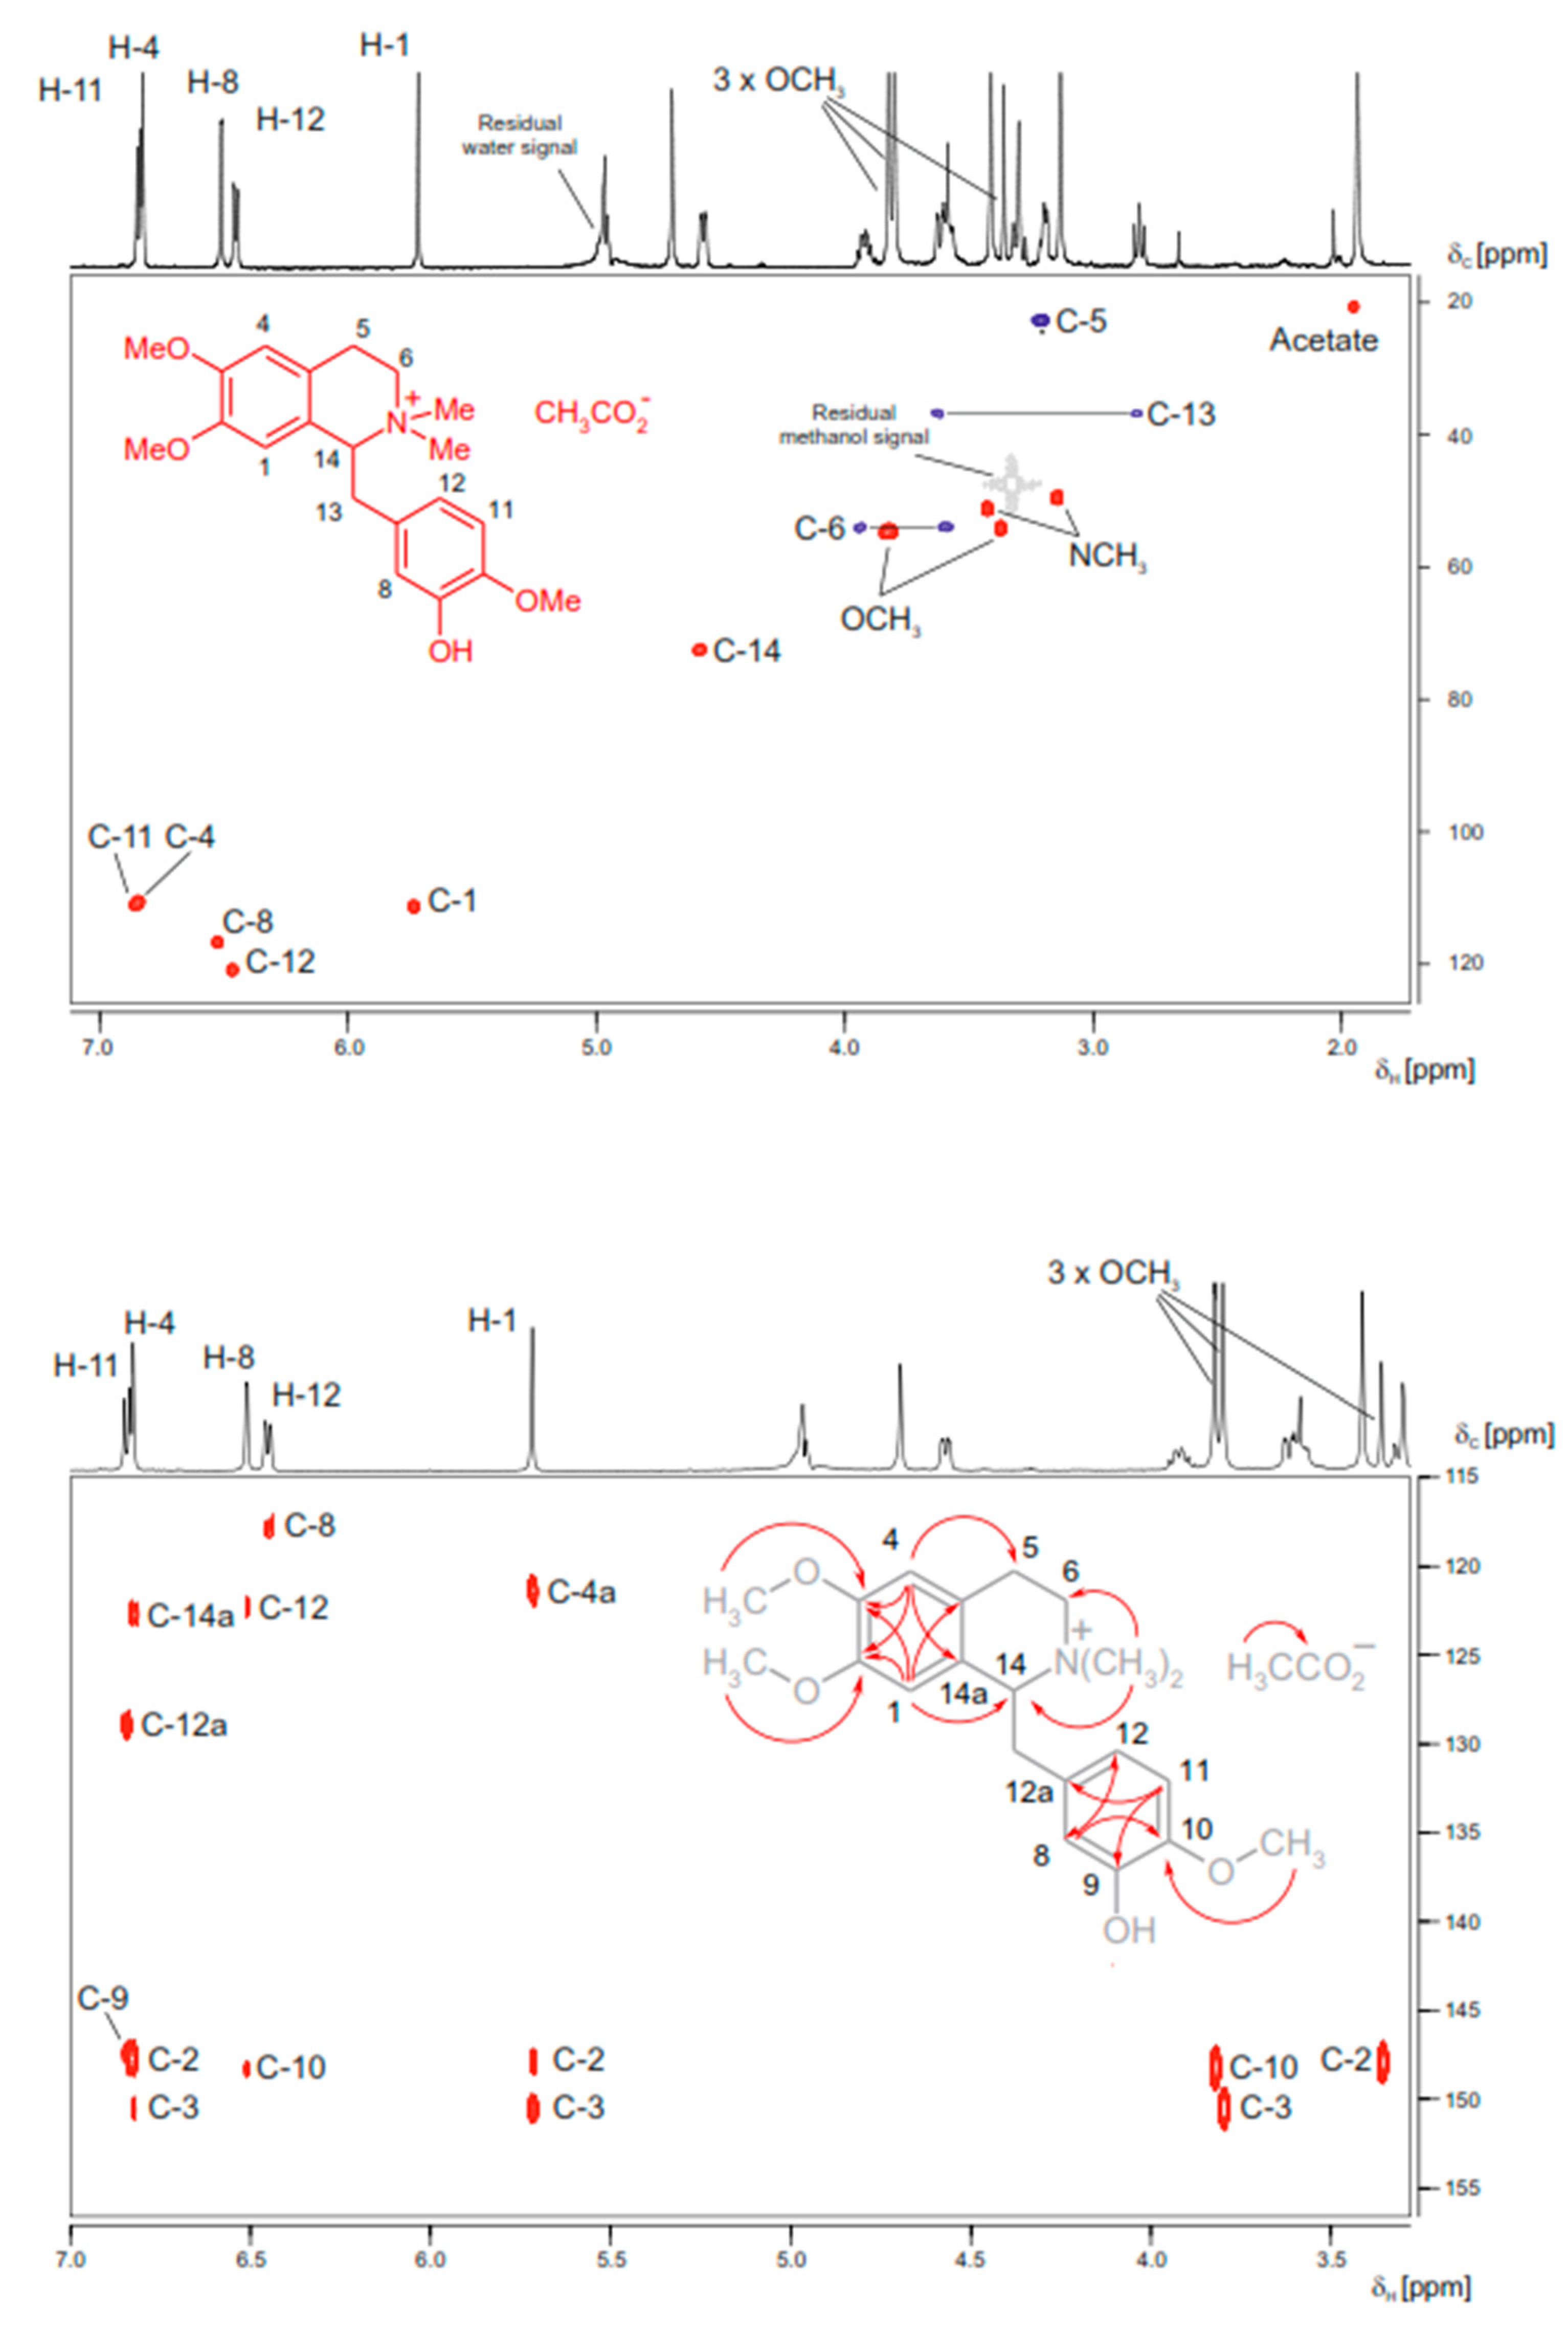
5.3. HPLC-SPE-NMR
6. Conclusions
Author Contributions
Funding
Conflicts of Interest
References
- Winkler, R. Popper and the omics. Front. Plant Sci. 2016, 19, 195. [Google Scholar] [CrossRef] [PubMed] [Green Version]
- Elstein, A.S. On the origins and development of evidence-based medicine and medical decision making. Inflamm. Res. 2004, 53, S184–S189. [Google Scholar] [CrossRef] [PubMed]
- Gallo, M.; Ferranti, P. The evolution of analytical chemistry methods in foodomics. J. Chromatogr. A 2016, 1428, 3–15. [Google Scholar] [CrossRef] [PubMed]
- Zolotov, Y.A. On some trends. Talanta 2011, 85, 2249–2250. [Google Scholar] [CrossRef] [PubMed]
- Ma, L.; Peng, Y.; Pei, Y.; Zeng, J.; Shen, H.; Cao, J.; Qiao, Y.; Wu, Z. Systematic discovery about NIR spectral assignment from chemical structural property to natural chemical compounds. Sci. Rep. 2019, 9, 9503. [Google Scholar] [CrossRef] [Green Version]
- Beć, K.B.; Grabska, J.; Huck, C.W. Miniaturized NIR spectroscopy in food analysis and quality control: Promises, challenges, and perspectives. Foods 2022, 11, 1465. [Google Scholar] [CrossRef]
- Kind, T.; Fiehn, O. Seven golden rules for heuristic filtering of molecular formulas obtained by accurate mass spectrometry. BMC Bioinform. 2007, 8, 105. [Google Scholar] [CrossRef] [Green Version]
- Blaženović, I.; Kind, T.; Torbašinović, H.; Obrenović, S.; Mehta, S.S.; Tsugawa, H.; Wermuth, T.; Schauer, N.; Jahn, M.; Biedendieck, R.; et al. Comprehensive comparison of in silico MS/MS fragmentation tools of the CASMI contest: Database boosting is needed to achieve 93% accuracy. J. Cheminform. 2017, 9, 32. [Google Scholar] [CrossRef] [Green Version]
- Seger, C.; Sturm, S. Analytical aspects of plant metabolite profiling platforms—Current standings and future aims. J. Prot. Res. 2007, 6, 480–497. [Google Scholar] [CrossRef]
- Seger, C.; Sturm, S.; Stuppner, H. Mass spectrometry and NMR spectroscopy: Modern high-end detectors for high resolution separation techniques—State of the art in natural product HPLC-MS, HPLC-NMR, and CE-MS hyphenations. Nat. Prod. Rep. 2013, 30, 970–987. [Google Scholar] [CrossRef]
- Allard, P.M.; Genta-Jouve, G.; Wolfender, J.L. Deep metabolome annotation in natural products research: Towards a virtuous cycle in metabolite identification. Curr. Opin. Chem. Biol. 2017, 36, 40–49. [Google Scholar] [CrossRef] [PubMed]
- Perez de Souza, L.; Alseekh, S.; Naake, T.; Fernie, A. Mass Spectrometry-Based Untargeted Plant Metabolomics. Curr. Protoc. Plant Biol. 2019, 4, e20100. [Google Scholar] [CrossRef] [PubMed]
- Wolfender, J.L.; Litaudon, M.; Touboul, D.; Queiroz, E.F. Innovative omics-based approaches for prioritization and targeted isolation of natural products—New strategies for drug discovery. Nat. Prod. Rep. 2019, 36, 855–868. [Google Scholar] [CrossRef] [PubMed] [Green Version]
- Beniddir, M.A.; Kang, K.B.; Genta-Jouve, G.; Huber, F.; Rogers, S.; van der Hooft, J.J.J. Advances in decomposing complex metabolite mixtures using substructure- and network-based computational metabolomics approaches. Nat. Prod. Rep. 2021, 38, 1967–1993. [Google Scholar] [CrossRef] [PubMed]
- Seger, C. Nuclear magnetic resonance of small molecules in natural products. In Encyclopedia of Analytical Chemistry; Meyers, R.A., Ed.; Wiley: New York, NY, USA, 2014; pp. 1–12. [Google Scholar] [CrossRef]
- Seger, C.; Sturm, S. Liquid chromatography-nuclear magnetic resonance coupling as alternative to liquid chromatography-mass spectrometry hyphenations: Curious option or powerful and complementary routine tool? J. Chromatogr. A 2012, 1259, 50–61. [Google Scholar] [CrossRef]
- Nicolaou, K.C.; Snyder, S.A. Chasing molecules that were never there: Misassigned natural products and the role of chemical synthesis in modern structure elucidation. Angew. Chem. Int. Ed. 2005, 44, 1012–1044. [Google Scholar] [CrossRef] [PubMed]
- McAlpine, J.B.; Chen, S.N.; Kutateladze, A.; MacMillan, J.B.; Appendino, G.; Barison, A.; Beniddir, M.A.; Biavatti, M.W.; Bluml, S.; Boufridi, A.; et al. The value of universally available raw NMR data for transparency, reproducibility, and integrity in natural product research. Nat. Prod. Rep. 2019, 36, 35–107. [Google Scholar] [CrossRef] [PubMed] [Green Version]
- Tang, Y.; Friesen, J.B.; Lankin, D.C.; McAlpine, J.B.; Nikolić, D.S.; Niemitz, M.; Seigler, D.S.; Graham, J.G.; Chen, S.N.; Pauli, G.F. Quantum mechanics-based structure analysis of cyclic monoterpene glycosides from Rhodiola rosea. J. Nat. Prod. 2020, 83, 1950–1959. [Google Scholar] [CrossRef] [PubMed]
- Tang, Y.; Friesen, J.B.; Nikolić, D.S.; Lankin, D.C.; McAlpine, J.B.; Chen, S.N.; Pauli, G.F. Tandem of countercurrent separation and qHNMR enables gravimetric analyses: Absolute quantitation of the Rhodiola rosea metabolome. Anal. Chem. 2021, 93, 11701–11709. [Google Scholar] [CrossRef]
- Robien, W. The Advantage of Automatic Peer-Reviewing of 13C-NMR Reference Data Using the CSEARCH-Protocol. Molecules 2021, 26, 3413. [Google Scholar] [CrossRef]
- Burns, D.C.; Mazzola, E.P.; Reynolds, W.F. The role of computer-assisted structure elucidation (CASE) programs in the structure elucidation of complex natural products. Nat. Prod. Rep. 2019, 36, 919–933. [Google Scholar] [CrossRef] [PubMed]
- Elyashberg, M.; Argyropoulos, D. Computer assisted structure elucidation (CASE): Current and future perspectives. Magn. Reson. Chem. 2021, 59, 669–690. [Google Scholar] [CrossRef] [PubMed]
- Cobas, C. NMR signal processing, prediction, and structure verification with machine learning techniques. Magn. Reson. Chem. 2020, 58, 512–519. [Google Scholar] [CrossRef] [PubMed]
- Robien, W. A critical evaluation of the quality of published 13C NMR data in natural product chemistry. Prog. Chem. Org. Nat. Prod. 2017, 105, 137–215. [Google Scholar] [CrossRef] [PubMed]
- Burns, D.C.; Reynolds, W.F. Minimizing the risk of deducing wrong natural product structures from NMR data. Magn. Reson. Chem. 2021, 59, 500–533. [Google Scholar] [CrossRef]
- Pupier, M.; Nuzillard, J.M.; Wist, J.; Schlörer, N.E.; Kuhn, S.; Erdelyi, M.; Steinbeck, C.; Williams, A.J.; Butts, C.; Claridge, T.D.W.; et al. NMReDATA, a standard to report the NMR assignment and parameters of organic compounds. Magn. Reson. Chem. 2018, 56, 703–715. [Google Scholar] [CrossRef] [Green Version]
- Kuhn, S.; Wieske, L.H.E.; Trevorrow, P.; Schober, D.; Schlörer, N.E.; Nuzillard, J.M.; Kessler, P.; Junker, J.; Herráez, A.; Farès, C.; et al. NMReDATA: Tools and applications. Magn. Reason. Chem. 2021, 59, 792–803. [Google Scholar] [CrossRef]
- Clark, T.J.; Guo, L.; Morgan, J.; Schwender, J. Modeling plant metabolism: From network reconstruction to mechanistic models. Annu. Rev. Plant Biol. 2020, 71, 303–326. [Google Scholar] [CrossRef] [Green Version]
- Nicholson, J.K.; Lindon, J.C.; Holmes, E. ‘Metabonomics’: Understanding the metabolic responses of living systems to pathophysiological stimuli via multivariate statistical analysis of biological NMR spectroscopic data. Xenobiotica 1999, 29, 1181–1189. [Google Scholar] [CrossRef]
- Sumner, L.W.; Mendes, P.; Dixon, R.A. Plant metabolomics: Large-scale phytochemistry in the functional genomics era. Phytochemistry 2003, 62, 817–836. [Google Scholar] [CrossRef] [Green Version]
- Fiehn, O. Metabolomics-the link between genotypes and phenotypes. Plant Mol. Biol. 2002, 48, 155–171. [Google Scholar] [CrossRef] [PubMed]
- Holmes, E.; Tang, H.; Wang, Y.; Seger, C. The assessment of plant metabolite profiles by NMR-based methodologies. Planta Med. 2006, 72, 771–785. [Google Scholar] [CrossRef] [PubMed] [Green Version]
- Dewick, P.M. Medicinal Natural Products: A Biosynthetic Approach, 3rd ed.; John Wiley & Sons: Chichester, UK, 2009. [Google Scholar]
- Rutz, A.; Sorokina, M.; Galgonek, J.; Mietchen, D.; Willighagen, E.; Gaudry, A.; Graham, J.G.; Stephan, R.; Page, R.; Vondrášek, J.; et al. The LOTUS initiative for open knowledge management in natural products research. eLife 2022, 11, e70780. [Google Scholar] [CrossRef] [PubMed]
- Weckwerth, W. Metabolomics in systems biology. Annu. Rev. Plant Biol. 2003, 54, 669–689. [Google Scholar] [CrossRef]
- Glinski, M.; Weckwerth, W. The role of mass spectrometry in plant systems biology. Mass Spectrom. Rev. 2006, 25, 173–214. [Google Scholar] [CrossRef]
- Kopka, J. Current challenges and developments in GC-MS based metabolite profiling technology. J. Biotechnol. 2006, 124, 312–322. [Google Scholar] [CrossRef]
- Watrous, J.; Roach, P.; Alexandrov, T.; Heath, B.S.; Yang, J.Y.; Kersten, R.D.; van der Voort, M.; Pogliano, K.; Gross, H.; Raaijmakers, J.M.; et al. Mass spectral molecular networking of living microbial colonies. Proc. Natl. Acad. Sci. USA 2012, 109, E1743–E1752. [Google Scholar] [CrossRef] [Green Version]
- Yang, J.Y.; Sanchez, L.M.; Rath, C.M.; Liu, X.; Boudreau, P.D.; Bruns, N.; Glukhov, E.; Wodtke, A.; de Felicio, R.; Fenner, A.; et al. Molecular networking as a dereplication strategy. J. Nat. Prod. 2013, 76, 1686–1699. [Google Scholar] [CrossRef] [Green Version]
- Tsugawa, H.; Cajka, T.; Kind, T.; Ma, Y.; Higgins, B.; Ikeda, K.; Kanazawa, M.; VanderGheynst, J.; Fiehn, O.; Arita, M. MS-DIAL: Data-independent MS/MS deconvolution for comprehensive metabolome analysis. Nat. Methods 2015, 12, 523–526. [Google Scholar] [CrossRef]
- Pluskal, T.; Castillo, S.; Villar-Briones, A.; Oresic, M. MZmine 2: Modular framework for processing, visualizing, and analyzing mass spectrometry-based molecular profile data. BMC Bioinform. 2010, 11, 395. [Google Scholar] [CrossRef] [Green Version]
- Hoffmann, T.; Krug, D.; Hüttel, S.; Müller, R. Improving natural products identification through targeted LC-MS/MS in an untargeted secondary metabolomics workflow. Anal. Chem. 2014, 86, 10780–10788. [Google Scholar] [CrossRef] [PubMed]
- Domingo-Almenara, X.; Montenegro-Burke, J.R.; Guijas, C.; Majumder, E.L.; Benton, H.P.; Siuzdak, G. Autonomous METLIN-guided in-source fragment annotation for untargeted metabolomics. Anal. Chem. 2019, 91, 3246–3253. [Google Scholar] [CrossRef] [PubMed]
- Graça, G.; Cai, Y.; Lau, C.E.; Vorkas, P.A.; Lewis, M.R.; Want, E.J.; Herrington, D.; Ebbels, T.M.D. Automated annotation of untargeted all-ion fragmentation LC-MS metabolomics data with MetaboAnnotatoR. Anal. Chem. 2022, 94, 3446–3455. [Google Scholar] [CrossRef] [PubMed]
- Cloarec, O.; Dumas, M.E.; Craig, A.; Barton, R.H.; Trygg, J.; Hudson, J.; Blancher, C.; Gauguier, D.; Lindon, J.C.; Holmes, E.; et al. Statistical total correlation spectroscopy: An exploratory approach for latent biomarker identification from metabolic 1H NMR data sets. Anal. Chem. 2005, 77, 1282–1289. [Google Scholar] [CrossRef]
- Schmid, R.; Petras, D.; Nothias, L.F.; Wang, M.; Aron, A.T.; Jagels, A.; Tsugawa, H.; Rainer, J.; Garcia-Aloy, M.; Dührkop, K.; et al. Ion identity molecular networking for mass spectrometry-based metabolomics in the GNPS environment. Nat. Commun. 2021, 12, 3832. [Google Scholar] [CrossRef]
- Aligiannis, N.; Halabalaki, M.; Chaita, E.; Kouloura, E.; Argyropoulou, A.; Benaki, D.; Kalpoutzakis, E.; Angelis, A.; Stathopoulou, K.; Antoniou, S.; et al. Heterocovariance based metabolomics as a powerful tool accelerating bioactive natural product identification. ChemistrySelect 2016, 1, 2531–2535. [Google Scholar] [CrossRef]
- Wolfender, J.L.; Nuzillard, J.M.; van der Hooft, J.J.J.; Renault, J.H.; Bertrand, S. Accelerating metabolite identification in natural product research: Toward an ideal combination of liquid chromatography-high-resolution tandem mass spectrometry and NMR profiling, in silico databases, and chemometrics. Anal. Chem. 2019, 91, 704–742. [Google Scholar] [CrossRef]
- Michalea, R.; Stathopoulou, K.; Polychronopoulos, P.; Benaki, D.; Mikros, E.; Aligiannis, N. Efficient identification of acetylcholinesterase and hyaluronidase inhibitors from Paeonia parnassica extracts through a HeteroCovariance Approach. J. Ethnopharmacol. 2020, 257, 111547. [Google Scholar] [CrossRef]
- Alfattani, A.; Marcourt, L.; Hofstetter, V.; Queiroz, E.F.; Leoni, S.; Allard, P.M.; Gindro, K.; Stien, D.; Perron, K.; Wolfender, J.L. Combination of pseudo-LC-NMR and HRMS/MS-based molecular networking for the rapid identification of antimicrobial metabolites from Fusarium petroliphilum. Front. Mol. Biosci. 2021, 8, 725691. [Google Scholar] [CrossRef]
- Alseekh, S.; Aharoni, A.; Brotman, Y.; Contrepois, K.; D’Auria, J.; Ewald, J.; Ewald, J.C.; Fraser, P.D.; Giavalisco, P.; Hall, R.D.; et al. Mass spectrometry-based metabolomics: A guide for annotation, quantification and best reporting practices. Nat. Methods 2021, 18, 747–756. [Google Scholar] [CrossRef]
- Yu, C.T.; Chao, B.N.; Barajas, R.; Haznadar, M.; Maruvada, P.; Nicastro, H.L.; Ross, S.A.; Verma, M.; Rogers, S.; Zanetti, K.A. An evaluation of the national institutes of health grants portfolio: Identifying opportunities and challenges for multi-omics research that leverage metabolomics data. Metabolomics 2022, 18, 29. [Google Scholar] [CrossRef] [PubMed]
- Eling, N.; Morgan, M.D.; Marioni, J.C. Challenges in measuring and understanding biological noise. Nat. Rev. Genet. 2019, 20, 536–548. [Google Scholar] [CrossRef] [PubMed]
- Bouillon, R.; Manousaki, D.; Rosen, C.; Trajanoska, K.; Rivadeneira, F.; Richards, J.B. The health effects of vitamin D supplementation: Evidence from human studies. Nat. Rev. Endocrinol. 2022, 18, 96–110. [Google Scholar] [CrossRef] [PubMed]
- Cummings, S.R.; Rosen, C. VITAL findings—A decisive verdict on vitamin D supplementation. N. Engl. J. Med. 2022, 387, 368–370. [Google Scholar] [CrossRef] [PubMed]
- Hakan, T. Philosophy of science and black swan. Childs Nerv. Syst. 2022, 38, 1655–1657. [Google Scholar] [CrossRef]
- Ward, B.; Yombi, J.C.; Balligand, J.L.; Cani, P.D.; Collet, J.F.; de Greef, J.; Dewulf, J.P.; Gatto, L.; Haufroid, V.; Jodogne, S.; et al. HYGIEIA: Hypothesizing the genesis of infectious diseases and epidemics through an integrated systems biology approach. Viruses 2022, 14, 1373. [Google Scholar] [CrossRef]
- Wörheide, M.A.; Krumsiek, J.; Kastenmüller, G.; Arnold, M. Multi-omics integration in biomedical research—A metabolomics-centric review. Anal. Chim. Acta 2021, 1141, 144–162. [Google Scholar] [CrossRef]
- Rinschen, M.M.; Ivanisevic, J.; Giera, M.; Siuzdak, G. Identification of bioactive metabolites using activity metabolomics. Nat. Rev. Mol. Cell. Biol. 2019, 20, 353–367. [Google Scholar] [CrossRef]
- Claridge, T.D.W. High-Resolution NMR Techniques in Organic Chemistry, 3rd ed.; Elsevier: Amsterdam, The Netherlands, 2016. [Google Scholar]
- Jacobsen, N.E. NMR Data Interpretation Explained: Understanding 1D and 2D NMR Spectra of Organic Compounds and Natural Products, 1st ed.; John Wiley & Sons: Chichester, UK, 2016. [Google Scholar]
- Pauli, G.F.; Jaki, B.U.; Gödecke, T.; Lankin, D.C. Quantitative 1H NMR: Development and potential of a method for natural products analysis—An update. J. Nat. Prod. 2012, 75, 834–851. [Google Scholar] [CrossRef]
- Brenton, R.C.; Reynolds, W.F. Using NMR to identify and characterize natural products. Nat. Prod. Rep. 2013, 30, 501–524. [Google Scholar] [CrossRef]
- Delaglio, F.; Walker, G.S.; Farley, K.A.; Sharma, R.; Hoch, J.C.; Arbogast, L.W.; Brinson, R.G.; Marino, J.P. Non-uniform sampling for all: More NMR spectral quality, less measurement time. Am. Pharm. Rev. 2017, 20, 339681. [Google Scholar] [PubMed]
- Kazimierczuk, K.; Orekhov, V. Non-uniform sampling: Post-Fourier era of NMR data collection and processing. Magn. Reason. Chem. 2015, 53, 921–926. [Google Scholar] [CrossRef] [PubMed]
- Claridge, T.D.W.; Mayzel, M.; Kupče, Ē. Triplet NOAH supersequences optimized for small molecule structure characterization. Magn. Reson. Chem. 2019, 57, 946–952. [Google Scholar] [CrossRef] [PubMed]
- Kupče, Ē.; Claridge, T.D.W. NOAH: NMR supersequences for small molecule analysis and structure elucidation. Angew. Chem. Int. Ed. Engl. 2017, 56, 11779–11783. [Google Scholar] [CrossRef] [PubMed]
- Yong, J.R.J.; Kupče, E.R.; Claridge, T.D.W. Modular pulse program generation for NMR supersequences. Anal. Chem. 2022, 94, 2271–2278. [Google Scholar] [CrossRef]
- Albert, K. On-Line LC-NMR and Related Techniques, 1st ed.; John Wiley & Sons: Chichester, UK, 2002. [Google Scholar]
- Jaroszewski, J.W. Hyphenated NMR methods in natural products research, part 1: Direct hyphenation. Planta Med. 2005, 71, 691–700. [Google Scholar] [CrossRef] [Green Version]
- Jaroszewski, J.W. Hyphenated NMR methods in natural products research, Part 2: HPLC-SPE-NMR and other new trends in NMR hyphenation. Planta Med. 2005, 71, 795–802. [Google Scholar] [CrossRef]
- Wolfender, J.L.; Queiroz, E.F.; Hostettmann, K. Phytochemistry in the microgram domain—A LC-NMR perspective. Magn. Reson. Chem. 2005, 43, 697–709. [Google Scholar] [CrossRef]
- Bross-Walch, N.; Kühn, T.; Moskau, D.; Zerbe, O. Strategies and tool for structure determination of natural products using modern methods of NMR spectroscopy. Chem. Biodiv. 2005, 2, 147–177. [Google Scholar] [CrossRef]
- Wolfender, J.L. HPLC in natural product analysis: The detection issue. Planta Med. 2009, 75, 719–734. [Google Scholar] [CrossRef] [Green Version]
- Kupče, Ē.; Frydman, L.; Webb, A.G.; Yong, J.R.J.; Claridge, T.D.W. Parallel nuclear magnetic resonance spectroscopy. Nat. Rev. Methods Primers 2021, 1, 27. [Google Scholar] [CrossRef]
- Lacey, M.E.; Subramanian, R.; Olson, D.L.; Webb, A.G.; Sweedler, J.V. High resolution NMR spectroscopy of sample volumes from 1 nL to 10 μL. Chem. Rev. 1999, 99, 3133–3152. [Google Scholar] [CrossRef] [PubMed]
- Olson, D.L.; Lacey, M.E.; Sweedler, J.V. High-resolution microcoil NMR for analysis of mass-limited, nanoliter samples. Anal. Chem. 1998, 70, 645–650. [Google Scholar] [CrossRef] [PubMed]
- Krucker, M.; Lienau, A.; Putzbach, K.; Grynbaum, M.D.; Schuler, P.; Albert, K. Hyphenation of capillary HPLC to mass spectrometry and microcoil 1H NMR spectroscopy for the determination of tocopherol homologues (vitamin E). Anal. Chem. 2004, 76, 2623–2628. [Google Scholar] [CrossRef]
- Jansma, A.; Chuan, T.; Albrecht, R.W.; Olson, D.L.; Peck, T.L.; Geierstanger, B.H. Automated microflow NMR: Routine analysis of five-microliter samples. Anal. Chem. 2005, 77, 6509–6515. [Google Scholar] [CrossRef] [Green Version]
- Schroeder, F.C.; Gronquist, M. Extending the scope of NMR spectroscopy with microcoil probes. Angew. Chem. Int. Ed. 2006, 45, 7122–7131. [Google Scholar] [CrossRef]
- Gronquist, M.; Meinwald, J.; Eisner, T.; Schroeder, F.C. Exploring uncharted terrain in nature’s structure space using capillary NMR spectroscopy: 13 steroids from 50 fireflies. J. Am. Chem. Soc. 2005, 127, 10810–10811. [Google Scholar] [CrossRef]
- Griffiths, L.; Horton, R. Optimization of LC-NMR III-increased signal-to- noise ratio through column trapping. Magn. Reson. Chem. 1998, 36, 104–109. [Google Scholar] [CrossRef]
- Bhatia, A.; Sarma, S.J.; Lei, Z.; Sumner, L.W. UHPLC-QTOF-MS/MS-SPE-NMR: A solution to the metabolomics grand challenge of higher-throughput, confident metabolite identifications. Methods Mol. Biol. 2019, 2037, 113–133. [Google Scholar] [CrossRef]
- Nyberg, N.T.; Baumann, H.; Kenne, L. Application of solid-phase extraction coupled to an NMR flowprobe in the analysis of HPLC fractions. Magn. Reson. Chem. 2001, 39, 236–240. [Google Scholar] [CrossRef]
- Seger, C.; Godejohann, M.; Spraul, M.; Girtler, A.; Sturm, S.; Stuppner, H. The LC-DAD-MS/SPE-NMR hyphenation. A tool for the analysis of pharmaceutically used plant extracts: Identification of isobaric iridoid glycoside regioisomers from Harpagophytum procumbens. Anal. Chem. 2005, 77, 878–885. [Google Scholar] [CrossRef] [PubMed]
- Clarkson, C.; Sibum, M.; Mensen, R.; Jaroszewski, J.W. Evaluation of on-line solid-phase extraction parameters for hyphenated, high-performance liquid chromatography-solid-phase extraction-nuclear magnetic resonance applications. J. Chromatogr. A 2007, 1165, 1–9. [Google Scholar] [CrossRef] [PubMed]
- Johansen, K.T.; Ebild, S.J.; Christensen, S.B.; Godejohann, M.; Jaroszewski, J.W. Alkaloid analysis by high-performance liquid chromatography-solid phase extraction-nuclear magnetic resonance: New strategies going beyond the standard. J. Chromatogr. A 2012, 1270, 171–177. [Google Scholar] [CrossRef] [PubMed]
- Bringmann, G.; Wohlfarth, M.; Rischer, H.; Heubes, M.; Saeb, W.; Diem, S.; Herderich, M.; Schlauer, J. A photometric screening method for dimeric naphthylisoquinoline alkaloids and complete on-line structural elucidation of a dimer in crude plant extracts, by the LC-MS/LC-NMR/LC-CD triad. Anal. Chem. 2001, 73, 2571–2577. [Google Scholar] [CrossRef] [PubMed]
- Waridel, P.; Wolfender, J.L.; Lachavanne, J.B.; Hostettmann, K. ent-Labdane glycosides from the aquatic plant Potamogeton lucens and analytical evaluation of the lipophilic extract constituents of various Potamogeton species. Phytochemistry 2004, 65, 945–954. [Google Scholar] [CrossRef]
- Zehl, M.; Braunberger, C.; Conrad, J.; Crnogorac, M.; Krasteva, S.; Vogler, B.; Beifuss, U.; Krenn, L. Identification and quantification of flavonoids and ellagic acid derivatives in therapeutically important Drosera species by LC-DAD, LC-NMR, NMR, and LC-MS. Anal. Bioanal. Chem. 2011, 400, 2565–2576. [Google Scholar] [CrossRef]
- Hornik, S.; Sajfrtova, M.; Karban, J.; Sykora, J.; Brezinova, A.; Wimmer, Z. LC-NMR Technique in the analysis of phytosterols in natural extracts. J. Anal. Meth. Chem. 2013, 2013, 526818. [Google Scholar] [CrossRef] [Green Version]
- Aissat, A.K.; Chaher-Bazizi, N.; Richard, T.; Kilani-Atmani, D.; Pedrot, E.; Renouf, E.; Atmani, D.; Valls Fonayet, J. Analysis of individual anthocyanins, flavanols, flavonols and other polyphenols in Pistacia lentiscus L. fruits during ripening. J. Food Comp. Anal. 2022, 106, 104286. [Google Scholar] [CrossRef]
- Yim, S.H.; Lee, Y.J.; Park, K.D.; Lee, I.S.; Shin, B.A.; Jung, D.W.; Williams, D.R.; Kim, H.J. Phenolic Constituents from the Flowers of Hamamelis japonica Sieb. et Zucc. Nat. Prod Sci. 2015, 21, 162–169. [Google Scholar]
- Timsina, B.; Kindlmann, P.; Rokaya, M.B.; Vrchotová, N.; Tříska, J.; Horník, Š.; Sýkora, J. Xanthones content in Swertia multicaulis D. Don from Nepal. Molecules 2018, 23, 1067. [Google Scholar] [CrossRef]
- Hilbert, G.; Temsamani, H.; Bordenave, L.; Pedrot, E.; Chaher, N.; Cluzet, S.; Delaunay, J.C.; Ollat, N.; Delrot, S.; Mérillon, J.M.; et al. Flavonol profiles in berries of wild Vitis accessions using liquid chromatography coupled to mass spectrometry and nuclear magnetic resonance spectrometry. Food Chem. 2015, 169, 49–58. [Google Scholar] [CrossRef] [PubMed]
- Iwasa, K.; Cui, W.; Takahashi, T.; Nishiyama, Y.; Kamigauchi, M.; Koyama, J.; Takeuchi, A.; Moriyasu, M.; Takeda, K. Biotransformation of phenolic tetrahydroprotoberberines in plant cell cultures followed by LC-NMR, LC-MS, and LC-CD. J. Nat. Prod. 2010, 73, 115–122. [Google Scholar] [CrossRef] [PubMed]
- Durand, S.; Sancelme, M.; Besse-Hoggan, P.; Combourieu, B. Biodegradation pathway of mesotrione: Complementarities of NMR, LC-NMR and LC-MS for qualitative and quantitative metabolic profiling. Chemosphere 2010, 81, 372–380. [Google Scholar] [CrossRef] [PubMed]
- Hu, J.F.; Yoo, H.D.; Williams, C.T.; Garo, E.; Cremin, P.A.; Zeng, L.; Vervoort, H.C.; Lee, C.M.; Hart, S.M.; Goering, M.G.; et al. Miniaturization of the structure elucidation of novel natural products—Two trace antibacterial acylated caprylic alcohol glycosides from Arctostaphylos pumila. Planta Med. 2005, 71, 176–180. [Google Scholar] [CrossRef] [PubMed]
- Glauser, G.; Guillarme, D.; Grata, E.; Boccard, J.; Thiocone, A.; Carrupt, P.A.; Veuthey, J.L.; Rudaz, S.; Wolfender, J.L. Optimized liquid chromatography-mass spectrometry approach for the isolation of minor stress biomarkers in plant extracts and their identification by capillary nuclear magnetic resonance. J. Chromatogr. A 2008, 1180, 90–98. [Google Scholar] [CrossRef]
- Price, K.E.; Vandaveer, S.S.; Lunte, C.E.; Larive, C.K. Tissue targeted metabonomics: Metabolic profiling by microdialysis sampling and microcoil NMR. J. Pharm. Biomed. Anal. 2005, 38, 904–909. [Google Scholar] [CrossRef] [Green Version]
- Bertrand, S.; Azzollini, A.; Nievergelt, A.; Boccard, J.; Rudaz, S.; Cuendet, M.; Wolfender, J.L. Statistical correlations between HPLC activity-based profiling results and NMR/MS microfraction data to deconvolute bioactive compounds in mixtures. Molecules 2016, 21, 259. [Google Scholar] [CrossRef] [Green Version]
- Lin, Y.; Schiavo, S.; Orjala, J.; Vouros, P.; Kautz, R. Microscale LC-MS-NMR platform applied to the identification of active cyanobacterial metabolites. Anal. Chem. 2008, 80, 8045–8054. [Google Scholar] [CrossRef] [Green Version]
- Kautz, R.A.; Goetzinger, W.K.; Karger, B.L. High-throughput microcoil NMR of compound libraries using zero-dispersion segmented flow analysis. J. Comb. Chem. 2005, 7, 14–20. [Google Scholar] [CrossRef]
- Kautz, R.; Wang, P.; Giese, R.W. Nuclear magnetic resonance at the picomole level of a DNA adduct. Chem. Res. Toxicol. 2013, 26, 1424–1429. [Google Scholar] [CrossRef]
- Hentschel, P.; Grynbaum, M.D.; Molnar, P.; Putzbach, K.; Rehbein, J.; Deli, J.; Albert, K. Structure elucidation of deoxylutein II isomers by on-line capillary high performance liquid chromatography-1H nuclear magnetic resonance spectroscopy. J. Chromatogr. A 2006, 1112, 285–292. [Google Scholar] [CrossRef] [PubMed]
- Rehbein, J.; Dietrich, B.; Grynbaum, M.D.; Hentschel, P.; Holtin, K.; Kuehnle, M.; Schuler, P.; Bayer, M.; Albert, K. Characterization of bixin by LC-MS and LC-NMR. J. Sep. Sci. 2007, 30, 2382–2390. [Google Scholar] [CrossRef] [PubMed]
- Gökay, O.; Albert, K. From single to multiple microcoil flow probe NMR and related capillary techniques: A review. Anal. Bioanal. Chem. 2012, 402, 647–669. [Google Scholar] [CrossRef] [PubMed]
- Jones, C.J.; Larive, C.K. Could smaller really be better? Current and future trends in high-resolution microcoil NMR spectroscopy. Anal. Bioanal. Chem. 2012, 402, 61–68. [Google Scholar] [CrossRef]
- Sturm, S.; Seger, C.; Godejohann, M.; Spraul, M.; Stuppner, H. Conventional sample enrichment strategies combined with high-performance liquid chromatography-solid phase extraction-nuclear magnetic resonance analysis allows analyte identification from a single minuscule Corydalis solida plant tuber. J. Chromatogr. A 2007, 1163, 138–144. [Google Scholar] [CrossRef] [PubMed]
- Tatsis, E.C.; Boeren, S.; Exarchou, V.; Troganis, A.N.; Vervoort, J.; Gerothanassis, I.P. Identification of the major constituents of Hypericum perforatum by LC/SPE/NMR and/or LC/MS. Phytochemistry 2007, 68, 383–393. [Google Scholar] [CrossRef] [PubMed]
- Zhao, Y.; Kongstad, K.T.; Jäger, A.K.; Nielsen, J.; Staerk, D. Quadruple high-resolution α-glucosidase/α-amylase/PTP1B/radical scavenging profiling combined with high-performance liquid chromatography-high-resolution mass spectrometry-solid-phase extraction-nuclear magnetic resonance spectroscopy for identification of antidiabetic constituents in crude root bark of Morus alba L. J. Chromatogr. A 2018, 1556, 55–63. [Google Scholar] [CrossRef]
- Johansen, K.T.; Wubshet, S.G.; Nyberg, N.T.; Jaroszewski, J.W. From retrospective assessment to prospective decisions in natural product isolation: HPLC-SPE-NMR analysis of Carthamus oxyacantha. J. Nat. Prod. 2011, 74, 2454–2461. [Google Scholar] [CrossRef]
- Kesting, J.R.; Olsen, L.; Staerk, D.; Tejesvi, M.V.; Kini, K.R.; Prakash, H.S.; Jaroszewski, J.W. Production of unusual dispiro metabolites in Pestalotiopsis virgatula endophyte cultures: HPLC-SPE-NMR, electronic circular dichroism, and time-dependent density-functional computation study. J. Nat. Prod. 2011, 74, 2206–2215. [Google Scholar] [CrossRef]
- Ghosh, R.; Bu, G.; Nannenga, B.L.; Sumner, L.W. Recent developments toward integrated metabolomics technologies (UHPLC-MS-SPE-NMR and MicroED) for higher-throughput confident metabolite identifications. Front. Mol. Biosci. 2021, 8, 720955. [Google Scholar] [CrossRef]
- van der Hooft, J.J.; Mihaleva, V.; de Vos, R.C.; Bino, R.J.; Vervoort, J. A strategy for fast structural elucidation of metabolites in small volume plant extracts using automated MS-guided LC-MS-SPE-NMR. Magn. Reson. Chem. 2011, 49 (Suppl. 1), S55–S60. [Google Scholar] [CrossRef] [PubMed]
- Zarev, Y.; Foubert, K.; Cos, P.; Maes, L.; Elgorashi, E.; Apers, S.; Ionkova, I.; Pieters, L. HPLC-DAD-SPE-NMR isolation of tetracyclic spiro-alkaloids with antiplasmodial activity from the seeds of Erythrina latissima. Nat. Prod. Res. 2020, 34, 1037–1040. [Google Scholar] [CrossRef] [PubMed]
- Chen, C.K.; Lin, F.H.; Tseng, L.H.; Jiang, C.L.; Lee, S.S. Comprehensive study of alkaloids from Crinum asiaticum var. sinicum assisted by HPLC-DAD-SPE-NMR. J. Nat. Prod. 2011, 74, 411–419. [Google Scholar] [CrossRef]
- Tuenter, E.; Foubert, K.; Staerk, D.; Apers, S.; Pieters, L. Isolation and structure elucidation of cyclopeptide alkaloids from Ziziphus nummularia and Ziziphus spina-christi by HPLC-DAD-MS and HPLC-PDA-(HRMS)-SPE-NMR. Phytochemistry 2017, 138, 163–169. [Google Scholar] [CrossRef] [PubMed]
- Zarev, Y.; Foubert, K.; Ionkova, I.; Apers, S.; Pieters, L. Isolation and Structure Elucidation of glucosylated colchicinoids from the seeds of Gloriosa superba by LC-DAD-SPE-NMR. J. Nat. Prod. 2017, 80, 1187–1191. [Google Scholar] [CrossRef]
- de Medeiros, L.S.; da Silva, J.V.; Abreu, L.M.; Pfenning, L.H.; Silva, C.L.; Thomasi, S.S.; Venancio, T.; van Pee, K.H.; Nielsen, K.F.; Rodrigues-Filho, E. Dichlorinated and brominated rugulovasines, ergot alkaloids produced by Talaromyces wortmannii. Molecules 2015, 20, 17627–17644. [Google Scholar] [CrossRef] [PubMed] [Green Version]
- Dong, S.H.; Nikolic, D.; Simmler, C.; Qiu, F.; van Breemen, R.B.; Soejarto, D.D.; Pauli, G.F.; Chen, S.N. Diarylheptanoids from Dioscorea villosa (Wild Yam). J. Nat. Prod. 2012, 75, 2168–2177. [Google Scholar] [CrossRef] [PubMed] [Green Version]
- Xu, Y.J.; Capistrano, R.; Dhooghe, L.; Foubert, K.; Lemiere, F.; Maregesi, S.; Balde, A.; Apers, S.; Pieters, L. Herbal medicines and infectious diseases: Characterization by LC-SPE-NMR of some medicinal plant extracts used against malaria. Planta Med. 2011, 77, 1139–1148. [Google Scholar] [CrossRef] [Green Version]
- Fang, J.; Hoelscher, D.; Schneider, B. Co-occurrence of phenylphenalenones and flavonoids in Xiphidium caeruleum Aubl. flowers. Phytochemistry 2012, 82, 143–148. [Google Scholar] [CrossRef]
- Xu, Y.J.; Foubert, K.; Dhooghe, L.; Lemiere, F.; Maregesi, S.; Coleman, C.M.; Zou, Y.; Ferreira, D.; Apers, S.; Pieters, L. Rapid isolation and identification of minor natural products by LC-MS, LC-SPE-NMR and ECD: Isoflavanones, biflavanones and bisdihydrocoumarins from Ormocarpum kirkii. Phytochemistry 2012, 79, 121–128. [Google Scholar] [CrossRef]
- Liang, C.; Kjaerulff, L.; Hansen, P.R.; Kongstad, K.T.; Staerk, D. Dual high-resolution α-glucosidase and PTP1B inhibition profiling combined with HPLC-PDA-HRMS-SPE-NMR analysis for the identification of potentially antidiabetic chromene meroterpenoids from Rhododendron capitatum. J. Nat. Prod. 2021, 84, 2454–2467. [Google Scholar] [CrossRef] [PubMed]
- Chang, C.C.; Tsai, W.T.; Chen, C.K.; Chen, C.H.; Lee, S.S. Diastereomeric identification of neolignan rhamnosides from Trochodendron aralioides leaves by LC-SPE-NMR and circular dichroism. Fitoterapia 2020, 144, 104455. [Google Scholar] [CrossRef] [PubMed]
- Hendrawati, O.; Woerdenbag, H.J.; Michiels, P.J.; Aantjes, H.G.; van Dam, A.; Kayser, O. Identification of lignans and related compounds in Anthriscus sylvestris by LC-ESI-MS/MS and LC-SPE-NMR. Phytochemistry 2012, 72, 2172–2179. [Google Scholar] [CrossRef] [PubMed]
- Cakova, V.; Urbain, A.; Antheaume, C.; Rimlinger, N.; Wehrung, P.; Bonté, F.; Lobstein, A. Identification of phenanthrene derivatives in Aerides rosea (Orchidaceae) using the combined systems HPLC-ESI-HRMS/MS and HPLC-DAD-MS-SPE-UV-NMR. Phytochem. Anal. 2015, 26, 34–39. [Google Scholar] [CrossRef] [PubMed]
- Yuan, J.F.; Zhang, Z.Q.; Kang, X.Q.; Liu, J.L. LC-MS analysis for the components captured by ECV304 cell from extract of Aconitum szechenyianum Gay. Biomed. Chromatogr. 2009, 23, 406–411. [Google Scholar] [CrossRef] [PubMed]
- Castro, A.; Moco, S.; Coll, J.; Vervoort, J. LC-MS-SPE-NMR for the isolation and characterization of neo-clerodane diterpenoids from Teucrium luteum subsp. flavovirens (perpendicular). J. Nat. Prod. 2010, 73, 962–965. [Google Scholar] [CrossRef]
- Gimenes, L.; Luna-Dulcey, L.; Batista, J.M., Jr.; Dos Santos, F.M., Jr.; Popolin, C.P.; Cominetti, M.R.; Fernandes, J.B.; Staerk, D. Structure elucidation and absolute configuration determination of nortriterpenoids from Picramnia glazioviana. J. Nat. Prod. 2020, 83, 1859–1875. [Google Scholar] [CrossRef]
- Silva, E.L.; Almeida-Lafetá, R.C.; Borges, R.M.; Staerk, D. Athenolide A, a new steroidal lactone from the leaves of Athenaea martiana (Solanaceae) determined by means of HPLC-HR-MS-SPE-NMR analysis. Chem. Biodivers. 2018, 15, e1700455. [Google Scholar] [CrossRef]
- Gao, H.; Zehl, M.; Kaehlig, H.P.; Schneider, P.; Stuppner, H.; Banuls, L.M.Y.; Kiss, R.; Kopp, B. Rapid structural identification of cytotoxic bufadienolide sulfates in toad venom from Bufo melanosticus by LC-DAD-MSn and LC-SPE-NMR. J. Nat. Prod. 2010, 73, 603–608. [Google Scholar] [CrossRef]
- Clarkson, C.; Staerk, D.; Hansen, S.H.; Smith, P.J.; Jaroszewski, J.W. Identification of major and minor constituents of Harpagophytum procumbens (Devil’s claw) using HPLC-SPE-NMR and HPLC-ESIMS/APCIMS. J. Nat. Prod. 2006, 69, 1280–1288. [Google Scholar] [CrossRef]
- Liu, H.; Zheng, A.; Liu, H.; Yu, H.; Wu, X.; Xiao, C.; Dai, H.; Hao, F.; Zhang, L.; Wang, Y.; et al. Identification of three novel polyphenolic compounds, origanine A-C, with unique skeleton from Origanum vulgare L. using the hyphenated LC-DAD-SPE-NMR/MS methods. J. Agric. Food Chem. 2012, 60, 129–135. [Google Scholar] [CrossRef] [PubMed]
- Zebiri, I.; Gratia, A.; Nuzillard, J.M.; Haddad, M.; Cabanillas, B.; Harakat, D.; Voutquenne-Nazabadioko, L. New oleanane saponins from the roots of Dendrobangia boliviana identified by LC-SPE-NMR. Magn. Reson. Chem. 2017, 55, 1036–1044. [Google Scholar] [CrossRef] [PubMed] [Green Version]
- Nyberg, N.T.; Baumann, H.; Kenne, L. Solid-phase extraction NMR studies of chromatographic fractions of saponins from Quillaja saponaria. Anal. Chem. 2003, 75, 268–274. [Google Scholar] [CrossRef]
- Singleton, C.; Brkljača, R.; Urban, S. Absolute configuration determination of retroflexanone using the advanced Mosher method and application of HPLC-NMR. Mar. Drugs 2018, 16, 205. [Google Scholar] [CrossRef] [Green Version]
- Seger, C.; Godejohann, M.; Spraul, M.; Stuppner, H.; Hadacek, F. Reaction product analysis by high-performance liquid chromatography-solid-phase extraction-nuclear magnetic resonance application to the absolute configuration determination of naturally occurring polyyne alcohols. J. Chromatogr. A 2006, 1136, 82–88. [Google Scholar] [CrossRef]
- Sturm, S.; Högner, C.; Seger, C.; Stuppner, H. Combining HPLC-DAD-QTOF-MS and HPLC-SPE-NMR to monitor in vitro vitetrifolin D phase I and II metabolism. Metabolites 2021, 11, 529. [Google Scholar] [CrossRef] [PubMed]
- Lambert, M.; Staerk, D.; Hansen, S.H.; Jaroszewski, J.W. HPLC-SPE-NMR hyphenation in natural products research: Optimization of analysis of Croton membranaceus extract. Magn. Reson. Chem. 2005, 43, 771–775. [Google Scholar] [CrossRef] [Green Version]
- Wubshet, S.G.; Johansen, K.T.; Nyberg, N.T.; Jaroszewski, J.W. Direct 13C NMR detection in HPLC hyphenation mode: Analysis of Ganoderma lucidum terpenoids. J. Nat. Prod. 2012, 75, 876–882. [Google Scholar] [CrossRef]
- Lambert, M.; Wolfender, J.L.; Staerk, D.; Christensen, S.B.; Hostettmann, K.; Jaroszewski, J.W. Identification of natural products using HPLC-SPE combined with CapNMR. Anal. Chem. 2007, 79, 727–735. [Google Scholar] [CrossRef]
- Grosso, C.; Jäger, A.K.; Staerk, D. Coupling of a high-resolution monoamine oxidase-A inhibitor assay and HPLC-SPE-NMR for advanced bioactivity profiling of plant extracts Phytochem. Anal. 2013, 24, 141–147. [Google Scholar] [CrossRef]
- Meier, U.C. Detection and identification of hydrolysis products of sulfur mustards at trace levels in environmental samples using liquid chromatography solid phase extraction combined with off-line nuclear magnetic resonance analysis. J. Chromatogr. A 2013, 1286, 159–165. [Google Scholar] [CrossRef] [PubMed]
- Wilson, S.R.; Malerød, H.; Petersen, D.; Simic, N.; Bobu, M.M.; Rise, F.; Lundanes, E.; Greibrokk, T. Controlling LC–SPE–NMR systems. J. Sep. Sci. 2006, 29, 582–589. [Google Scholar] [CrossRef] [PubMed]
- Thomasi, S.S.; Ladeira, C.; Ferreira, D.; da Fontoura Sprenger, R.; Badino, A.C.; Ferreira, A.G.; Venâncio, T. Identification of two new phosphorylated polyketides from a Brazilian Streptomyces sp. through the use of LC–SPE/NMR. Helv. Chim. Acta 2016, 99, 281–285. [Google Scholar] [CrossRef]
- Fagundes, T.S.F.; Macedo, A.L.; Rigato, D.B.; Amaral, B.S.D.; Jimenez, P.C.; Costa-Lotufo, L.V.; Pereira, R.F.A.; Aguiar-Alves, F.; Soares, A.R.; Vasconcelos, T.R.A.; et al. The Brazilian octocoral Phyllogorgia dilatata as a source of cytotoxic compounds. An. Acad. Bras. Cienc. 2021, 93, e20200686. [Google Scholar] [CrossRef] [PubMed]
- Wen, C.; Wang, D.; Li, X.; Huang, T.; Huang, C.; Hu, K. Targeted isolation and identification of bioactive compounds lowering cholesterol in the crude extracts of crabapples using UPLC-DAD-MS-SPE/NMR based on pharmacology-guided PLS-DA. J. Pharm. Biomed. Anal. 2018, 150, 144–151. [Google Scholar] [CrossRef]


Publisher’s Note: MDPI stays neutral with regard to jurisdictional claims in published maps and institutional affiliations. |
© 2022 by the authors. Licensee MDPI, Basel, Switzerland. This article is an open access article distributed under the terms and conditions of the Creative Commons Attribution (CC BY) license (https://creativecommons.org/licenses/by/4.0/).
Share and Cite
Seger, C.; Sturm, S. NMR-Based Chromatography Readouts: Indispensable Tools to “Translate” Analytical Features into Molecular Structures. Cells 2022, 11, 3526. https://doi.org/10.3390/cells11213526
Seger C, Sturm S. NMR-Based Chromatography Readouts: Indispensable Tools to “Translate” Analytical Features into Molecular Structures. Cells. 2022; 11(21):3526. https://doi.org/10.3390/cells11213526
Chicago/Turabian StyleSeger, Christoph, and Sonja Sturm. 2022. "NMR-Based Chromatography Readouts: Indispensable Tools to “Translate” Analytical Features into Molecular Structures" Cells 11, no. 21: 3526. https://doi.org/10.3390/cells11213526