Article

Bioinformatics Analysis and Validation of the Role of Lnc-RAB11B-AS1 in the Development and Prognosis of Hepatocellular Carcinoma

1
Guangzhou Center for Disease Control and Prevention, Guangzhou 510440, China
2
Institute of Public Health, Guangzhou Medical University & Guangzhou Center for Disease Control and Prevention, Guangzhou 510440, China
3
Department of Public Health and Preventive Medicine, School of Medicine, Jinan University, Guangzhou 510632, China
4
Guangzhou Key Laboratory for Clinical Rapid Diagnosis and Early Warning of Infectious Diseases, KingMed School of Laboratory Medicine, Guangzhou Medical University, Guangzhou 510180, China
*
Author to whom correspondence should be addressed.
These authors contributed equally to this work.
Cells 2022, 11(21), 3517; https://doi.org/10.3390/cells11213517
Submission received: 29 September 2022 / Revised: 1 November 2022 / Accepted: 3 November 2022 / Published: 6 November 2022
(This article belongs to the Section Cell Methods)

Abstract

:
Lnc-RAB11B-AS1 is reported to be dysregulated in several types of cancers and can function as both an oncogene and tumor suppressor gene. To evaluate the potential role of lnc-RAB11B-AS1 in hepatocellular carcinoma (HCC), we investigated and evaluated its expression in HCC based on the data mining of a series of public databases, including TCGA, GEO, ICGC, HPA, DAVID, cBioPortal, GeneMIANA, TIMER, and ENCORI. The data showed downregulation of lnc-RAB11B-AS1 in HCC and was accompanied by the synchronous downregulation of the targeted RAB11B mRNA and its protein. Low expression of lnc-RAB11B-AS1 was associated with shorter overall survival (OS) and disease-free survival (DFS) of HCC patients, PD1/PD-L1 was correlated with low expression of RAB11B. Furthermore, Gene Ontology (GO) functional annotation and Kyoto Encyclopedia of Genes and Genomes (KEGG) pathway enrichment analysis showed a correlation between immune cell change and non-alcoholic fatty liver disease. The above findings revealed that lnc-RAB11B-AS1 was down-regulated in HCC and closely associated with the clinical stage of the HCC patients, suggesting that lnc-RAB11B-AS1 could be a possible predictor for HCC and a potential new therapeutic target for the treatment of HCC.

1. Introduction

Hepatocellular carcinoma (HCC) is a common malignant tumor that occurs in the digestive tract with high malignancy, rapid progression, high recurrence rate, and poor prognosis [1]. With approximately 906,000 new cases and 830,000 deaths recorded each year, HCC is the sixth leading cause of cancer incidence worldwide, and the number of associated deaths was ranked third after gastric cancer and esophageal cancer in 2020 [2]. Notably, approximately half of newly diagnosed HCC cases globally occur in China; and as a result, HCC has become the fourth most common malignant tumor and the second most lethal cause of cancer in China, which seriously increases the disease burden [3]. The known risk factors include viral infection, poisonous substances, abnormal metabolism, liver cirrhosis, and smoking [4]. These factors are likely to lead to genetic and epigenetic changes, breaking the internal balance between proto-oncogenes and tumor suppressor genes, and thus resulting in HCC [5]. Research has shown that the sensitivity and specificity of early diagnosis of HCC remain low, and most HCC patients are diagnosed at the middle or even at the late stages. These patients often have severe liver cirrhosis, and it is not suitable for them to undergo surgical resection or liver transplantation. In the past decade, although great progress had been made in non-drug therapies and drug therapies for HCC treatment, such as liver resection, liver transplantation, transcatheter arterial chemoembolization, ablation therapy, and radiotherapy, 50–70% of HCC patients with radical resection may relapse or metastasize within 5 years, which indicates a poor progress for HCC patients [6]. Furthermore, multidrug resistance is one of the predominant reasons for the unsuccessful treatment of HCC because of the reduced sensitivity of patients to chemotherapy drugs. Therefore, exploring the molecular mechanism and seeking new biomarkers to inhibit metastasis and recurrence of HCC is of great importance for the early diagnosis, clinical treatment, and prognosis of HCC.
Long noncoding RNAs (lncRNAs), RNAs without protein-coding functions, are families of noncoding molecular transcripts. In recent years, studies have shown that genomic mutations in non-coding regions are mostly transcribed into lncRNAs and then combined with DNA, RNA, proteins, or other molecules to play a regulatory role in epigenetics. Furthermore, lncRNAs have been identified as having effects on multiple biological processes such as proliferation, apoptosis, invasion, migration, metastasis, and epithelial-mesenchymal transition of multiple cancer cells [7]. Antisense long noncoding RNAs account for approximately 20% of all lncRNAs in mammalian cells and are transcribed from the antisense strands of their coding or non-coding genes. Compared with other types of lncRNAs, such lncRNAs have attracted increasing attention because of their special structure and genomic location [8]. Moreover, accumulating evidence has confirmed that lncRNAs are involved in the progression of HCC, and the underlying mechanism is inextricably related to their subcellular localization. For instance, Yang et al. indicated that cytoplasmic MAPKAPK5-AS1 acts as a ceRNA by sponging let-7f-1-3p and cis-regulating the adjacent gene MAPKAPK5, thus promoting the progression of colorectal cancer. While in the nucleus, it can recruit RBM4 and eIF4A1 to promote the translation of MAPKAPK5 [9].
The RAB protein family belongs to a group of highly conserved small GTP binding proteins in eukaryotes and is an essential member of the RAS superfamily. The activity of RAB proteins is strictly regulated in various cells. They localize specifically in subcellular organelles and have an important role in the vesicular transport of intracellular proteins. More than 70 RAB proteins have been discovered thus far, and they are widely distributed in the membrane structures of various biological cells [10,11]. Studies have documented that different members of the Rab11 subfamily are dysregulated and can modulate the aggressiveness and metastasis of multiple cancers [12], including osteosarcoma [13], lung cancer [14], gastric cancer [15], and renal cell carcinoma [16]. Based on previous research on lnc-RAB11B-AS1, it was found that lnc-RAB11B-AS1 has a regulatory effect on its adjacent gene RAB11B. Chen et al. reported that lnc-RAB11B-AS1 inhibited the proliferation, progression, invasion, and migration of osteosarcoma cells by mediating the effects of its natural antisense transcript RAB11B [17]. Li et al. disclosed a novel mechanism by which lnc-RAB11B-AS1 functions to promote the development of lung cancer through upregulating RAB11B expression [13]. However, there is still no relevant explanation of the role of lnc-RAB11B-AS1 in HCC. Herein, we have investigated the expression level and prognostic value of lnc-RAB11B-AS1 in HCC by bioinformatic analysis. To elucidate the potential mechanism related to the regulation of lnc-RAB11B-AS1, we have examined the interaction between lnc-RAB11B-AS1 and RAB11B. Moreover, an immunohistochemical staining test was conducted to verify our results at the protein level.

2. Materials and Methods

2.1. Data Acquisition and Preprocessing

We searched and downloaded the transcriptomic sequencing data and detailed clinical data of HCC patients from TCGA (https://portal.gdc.cancer.gov/repository, accessed on 3 May 2022) database [18]. A total of 369 HCC cases and 50 normal cases were included in our study after duplicate information was deleted. Among 347 HCC patients with known treatment statuses, 239 patients did not receive treatment (4 of them had another new primary tumor), 18 patients were treated, and the remaining 90 cases were recurrent (13 of them had relapses of other tumors, such as lung and bone cancer). Clinicopathological data included age, sex, clinical stage, histological grade, TNM grade, and survival time. Furthermore, two microarray gene expression datasets, GSE144269 and GSE84402, were obtained from GEO (https://www.ncbi.nlm.nih.gov/geo/, accessed on 5 May 2022) database [19]. It appeared that a great number of lncRNAs might be involved in the occurrence of diseases by affecting the expression and regulation of antisense genes [20,21]. Therefore, the correlation between the expression levels of lnc-RAB11B-AS1 and its protein-coding gene RAB11B was explored in HCC.

2.2. Immunohistochemistry (IHC) Assay of RAB11B Protein in HCC Tissues

To verify the results in TCGA and GEO, an IHC assay was performed using HCC tissue microarray purchased from Shanghai Outdo Biotech Company (lot NO. hlivh180su15; Shanghai, China,). All experiments followed the manufacturer’s instructions. A total of 90 histologically confirmed HCC cases were enrolled in our study, which contain 90 pairs of cancer tissues and adjacent non-cancerous tissues. The protocol was approved by the ethics committee of Shanghai Outdo Biotech Co., Ltd (The approval code of the ethical committee is SHYJS-CP-1901001). Furthermore, these patients underwent surgery from June 2007 to October 2008 and were followed up for 3–5 years with the recurrence time and multiple biochemical indexes recorded, such as TNM stage, pathological grade, and survival time.

2.3. Protein-Protein Interactions of RAB11B

GeneMANIA (http://genemania.org/, accessed on 11 June 2022) [22] can be used to search large and publicly available biological datasets for protein-protein, protein-DNA, and genetic interactions of related genes. The default species “Homo sapiens” was selected, and we constructed PPI networks by GeneMANIA online to analyze the interaction between RAB11B and other functional proteins.

2.4. Human Protein Atlas (HPA)

HPA (https://www.proteinatlas.org, accessed on 4 August 2022) [23] is a public database containing a large-scale human protein map that not only includes tumor tissues but also covers the protein expression of normal tissues. The new section of this database, “single cell type atlas”, includes single-cell RNA sequencing data from 13 human tissues and a total of 192 cell types. It is also available for retrieving genes from different cell types, as well as clustered Uniform Manifold Approximation and Projection plots and expression histograms. On this basis, we explored the expression pattern of RAB11B and other marker genes of cluster cells in different single-cell types. To facilitate the comparison, the total read counts for all genes were calculated and normalized to transcripts per million (nTPM) protein-coding genes for each of the single-cell clusters.

2.5. Screening of lnc-RAB11B-AS1 Co-Expressed Genes in HCC and Functional Enrichment Analysis

The main features of the DAVID (https://david.ncifcrf.gov, accessed on 11 June 2022) [24] are functional annotation and information links, which can help investigators identify the pathways that are crucial to biological processes. Using GEPIA 2.0 (http://gepia2.cancer-pku.cn/#index, accessed on 11 June 2022) database [25], we searched for the top 200 genes highly correlated with lnc-RAB11B-AS1. Next, these co-expressed genes were imported to the DAVID for GO and KEGG enrichment analysis.

2.6. GSEA Analysis

To analyze the molecular signal pathways potentially regulated by lnc-RAB11B-AS1, GSEA was performed combined with the raw expression profiles from TCGA, as implemented using the “cluserProfiler” R package from the Molecular Signature Database (MSigDB)_v7.0_GMTs and the reference dataset “c5.all.v7.0.entrez.gmt”. Based on a 50% cut-off value, the differentially expressed genes (DEGs) between the lnc-RAB11B-AS1 high-and low-expression groups were determined at the transcriptomic level. Enrichment results with normalized p < 0.05 and a false discovery rate of <0.25 were considered statistically significant.

2.7. An Association between lnc-RAB11B-AS1, RAB11B, and Tumor Immune Cell Infiltration

TIMER (https://cistrome.shinyapps.io/timer/, accessed on 18 June 2022) [26] is an integrated database that can be applied to systematically analyze the molecular signatures of tumor-immune interactions, and the levels of six tumor-infiltrating immune subsets can be estimated by the deconvolution method to explore the relationship between the gene expression, mutation, and immune cell infiltrating abundance. Using TIMER, we retrieved a matrix of immune cell infiltration levels in TCGA-LIHC samples, including B cells, CD4+ T cells, CD8+ T cells, neutrophils, macrophages, and dendritic cells. Correlations between the expression of these genes and various tumor-infiltrating immune cells were investigated using the Spearman test, with p <0.05. Furthermore, xCell integrates the advantages of ssGSEA and can calculate the abundance fraction of 64 immune cell types. We assessed the immune cell infiltration scores for each patient in HCC using normalized gene expression profiles. Immune infiltration scores significantly correlated with gene expression were identified using the “corr.test” function of the R package “psych” (version 2.1.6).

2.8. Alternation of lnc-RAB11B-AS1 and RAB11B in HCC

The occurrence and development of malignant tumors are influenced by mutations in specific regulatory genes. The cBioportal database (http://www.cbioportal.org, accessed on 3 August 2022) [27] contains multiple databases with a total of 283 large tumor-related genomic and proteomic items and provides visualization tools for the analysis of cancer-related genetic data. Following the conditions of data filtering and extraction, we investigated the type and frequency of lnc-RAB11B-AS1 and RAB11B mutations in HCC.

2.9. Correlation between Methylation and lnc-RAB11B-AS1 Expression

Aberrant methylation can be a powerful mechanism leading to the loss of gene function; therefore, we analyzed the relationship between lnc-RAB11B-AS1 expression and methylation. We downloaded the methylation data, phenotype information, and clinical data of HCC patients from UCSC Xena (https://xenabrowser.net/datapages/, accessed on 1 August 2022) [28], and 50 HCC patients with “normal-tumor” pairings were selected for further analysis.

2.10. Drug Susceptibility Analysis

CellMiner (https://discover.nci.nih.gov/cellminer/CellMiner, accessed on 18 July 2022) [29] database facilitates researchers to integrate and analyze the molecular and pharmacological data from the NCI-60 cancer cell line, which is also used by the National Cancer Institute’s Developmental Therapeutics Program to screen more than 100,000 compounds and natural products. We directly selected processed data sets from this database, including RNA-Seq and compound activity (DTP NCI-60). A sensitivity analysis of lnc-RAB11B-AS1 and related drugs was then conducted and we showed scatter plots of the top nine drugs with the most statistical significance.

2.11. Prediction of Potential Candidate miRNAs

We used miRWalk (http://mirwalk.umm.uni-heidelberg.de/, accessed on 8 July 2022) [30] and ENCORI (https://starbase.sysu.edu.cn/, accessed on 8 July 2022) [31] database to predict the miRNAs targeted by lnc-RAB11B-AS1 and RAB11B; thus, the same miRNA binding sites of the two genes could be found. To verify the expression pattern and prognosis of candidate miRNAs, the RNA-Seq data of 232 HCC patients and their corresponding clinical information were retrieved from the International Cancer Genome Consortium (ICGC) (https://dcc.icgc.org/, accessed on 10 July 2022) [32], which collected data on 50 different cancer types including abnormal gene expression, somatic mutations, and epigenetic modifications.

2.12. Statistical Analysis

Statistical analyses were performed using GraphPad Prism-8.00 and R-4.1.2. To determine the difference in lnc-RAB11B-AS1 expression between HCC and normal groups, we used Wilcoxon rank-sum tests via GraphPad Prism. The relationships between ln-RAB11B-AS1 and clinicopathological features were assessed based on the chi-squared test, which revealed the prognostic significance of lnc-RAB11B-AS1 for HCC. The Kaplan-Meier method was employed for survival analysis using the log-rank test in group comparisons, while the Cox regression model was utilized to investigate the relationship between clinicopathological features and survival. Hazard Ratio (HR) values and 95% CIs were also calculated. All p values were two-tailed, and p < 0.05 indicated statistical significance.

3. Results

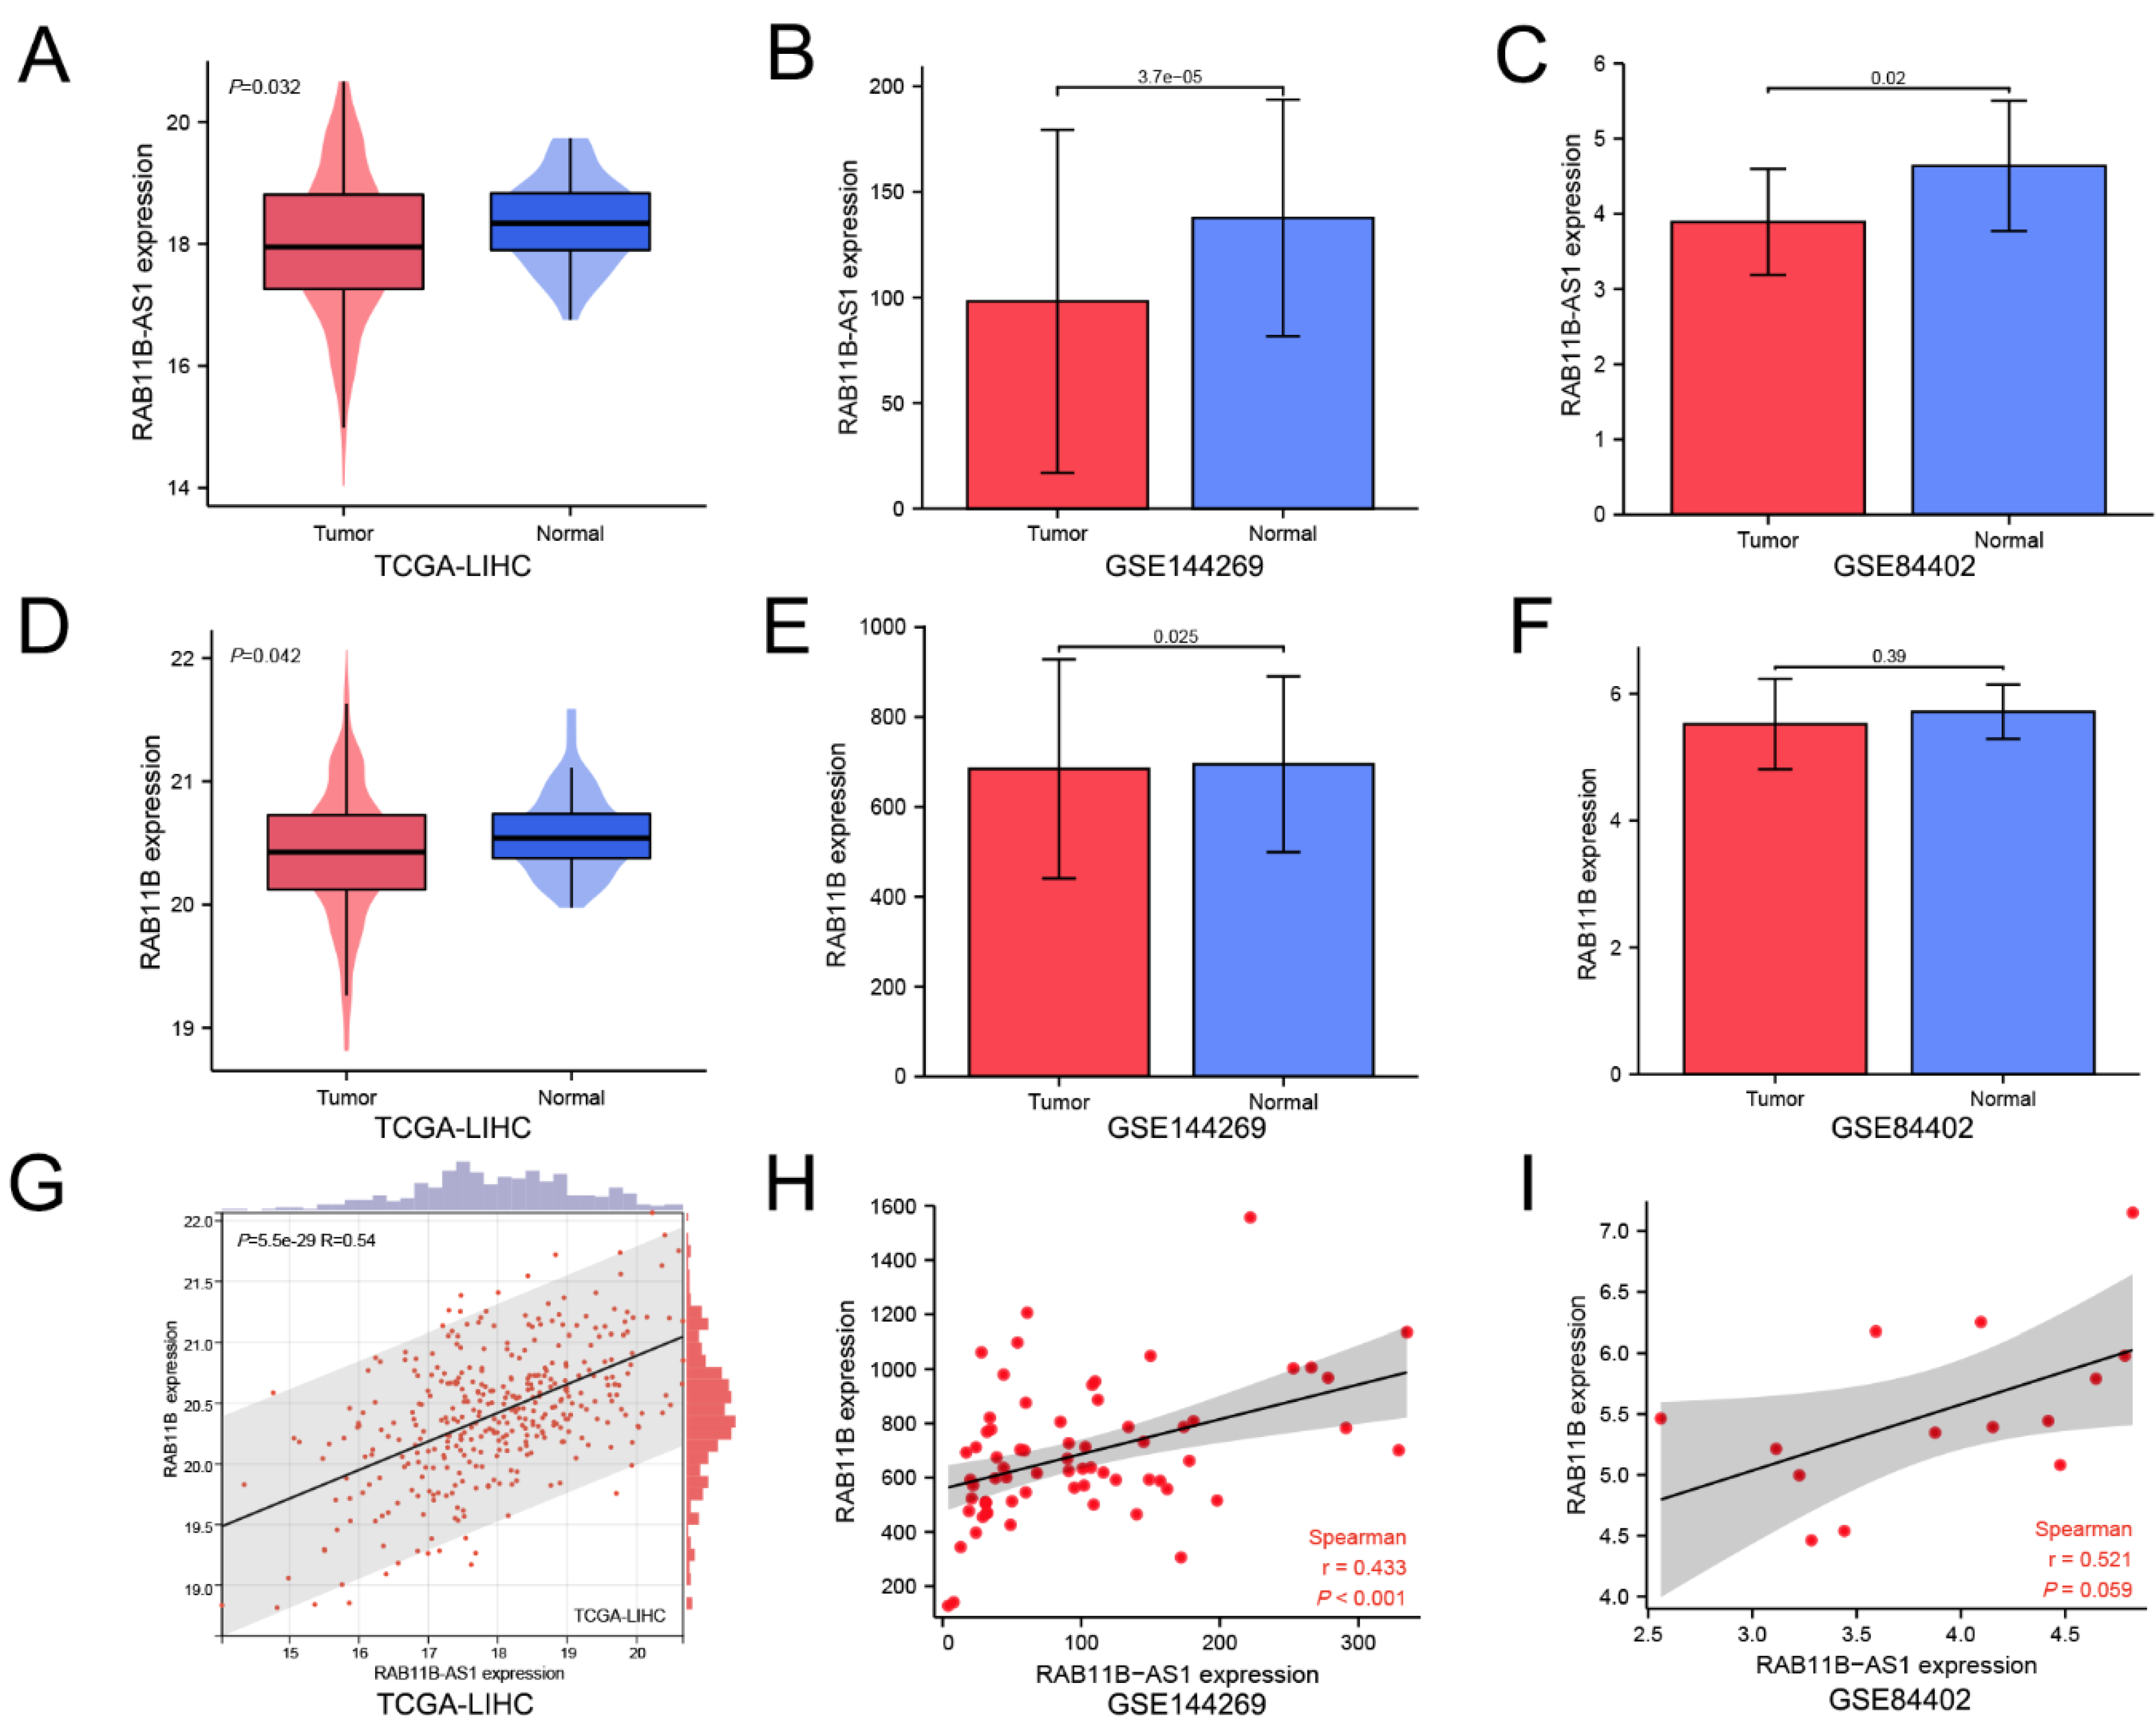
3.1. Lnc-RAB11B-AS1 Was Markedly Low Expressed and Positively Correlated with RAB11B in HCC

To explore the expression status of lnc-RAB11B-AS1 and RAB11B in HCC, transcriptome data of the above genes of HCC were retrieved from TCGA. The expression levels of lnc-RAB11B-AS1 and RAB11B were distinctly lower in the single 369 HCC tissues than in the 50 normal tissues (p = 0.032, p = 0.042, respectively, Figure 1A,D). Analysis of GSE144269 and GSE84402 datasets also verified that lnc-RAB11B-AS1 and RAB11B were down-regulated in HCC tissues compared to normal liver tissues (p < 0.001, p = 0.025, respectively, Figure 1B,C,E,F). Furthermore, lnc-RAB11B-AS1 exhibited a positive relationship with RAB11B in TCGA-LIHC (R = 0.54, p < 0.001, Figure 1G). As depicted in Figure 1H,I, similar association patterns between lnc-RAB11B-AS1 and RAB11B were observed in GSE144269 and GSE84402, but only the former showed statistical significance (R = 0.433, p < 0.01; R = 0.521, p = 0.059).

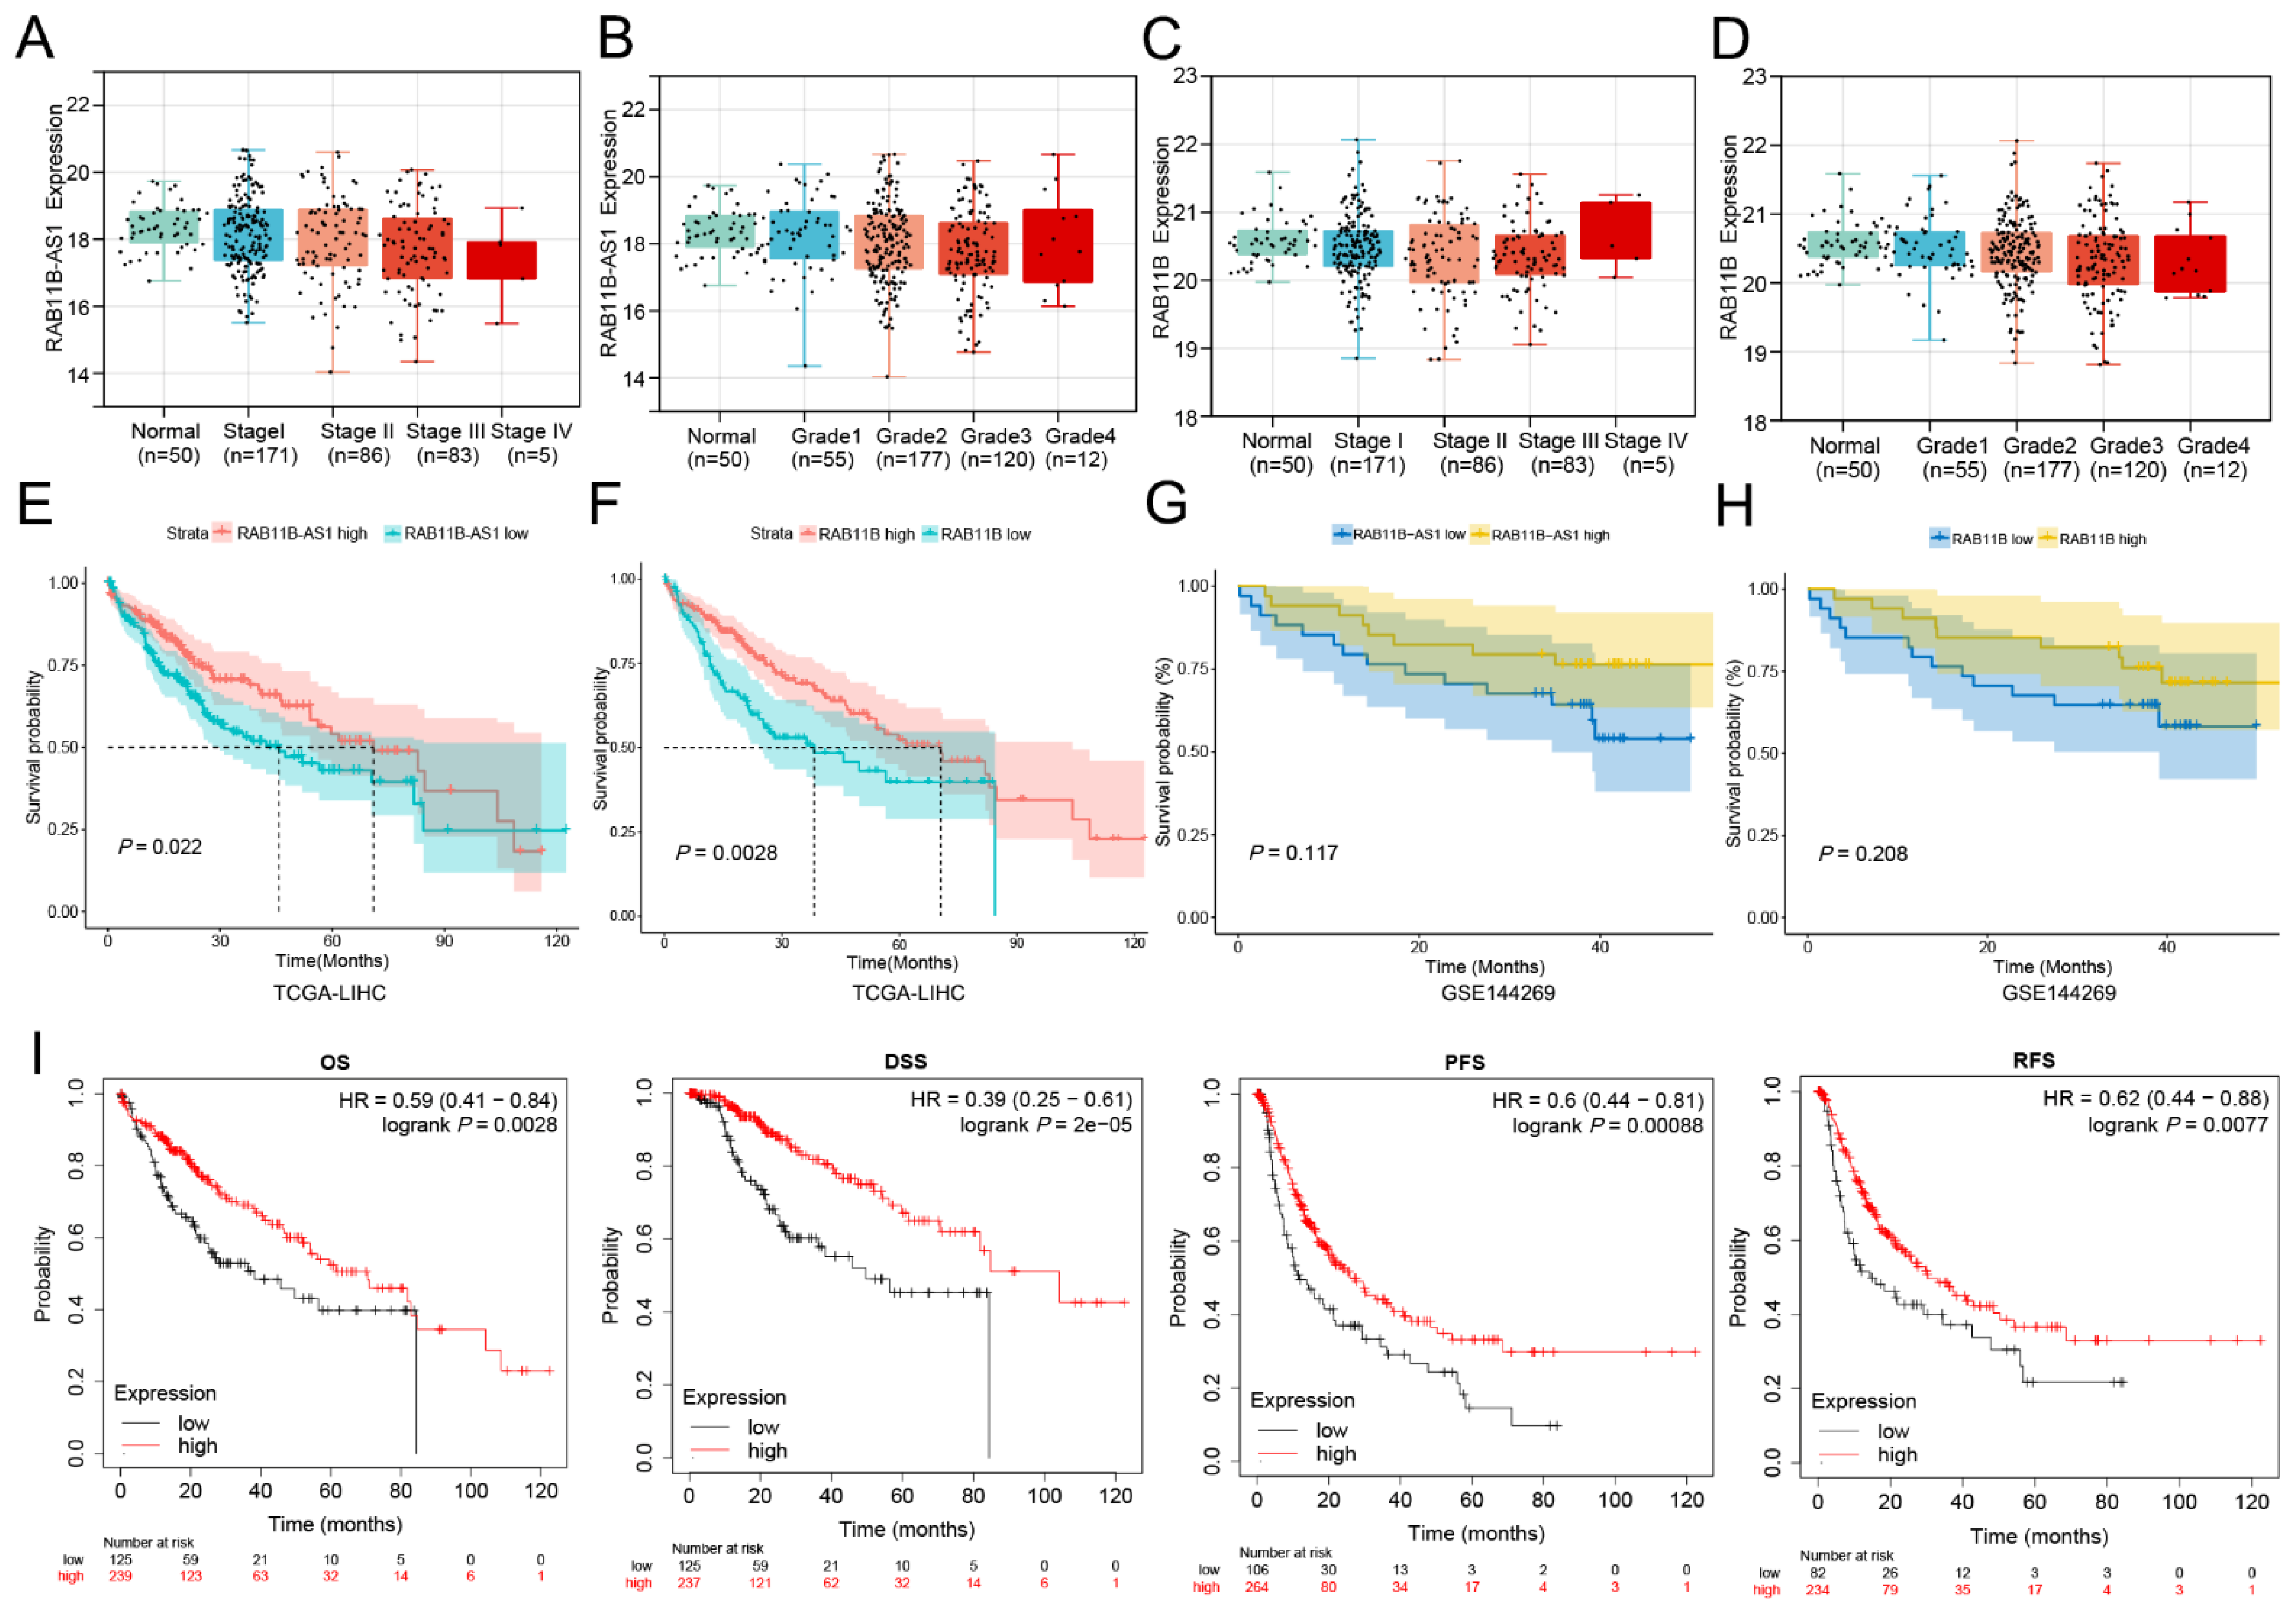
3.2. The Effects of Overexpressed lnc-RAB11B-AS1 and RAB11B on Clinicopathological Characteristics

As shown in Table 1, there were more men in the high expression group than women (χ2 = 9.908, p = 0.002). Highly expressed lnc-RAB11B-AS1 in HCC was associated with a lower level of clinical stage (χ2 = 4.054, p = 0.044), N stage (χ2 = 4.605, p = 0.032), and histologic stage (χ2 = 4.416, p = 0.036). The values of AFP and T-Bil were notably different between lnc-RAB11B-AS1 high and low groups (p = 0.018, p = 0.034, respectively). In addition, we found no significant association between lnc-RAB11B-AS1 expression and age, race, history of hepatocarcinoma risk factors, T stage, M stage, treatment or treatment type, cancer first-degree relative, etc. Therefore, we speculate that high lnc-RAB11B-AS1 expression indicates a better clinical outcome in HCC patients. As for its sense-cognate gene RAB11B shown in Table 2, it was only negatively correlated with the degree of histological grade (χ2 = 5.920, p = 0.015). In addition, the expression patterns of lnc-RAB11B-AS1 and RAB11B in HCC patients with different clinical stages and histologic grades were visualized through the R package “gg-plot”. The histologic grade and clinical stage tended to be higher in patients with a lower expression of the two genes (Figure 2A–D).

3.3. The Relationship between lnc-RAB11B-AS1 Expression and Prognosis of HCC Patients

The Kaplan-Meier analysis suggested that the upregulated expression of lnc-RAB11B-AS1 was markedly associated with better OS in HCC patients (p = 0.022, Figure 2E). OS was evidently reduced in patients with low RAB11B expression than in patients with high RAB11B expression (p = 0.0028, Figure 2F). As an independent validation dataset, the results of lnc-RAB11B-AS1 and RAB11B in GSE144269 uncovered a similar prognostic trend (Figure 2G,H). HCC patients with decreased expression of the above two genes experienced a shorter survival time, but no statistical significance was observed (p = 0.12, p = 0.21, respectively) due to the deficiency of samples in the GEO data (n = 68). Furthermore, we evaluated the prognostic significance of RAB11B for HCC using the Kaplan-Meier Plotter database (https://kmplot.com/analysis/, accessed on 25 May 2022) [33]. As we expected, the prognostic data disclosed OS time, disease-specific survival (DSS) time, progression-free survival (PFS) time, and relapse-free survival (RFS) time was longer in HCC patients with a higher RAB11B expression, while those with a low RAB11B expression had a worse survival outcome (All p < 0.01, Figure 2I).

3.4. Cox Regression Model Analysis

As detailed in Table 3, univariate and multivariate Cox regression analyses were employed based on TCGA-LIHC data to investigate the potential risk factors affecting the prognosis of HCC patients. At univariate Cox regression analysis, clinical stage (HR = 1.312; p = 0.041), T stage (HR = 2.562; p < 0.001), N stage (HR = 1.991; p = 0.038), M stage (HR = 3.907; p = 0.021), creatinine (HR = 1.710; p = 0.031), lnc-RAB11B-AS1 (HR = 0.814; p = 0.009), and RAB11B (HR = 0.651; p = 0.012) were related to the overall survival rate in HCC patients. The variables with statistical significance in univariate analysis were further included in the multivariate Cox regression analysis, which revealed that poorer overall survival was substantially correlated with a low expression of lnc-RAB11B-AS1 (HR = 0.799; p = 0.025), RAB11B (HR = 0.898; p = 0.041), advanced clinical stage (HR = 2.628; p < 0.001), higher N stage (HR = 8.846; p = 0.013), and creatinine (HR = 1.710; p = 0.031). According to the above-mentioned data, we have unearthed the potential of lnc-RAB11B-AS1 as a tumor suppressor gene for HCC.

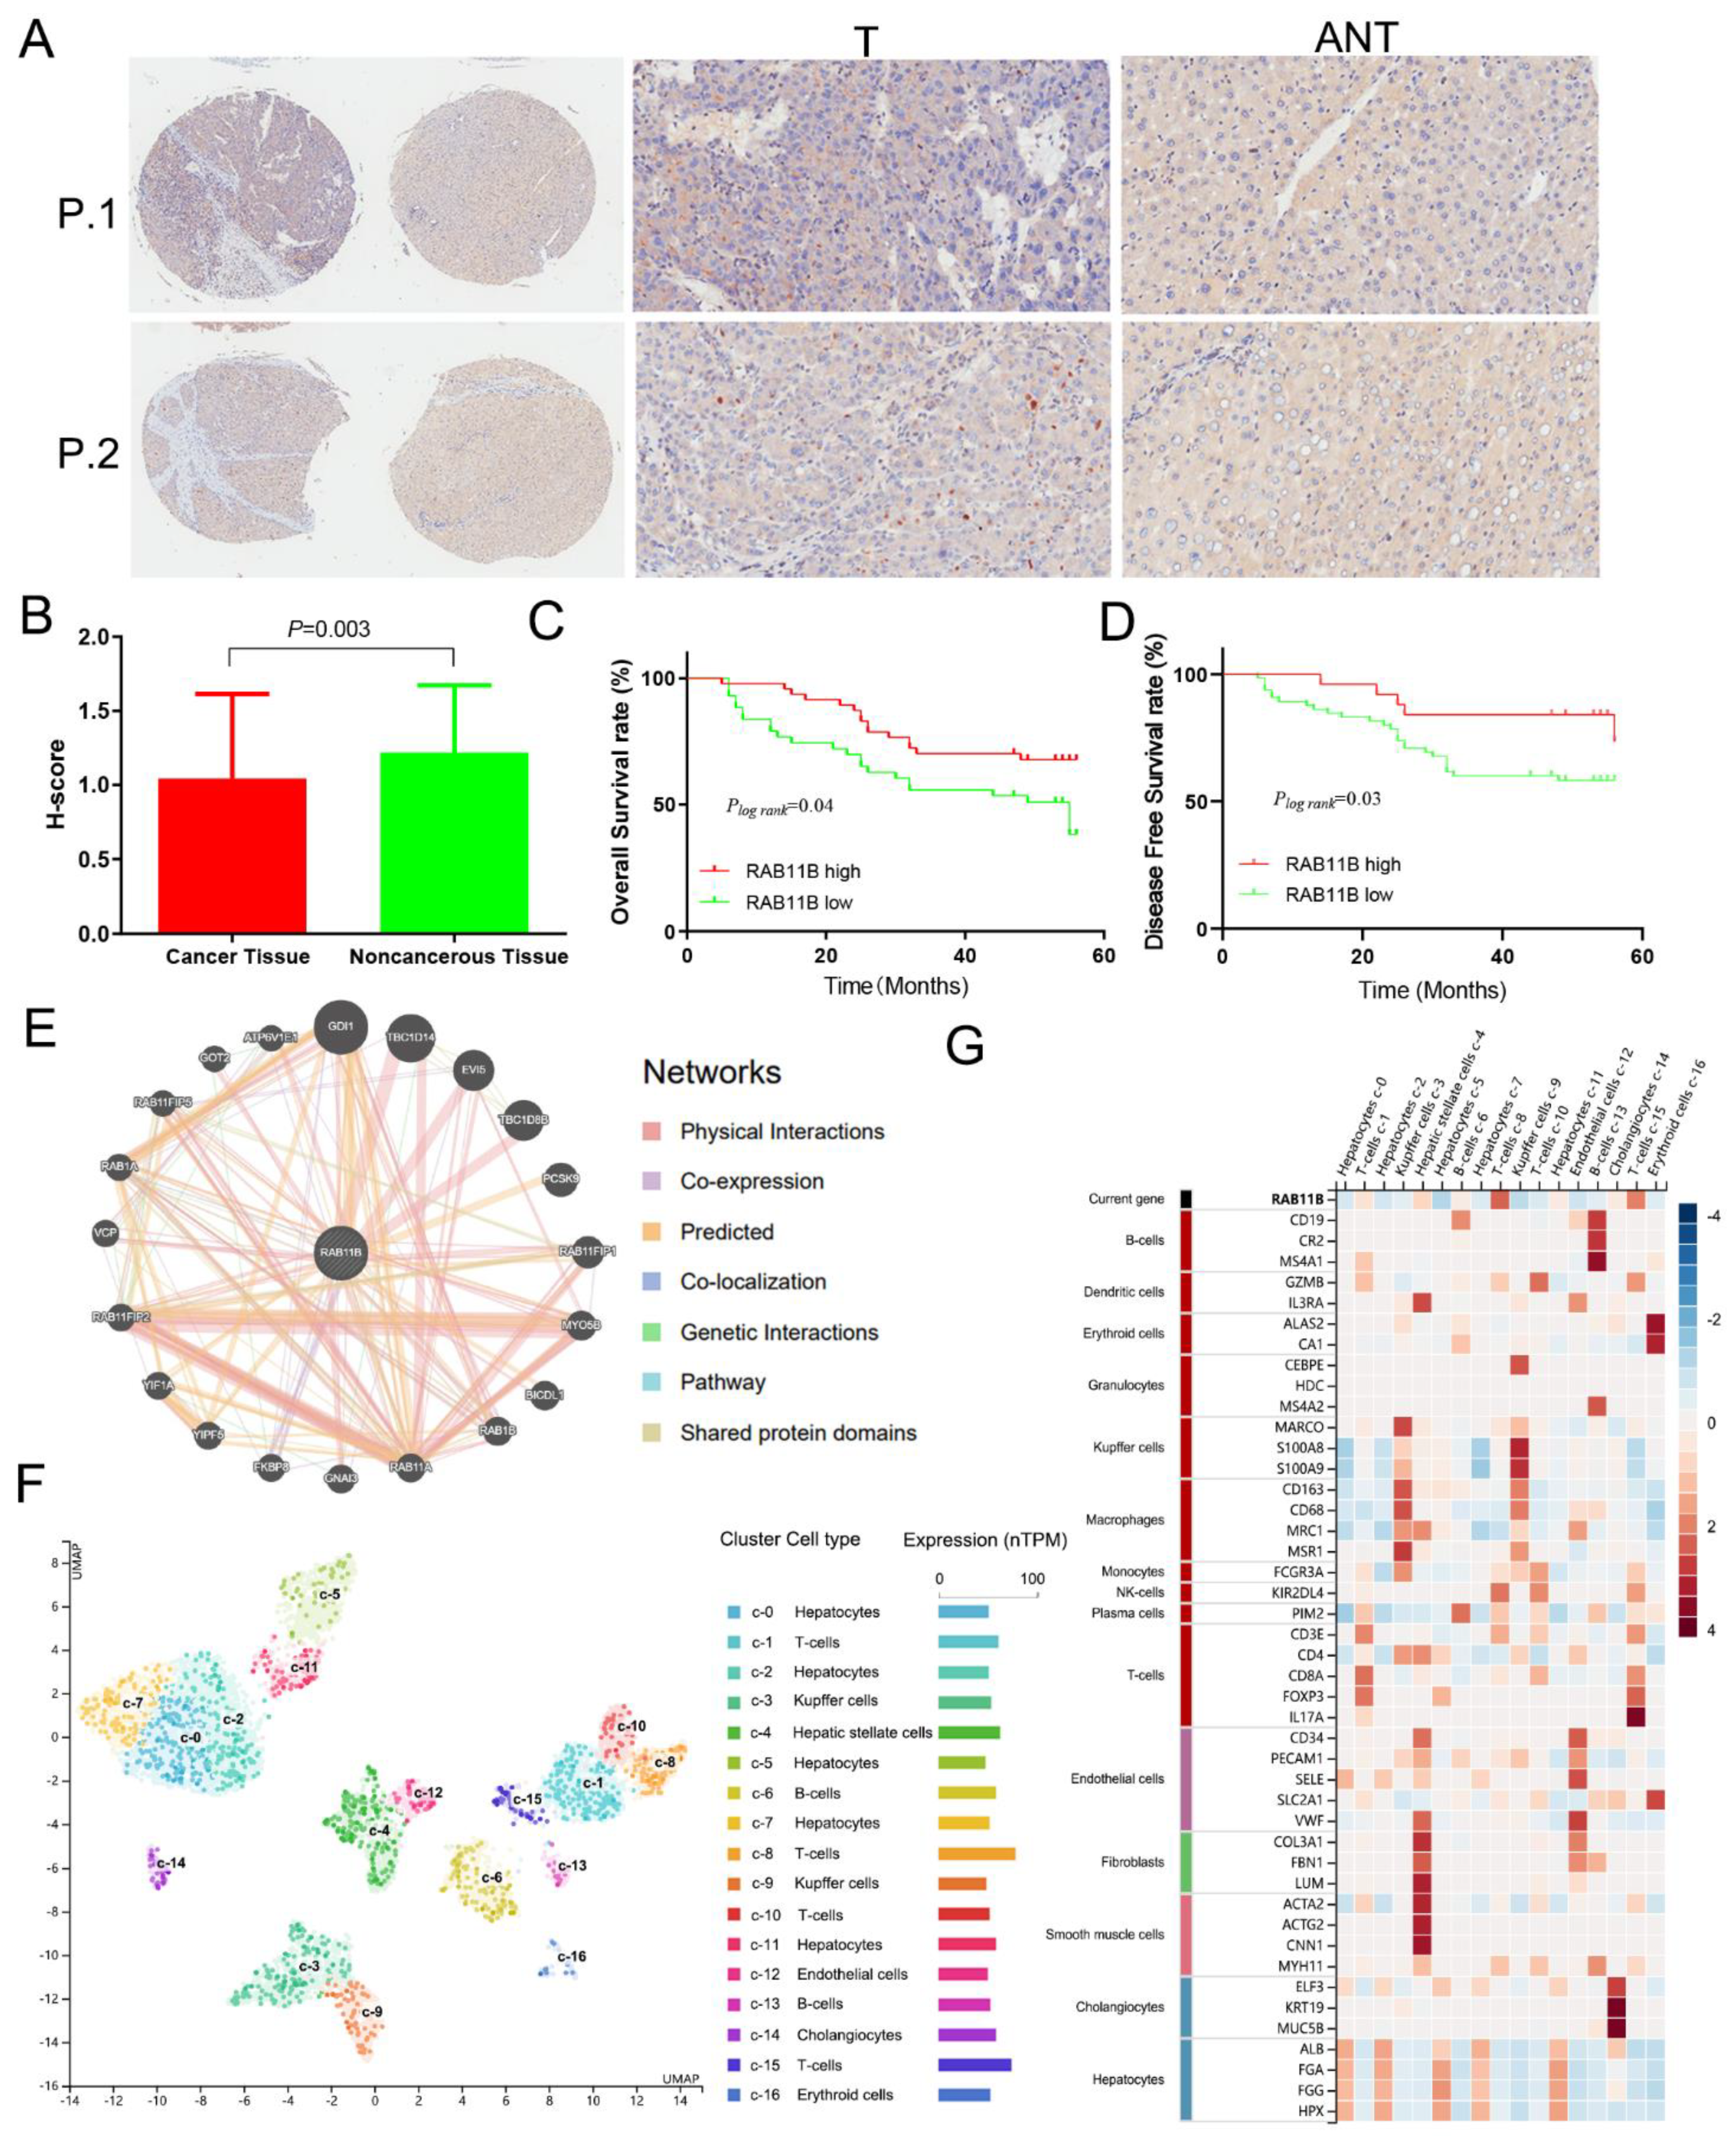
3.5. External Validation of RAB11B Protein Expression and Clinicopathologic Features of HCC Patients

To verify our results at the protein level, the expression of RAB11B in 90 HCC tissue chips was detected using immunochemistry, and immunostaining was mainly located in the cytoplasm of HCC cells. As was shown in Figure 3A,B, based on the scoring criteria of cytoplasmic staining, the RAB11B expression at the protein level was strikingly decreased in HCC tissues compared with corresponding non-cancerous tissues, which is consistent with the predictive results in public databases. Next, we examined the relationship between RAB11B protein expression and clinicopathological characteristics of the 90 HCC patients (Table 4). We found a negative correlation between the RAB11B expression and the pathology grade, that is to say, HCC patients with a higher expression of RAB11B had a lower pathological grade (χ2 = 15.691, p < 0.001). In addition, a higher proportion of patients with TB and GGT normal value was observed in the RAB11B high expression group compared to that of the low expression group (χ2 = 4.107, p = 0.043; χ2 = 3.903, p = 0.048). In the PD-L1 low expression group, there were more HCC patients with an RAB11B-high expression (χ2 = 9.357, p = 0.002), and it showed a distinctly negative correlation between them. However, the remaining clinicopathological factors, including sex, age, clinical stage, TNM stage, recurrence, HBsAg, HBcAb, AntiHCV, ALT, AFP, and CTLA4 did not show any statistical significance. We applied a survival analysis to further assess the prognostic significance of RAB11B in HCC, and the results demonstrate that patients with a higher RAB11B expression showed longer OS and DFS, suggesting that RAB11B might also be a protective factor in the development of HCC (Figure 3C,D).

3.6. RAB11B-Associated PPI Network

A total of 20 proteins that have been confirmed or predicted to interact with RAB11B were screened through the GeneMANIA database analysis, including GDI1, TBC1D14, EVI5, TBC1D8B, PCSK9, RAB11FIP1, MYO5B, BICDL1, RAB1B, RAB11A, and so on (Figure 3E). Different colors of nodes represent different interaction relationships, and physical interactions indicate that the corresponding proteins were connected.

3.7. RAB11B Expression in Different Cells of HCC

As was shown in Figure 3F, single-cell data from HPA was visualized using UMAP. Each color represents a single cell cluster identified after clustering analysis, and each scatter represents a cell, which has been divided into a total of 16 kinds of cell groups in the liver. The results revealed that the mRNA level of RAB11B was higher in T-cells and hepatic stellate cells but was lower in kupffer cells and erythroid cells (Figure 3G). In addition, it disclosed the expression pattern of marker genes in various cell clusters.

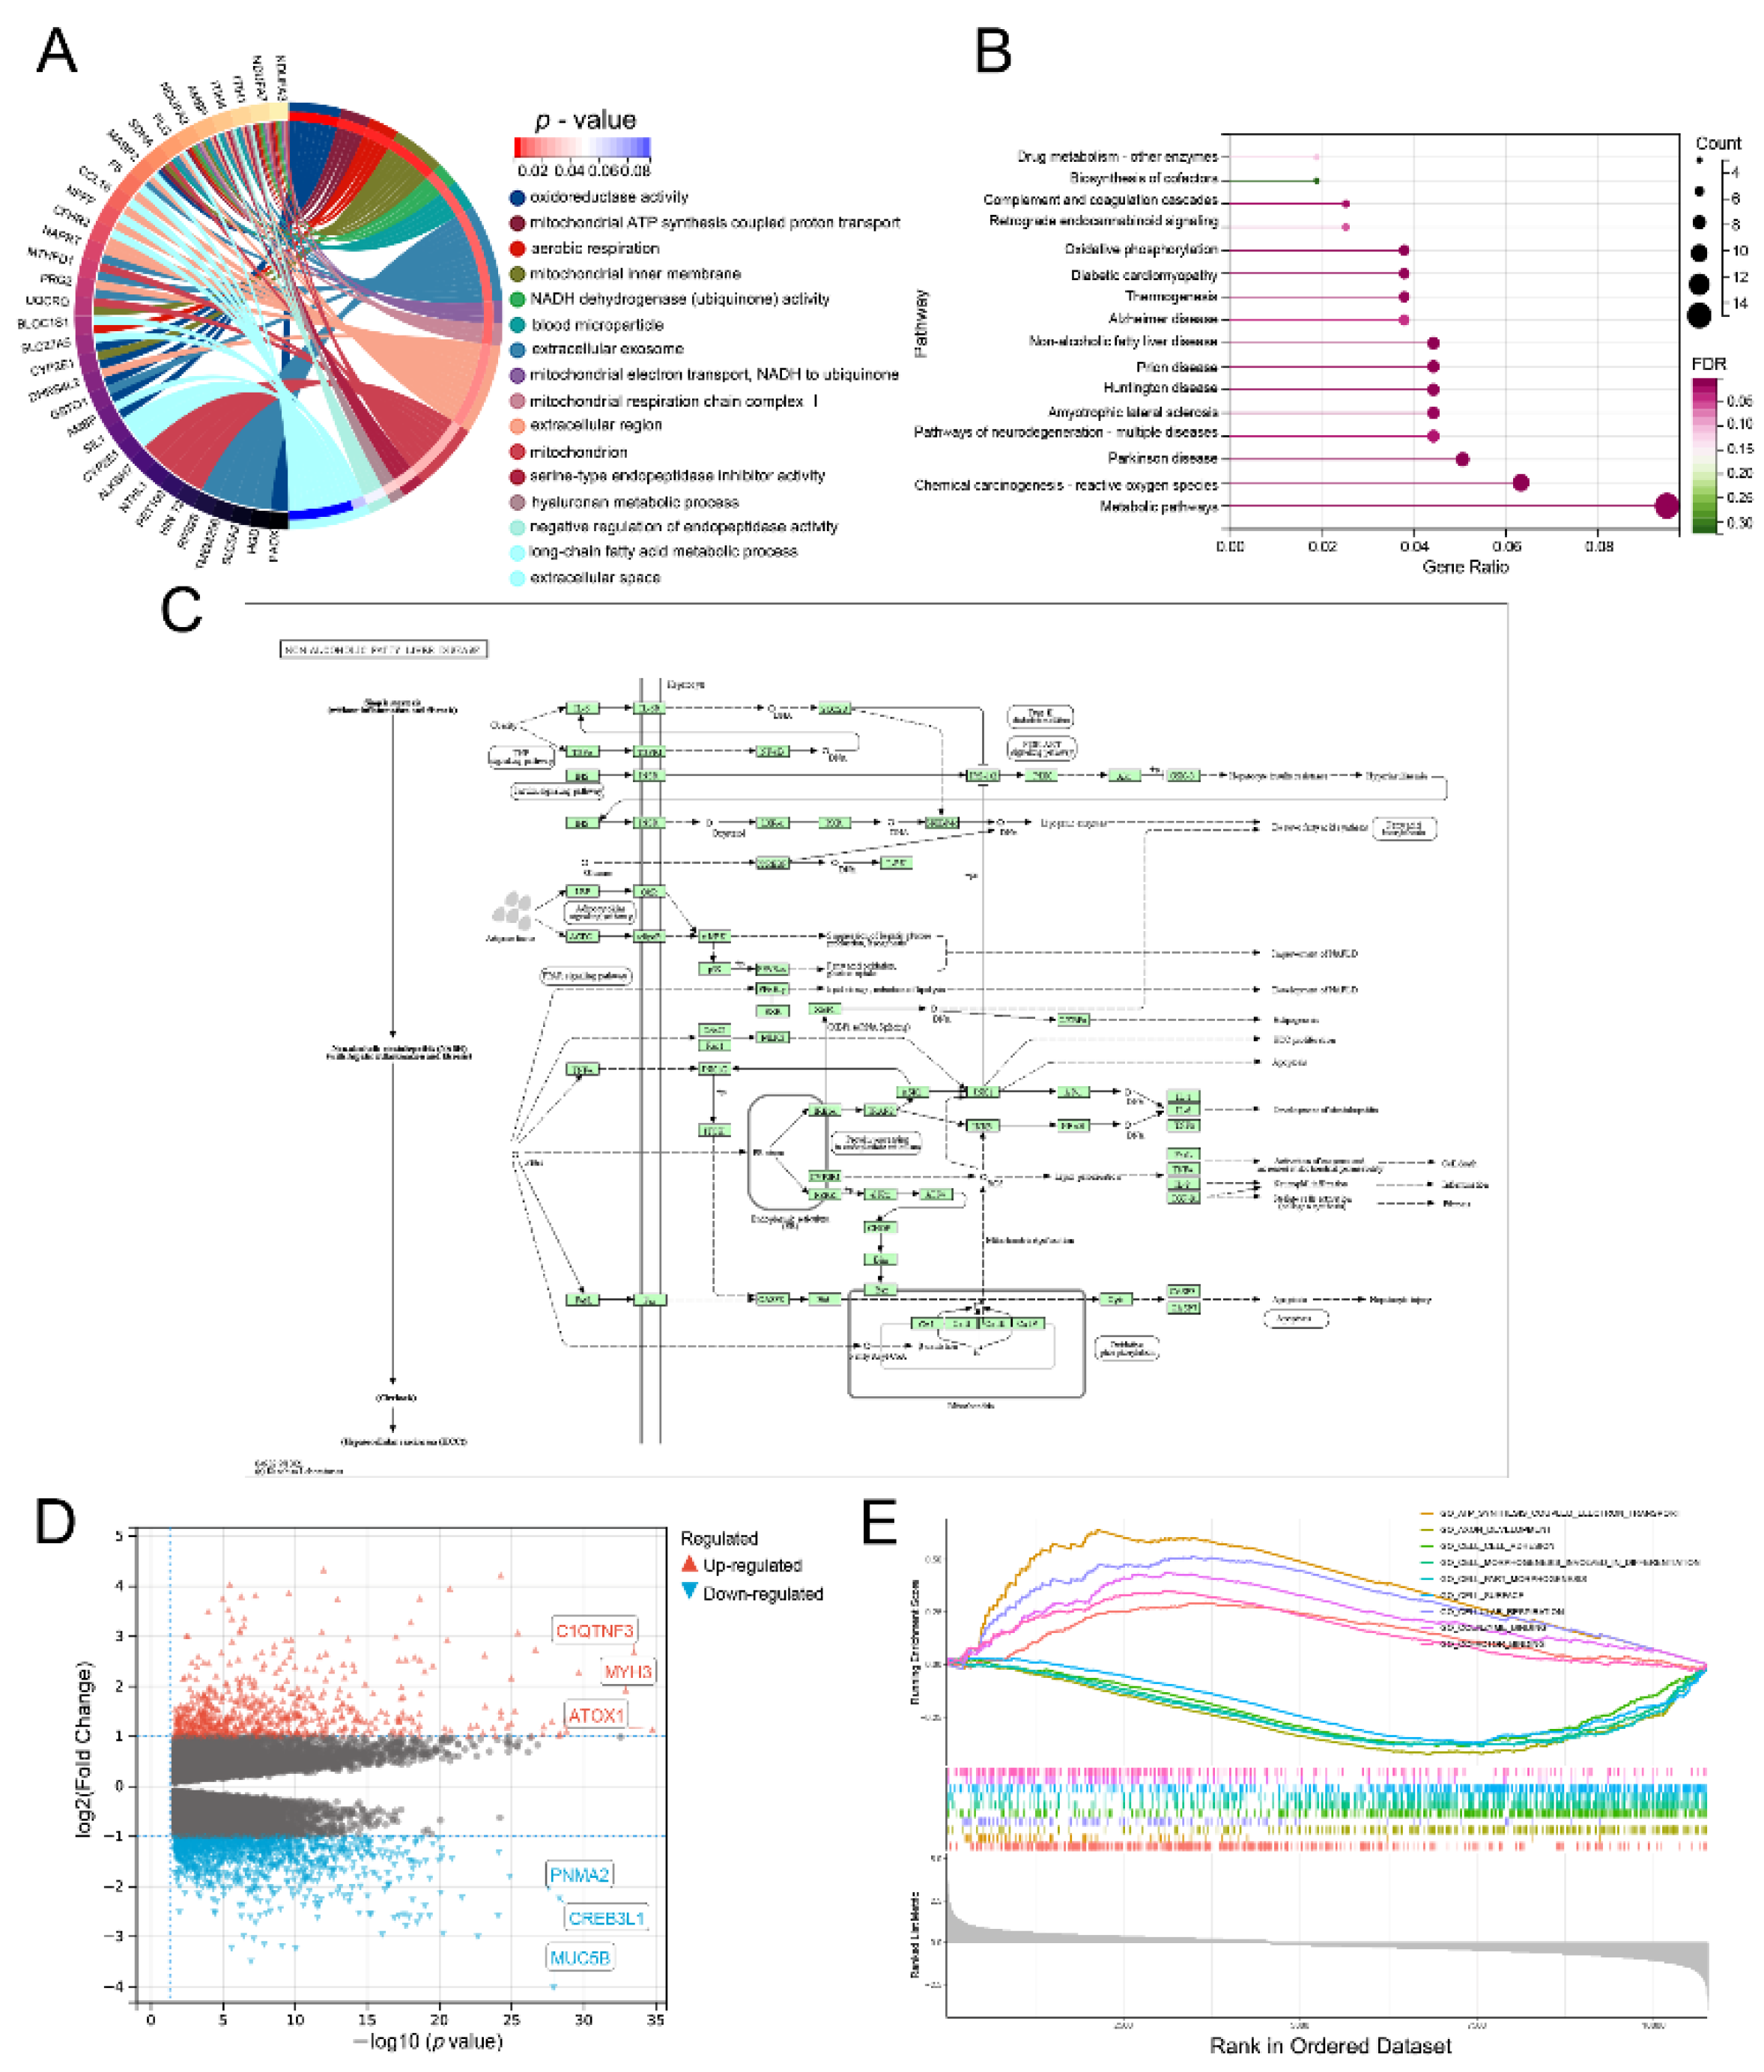
3.8. Lnc-RAB11B-AS1-Related Genes and Functional Enrichment Analysis

We explored the possible biological function of lnc-RAB11B-AS1 in the pathogenesis and progression of HCC. The lnc-RAB11B-AS1 co-expressed genes were submitted to the DAVID for analysis, and a functional annotation table was obtained. As shown in Figure 4A, the results were visualized using a chordal graph with different colors representing the relationships between related genes and various pathways. In GO Biological Processes, the above genes were mainly involved in mitochondrial ATP synthesis-coupled proton transport, aerobic respiration, mitochondrial electron transport, NADH to ubiquinone, hyaluronan metabolic processes, negative regulation of endopeptidase activity, and long-chain fatty acid metabolic processes. In Cellular components, these genes were closely associated with mitochondrial inner membrane, blood microparticles, and extracellular exosomes. Molecular functions were primarily co-regulated with oxidoreductase activity and NADH dehydrogenase (ubiquinone) activity. Additionally, in KEGG analysis, 15 signaling pathways finally showed statistical significance, including in drug metabolism-other enzymes, non-alcoholic fatty liver disease (NAFLD), and oxidative phosphorylation (Figure 4B). The top KEGG enrichment pathway item “NAFLD” is detailed in Figure 4C.

3.9. Lnc-RAB11B-AS1-Related Signaling Pathways Obtained by GSEA

HCC patients were divided into two groups according to the expression of lnc-RAB11B-AS1 and approximately 1721 genes were identified after differential analysis using transcriptional profiles retrieved from TCGA, in which 612 DEGs were upregulated and 1109 were downregulated (adjusted p value < 0.05 and |Log2-FC| > 1). The volcano plot depicted in Figure 4D exhibits DEGs, highlighting three up- and downregulated genes with the smallest p-values. Then we performed GSEA between lnc-RAB11B-AS1 high and low groups. The results showed that ATP synthesis-coupled electron transport, axon development, cell adhesion, cell morphogenesis involved in differentiation, and other pathways related to cell-to-cell interactions were significantly enriched (Figure 4E).

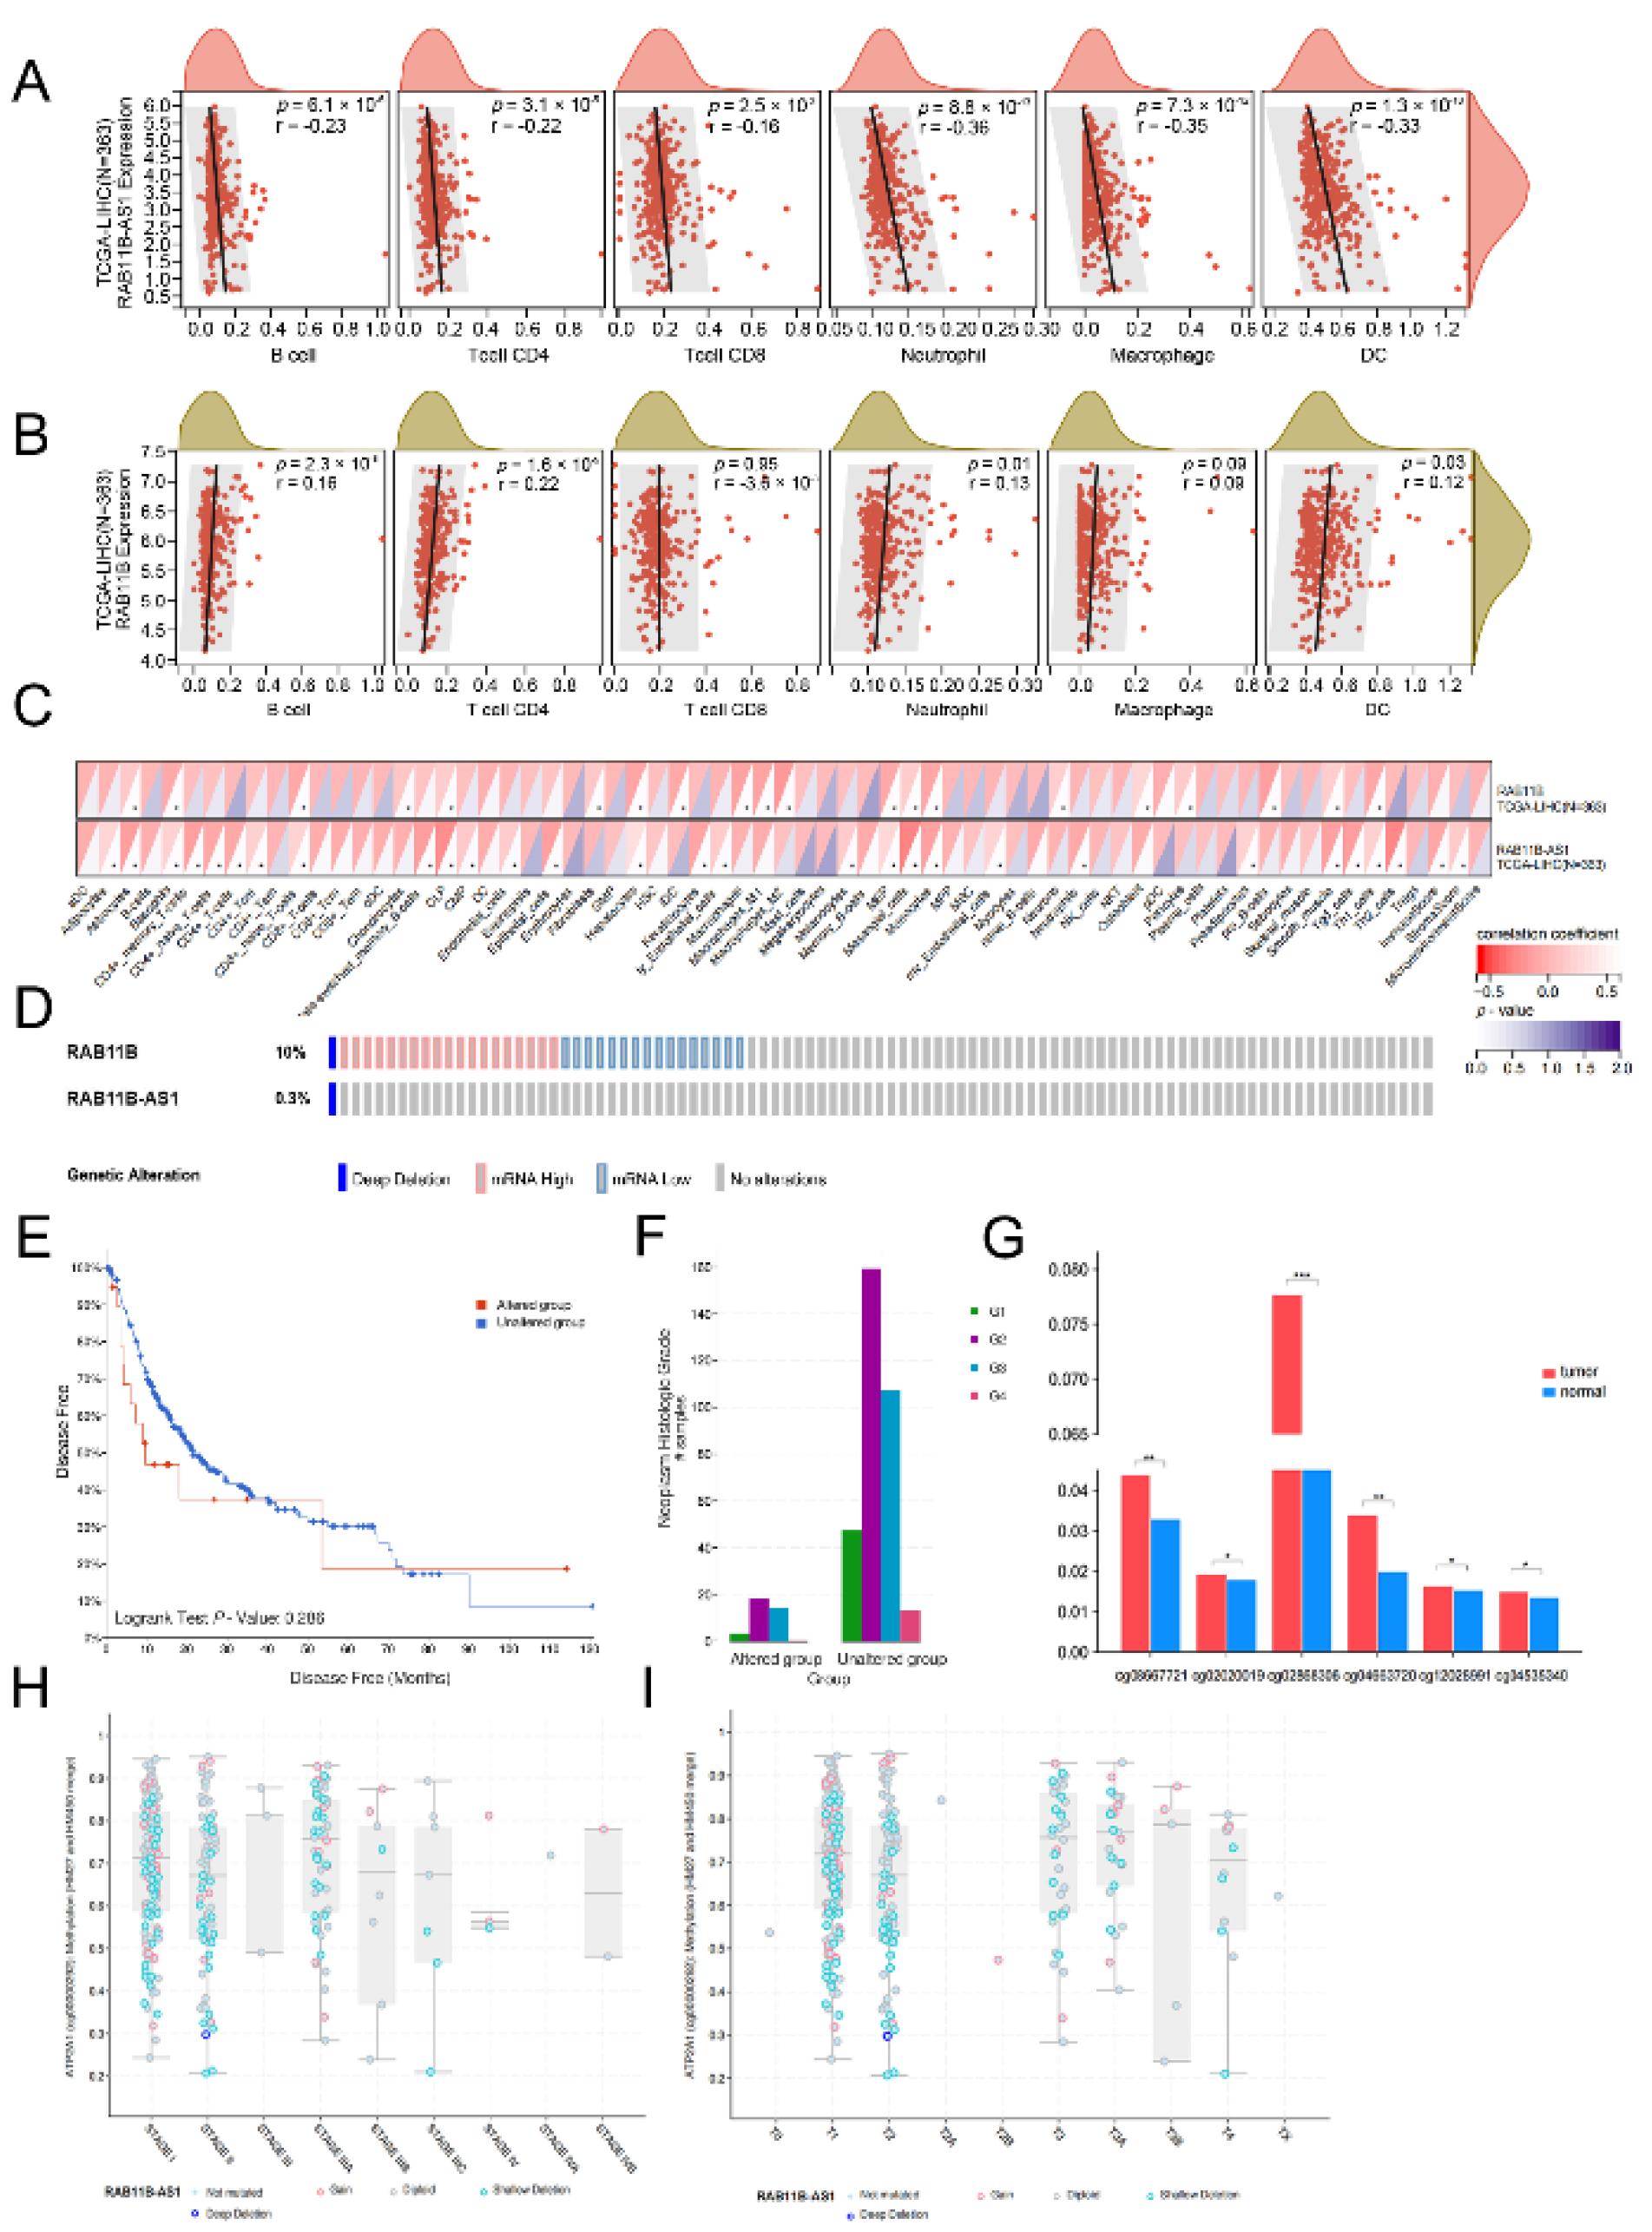
3.10. Correlation Analysis between lnc-RAB11B-AS1 and RAB11B Expression, and Tumor-Infiltrating Immune Cells in HCC

Elucidating the connection between gene expression and immune infiltration will provide new horizons for HCC immunotherapy in the future. As shown in Figure 5A and 5B, the results revealed that lnc-RAB11B-AS1 was clearly negatively correlated with six types of immune cells, including B cells (R = 0.23, p = 6.1 ×10⁻⁶), CD8+ T cells (R = 0.16, p = 2.5 × 10⁻³), CD4+ T cells (R = 0.22, p = 3.1 ×10⁻⁵), macrophages (R = 0.35, p = 7.3 × 10⁻¹²), neutrophils (R = 0.36, p = 8.8 ×10⁻¹³) and dendritic cells (R = 0.33, p = 1.3 × 10⁻¹⁰). Nevertheless, positive relationships were observed between RAB11B and several immune cells. Using the xCell algorithm on Sangerbox online website (http://vip.sangerbox.com/home.html, accessed on 15 July 2022), correlations between the expression levels of two genes and multiple immune cell infiltration scores in HCC are shown in Figure 5C. These data further demonstrated that the potential regulatory mechanism of lnc-RAB11B-AS1 and RAB11B in HCC might be brought into effect by influencing immune cell infiltration.

3.11. Alternation of lnc-RAB11B-AS1 and RAB11B in HCC

A dataset (TCGA, PanCancer Atlas) containing 372 samples with information on genetic alterations was selected for analysis from the cBioPortal database. The results suggested that the incidence of RAB11B mutation was 10% (37/372) while it was only 0.3% in lnc-RAB11B-AS1 (Figure 5D). The DFS of HCC patients with RAB11B gene alteration tended to be lower than that of patients without gene alteration, but it showed a very slight trend toward significance (p = 0.286; Figure 5E). In addition, in the tumor subgroup analysis, the expression level of the mutation was associated with the histological grade in HCC (p = 0.027; Figure 5F). These findings suggested that the reduction in RAB11B mRNA might link to a poor prognosis for HCC but remains to be verified.

3.12. Correlation between mRNA Expression and Methylation of lnc-RAB11B-AS1

We downloaded the methylation signal value matrix of HCC patients from UCSC Xena, and finally obtained the data of 14 methylation sites located in the promoter region of lnc-RAB11B-AS1. Then, six methylation sites with statistical significance were screened through a comparison between 50 pairs of HCC tissues and normal tissues, including cg08667721, cg02020019, cg02868306, cg04663720, cg12028991, and cg04535340. As shown in Figure 5G, the methylation levels of these methylation regions in the tumor group were significantly higher than those in the normal group. In general, the hypermethylation of the promoter region is negatively correlated with gene expression, and the hypermethylation of the lnc-RAB11B-AS1 promoter region may lead to the reduction of transcriptional activity, resulting in its decreased expression in HCC. Moreover, we examined the relationship between lnc-RAB11B-AS1 methylation level and clinical stage in HCC through the “plots” section of the ciBioPortal database (Figure 5H,I). The methylation level was found to be higher in advanced clinical stages, which was consistent with our previous findings that lnc-RAB11B-AS1 expression was negatively correlated with clinical stage.

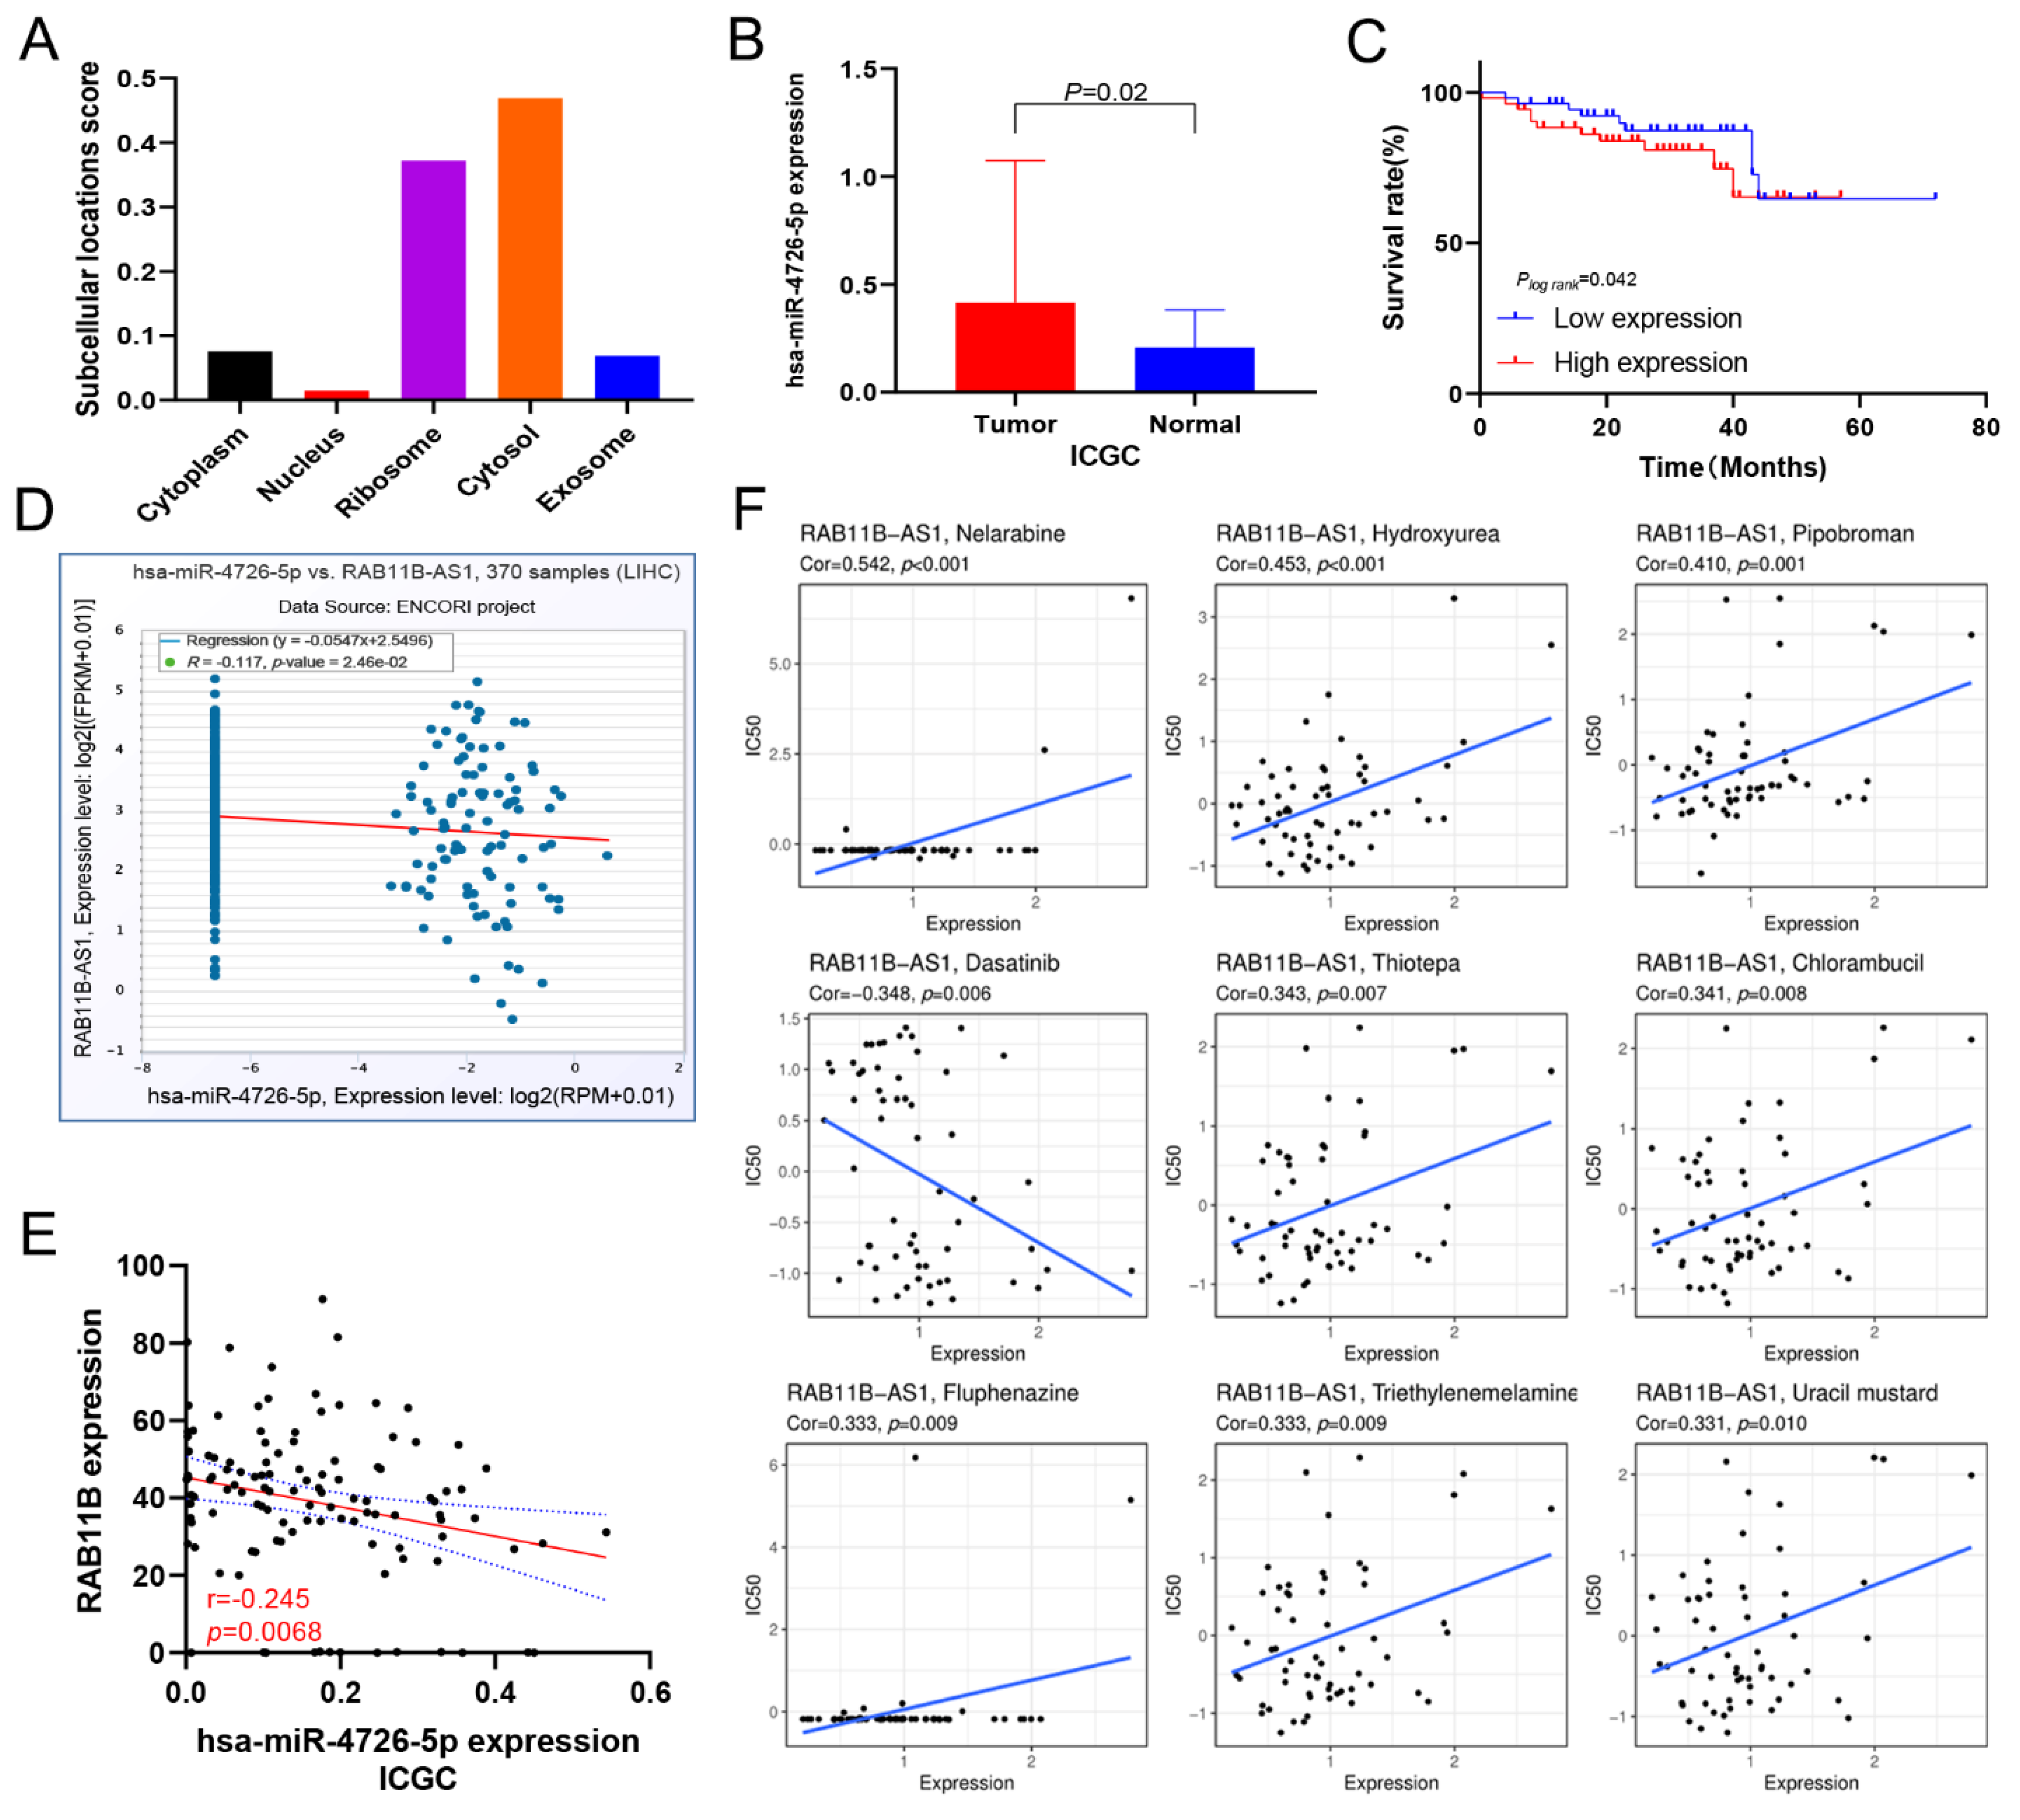
3.13. Prediction of lnc-RAB11B-AS1 and RAB11B Targeted miRNAs

The Lnclocator database (http://www.csbio.sjtu.edu.cn/bioinf/lncLocator/, accessed on 3 August 2022) [34] was used to predict the subcellular localization of lnc-RAB11B-AS1 and we found it was mainly localized in the cytosol (Figure 6A). Numerous studies have demonstrated that lncRNAs can affect the post-transcriptional translation process of downstream target genes by interacting with miRNAs. Therefore, we sought to establish a ceRNA network to elucidate the underlying mechanism by which lnc-RAB11B-AS1 regulates RAB11B expression, thus affecting the initiation and development of HCC. Using miRWalk and ENCORI databases, we further performed a prediction of miRNAs targeting lnc-RAB11B-AS1 and RAB11B. The results showed that these two genes had five miRNAs identities in common: hsa-miR-4640-5p, hsa-miR-3918, hsa-miR-30e-5p, hsa-miR-30a-5p, and hsa-miR-4726-5p. Because of the limited information on these miRNAs in TCGA and GEO, we continued to perform data mining in the ICGC database. Hsa-miR-4726-5p expression in HCC tissues was observed to be strikingly higher than that in normal tissues, while the expression status of other miRNAs was the opposite or was not statistically significant (Figure 6B). The survival curve detailed in Figure 6C revealed that HCC patients with high expression of hsa-miR-4726-5p had a worse prognosis, suggesting that it might be a potential hazard factor for HCC. Moreover, we found a negative relationship between hsa-miR-4726-5p and lnc-RAB11B-AS1 based on the ENCORI database (Figure 6D). Furthermore, hsa-miR-4726-5p was negatively correlated with RAB11B (Figure 6E). To summarize, we made an inference that lnc-RAB11B-AS1 functions as an antioncogene that positively regulates its adjacent gene RAB11B by sponging hsa-miR-4726-5p in HCC.

3.14. Correlation between lnc-RAB11B-AS1 Expression and Drug Sensitivity

To ensure the reliability of the analysis results, we selected drugs that have been clinically tested and FDA-approved for drug sensitivity analysis. The data revealed high-to-weak positive connections between the expression of lnc-RAB11B-AS1 and nelarabine, hydroxyurea, pipobroman, thiotepa, chlorambucil, fluphenazine, triethylenemelamine, and uracil mustard. However, the sensitivity to dasatinib gradually increased when lnc-RAB11B-AS1 expression was elevated (Figure 6F). Considering these findings, lnc-RAB11B-AS1 might be a novel marker for targeted therapies in HCC.

4. Discussion

Thus far, the clinical treatment of HCC has faced a huge bottleneck. Most patients have lost the opportunity for surgical treatment at the time of diagnosis, and chemotherapy remains the main treatment for patients with advanced HCC. With the technological advances in high-throughput sequencing, increasing numbers of functional lncRNAs have been gradually discovered in focused areas [35]. Numerous evidence indicates that lncRNAs are aberrantly expressed in HCC and can be involved in the regulation of initiation, development, and treatment response of HCC. Zhang et al. reported that lnc-SBF2-AS1 was highly expressed in HCC and could promote HCC metastasis by participating in the regulation of the EMY signaling pathway [36], while Yan et al. confirmed that stress-responsive lncRNA ROR knockdown enhanced chemotherapy-induced apoptosis and cytotoxicity [37]. These data all revealed that lncRNAs can not only directly regulate the response of HCC cells to treatment, but also affect the occurrence of HCC by participating in crucial signaling pathways. Lnc-RAB11B-AS1 is a member of the RAS oncogene family and was found to be dysregulated in several tumors, affecting their biological progress and even resistance to therapeutic agents [38]. As an oncogene, Niu and colleagues demonstrated that lnc-RAB11B-AS1 stimulated the development and growth of breast cancer cells in vitro, as well as tumor angiogenesis and distant metastasis of breast cancer, without affecting primary tumor growth in mice [39]. Li and colleagues found that lnc-RAB11B-AS1 is overexpressed in lung cancer tissues and is associated with poor prognosis in lung cancer [13]. Feng et al. detected the expression of lnc-RAB11B-AS1 in 83 gastric cancer tissues and normal tissues using qRT-PCR and found that upregulated lnc-RAB11B-AS1 in gastric cancer tissues was related to higher stage, lymph node metastasis, distant metastasis, and degree of tumor differentiation. Mechanistically, lnc-RAB11B-AS1 may inhibit the proliferation, migration and invasion of gastric carcinoma cells by up-regulating miR-628-3p and increasing the sensitivity to cisplatin [40]. Meanwhile, the carcinostatic action of lnc-RAB11B-AS1 was also investigated in colorectal cancer, endometrial cancer, and osteosarcoma by various experiments [17,41]. The association between lnc-RAB11B-AS1 and HCC progression remains unclear (and relevant studies on it have not yet resolved the matter). More importantly, it has been reported that lnc-RAB11B-AS1 plays a role in osteosarcoma and lung cancer by regulating the expression of its natural antisense transcript RAB11B. Hence, we sought to further explore the regulatory relationship between lnc-RAB11B-AS1 and RAB11B in HCC.
Using TCGA and GEO databases in this study, we found that the expression levels of lnc-RAB11B-AS1 and its sense-cognate gene RAB11B were decreased when compared with paired normal tissues in HCC. Then, an immunohistochemical assay was performed to validate the downregulation of RAB11B protein in HCC tissues. A highly positive relationship was observed between the expression of lnc-RAB11B-AS1 and RAB11B. According to a former study, visualization techniques and descriptive indicators can be used to reflect how survival differs with disease subtype, treatment status, and treatment practice patterns [42]. Through screening the clinicopathological information in the database and referring to relevant literature, we first differentiated HCC patients with different treatment statuses in TCGA, among which 249 were untreated, 18 were treated, 90 were recurrent, and 22 were unreported cases. Subsequently, median survival differences between patients with the above three known statuses were assessed. We found that the overall median survival times of untreated, treated, and recurrent HCC patients were 1.43 (IQR 0.05–2.01) years, 1.48 (IQR 0.10–2.43) years, and 2.43 (IQR 1.02–3.48) years, respectively. While in the ICGC database, we only obtained information on whether these HCC patients were treated and the corresponding treatment patterns (177 were untreated and 63 were treated with chemotherapy, surgery or other therapies). We found that the overall median survival of untreated patients was 2.05 years (IQR 1.39–3.21) and that of treated patients was 2.31 years (IQR 1.56–2.88). Patients diagnosed with recurrent HCC experienced longer survival times than untreated HCC patients, consistent with our hypothesis. Unfortunately, for the GSE144269 and GSE84402 dataset, even after reviewing the original text carefully, we have no information on the treatment status of HCC patients.
A correlation analysis of clinicopathological factors revealed that lnc-RAB11B-AS1 expression was markedly associated with histological grade, clinical stage, AFP, and T-Bil of HCC patients. Our experimental data disclosed a negative correlation between RAB11B expression and pathology grade, T-Bil, GGT, and PD-L1. T-Bil and GGT are both important indicators of liver function in patients and are combined with other objective parameters in clinical diagnosis, such as ALBI score, which is considered a gold standard for the diagnosis of HCC patients [43,44]. Abnormally upregulated T-Bil or GGT is often associated with the occurrence of hepatitis, obstructive jaundice, or cirrhosis. Therefore, lower RAB11B expression in HCC patients may indicate higher values of the above two indicators, which is closely related to the severity of the disease. Additionally, PD-1/PD-L1 is a hot topic in immunotherapy. PD-L1 is the main ligand of PD-1, which is expressed in various cancer cells and exhibits an inhibitory role in the anti-tumor effect of effector T cells, including in gastric, breast, and liver cancer [45]. A recent study reported that the expression of lnc-MIAT was positively correlated with the expression of immune checkpoint molecules in HCC, including PD-1, PD-L1, and CTLA4, influencing the immune microenvironment of HCC [46]. These studies demonstrated the pivotal role of lncRNAs in the tumor microenvironment. In contrast to the functions of the above genes, we found high RAB11B expression may lead to the downregulation of PD-L1, thus inhibiting the progression of HCC. The results of the survival analysis showed that the median survival time of patients with low expression of lnc-RAB11B-AS1 was approximately 45 months, which was less than that identified for patients with high lnc-RAB11B-AS1 expression, at 70 months. Additionally, elevated lnc-RAB11B-AS1 was demonstrated to be a protective factor for HCC in the multivariate Cox regression analysis. The above findings suggest that a low expression of lnc-RAB11B-AS1 indicates an adverse prognosis for HCC and might be a potential molecular marker for prognosis prediction of HCC patients.
Next, we investigated the potential biological function of lnc-RAB11B-AS1 in HCC. It has been shown to exert a carcinostatic action by affecting multiple signaling pathways. GO and KEGG pathway analyses revealed multiple signaling pathways, such as oxidoreductase activity, drug metabolism-other enzymes, NAFLD, and oxidative phosphorylation. NAFLD is one of the most serious risk factors of HCC, while lncRNAs are reported to play a crucial role in NAFLD. Park JG et al. reported that the degree of hepatic steatosis in NAFLD patients was inversely related to the level of lncRNA LeXis in liver tissues [47]. Critical items were identified in GSEA, such as axon development, cell adhesion, and cell morphogenesis. Kong et al. supported the view that the cytoskeletal proteins deregulated by hepatitis B virus X protein (HBx) played a role in cell morphogenesis, adhesion, migration, and proliferation [48]. It is possible that lnc-RAB11B-AS1 downregulation promotes HCC by similar mechanisms.
Immune-infiltrating cells are an important part of the tumor microenvironment. Studies provided evidence that changes in the number of immune infiltrating cells in tumors can positively or negatively affect the prognosis and immunotherapy efficacy of diseases [49]. The change in lnc-RAB11B-AS1 expression was found to be negatively correlated with various immune cells, implying that lnc-RAB11B-AS1 might influence the interaction between immune lymphocytes and malignant tumor cells, and hence regulating the progression of HCC. It appeared that lncRNAs could also participate in the maturation and differentiation of tumor-infiltrating lymphocytes through the regulation of cytokines and participate in the corresponding signaling process of immune regulation, thus affecting the tumor immune function of the organism [50].
DNA sequences can be modified by lncRNAs through changes in chromatin structure, DNA conformation, DNA stability, and gene expression regulation, affecting the occurrence and development of various cancers [51]. Wang et al. also successfully verified that differentially expressed lncRNAs in cancer are modulated by DNA methylation levels using epigenetic data [52]. We further explored the underlying mechanism of lnc-RAB11B-AS1 downregulation in HCC tissues, and the results indicated that DNA hypermethylation in the promoter region of lnc-RAB11B-AS1 leads to its reduced expression in HCC. Furthermore, the methylation level increased with HCC clinical stage and histological grade according to the ciBioPortal database, which was consistent with our previous analysis showing the decreased expression of lnc-RAB11B-AS1 in the advanced stages of HCC.
To our knowledge, lncRNAs regulate signaling pathways and transcription factors through four major modes of action: signal, decoy, guide, and scaffold, thus affecting the biological behavior of cells. The most common mechanism of cytoplasmic lncRNAs is mainly focused on binding miRNAs to act as molecular sponges, interfering with the effects of these miRNAs on target genes. Zhang et al. showed that KCNQ1OT1, the overlapping transcript 1 of lnc-KCNQ1, acted as a competing endogenous RNA for miR-506 and promoted PD-L1 expression in HCC [53]. Wang et al. also confirmed that lncRNA MCM3AP-AS1 promoted the growth of HCC by targeting the miR-194-5p/FOXA1 axis [54]. According to the prediction of public databases, lnc-RAB11B-AS1 is mainly located in the cytosol and exhibits a positive regulatory relationship with RAB11B in HCC, which is in agreement with the results of previous research showing that RAB11B is positively correlated with lnc-RAB11B-AS1 in lung cancer. Therefore, we attempted to establish an lnc-RAB11B-AS1-miRNA-RAB11B axis to test the hypothesis that lnc-RAB11B-AS1 acts as a ceRNA to regulate downstream mRNA expression. Finally, we have clarified the expression of hsa-miR-4726-5p in HCC and its relationships with the two genes and predicted that lnc-RAB11B-AS1 acts as a ceRNA by sponging miR-4726-5p to prevent the progression of HCC via up-regulating RAB11B mRNA. Further experiments are planned for the next step. Moreover, individual characteristics and treatment can be combined to achieve better therapeutic effects. We established a direct link between lnc-RAB11B-AS1 expression and cancer cell sensitivity to chemotherapy, indicating that low lnc-RAB11B-AS1 expression might be sensitive to multiple chemotherapeutic drugs, such as chlorambucil, hydroxyurea, and thiotepa.

5. Conclusions

In conclusion, this study revealed that low expression of lnc-RAB11B-AS1 was a factor affecting the prognosis of HCC patients. Lnc-RAB11B-AS1 has also shown promise as a potential molecular marker in the prevention and treatment of HCC.

Author Contributions

Conceptualization; investigation; original draft, D.W. (Di Wu) and D.W. (Dedong Wang); methodology, X.H., P.Q., J.C. and B.L.; data curation, X.H., J.C. and L.Z.; review and editing D.W. (Di Wu) and D.W. (Dedong Wang). All authors have read and agreed to the published version of the manuscript.

Funding

This work was funded by the Natural Science Foundation of China (81803325), Natural Science Foundation of Guangdong (2021A1515011175), Guangzhou Science and Technology Project (202102080126), The Key Project of Medicine Discipline of Guangzhou (2021-2023-12), Basic Research Project of Key Laboratory of Guangzhou (202102100001).

Institutional Review Board Statement

The study was conducted in accordance with the Declaration of Helsinki, and approved by the ethics committee of Shanghai Outdo Biotech Co., Ltd (protocol code SHYJS-CP-1901001 on 11 January 2019).

Informed Consent Statement

Informed consent was obtained from all subjects involved in the study by the ethics committee of Shanghai Outdo Biotech Co., Ltd for the HCC tissue microarray.

Data Availability Statement

The data that support the findings of this study are openly available in online databases mentioned in the manuscript, and also available from the corresponding author upon reasonable request.

Conflicts of Interest

The authors declare no conflict of interest.

References

  1. Cheng, J.; Wei, D.; Ji, Y.; Chen, L.; Yang, L.; Li, G.; Wu, L.; Hou, T.; Xie, L.; Ding, G.; et al. Integrative analysis of DNA methylation and gene expression reveals hepatocellular carcinoma-specific diagnostic biomarkers. Genome Med. 2018, 10, 42. [Google Scholar] [CrossRef] [PubMed]
  2. Sung, H.; Ferlay, J.; Siegel, R.L.; Laversanne, M.; Soerjomataram, I.; Jemal, A.; Bray, F. Global cancer statistics 2020: Globocan estimates of incidence and mortality worldwide for 36 cancers in 185 countries. CA Cancer J. Clin. 2021, 71, 209–249. [Google Scholar] [CrossRef] [PubMed]
  3. Xie, D.Y.; Ren, Z.G.; Zhou, J.; Fan, J.; Gao, Q. 2019 chinese clinical guidelines for the management of hepatocellular carcinoma: Updates and insights. Hepatobiliary Surg. Nutr. 2020, 9, 452–463. [Google Scholar] [CrossRef] [PubMed]
  4. Helmberger, T. Guideline on hepatocellular carcinoma. Radiologe 2022, 62, 197–199. [Google Scholar] [CrossRef] [PubMed]
  5. Park, I.Y.; Sohn, B.H.; Yu, E.; Suh, D.J.; Chung, Y.H.; Lee, J.H.; Surzycki, S.J.; Lee, Y.I. Aberrant epigenetic modifications in hepatocarcinogenesis induced by hepatitis b virus X protein. Gastroenterology 2007, 132, 1476–1494. [Google Scholar] [CrossRef]
  6. Chen, Z.; Xie, H.; Hu, M.; Huang, T.; Hu, Y.; Sang, N.; Zhao, Y. Recent progress in treatment of hepatocellular carcinoma. Am. J. Cancer Res. 2020, 10, 2993–3036. [Google Scholar]
  7. Chowdhary, A.; Satagopam, V.; Schneider, R. Long non-coding RNAs: Mechanisms, experimental, and computational approaches in identification, characterization, and their biomarker potential in cancer. Front. Genet. 2021, 12, 649619. [Google Scholar] [CrossRef]
  8. Yao, W.; Du, X.; Zhang, J.; Wang, Y.; Wang, M.; Pan, Z.; Li, Q. SMAD4-induced knockdown of the antisense long noncoding Rna BRE-AS contributes to granulosa cell apoptosis. Mol. Ther. Nucleic Acids 2021, 25, 251–263. [Google Scholar] [CrossRef]
  9. Yang, T.; Chen, W.C.; Shi, P.C.; Liu, M.R.; Jiang, T.; Song, H.; Wang, J.Q.; Fan, R.Z.; Pei, D.S.; Song, J. Long noncoding RNA MAPKAPK5-as1 promotes colorectal cancer progression by cis-regulating the nearby gene MK5 and acting as a let-7f-1-3p sponge. J. Exp. Clin. Cancer Res. CR 2020, 39, 139. [Google Scholar] [CrossRef]
  10. Pfeffer, S.R. Rab gtpases: Master regulators that establish the secretory and endocytic pathways. Mol. Biol. Cell 2017, 28, 712–715. [Google Scholar] [CrossRef]
  11. Homma, Y.; Hiragi, S.; Fukuda, M. Rab family of small gtpases: An updated view on their regulation and functions. FEBS J. 2021, 288, 36–55. [Google Scholar] [CrossRef] [PubMed]
  12. Bhuin, T.; Roy, J.K. Rab11 in disease progression. Int. J. Mol. Cell. Med. 2015, 4, 1–8. [Google Scholar] [PubMed]
  13. Li, T.; Wu, D.; Liu, Q.; Chen, J.; Zhao, H.; Zhang, L.; Xie, C.; Zhu, W.; Chen, Z.; Zhou, Y. Upregulation of long noncoding RNA RAB11B-AS1 promotes tumor metastasis and predicts poor prognosis in lung cancer. Ann. Transl. Med. 2020, 8, 582. [Google Scholar] [CrossRef] [PubMed]
  14. Dong, Q.; Fu, L.; Zhao, Y.; Du, Y.; Li, Q.; Qiu, X.; Wang, E. RAB11A promotes proliferation and invasion through regulation of yap in non-small cell lung cancer. Oncotarget 2017, 8, 27800–27811. [Google Scholar] [CrossRef] [PubMed] [Green Version]
  15. Dong, W.; Qin, G.; Shen, R. RAB11-FIP2 promotes the metastasis of gastric cancer cells. Int. J. Cancer 2016, 138, 1680–1688. [Google Scholar] [CrossRef] [Green Version]
  16. Li, Y.; Jia, Q.; Zhang, Q.; Wan, Y. Rab25 upregulation correlates with the proliferation, migration, and invasion of renal cell carcinoma. Biochem. Biophys. Res. Commun. 2015, 458, 745–750. [Google Scholar] [CrossRef]
  17. Chen, Z.; Liu, Z.; Yang, Y.; Zhu, Z.; Liang, R.; Huang, B.; Wu, D.; Yang, L.; Lu, H.; Jin, D.; et al. Long non-coding RNA RAB11B-AS1 prevents osteosarcoma development and progression via its natural antisense transcript rab11b. Oncotarget 2018, 9, 26770–26786. [Google Scholar] [CrossRef] [Green Version]
  18. Gao, G.F.; Parker, J.S.; Reynolds, S.M.; Silva, T.C.; Wang, L.B.; Zhou, W.; Akbani, R.; Bailey, M.; Balu, S.; Berman, B.P.; et al. Before and after: Comparison of legacy and harmonized tcga genomic data commons’ data. Cell Syst. 2019, 9, 24–34.e10. [Google Scholar] [CrossRef] [Green Version]
  19. Barrett, T.; Wilhite, S.E.; Ledoux, P.; Evangelista, C.; Kim, I.F.; Tomashevsky, M.; Marshall, K.A.; Phillippy, K.H.; Sherman, P.M.; Holko, M.; et al. Ncbi geo: Archive for functional genomics data sets--update. Nucleic Acids Res. 2013, 41, D991–D995. [Google Scholar] [CrossRef] [Green Version]
  20. Carrieri, C.; Cimatti, L.; Biagioli, M.; Beugnet, A.; Zucchelli, S.; Fedele, S.; Pesce, E.; Ferrer, I.; Collavin, L.; Santoro, C.; et al. Long non-coding antisense rna controls uchl1 translation through an embedded SINEB2 repeat. Nature 2012, 491, 454–457. [Google Scholar] [CrossRef] [Green Version]
  21. Gupta, R.A.; Shah, N.; Wang, K.C.; Kim, J.; Horlings, H.M.; Wong, D.J.; Tsai, M.C.; Hung, T.; Argani, P.; Rinn, J.L.; et al. Long non-coding RNA hotair reprograms chromatin state to promote cancer metastasis. Nature 2010, 464, 1071–1076. [Google Scholar] [CrossRef]
  22. Warde-Farley, D.; Donaldson, S.L.; Comes, O.; Zuberi, K.; Badrawi, R.; Chao, P.; Franz, M.; Grouios, C.; Kazi, F.; Lopes, C.T.; et al. The genemania prediction server: Biological network integration for gene prioritization and predicting gene function. Nucleic Acids Res. 2010, 38, W214–W220. [Google Scholar] [CrossRef] [Green Version]
  23. Asplund, A.; Edqvist, P.H.; Schwenk, J.M.; Pontén, F. Antibodies for profiling the human proteome-the human protein atlas as a resource for cancer research. Proteomics 2012, 12, 2067–2077. [Google Scholar] [CrossRef]
  24. Sherman, B.T.; Hao, M.; Qiu, J.; Jiao, X.; Baseler, M.W.; Lane, H.C.; Imamichi, T.; Chang, W. David: A web server for functional enrichment analysis and functional annotation of gene lists (2021 update). Nucleic Acids Res. 2022, 50, W216–W221. [Google Scholar] [CrossRef]
  25. Tang, Z.; Li, C.; Kang, B.; Gao, G.; Li, C.; Zhang, Z. Gepia: A web server for cancer and normal gene expression profiling and interactive analyses. Nucleic Acids Res. 2017, 45, W98–W102. [Google Scholar] [CrossRef] [Green Version]
  26. Li, T.; Fan, J.; Wang, B.; Traugh, N.; Chen, Q.; Liu, J.S.; Li, B.; Liu, X.S. Timer: A web server for comprehensive analysis of tumor-infiltrating immune cells. Cancer Res. 2017, 77, e108–e110. [Google Scholar] [CrossRef] [Green Version]
  27. Gao, J.; Aksoy, B.A.; Dogrusoz, U.; Dresdner, G.; Gross, B.; Sumer, S.O.; Sun, Y.; Jacobsen, A.; Sinha, R.; Larsson, E. Integrative analysis of complex cancer genomics and clinical profiles using the cbioportal. Sci. Signal. 2013, 6, l1. [Google Scholar] [CrossRef] [Green Version]
  28. Goldman, M.J.; Craft, B.; Hastie, M.; Repečka, K.; McDade, F.; Kamath, A.; Banerjee, A.; Luo, Y.; Rogers, D.; Brooks, A.N. Visualizing and interpreting cancer genomics data via the xena platform. Nat. Biotechnol. 2020, 38, 675–678. [Google Scholar] [CrossRef]
  29. Reinhold, W.C.; Sunshine, M.; Liu, H.; Varma, S.; Kohn, K.W.; Morris, J.; Doroshow, J.; Pommier, Y. Cellminer: A web-based suite of genomic and pharmacologic tools to explore transcript and drug patterns in the NCI-60 cell line set. Cancer Res. 2012, 72, 3499–3511. [Google Scholar] [CrossRef] [Green Version]
  30. Sticht, C.; De La Torre, C.; Parveen, A.; Gretz, N. Mirwalk: An online resource for prediction of microRNA binding sites. PLoS ONE 2018, 13, e0206239. [Google Scholar] [CrossRef] [PubMed]
  31. Li, J.H.; Liu, S.; Zhou, H.; Qu, L.H.; Yang, J.H. Starbase v2.0: Decoding miRNA-ceRNA, miRNA-ncRNA and protein-RNA interaction networks from large-scale clip-seq data. Nucleic Acids Res. 2014, 42, D92–D97. [Google Scholar] [CrossRef] [PubMed]
  32. Bertucci, F.; Chaffanet, M.; Birnbaum, D. An ICGC major achievement in breast cancer: A comprehensive catalog of mutations and mutational signatures. Chin. Clin. Oncol. 2017, 6, 4. [Google Scholar] [CrossRef] [PubMed]
  33. Győrffy, B.; Benke, Z.; Lánczky, A.; Balázs, B.; Szállási, Z.; Timár, J.; Schäfer, R. Recurrenceonline: An online analysis tool to determine breast cancer recurrence and hormone receptor status using microarray data. Breast Cancer Res. Treat. 2012, 132, 1025–1034. [Google Scholar] [CrossRef] [Green Version]
  34. Cao, Z.; Pan, X.; Yang, Y.; Huang, Y.; Shen, H.B. The lnclocator: A subcellular localization predictor for long non-coding RNAs based on a stacked ensemble classifier. Bioinformatics 2018, 34, 2185–2194. [Google Scholar] [CrossRef] [PubMed]
  35. Morris, K.V.; Vogt, P.K. Long antisense non-coding rnas and their role in transcription and oncogenesis. Cell Cycle 2010, 9, 2544–2547. [Google Scholar] [CrossRef] [Green Version]
  36. Zhang, Y.T.; Li, B.P.; Zhang, B.; Ma, P.; Wu, Q.L.; Ming, L.; Xie, L.M. Lncrna sbf2-as1 promotes hepatocellular carcinoma metastasis by regulating emt and predicts unfavorable prognosis. Eur. Rev. Med. Pharmacol. Sci. 2018, 22, 6333–6341. [Google Scholar]
  37. Takahashi, K.; Yan, I.K.; Kogure, T.; Haga, H.; Patel, T. Extracellular vesicle-mediated transfer of long non-coding RNA ROR modulates chemosensitivity in human hepatocellular cancer. FEBS Open Bio. 2014, 4, 458–467. [Google Scholar] [CrossRef] [Green Version]
  38. Rothzerg, E.; Ho, X.D.; Xu, J.; Wood, D.; Märtson, A.; Kõks, S. Upregulation of 15 antisense long non-coding RNAs in osteosarcoma. Genes 2021, 12, 1132. [Google Scholar] [CrossRef]
  39. Niu, Y.; Bao, L.; Chen, Y.; Wang, C.; Luo, M.; Zhang, B.; Zhou, M.; Wang, J.E.; Fang, Y.V.; Kumar, A. HIF2-induced long noncoding RNA RAB11B-AS1 promotes hypoxia-mediated angiogenesis and breast cancer metastasis. Cancer Res. 2020, 80, 964–975. [Google Scholar] [CrossRef]
  40. Ningbo, Y.; Xiaodong, J.; Yao, K. LncRNA RAB11B-AS1 up-regulating miR-628-3p inhibits proliferation and migration of gastric cancer cell line. Basic Clin. Med. 2021, 41, 1762–1766. (In Chinese) [Google Scholar]
  41. Jiang, Y.; Chen, J.; Ling, J.; Zhu, X.; Jiang, P.; Tang, X.; Zhou, H.; Li, R. Construction of a glycolysis-related long noncoding RNA signature for predicting survival in endometrial cancer. J. Cancer 2021, 12, 1431–1444. [Google Scholar] [CrossRef]
  42. Gilbert, A.; Williams, C.; Azuero, A.; Burkard, M.E.; Kenzik, K.; Garrett, M.E.; Meersman, S.; Rocque, G. Utilizing data visualization to identify survival and treatment differences between women with de novo and recurrent metastatic breast cancer. Clin. Breast Cancer 2021, 21, 292–301. [Google Scholar] [CrossRef]
  43. Kariyama, K.; Nouso, K.; Hiraoka, A.; Wakuta, A.; Oonishi, A.; Kuzuya, T.; Toyoda, H.; Tada, T.; Tsuji, K.; Itobayashi, E. Ez-albi score for predicting hepatocellular carcinoma prognosis. Liver Cancer 2020, 9, 734–743. [Google Scholar] [CrossRef]
  44. Zhao, Z.; Zhu, Y.; Ni, X.; Lin, J.; Li, H.; Zheng, L.; Zhang, C.; Qi, X.; Huo, H.; Lou, X. Serum GGT/ALT ratio predicts vascular invasion in HBV-related HCC. Cancer Cell Int. 2021, 21, 517. [Google Scholar] [CrossRef]
  45. Núñez Abad, M.; Calabuig-Fariñas, S.; Lobo de Mena, M.; Torres, M.S.; García, G.C.; García, G.J.; Iranzo, G.C.V.; Camps, H.C. Programmed death-ligand 1 (PD-l1) as immunotherapy biomarker in breast cancer. Cancers 2022, 14, 307. [Google Scholar] [CrossRef]
  46. Peng, L.; Chen, Y.; Ou, Q.; Wang, X.; Tang, N. LncRNA MIAT correlates with immune infiltrates and drug reactions in hepatocellular carcinoma. Int. Immunopharmacol. 2020, 89, 107071. [Google Scholar] [CrossRef]
  47. Park, J.G.; Kim, G.; Jang, S.Y.; Lee, Y.R.; Lee, E.; Lee, H.W.; Han, M.H.; Chun, J.M.; Han, Y.S.; Yoon, J.S. Plasma long noncoding RNA LEXIS is a potential diagnostic marker for non-alcoholic steatohepatitis. Life 2020, 10, 230. [Google Scholar] [CrossRef]
  48. Kong, F.; You, H.; Tang, R.; Zheng, K. The regulation of proteins associated with the cytoskeleton by hepatitis B virus X protein during hepatocarcinogenesis. Oncol. Lett. 2017, 13, 2514–2520. [Google Scholar] [CrossRef] [Green Version]
  49. Liu, X.; Wu, S.; Yang, Y.; Zhao, M.; Zhu, G.; Hou, Z. The prognostic landscape of tumor-infiltrating immune cell and immunomodulators in lung cancer. Biomed. Pharmacother. 2017, 95, 55–61. [Google Scholar] [CrossRef]
  50. Hong, W.; Liang, L.; Gu, Y.; Qi, Z.; Qiu, H.; Yang, X.; Zeng, W.; Ma, L.; Xie, J. Immune-related lncrna to construct novel signature and predict the immune landscape of human hepatocellular carcinoma. Mol. Ther. Nucleic Acids 2020, 22, 937–947. [Google Scholar] [CrossRef]
  51. Luzón-Toro, B.; Fernández, R.M.; Martos-Martínez, J.M.; Rubio, M.M.; Antiñolo, G.; Borrego, S. LncRNA LUCAT1 as a novel prognostic biomarker for patients with papillary thyroid cancer. Sci. Rep. 2019, 9, 14374. [Google Scholar] [CrossRef] [PubMed] [Green Version]
  52. Wang, Z.; Yang, B.; Zhang, M.; Guo, W.; Wu, Z.; Wang, Y.; Jia, L.; Li, S.; Xie, W.; Yang, D. LncRNA epigenetic landscape analysis identifies EPIC1 as an oncogenic lncRNA that interacts with MYC and promotes cell-cycle progression in cancer. Cancer Cell 2018, 33, 706–720.e709. [Google Scholar] [CrossRef] [PubMed] [Green Version]
  53. Zhang, J.; Zhao, X.; Ma, X.; Yuan, Z.; Hu, M. KCNQ1OT1 contributes to sorafenib resistance and programmed death-ligand-1-mediated immune escape via sponging miR-506 in hepatocellular carcinoma cells. Int. J. Mol. Med. 2020, 46, 1794–1804. [Google Scholar] [CrossRef] [PubMed]
  54. Wang, Y.; Yang, L.; Chen, T.; Liu, X.; Guo, Y.; Zhu, Q.; Tong, X.; Yang, W.; Xu, Q.; Huang, D. A novel lncRNA MCM3AP-AS1 promotes the growth of hepatocellular carcinoma by targeting miR-194-5p/FOXA1 axis. Mol. Cancer 2019, 18, 28. [Google Scholar] [CrossRef]
Figure 1. Comparison of lnc-RAB11B-AS1 and RAB11B expression in HCC and normal liver tissues (AC) The expression of lnc-RAB11B-AS1 in HCC tissues and normal tissues based on TCGA-LIHC, GSE144269, GSE84402. (DF) RAB11B expression in HCC tissues and normal tissues based on TCGA-LIHC, GSE144269, GSE84402. (GI) The correlation analysis between lnc-RAB11B-AS1 and RAB11B in three different datasets.
Cells 11 03517 g001
Figure 2. Relationship between lnc-RAB11B-AS1 and RAB11B expression and the prognosis of HCC patients (A,B) The different expression status of lnc-RAB11B-AS1 in the histologic grade and clinical stage of HCC. (C,D) The change of RAB11B expression in the histologic grade and clinical stage of HCC. (E,F) The association between lnc-RAB11B-AS1 and RAB11B expression and OS in TCGA database. (G,H) The correlation between the expression of lnc-RAB11B-AS1 and RAB11B and OS in GSE144269 dataset. (I) The relationships between RAB11B expression and OS, RFS, PFS, and DSS of HCC patients in Kaplan-Meier Plotter database.
Cells 11 03517 g002
Figure 3. Immunohistochemical analysis of RAB11B protein in HCC tissues and adjacent noncancerous tissues. (A) Expression of RAB11B protein in two representative pairs of HCC tissues (T) and adjacent non-cancerous tissues (ANT), with magnification ×100. (B) The score histogram of RAB11B expression at protein level in HCC and non-cancerous tissues. (C,D) The relationship between RAB11B expression, OS, and DFS in HCC patients. (E) Protein network diagram of interaction with RAB11B protein. (F) Single-cell UMAP dimensionality reduction map of the liver. (G) RNA levels of RAB11B and mark genes in different single cell type clusters of the liver (Human Protein Atlas).
Cells 11 03517 g003
Figure 4. The signaling pathways and biological processes of lnc-RAB11B-AS1 (A) GO analysis. (B) Pathway enrichment analysis based on KEGG. (C) KEGG pathway: NAFAD. (D) Volcano plot of DEGs. Blue and red dots represent the significantly down-regulated and up-regulated DEGs, respectively. (E) Ten significantly enriched pathways based on GSEA.
Cells 11 03517 g004
Figure 5. Copy number variations (CNVs) of RAB11B in HCC tissues (A,B) Correlation analysis between lnc-RAB11B-AS1, RAB11B, and six immune cells in TIMER. (C) The relationship between the expression levels of two genes and 64 immune cells using xCell. (D) OncoPrint plot of lnc-RAB11B-AS1 and RAB11B alterations. (E) Genetic alteration in RAB11B might be associated with shorter OS of HCC patients. (F) Relationship between the gene mutation level of RAB11B and tumor histological grade. (G) Methylation levels of the promoter region of lnc-RAB11B-AS1 were higher in the tumor group compared to the paired normal group. (H,I) Methylation levels in different clinical stages and T stage. * p < 0.05, ** p < 0.01, *** p < 0.001.
Cells 11 03517 g005
Figure 6. Prediction of potential candidate miRNAs and drug sensitivity analysis (A) The prediction of the subcellular localization of lnc-RAB11B-AS1. (B) The expression status of hsa-miR-4726-5p in HCC tissues and normal tissues from ICGC. (C) Kaplan-Meier overall survival was analyzed according to hsa-miR-4726-5p expression in ICGC cohort. (D) The relationship between lnc-RAB11B-AS1 and hsa-miR-4726-5p expression in ENCORI database. (E) Correlation analysis of the expression of RAB11B and hsa-miR-4726-5p in 232 pairs of HCC tissues. (F) Relationship between lnc-RAB11B-AS1 and chemosensitivity to nine drugs.
Cells 11 03517 g006
Table 1. Relationship between clinicopathological characteristics and expression of lnc-RAB11B-AS1.
CharacteristicsnLnc-RAB11B-AS1 Expressionχ2p-Value
High
(n = 184)
Low
(n = 184)
Sex 9.9080.002
Male248139 (56.1)109 (43.9)
Female12046 (38.3)74 (61.7)
Age 2.2970.130
≤6017982 (45.8)97 (54.2)
>60188101 (53.7)87 (46.3)
Missing11 (100.0)0 (0)
Race 0.6030.740
Asian15875 (47.5)83 (52.5)
White18289 (48.9)93 (51.1)
Others2814 (50.0)14 (50.0)
Historical risk factors 4.2250.238
History of hepatitis B or hepatitis C10153 (52.5)48 (47.5)
Alcohol consumption6525 (38.5)40 (61.5)
Smoking84 (50.0)4 (50.0)
Others194102 (52.6)92 (47.4)
Clinical stage 4.0540.044
I, II257140 (54.5)117 (45.5)
III, IV8837 (42.0)51 (58.0)
Missing237 (30.4)16 (69.6)
T 2.4720.116
T1, T2275144 (52.4)131 (47.6)
T3, T49139 (42.9)52 (57.1)
Missing21 (50.0)1 (50.0)
N 4.6050.032
N0250121 (48.2)129 (51.8)
N150 (0)5 (100.0)
Missing11363 (55.8)50 (44.2)
M 1.030.310
M0265134 (50.6)131 (49.4)
M141 (25.0)3 (75.0)
Missing9949 (49.5)50 (50.5)
Histologic grade 4.4160.036
G1, G2232125 (53.9)107 (46.1)
G3, G413256 (42.4)76 (57.6)
Missing43 (75.0)1 (25.0)
AFP (μg/L) 8.0660.018
≤2014786 (58.5)61 (41.5)
20 < AFP ≤ 4006528 (43.1)37 (56.9)
>4006526 (40.0)39 (60.0)
Missing9144 (48.4)47 (51.6)
T-Bil (μmol/L)
Medical reference value44 (100.0)0 (0)4.5000.034
Abnormal value289151 (52.2)138 (47.8)
Missing7529 (38.7)46 (61.3)
ALB (g/L) 3.7130.054
Medical reference value44 (100.0)0 (0)
Abnormal value291150 (51.5)141 (48.5)
Missing7330 (41.1)43 (58.9)
Creatinine (μmol/L) 0.1650.685
Medical reference value18297 (53.3)85 (46.7)
Abnormal value11458 (50.9)56 (49.1)
Missing7229 (40.3)43 (59.7)
Child pugh grade 0.0180.895
A216121 (56.0)95 (44.0)
B,C2212 (54.5)10 (45.5)
Missing13051 (39.2)79 (60.8)
Treatment or therapy 1.7030.192
Yes3916 (41.0)23 (59.0)
No307160 (52.1)147 (47.9)
Missing228 (36.4)14 (63.6)
Treatment type 0.0030.959
Pharmaceutical Therapy18593 (50.1)92 (49.9)
Radiation Therapy18392 (50.3)91 (49.7)
Cancer first-degree relatives 2.2470.134
≤16542 (64.6)23 (35.4)
>15327 (50.9)26 (49.1)
Missing250115 (46.0)135 (54.0)
BMI335168 (50.1)167 (49.9)0.8840.377
Missing3316 (48.5)17 (51.5)
p-value: Statistically significant results (in bold); TNM: Tumor-node-metastasis; BMI: Body mass index.
Table 2. Relationship between clinicopathological characteristics and expression of RAB11B.
CharacteristicsnRAB11B Expressionχ2p-Value
High
(n = 184)
Low
(n = 184)
Sex 0.0120.911
Male249124 (49.8)125 (50.2)
Female11960 (50.4)59 (49.6)
Age 0.0670.796
≤6017689 (50.6)87 (49.4)
>6019194 (49.2)97 (50.8)
Missing11 (100.0)0 (0)
Race 0.8540.653
Asian15875 (47.5)83 (52.5)
White18193 (51.4)88 (48.6)
Others2916 (55.2)13 (44.8)
Historical risk factors 2.2000.532
History of hepatitis B or hepatitis C10151 (50.5)50 (49.5)
Alcohol consumption6528 (43.1)37 (56.9)
Smoking94 (44.4)5 (55.6)
Others193103 (53.4)90 (46.6)
Clinical stage 3.4260.064
I, II256134 (52.3)122 (47.7)
III, IV8936 (40.4)53 (59.6)
Missing2314 (60.9)9 (39.1)
T 2.4720.116
T1, T2275144 (52.4)131 (47.6)
T3, T49139 (42.9)52 (57.1)
Missing21 (50.0)1 (50.0)
N 0.8500.357
N0251121 (48.2)130 (51.8)
N141 (25.0)3 (75.0)
Missing11362 (54.9)51 (45.1)
M 0.0250.875
M0265122 (46.1)143 (53.9)
M142 (50.0)2 (50.0)
Missing9960 (60.6)39 (39.4)
Histologic grade 5.9200.015
G1, G2233127 (54.3)106 (45.7)
G3, G413154 (41.2)77 (58.8)
Missing43 (75.0)1 (25.0)
AFP (μg/L) 0.5810.748
≤2014772 (49.0)75 (51.0)
20<AFP ≤ 4006632 (48.5)34 (51.5)
>4006434 (53.1)30 (46.9)
Missing9146 (50.5)45 (49.5)
T-Bil (μmol/L) 0.8940.344
Medical reference value43 (75.0)1 (25.0)
Abnormal value289148 (51.2)141 (48.8)
Missing7533 (44.0)42 (56.0)
ALB (g/L) 0.9200.337
Medical reference value43 (75.0)1 (25.0)
Abnormal value291148 (50.9)143 (49.1)
Missing7333 (45.2)40 (54.8)
Creatinine (μmol/L) 0.1090.741
Medical reference value18289 (48.9)93 (51.1)
Abnormal value11458 (50.9)56 (49.1)
Missing7237 (51.4)35 (48.6)
Child pugh grade 0.0920.762
A217111 (51.2)106 (48.8)
B,C2212 (54.5)10 (45.5)
Missing12961 (47.3)68 (52.7)
Treatment or therapy 0.2050.651
Yes4021 (52.5)19 (47.5)
No306149 (48.7)157 (51.3)
Missing2214 (63.6)8 (36.4)
Treatment type 0.3300.566
Pharmaceutical Therapy18595 (51.4)90 (48.6)
Radiation Therapy18388 (48.1)94 (51.9)
Cancer first-degree relatives 1.2380.266
≤16636 (54.5)30 (45.5)
>15223 (44.2)29 (55.8)
Missing250125 (50.0)125 (50.0)
BMI335166 (49.6)169 (50.4)1.1120.267
Missing3318 (54.5)15 (45.5)
Table 3. Univariate and multivariate Cox regression analyses of clinicopathologic characteristics associated with OS in TCGA samples.
VariableUnivariableMultivariable
HR95%CIpHR95%CIp
Gender1.1190.771–1.6240.5561.1920.610–2.3300.725
Age1.0130.998–1.0270.0831.0230.998–1.0510.076
BMI1.0190.967–1.0280.8191.0310.979–1.0860.377
Race1ReferenceReference
21.3010.879–1.9250.1890.5390.255–1.1410.106
31.5260.647–3.5990.3341.8120.232–14.1050.570
Clinical stage1.3121.011–1.7030.0412.6281.599–4.321<0.001
T2.5621.770–3.707<0.00120.2080.869–469.50.061
N1.9911.487–8.1440.0388.8461.013–1.0960.013
M3.9071.225–12.470.0211.2330.135–11.2810.853
Histologic grade1.0600.726–1.5470.7621.1190.631–1.9830.701
AFP (μg/L)1ReferenceReference
21.3520.621–2.9410.4471.1020.321–2.5640.854
30.9240.385–2.2200.8601.2240.278–2.4020.714
T-Bil (μmol/L)1.3560.185–9.9320.7641.3560.185–9.9320.764
ALB (g/L)1.3980.101–10.2400.7421.2840.175–9.4340.806
Creatinine (μmol/L)1.7101.067–1.3740.0311.7441.297–1.8620.027
Child pugh grade2.2050.296–16.4010.3651.9930.236–16.8460.526
Treatment type1.2310.858–1.7660.2601.7340.979–3.0710.059
Treatment or therapy1.0390.592–1.8220.8951.1760.492–2.8070.716
Lnc-RAB11B-AS10.8140.696–0.9510.0090.7990.656–0.9720.025
RAB11B0.6510.467–0.9090.0120.8980.978–1.0000.041
Table 4. Relationship between clinicopathological characteristics and expression of RAB11B protein in HCC patients.
CharacteristicsnRAB11B Expressionχ2p-Value
High
(n = 25)
Low
(n = 65)
Sex 0.3390.560
Male8023 (28.6)57 (71.4)
Female102 (20.0)8 (80.0)
Age 0.5430.461
≤607121 (29.6)50 (70.4)
>60194 (21.1)15 (78.9)
Pathology grade 15.691<0.001
I32 (66.7)1 (33.3)
II4319 (44.2)24 (55.8)
III444 (9.1)40 (90.9)
Clinical stage 2.0180.365
16320 (31.7)43 (68.3)
2255 (20.0)20 (80.0)
320 (0)2 (100.0)
T 2.2250.329
T16320 (31.7)43 (68.3)
T2245 (20.8)19 (79.2)
T330 (0)3 (100.0)
Recurrence 1.5220.217
Yes4911 (22.4)38 (77.6)
No4114 (34.1)27 (65.9)
HBsAg 2.8110.094
Positive7016 (22.9)54 (77.1)
Negative198 (42.1)11(57.9)
Unknown11 (100.0)0 (0)
HBcAb 0.0180.894
Positive8021 (26.3)59 (73.7)
Negative72 (28.6)5 (71.4)
Unknown32 (66.7)1 (33.3)
AntiHCV 2.8150.093
Positive11 (100.0)0 (0)
Negative8622 (25.6)64 (74.4)
Unknown32 (66.7)1 (33.3)
T-Bil (μmol/L) 4.1070.043
Medical reference value6321 (33.3)42 (66.7)
Abnormal value253 (12.0)22 (88.0)
Unknown21 (50.0)1 (50.0)
ALT (U/L) 0.2240.636
Medical reference value5215 (28.8)37 (71.2)
Abnormal value379 (24.3)28 (75.7)
Unknown11 (100.0)0 (0)
AFP (μg/L) 0.7160.397
≤203610 (27.8)26 (72.2)
>205314 (26.4)39 (73.6)
Unknown11 (100.0)0 (0)
GGT(U/L) 3.9030.048
≤403012 (40.0)18 (60.0)
>405912 (20.3)47 (79.7)
Unknown11 (100.0)0 (0)
PD-L1 expression 9.3570.002
Low3918 (46.2)21 (53.8)
High457 (15.6)38 (84.4)
Unknown60 (0)6 (100.0)
CTLA4 expression 0.7860.375
Low20 (0)2 (100.0)
High8123 (28.4)58 (71.6)
Unknown72 (28.6)5 (71.4)
HBsAg: Hepatitis B surface antigen; HBcAb: Hepatitis B core antibody; AntiHCV: Antibody to Hepatitis surface antigen; TB: Total bilirubin; AFP: Alpha-fetoprotein; GGT: Gamma-glutamyl transferase; PD-L1: Programmed cell death ligand-1; CTLA4: Cytotoxic T lymphocyte-associated protein 4. The medical reference value of T-Bil (μmol/L) and ALT (U/L) is 5.13~22.24, 7~40, respectively.
Publisher’s Note: MDPI stays neutral with regard to jurisdictional claims in published maps and institutional affiliations.

