
New Insight on 2D In Vitro Angiogenesis Models: All That Stretches Is Not a Tube
 , , and
Abstract
:Highlights
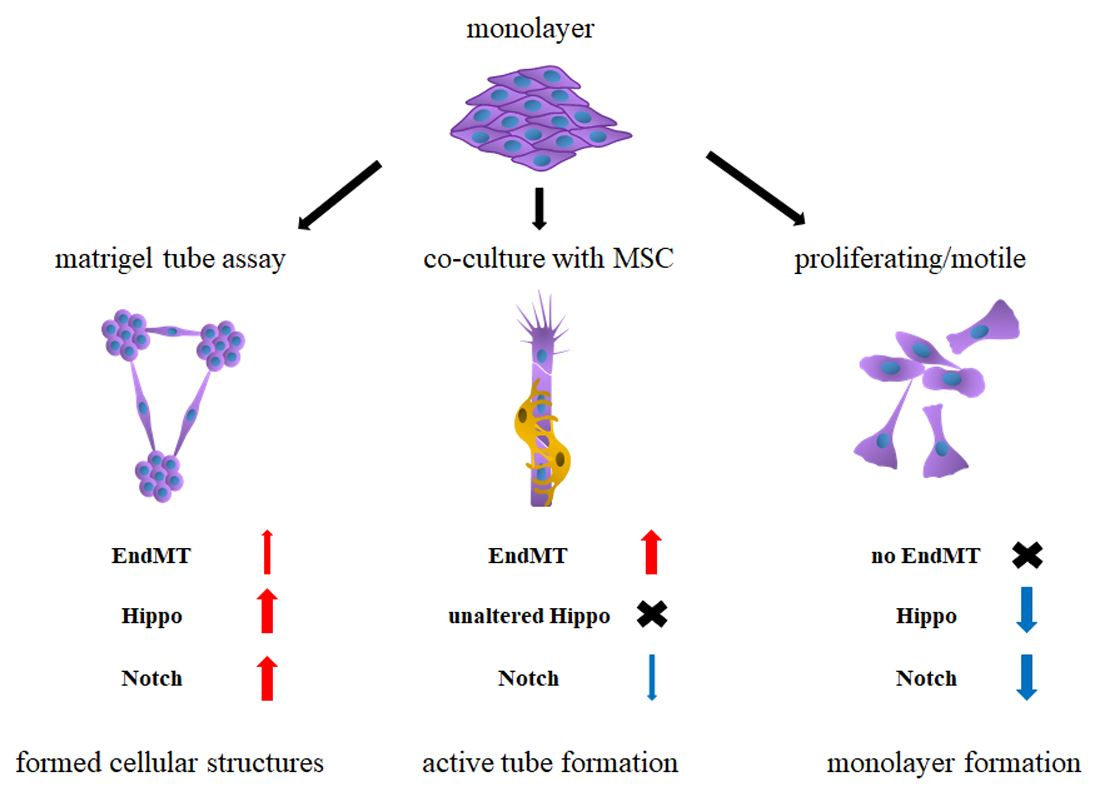
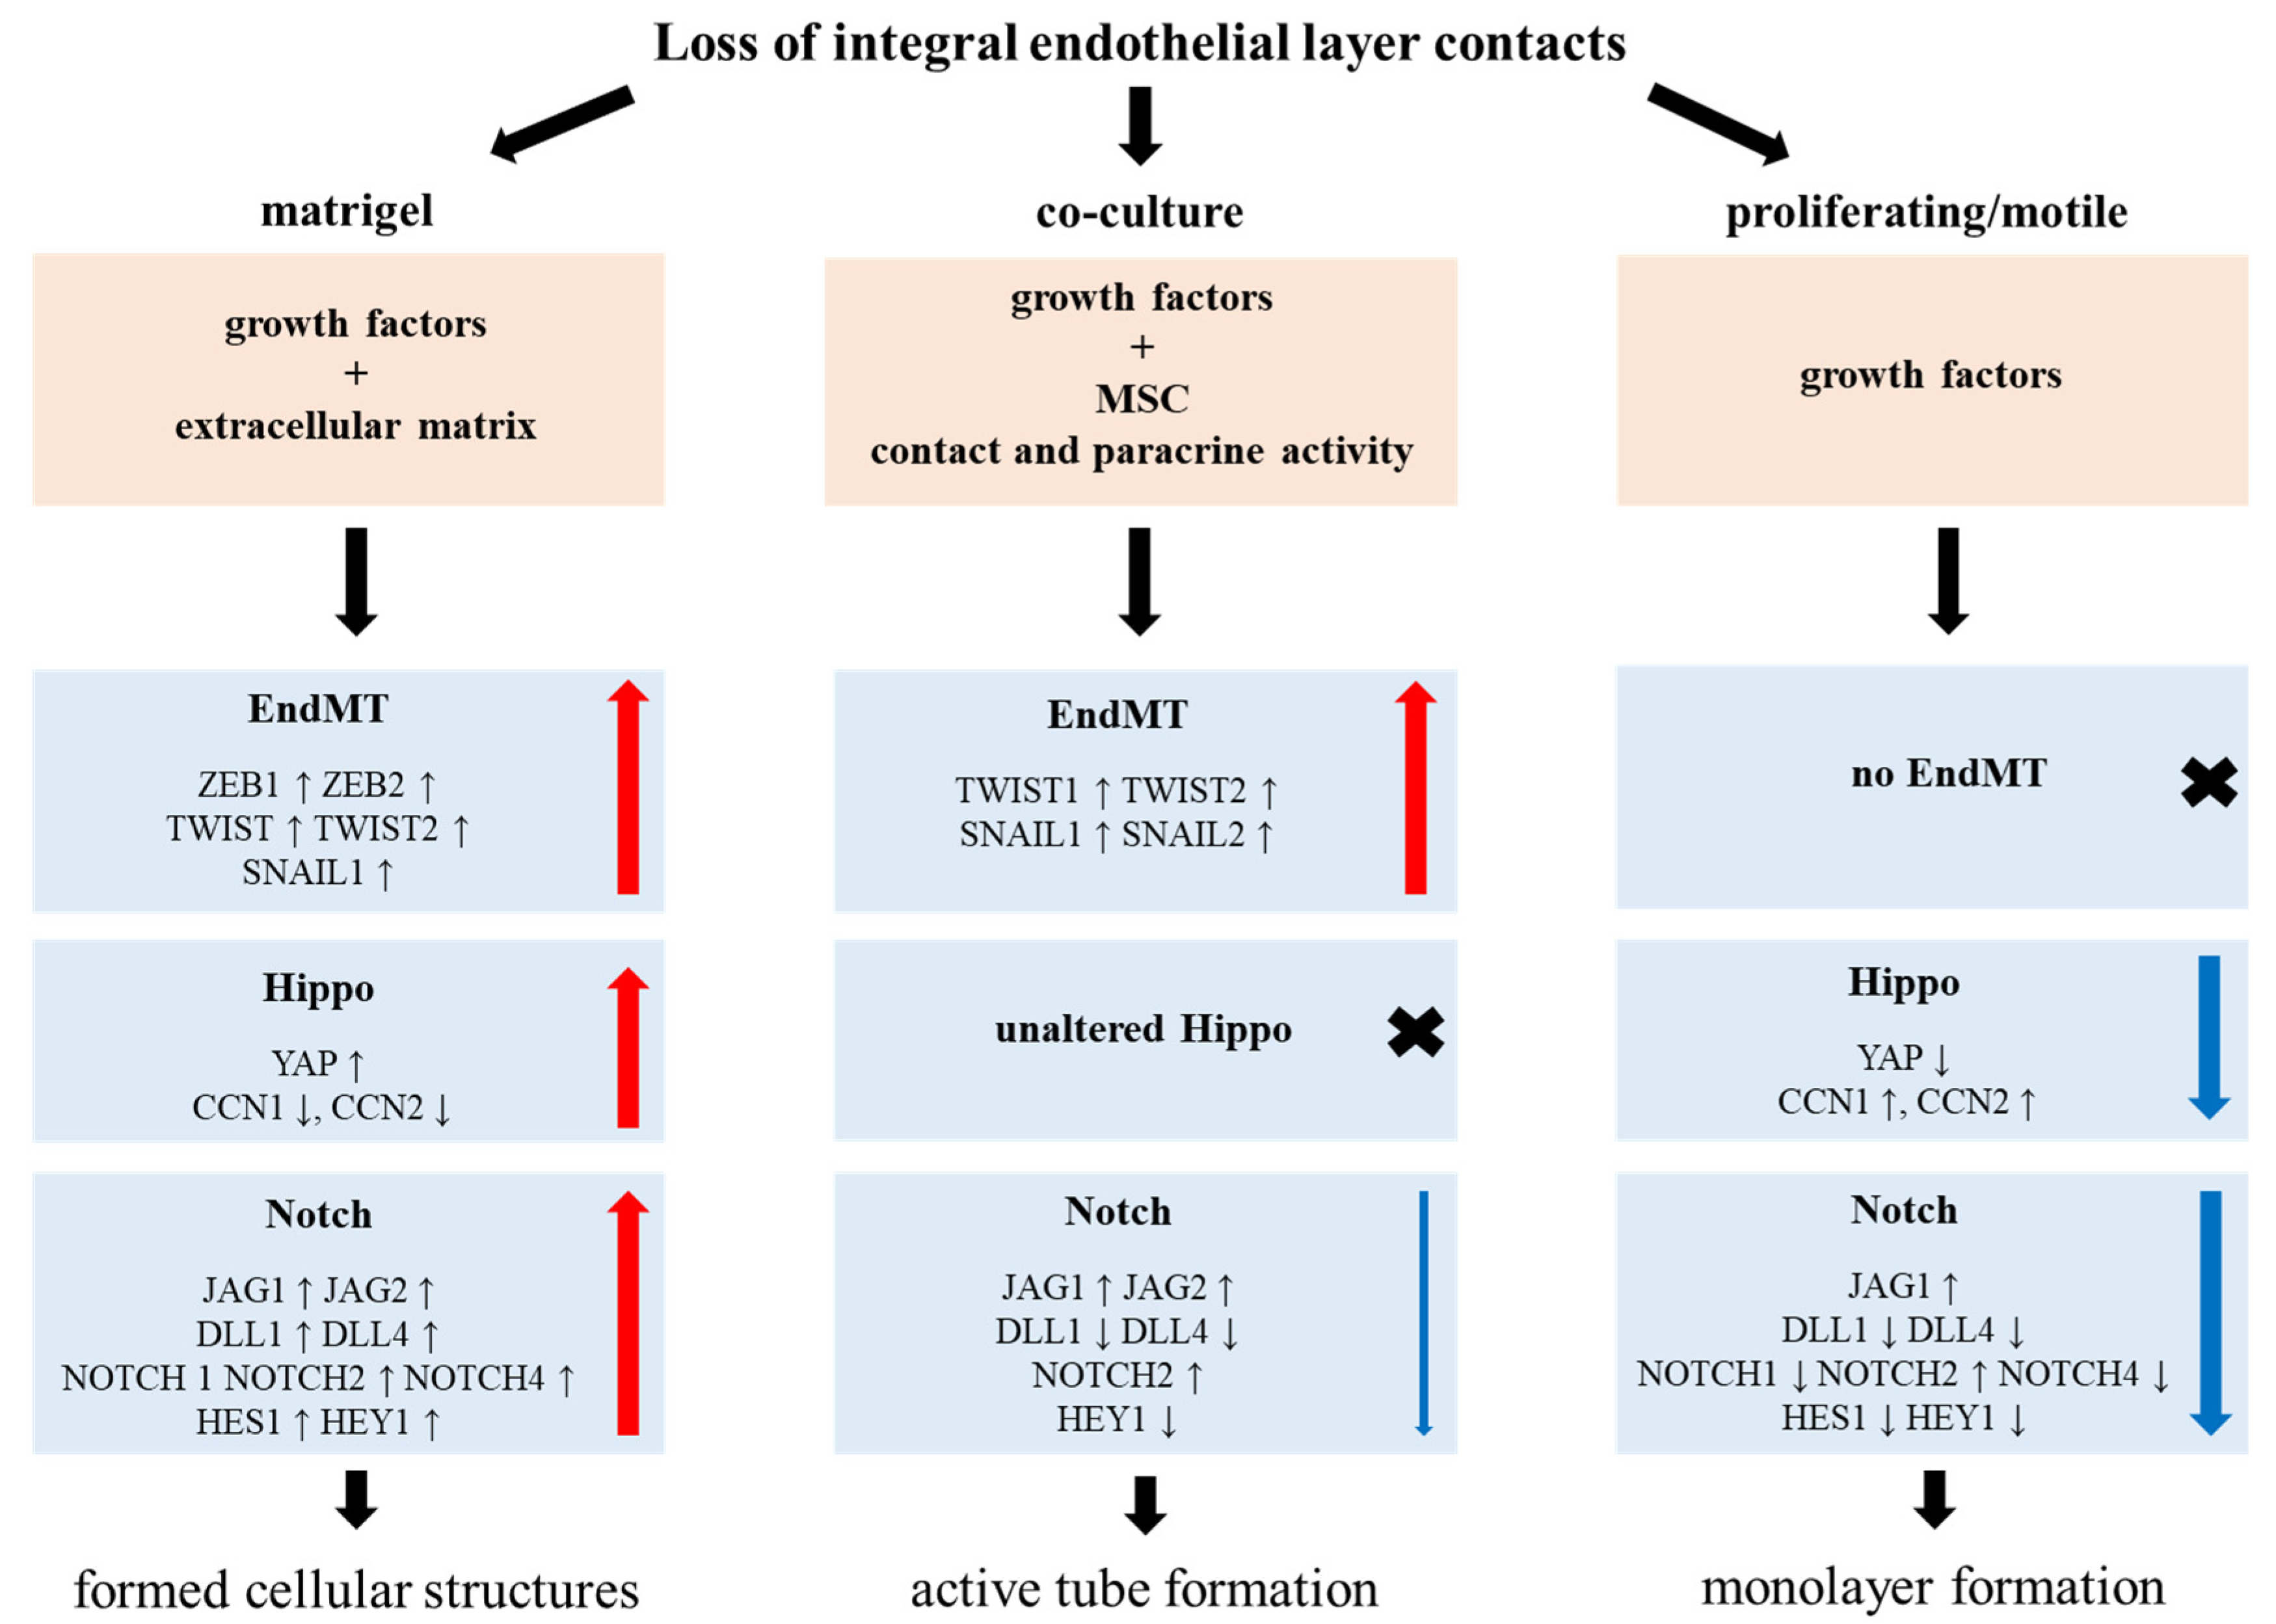
- Tube formation on MatrigelTM and tube formation in co-culture with MSCs are two different stages of angiogenesis.
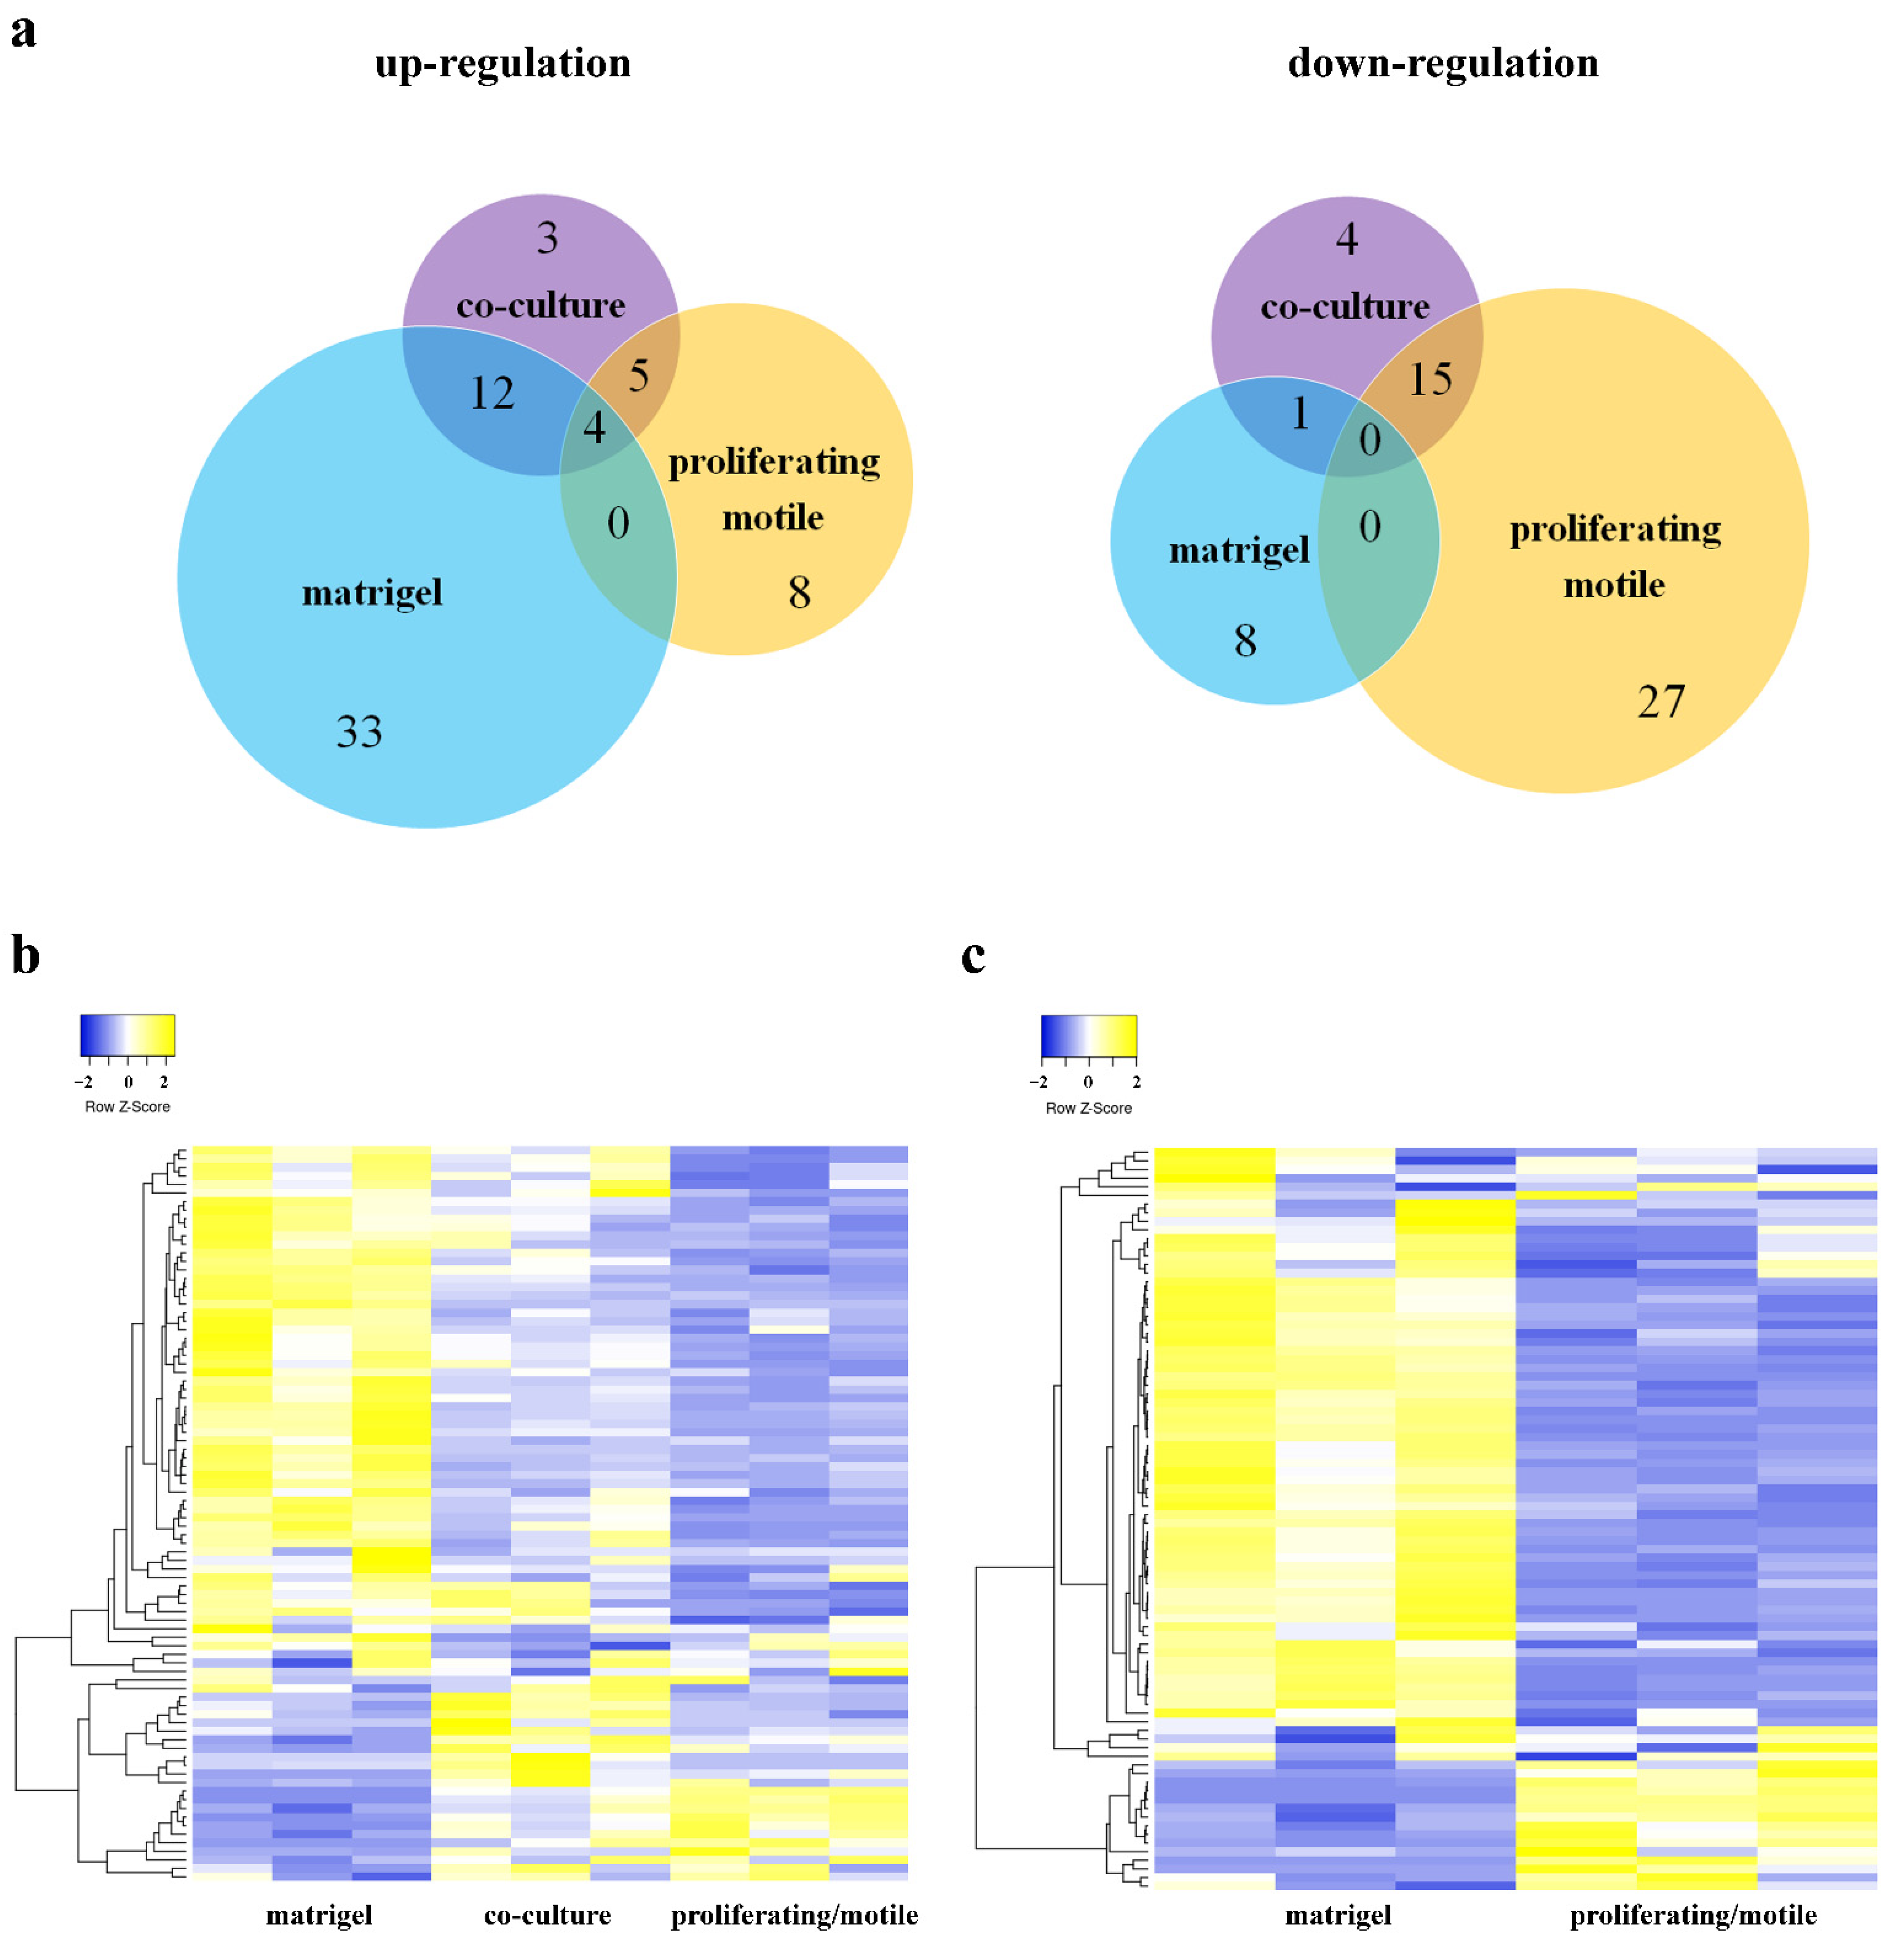
- uPA, uPAR, Jagged1, and Notch2 are common upregulated genes for ECs on MatrigelTM, in co-culture and in dividing/migrating cells.
- EndMT activated at a much greater extent in ECs in a co-culture model than in a MatrigelTM assay.
- Only in the MatrigelTM assay are the Notch and Hippo pathway-related genes upregulated.
Abstract

1. Introduction
2. Materials and Methods
2.1. Cell Isolation and Culture
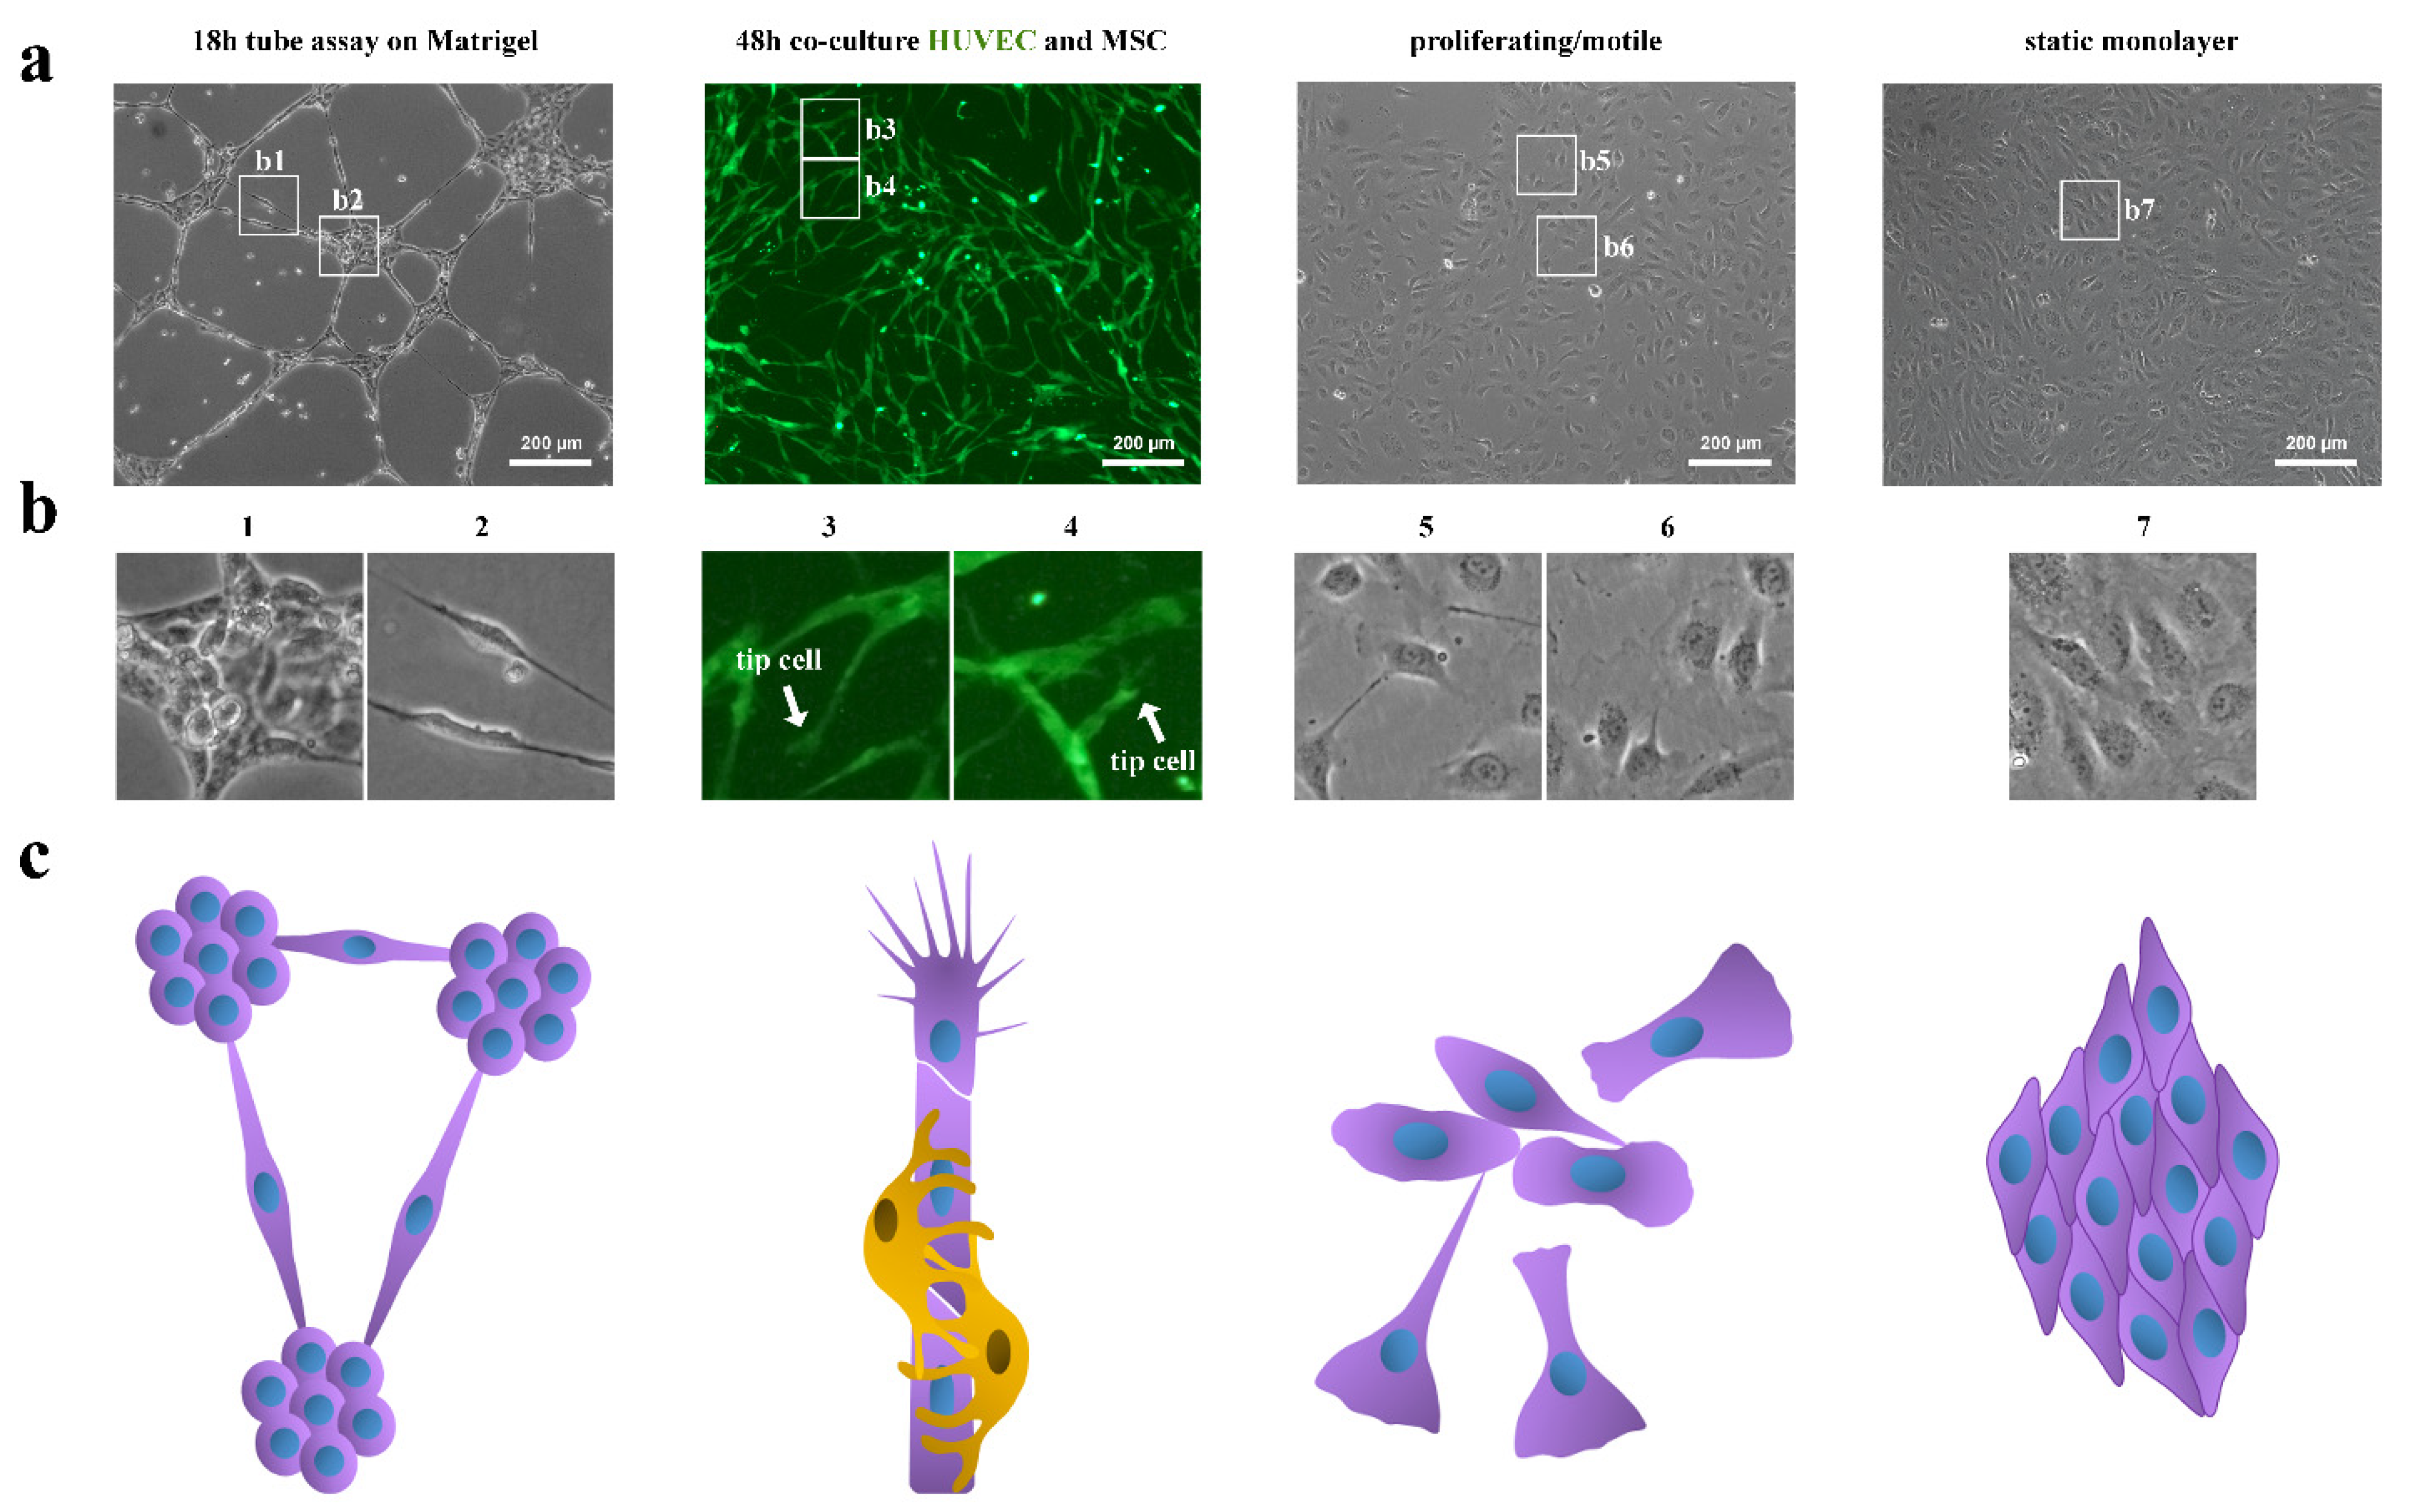
2.2. Tube Formation Assay on MatrigelTM In Vitro
2.3. HUVEC-MSC Two-Dimensional (2D) Co-Culture Model
2.4. The 2D Co-Culture Model of HUVECs with MSCs and Its 48 h Synthesized Extracellular Matrix (EM)
2.5. 4 Condition of HUVECs Growth
- (1)
- Onto a 60 cm2 Petri dish covered with MatrigelTM at a density of 5 × 10⁴ cells/cm2.
- (2)
- As a co-culture with MSCs at a total cell density of 6 × 10⁴ cells/cm2 at a ratio of 1:3 of HUVEC: MSC.
- (3)
- As a “proliferating/motile” sparsely populated monoculture at a density 3.6 × 10⁴ cells/cm2 on a 60 cm2 Petri dish.
- (4)
- As a “static monolayer” densely populated monoculture at a density of 7 × 10⁴ cells/cm2 on a 100 cm2 Petri dish.
2.6. Immunofluorescent Staining
2.7. RNA Isolation, Reverse Transcription, and Real-Time Quantitative PCR
2.8. Data Analysis
2.9. Statistical Analysis
3. Results
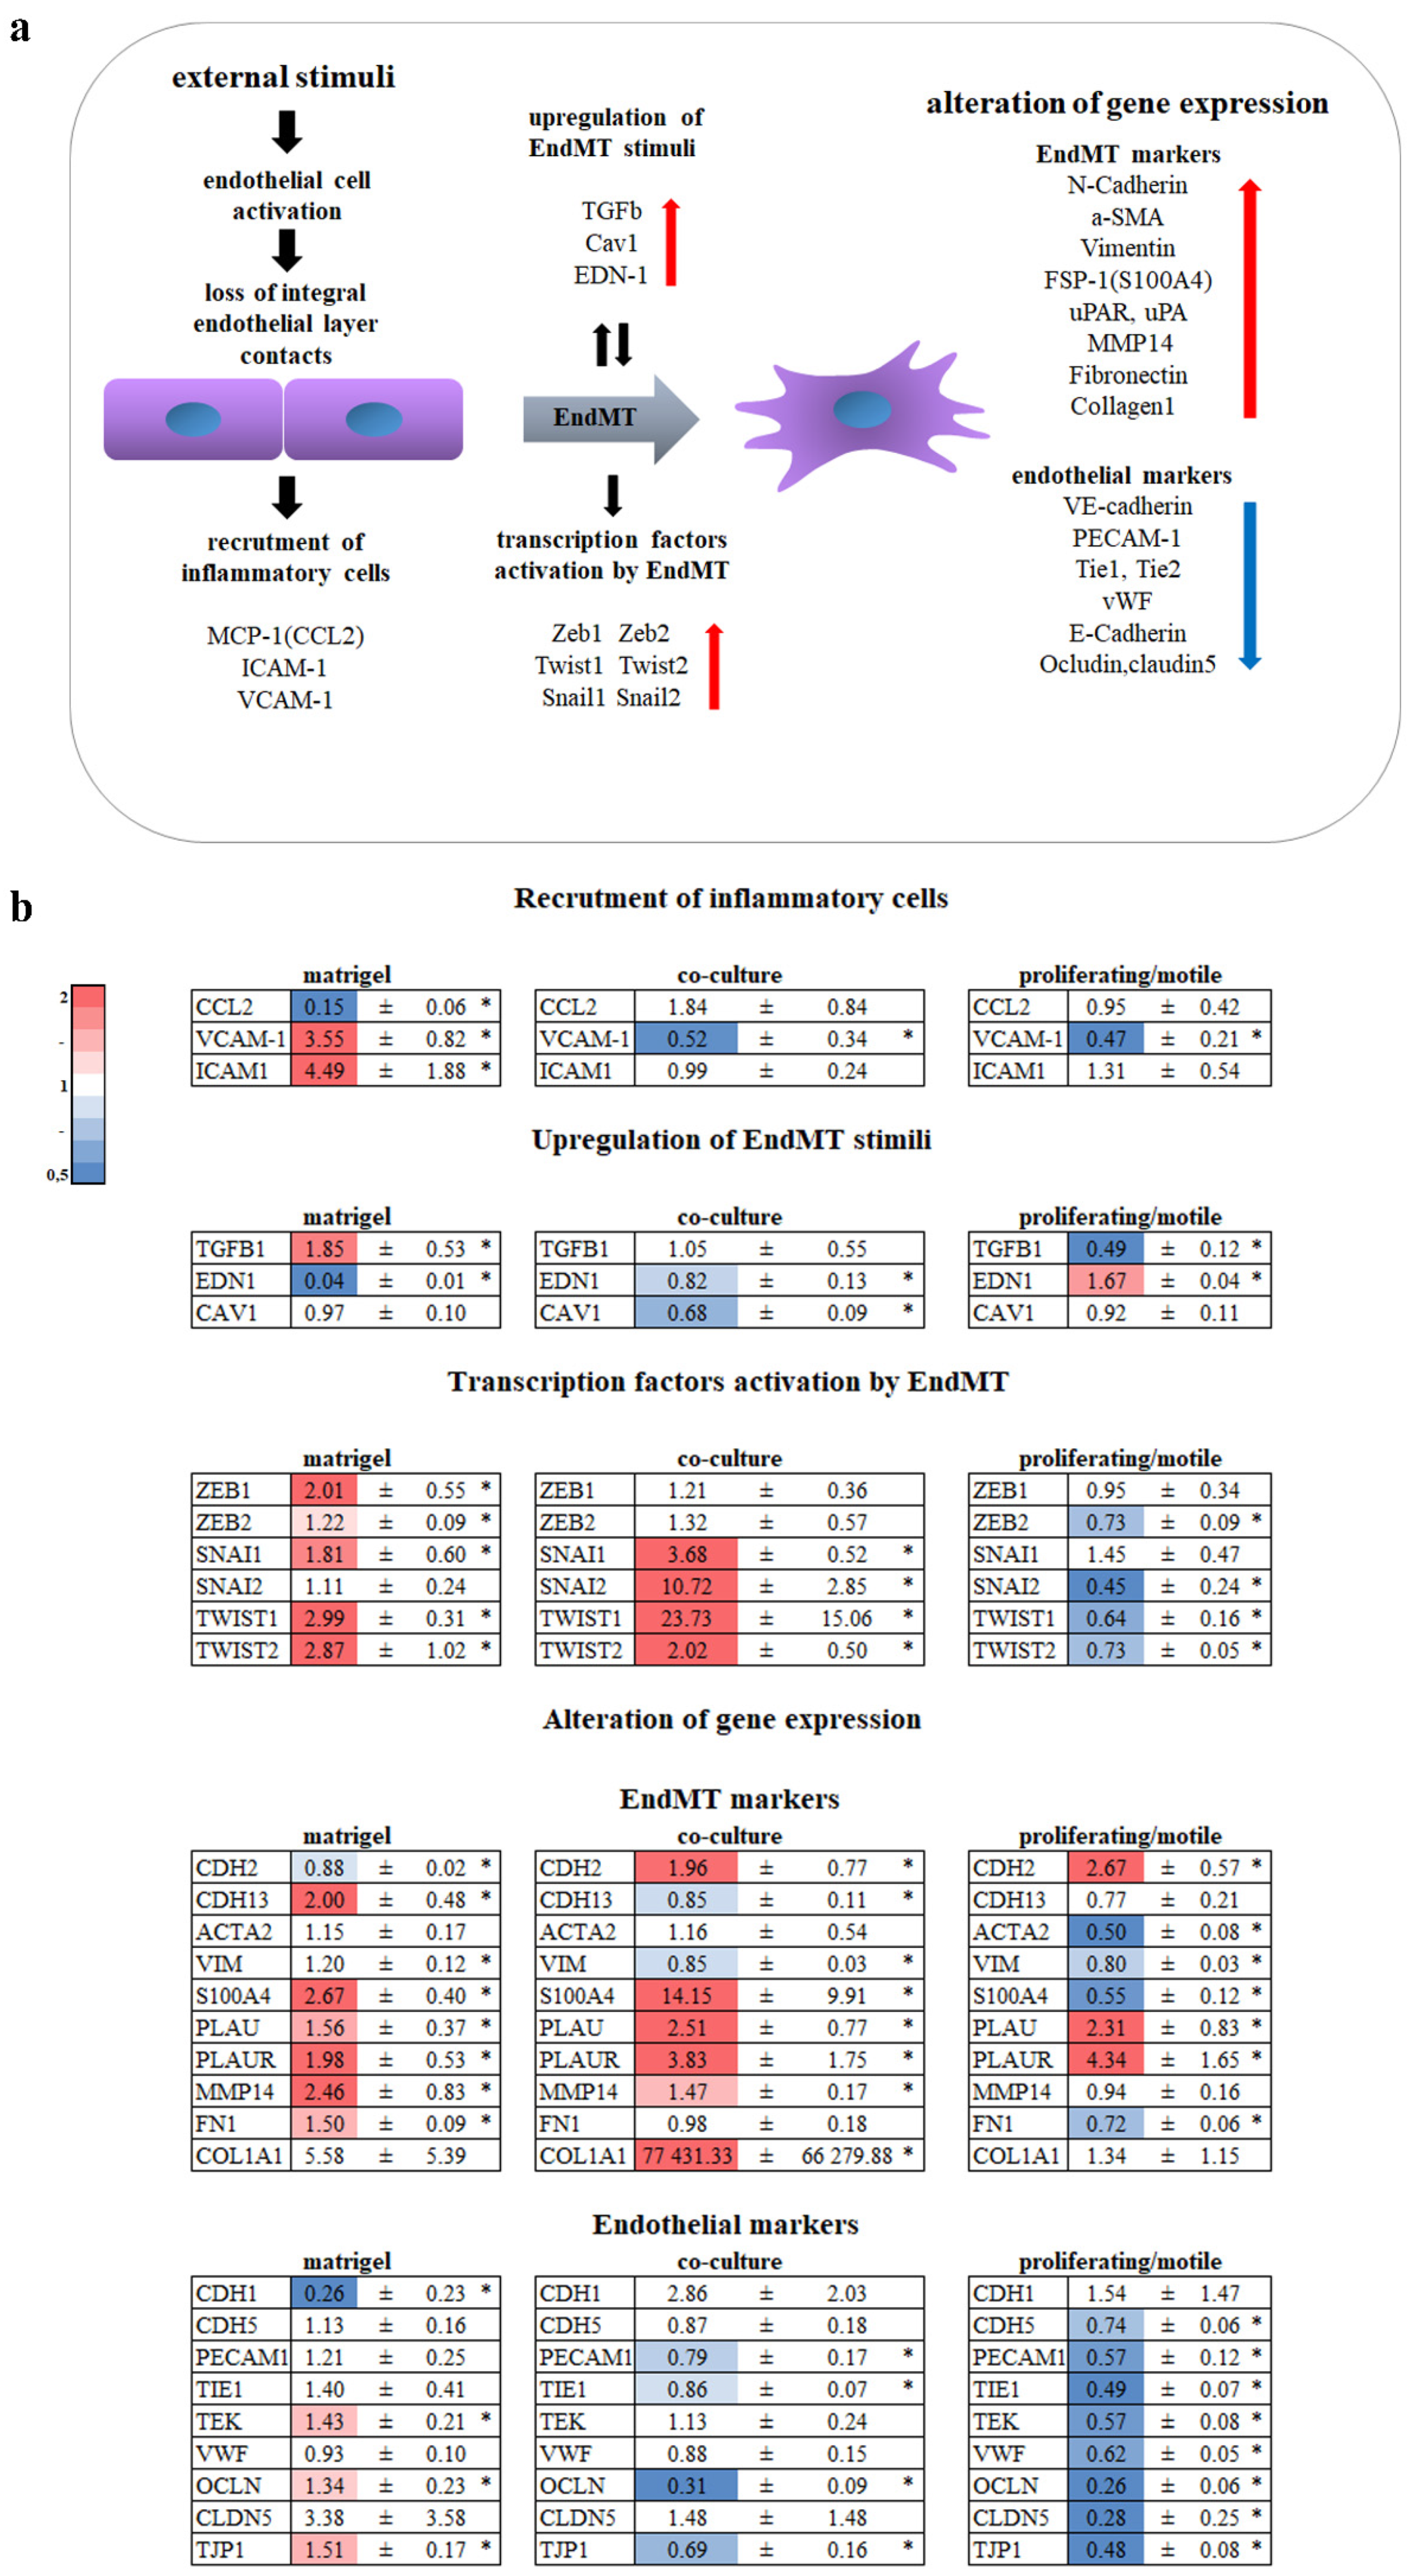
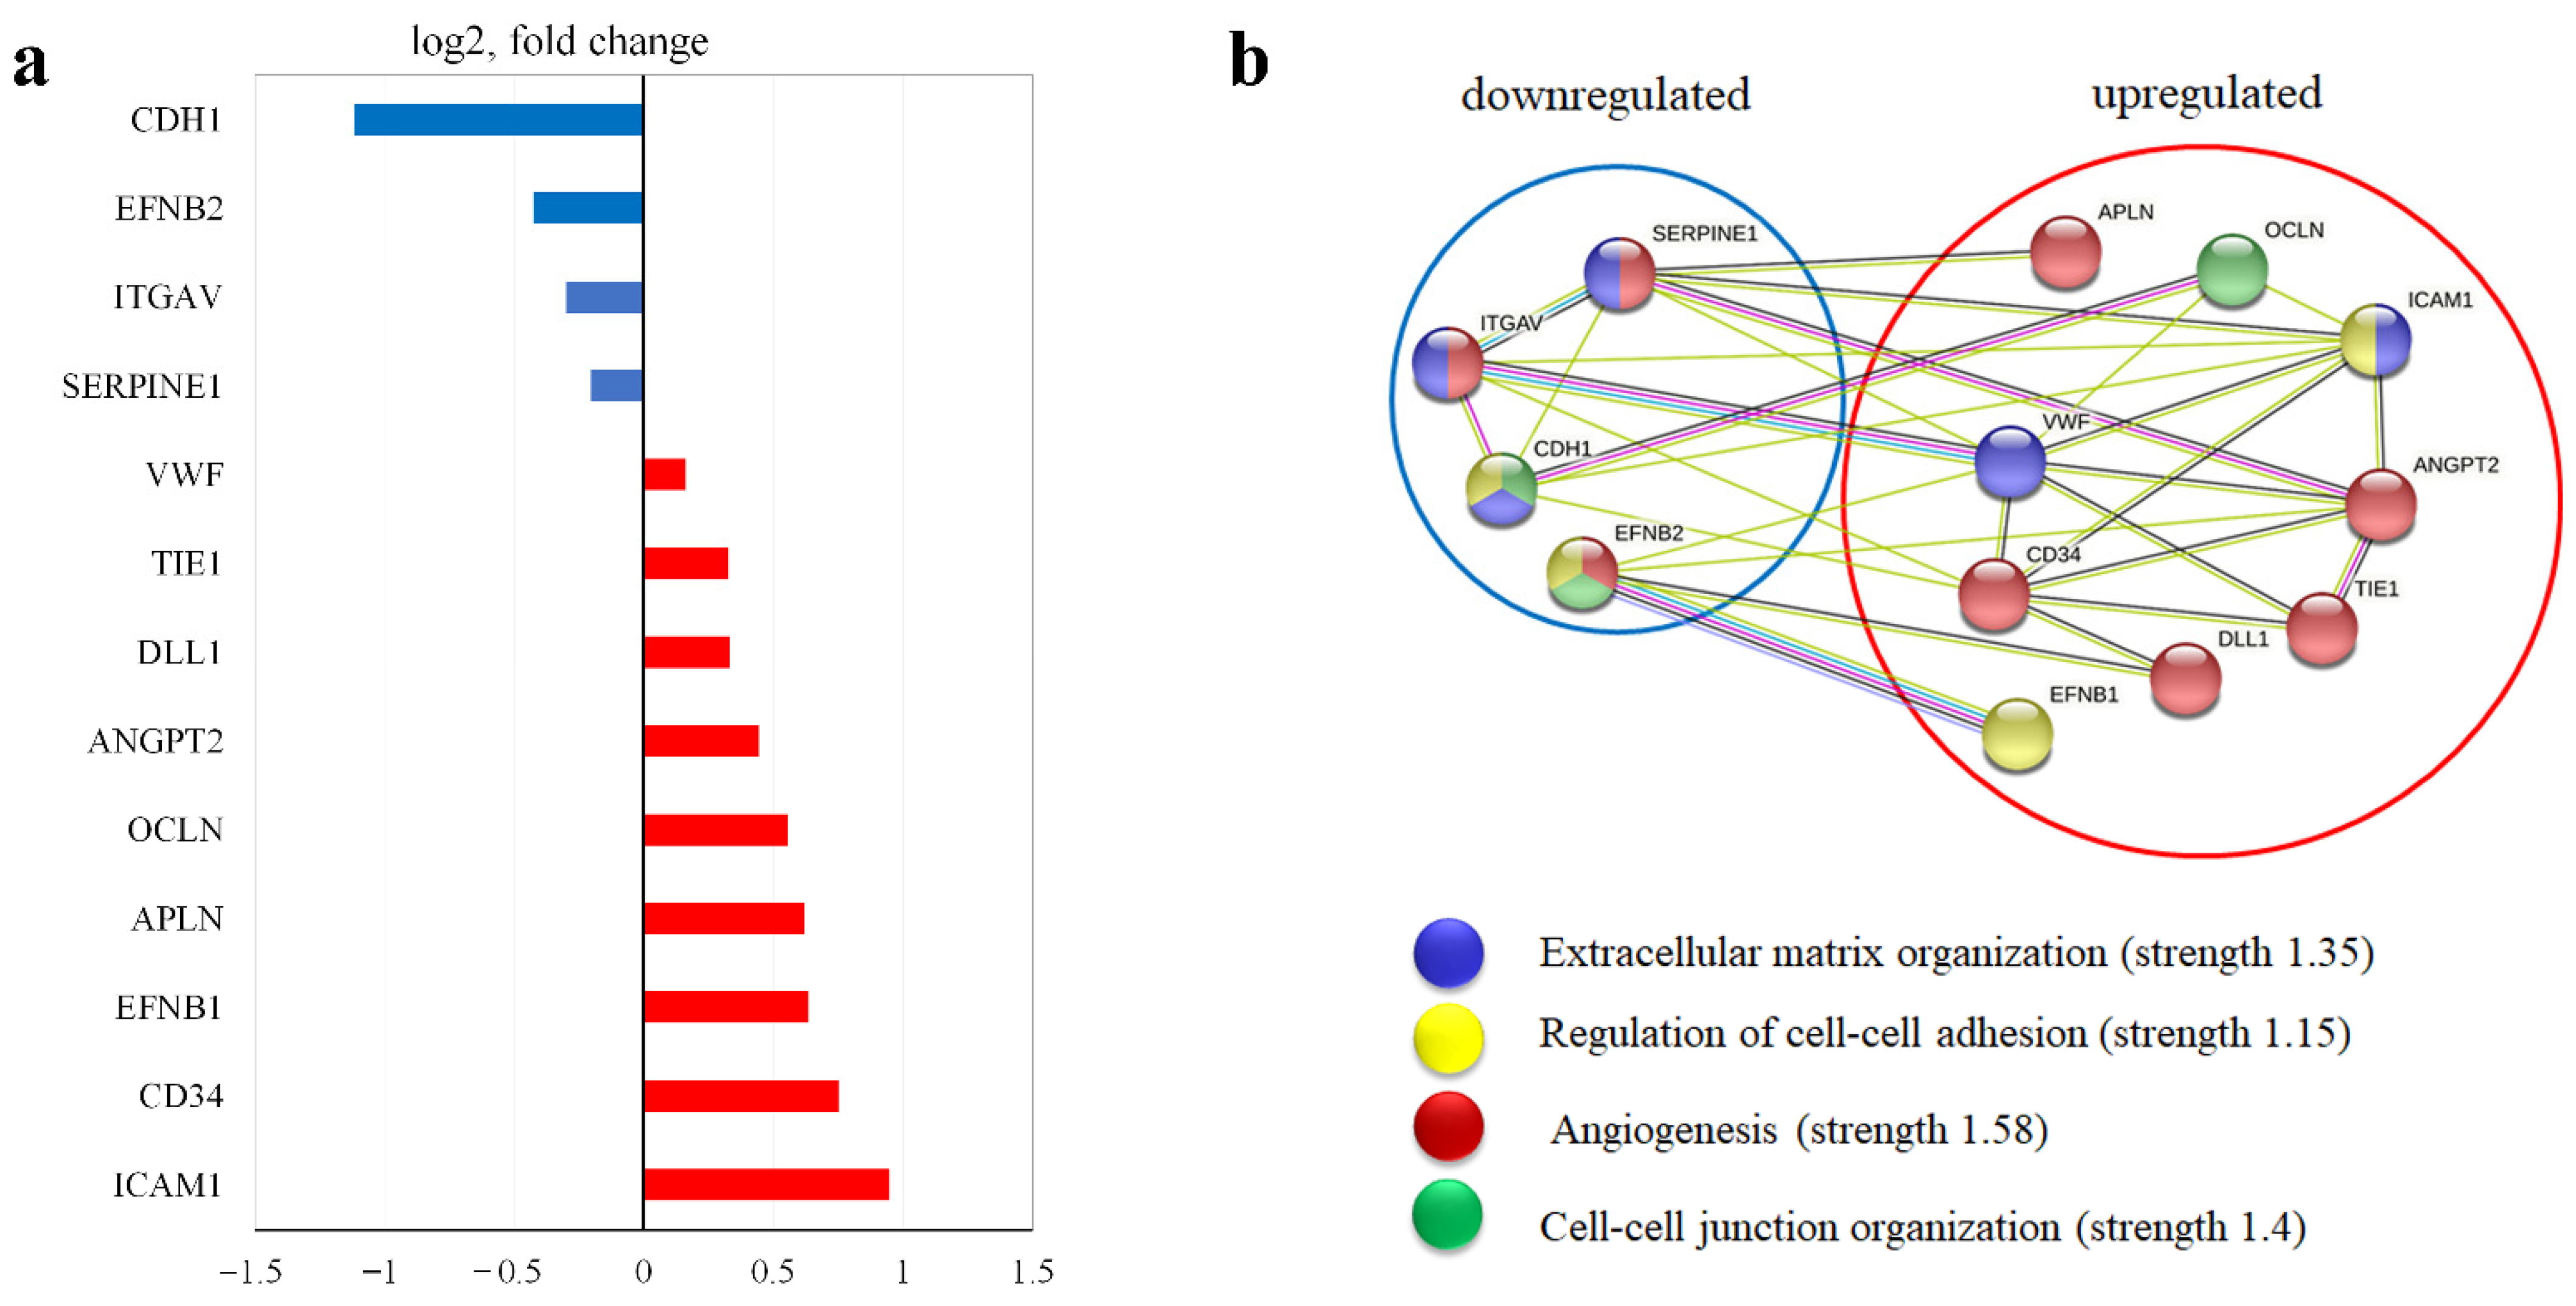
3.1. Endothelium Activation
3.2. EndMT
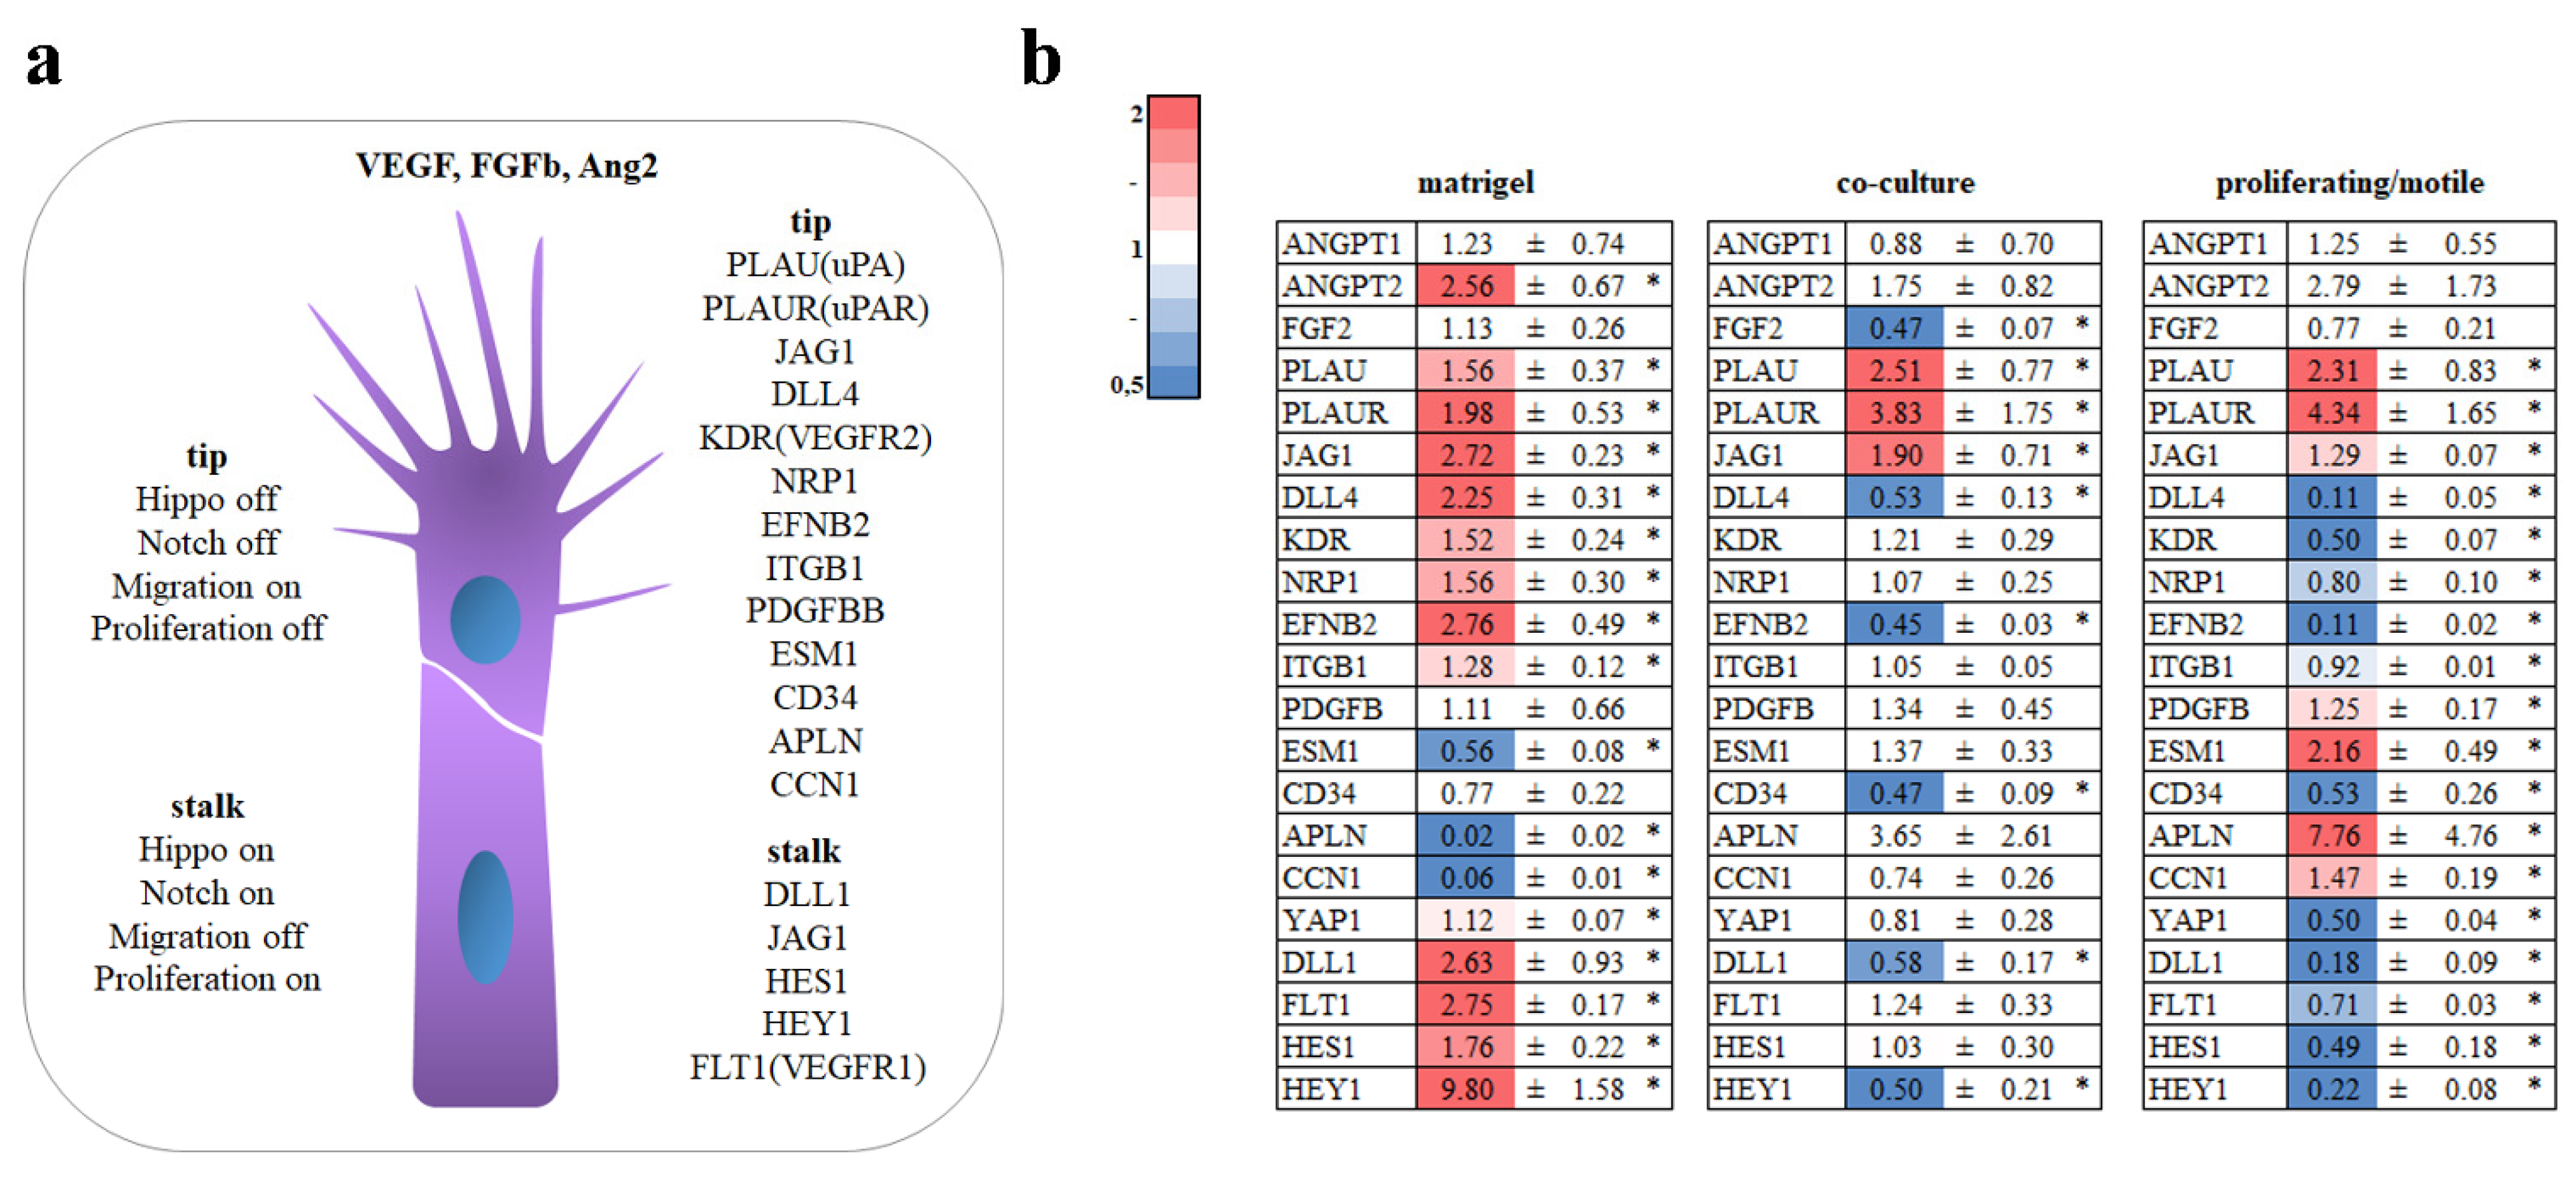
3.3. Tip Cell
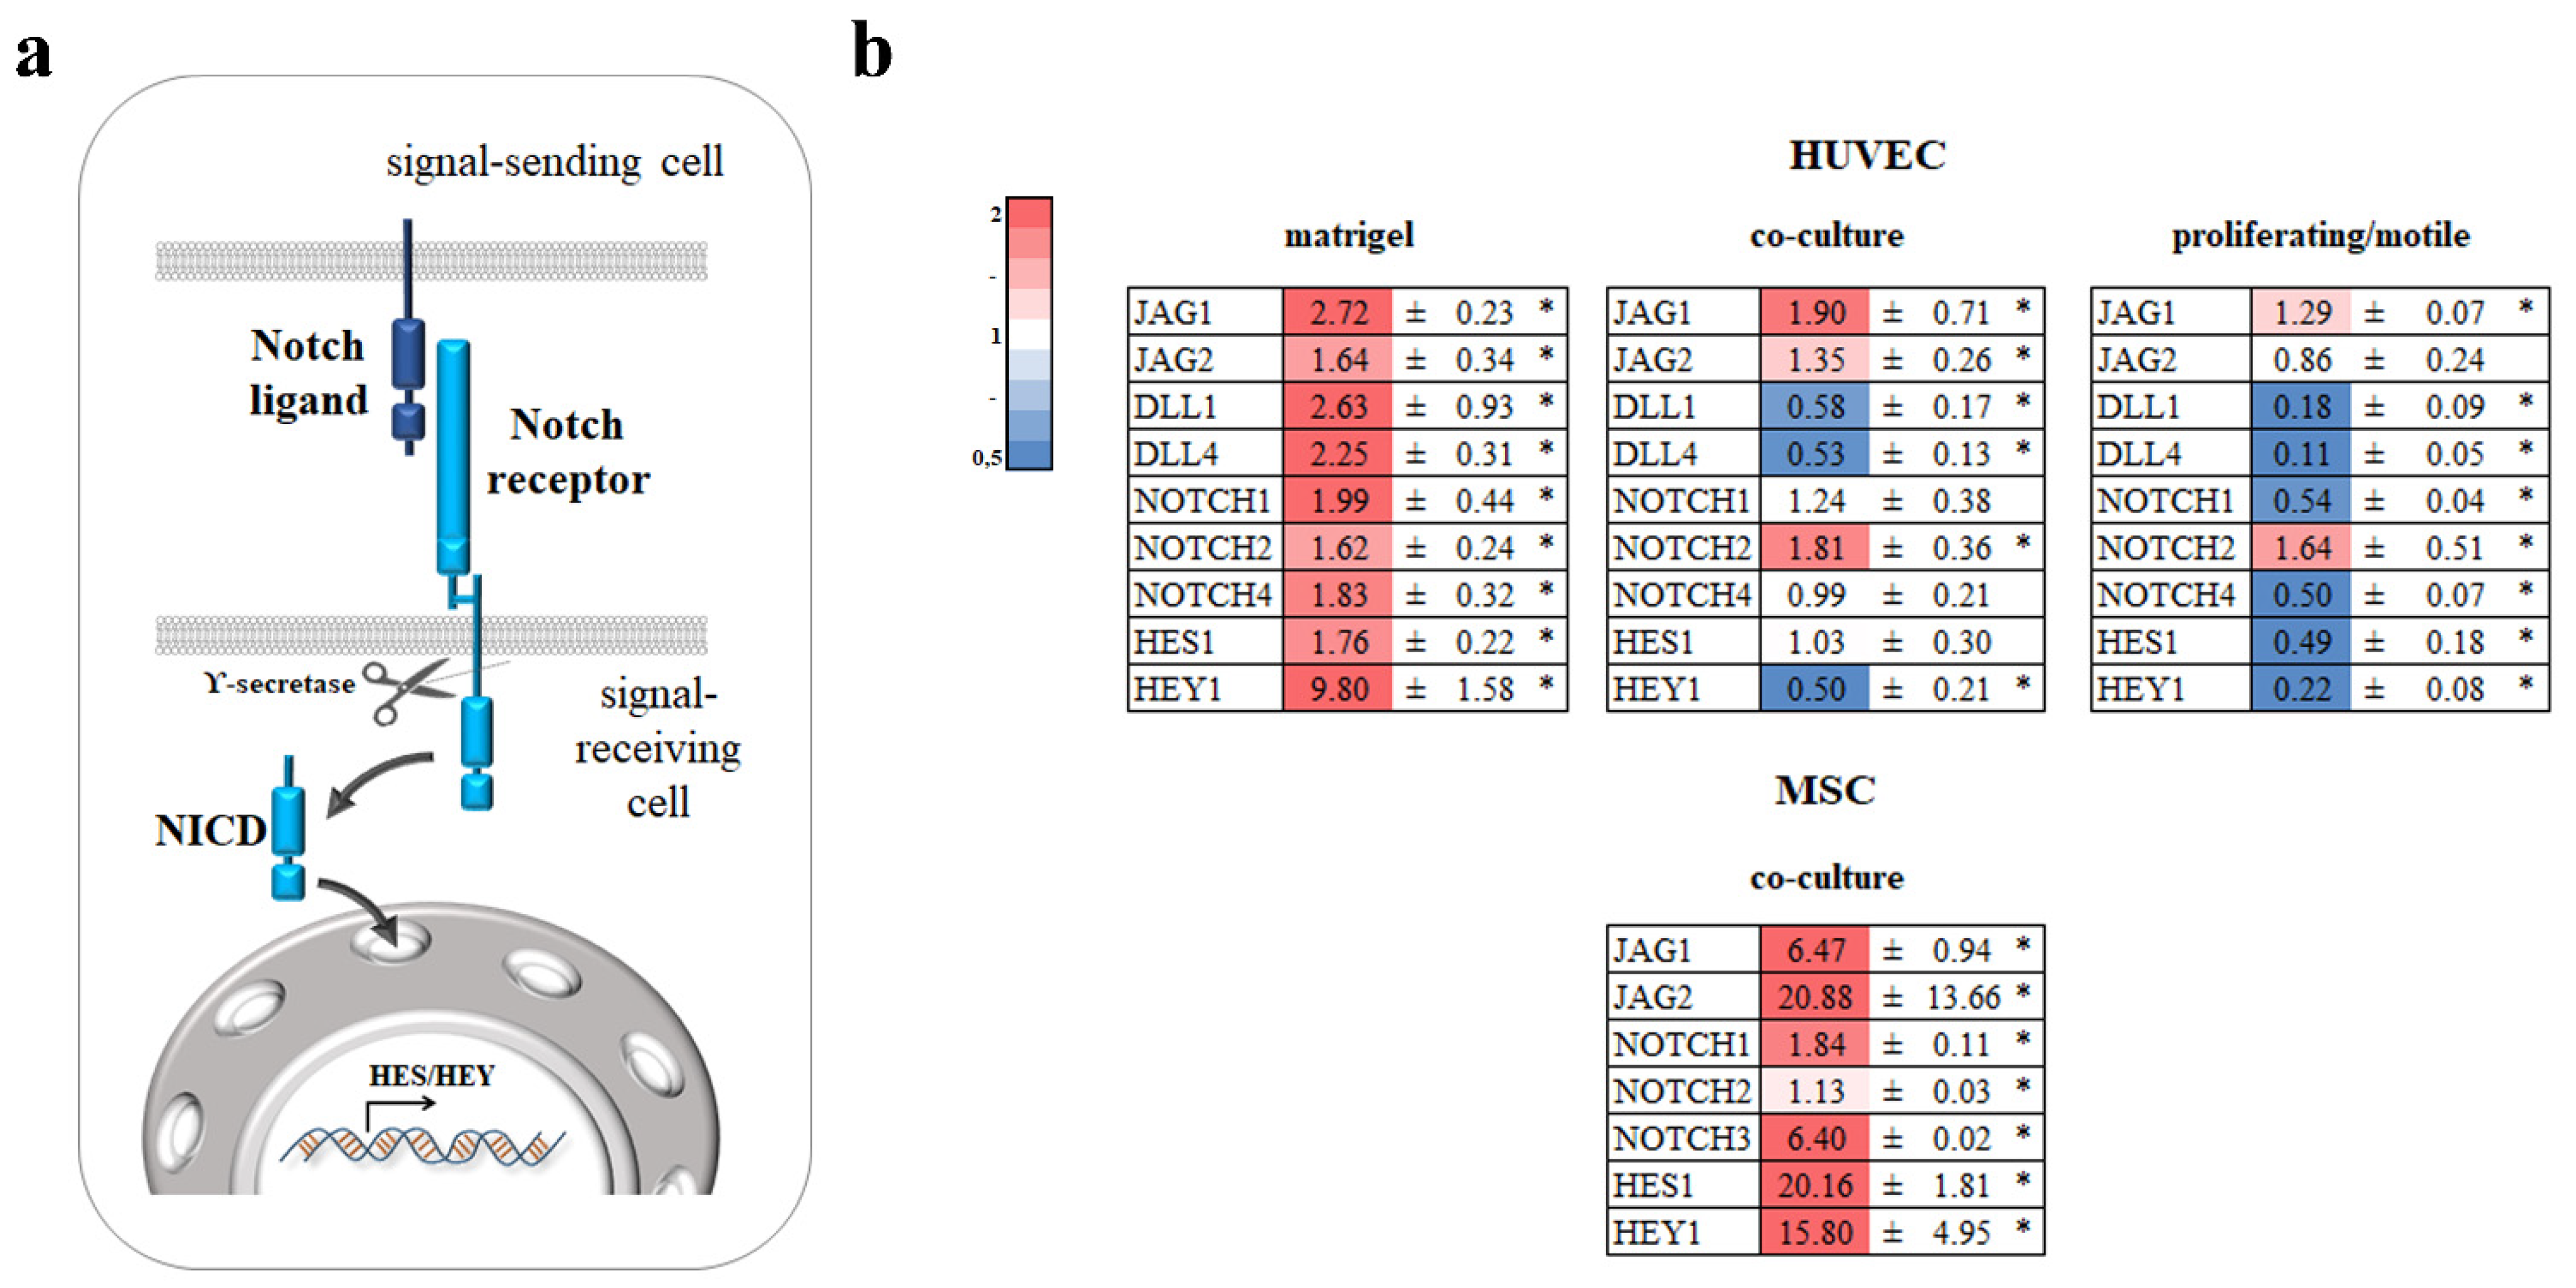
3.4. Notch
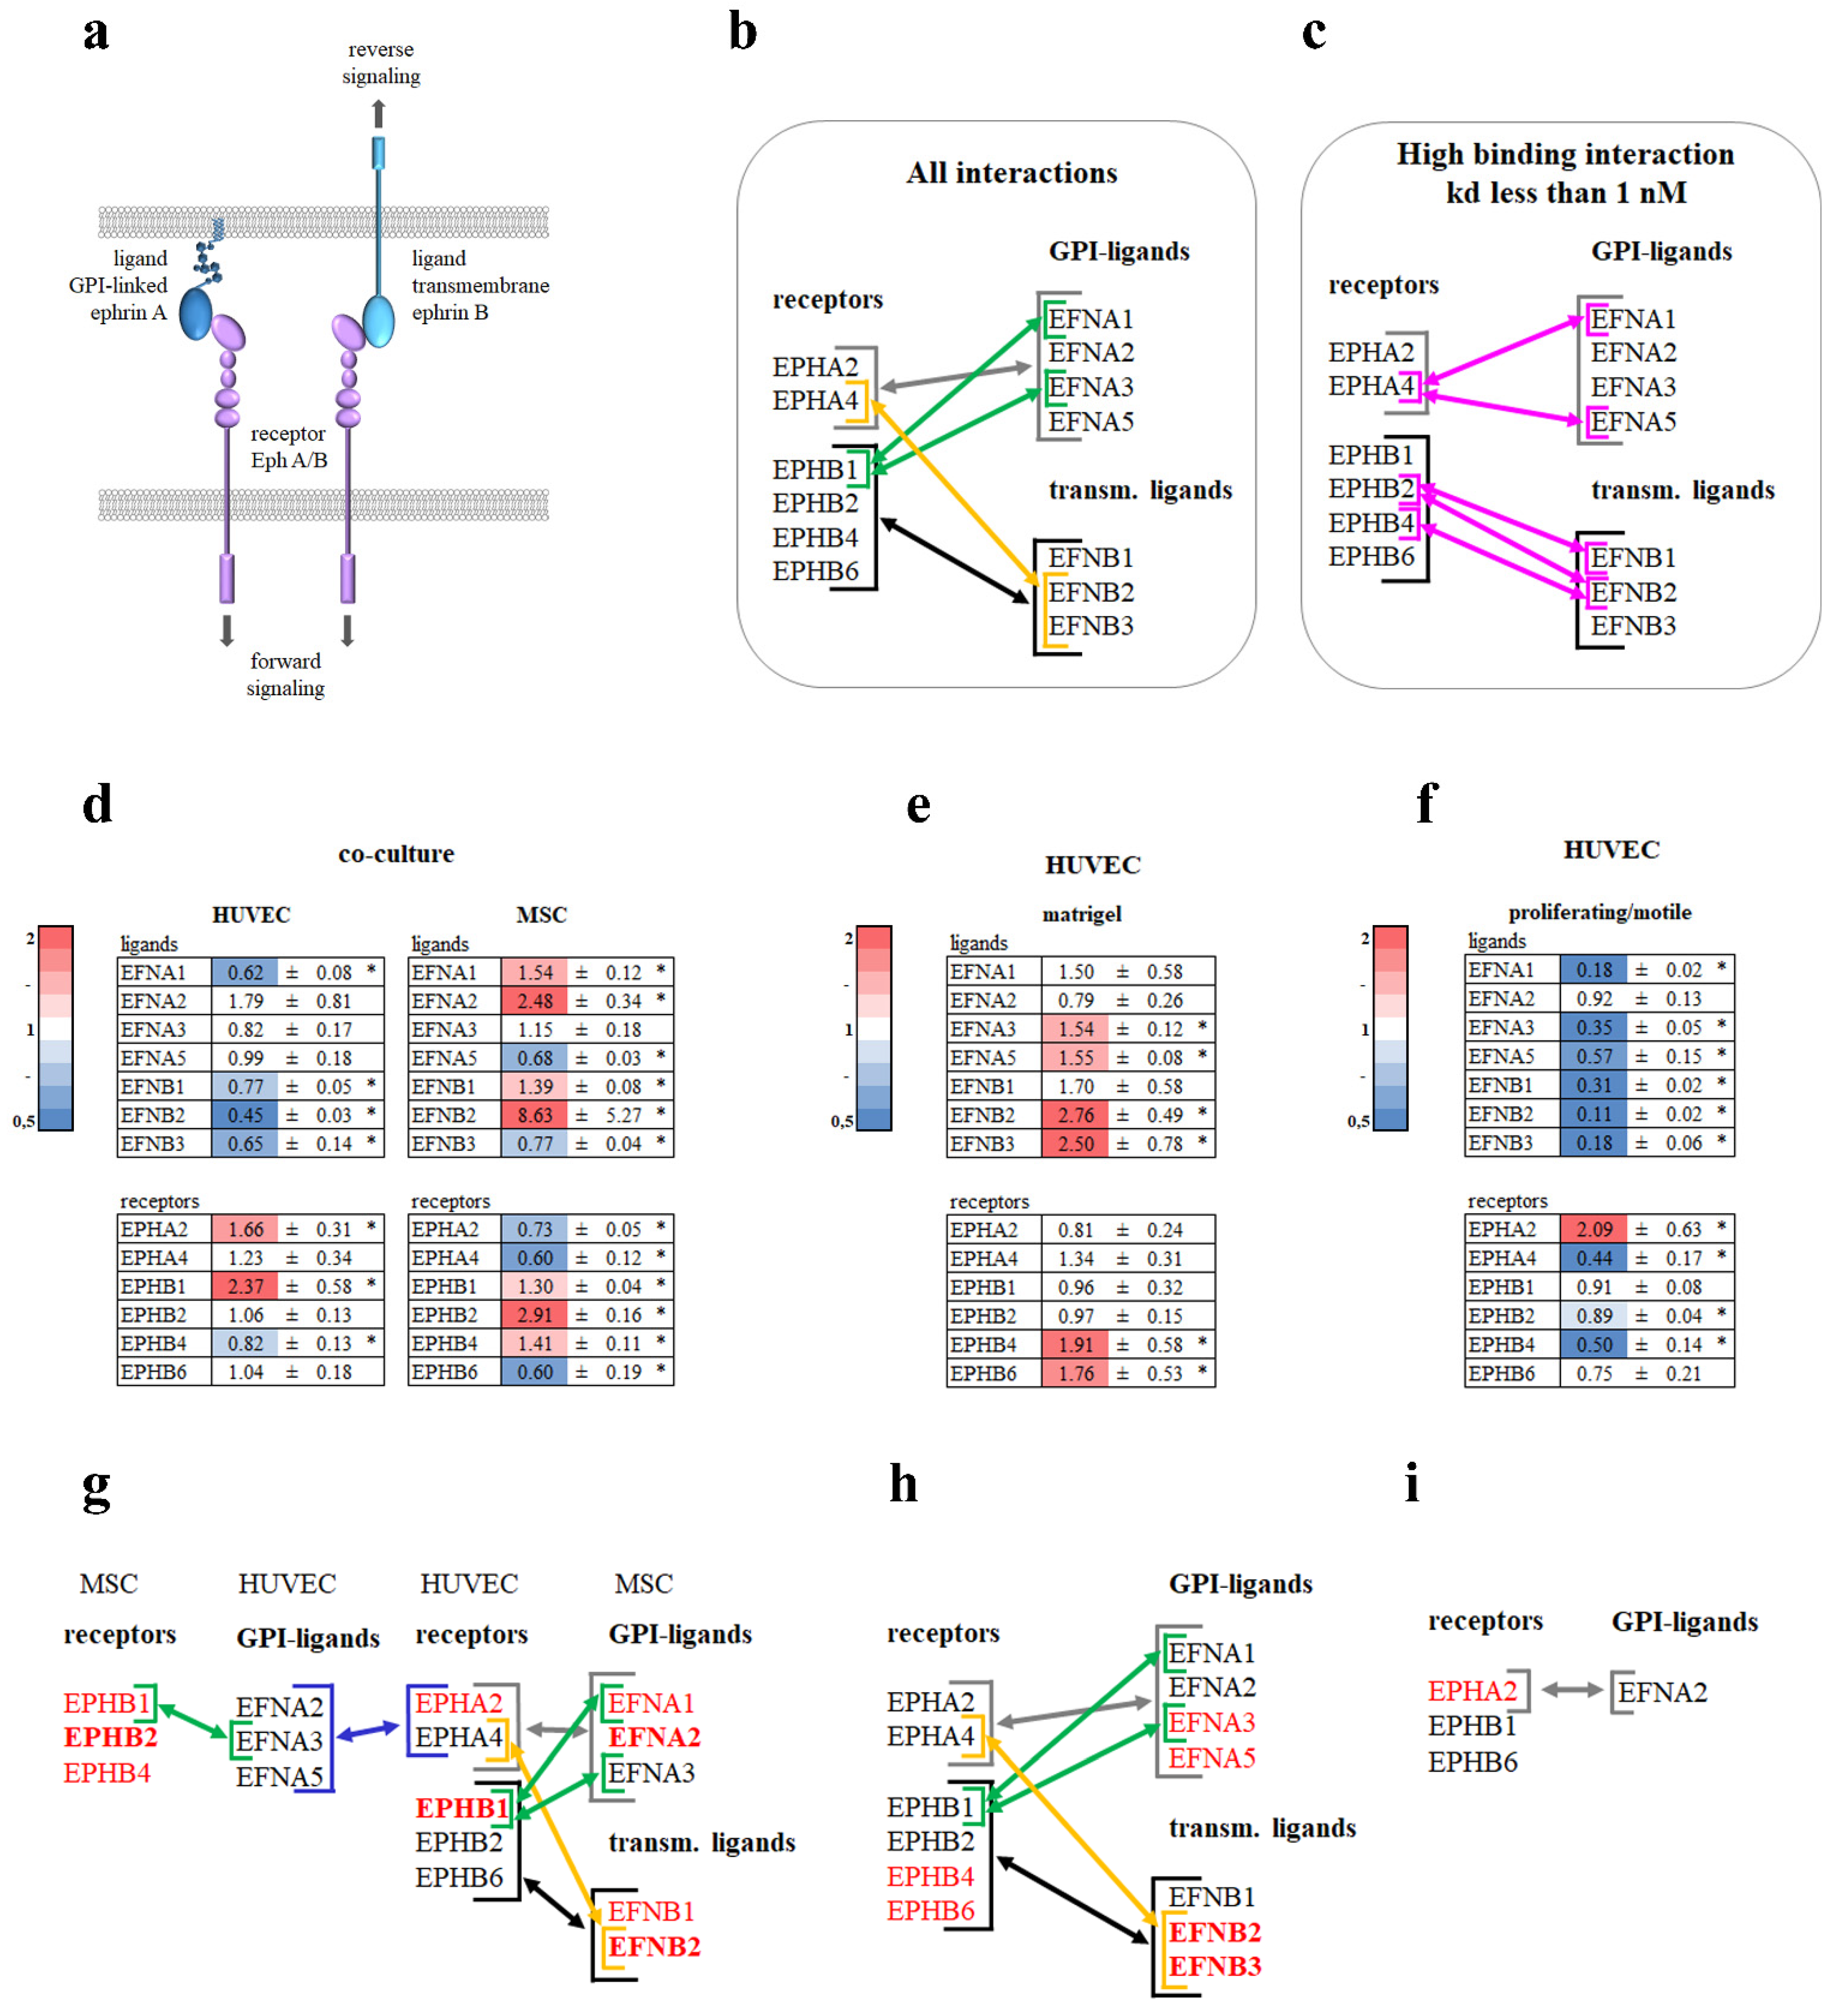
3.5. Ephrin–Eph Signaling Pathway
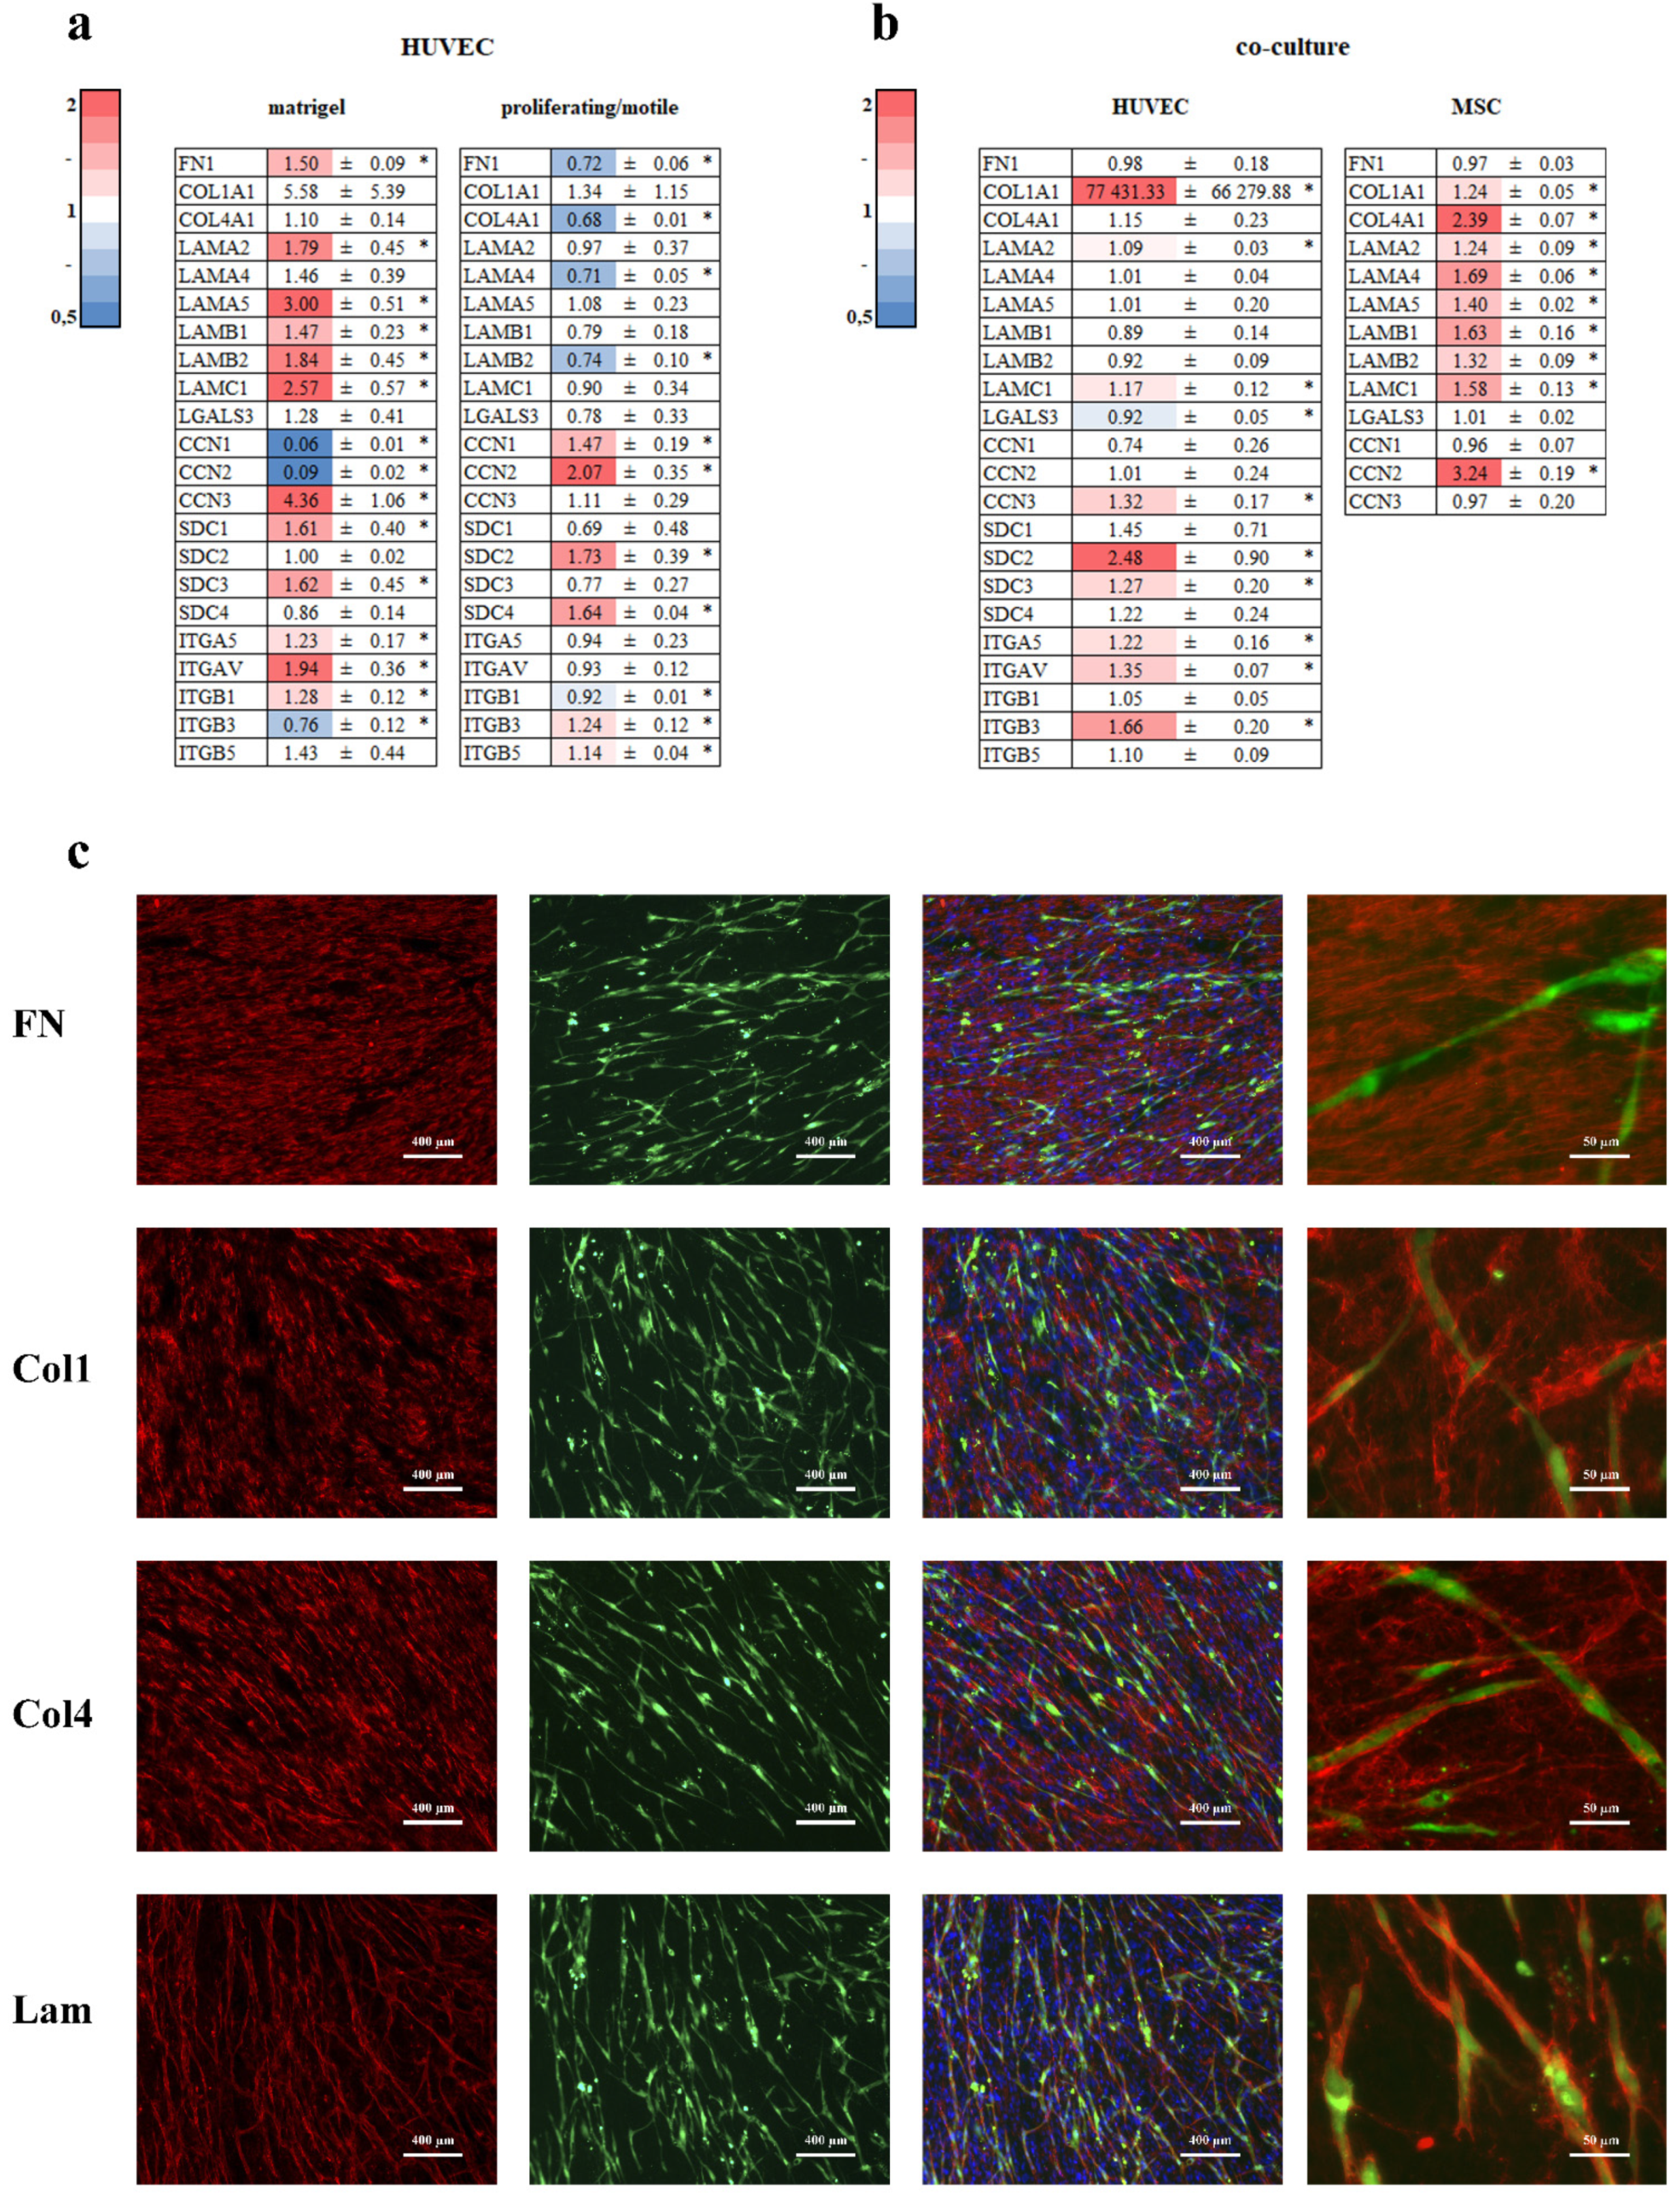
3.6. Extracellular Matrix
3.7. Prep1
4. Discussion
- Apelin, which is thought to promote cell growth [54], was downregulated in ECs on MatrigelTM and was upregulated in dividing/migrating ECs.
- ESM-1 (endocan) is associated with filopodia in tip cells [15]. It was downregulated in ECs on MatrigelTM and upregulated in dividing/migrating ECs.
- EDN1 is an autocrine stimulus of EC proliferation and migration [55] and was downregulated in ECs on MatrigelTM and upregulated in dividing/migrating ECs.
- Junction proteins TJP1 and OCLN were upregulated in ECs on MatrigelTM and downregulated in ECs in co-culture and in dividing/migrating ECs.
- TIE2 (TEK), which provides endothelial quiescence, was upregulated in ECs on MatrigelTM and downregulated in ECs in co-culture.
Author Contributions
Funding
Institutional Review Board Statement
Informed Consent Statement
Data Availability Statement
Conflicts of Interest
Abbreviations
| BM | basement membrane |
| EC | endothelial cell |
| EM | extracellular matrix |
| EMT | epithelial-to-mesenchymal transition |
| EndMT | endothelial-to-mesenchymal transition |
| ETN | endothelial tubular network |
| GF | growth factors |
| HUVEC | human umbilical vein endothelial cell |
| MSC | mesenchymal stromal cell |
References
- Kubota, Y.; Kleinman, H.K.; Martin, G.R.; Lawley, T.J. Role of Laminin and Basement Membrane in the Morphological Differentiation of Human Endothelial Cells into Capillary-like Structures. J. Cell Biol. 1988, 107, 1589–1598. [Google Scholar] [CrossRef] [PubMed] [Green Version]
- Corning Matrigel Matrix Frequently Asked Questions. Corning Incorporated Life Sciences. 2021. Available online: https://www.corning.com/catalog/cls/documents/faqs/CLS-DL-CC-026.pdf (accessed on 6 September 2022).
- Pozzi, A.; Yurchenco, P.D.; Iozzo, R.V. The Nature and Biology of Basement Membranes. Matrix Biol. 2017, 57–58, 1–11. [Google Scholar] [CrossRef] [PubMed] [Green Version]
- Beloglazova, I.; Stepanova, V.; Zubkova, E.; Dergilev, K.; Koptelova, N.; Tyurin-Kuzmin, P.A.; Dyikanov, D.; Plekhanova, O.; Cines, D.B.; Mazar, A.P.; et al. Mesenchymal Stromal Cells Enhance Self-Assembly of a HUVEC Tubular Network through UPA-UPAR/VEGFR2/Integrin/NOTCH Crosstalk. Biochim. Biophys. Acta-Mol. Cell Res. 2022, 1869, 119157. [Google Scholar] [CrossRef] [PubMed]
- Merfeld-Clauss, S.; Gollahalli, N.; March, K.L.; Traktuev, D.O. Adipose Tissue Progenitor Cells Directly Interact with Endothelial Cells to Induce Vascular Network Formation. Tissue Eng.-Part A 2010, 16, 2953–2966. [Google Scholar] [CrossRef] [Green Version]
- Baudin, B.; Bruneel, A.; Bosselut, N.; Vaubourdolle, M. A Protocol for Isolation and Culture of Human Umbilical Vein Endothelial Cells. Nat. Protoc. 2007, 2, 481–485. [Google Scholar] [CrossRef]
- Dergilev, K.V.; Tsokolaeva, Z.I.; Beloglazova, I.B.; Vasilets, Y.D.; Traktuev, D.O.; Kulbitsky, N.B.; Parfenova, E.V. Role of Urokinase-Type Plasminogen Activator Receptor in the Regulation of Angiogenic Properties of Sca1+ Vasculogenic Progenitor Cells. Obs. Reanimatol. 2022, 18, 76–82. [Google Scholar] [CrossRef]
- Babicki, S.; Arndt, D.; Marcu, A.; Liang, Y.; Grant, J.R.; Maciejewski, A.; Wishart, D.S. Heatmapper: Web-Enabled Heat Mapping for All. Nucleic Acids Res. 2016, 44, W147–W153. [Google Scholar] [CrossRef]
- Szklarczyk, D.; Gable, A.L.; Lyon, D.; Junge, A.; Wyder, S.; Huerta-Cepas, J.; Simonovic, M.; Doncheva, N.T.; Morris, J.H.; Bork, P.; et al. STRING V11: Protein-Protein Association Networks with Increased Coverage, Supporting Functional Discovery in Genome-Wide Experimental Datasets. Nucleic Acids Res. 2019, 47, D607–D613. [Google Scholar] [CrossRef] [Green Version]
- Ranta, V.; Mikkola, T.; Ylikorkala, O.; Viinikka, L.; Orpana, A. Reduced Viability of Human Vascular Endothelial Cells Cultured on Matrigel. J. Cell Physiol. 1998, 176, 92–98. [Google Scholar] [CrossRef]
- Kalucka, J.; Bierhansl, L.; Wielockx, B.; Carmeliet, P.; Eelen, G. Interaction of Endothelial Cells with Macrophages—Linking Molecular and Metabolic Signaling. Pflug. Arch. Eur. J. Physiol. 2017, 469, 473–483. [Google Scholar] [CrossRef]
- Welch-Reardon, K.M.; Wu, N.; Hughes, C.C.W. A Role for Partial Endothelial-Mesenchymal Transitions in Angiogenesis? Arterioscler. Thromb. Vasc. Biol. 2015, 35, 303–308. [Google Scholar] [CrossRef] [PubMed] [Green Version]
- Fang, J.S.; Hultgren, N.W.; Hughes, C.C.W. Regulation of Partial and Reversible Endothelial-to-Mesenchymal Transition in Angiogenesis. Front. Cell Dev. Biol. 2021, 9, 702021. [Google Scholar] [CrossRef] [PubMed]
- Sun, X.; Nkennor, B.; Mastikhina, O.; Soon, K.; Nunes, S.S. Endothelium-Mediated Contributions to Fibrosis. Semin. Cell Dev. Biol. 2020, 101, 78–86. [Google Scholar] [CrossRef] [PubMed]
- Del Toro, R.; Prahst, C.; Mathivet, T.; Siegfried, G.; Kaminker, J.S.; Larrivee, B.; Breant, C.; Duarte, A.; Takakura, N.; Fukamizu, A.; et al. Identification and Functional Analysis of Endothelial Tip Cell-Enriched Genes. Blood 2010, 116, 4025–4033. [Google Scholar] [CrossRef] [PubMed] [Green Version]
- Deckelbaum, R.A.; Lobov, I.B.; Cheung, E.; Halasz, G.; Rajamani, S.; Lerner, J.; Tong, C.; Li, Z.; Boland, P.; Dominguez, M.; et al. The Potassium Channel Kcne3 Is a VEGFA-Inducible Gene Selectively Expressed by Vascular Endothelial Tip Cells. Angiogenesis 2020, 23, 179–192. [Google Scholar] [CrossRef] [PubMed] [Green Version]
- Park, M.-H.; Kim, A.K.; Manandhar, S.; Oh, S.-Y.; Jang, G.-H.; Kang, L.; Lee, D.-W.; Hyeon, D.Y.; Lee, S.-H.; Lee, H.E.; et al. CCN1 Interlinks Integrin and Hippo Pathway to Autoregulate Tip Cell Activity. Elife 2019, 8, e46012. [Google Scholar] [CrossRef]
- Dergilev, K.V.; Zubkova, E.S.; Beloglazova, I.B.; Menshikov, M.Y.; Parfyonova, E.V. Notch Signal Pathway-Therapeutic Target for Regulation of Reparative Processes in the Heart. Ter. Arkh. 2018, 90, 112–121. [Google Scholar] [CrossRef]
- Rundle, C.H.; Xing, W.; Lau, K.-H.W.; Mohan, S. Bidirectional Ephrin Signaling in Bone. Osteoporos. Sarcopenia 2016, 2, 65–76. [Google Scholar] [CrossRef] [Green Version]
- Vreeken, D.; Zhang, H.; van Zonneveld, A.J.; van Gils, J.M. Ephs and Ephrins in Adult Endothelial Biology. Int. J. Mol. Sci. 2020, 21, 5623. [Google Scholar] [CrossRef]
- Tosato, G. Ephrin Ligands and Eph Receptors Contribution to Hematopoiesis. Cell. Mol. Life Sci. 2017, 74, 3377–3394. [Google Scholar] [CrossRef]
- Cimmino, I.; Margheri, F.; Prisco, F.; Perruolo, G.; D’esposito, V.; Laurenzana, A.; Fibbi, G.; Paciello, O.; Doti, N.; Ruvo, M.; et al. Prep1 Regulates Angiogenesis through a PGC-1A–Mediated Mechanism. FASEB J. 2019, 33, 13893–13904. [Google Scholar] [CrossRef] [PubMed] [Green Version]
- Kristensen, P.; Larsson, L.I.; Nielsen, L.S.; Grøndahl-Hansen, J.; Andreasen, P.A.; Danø, K. Human Endothelial Cells Contain One Type of Plasminogen Activator. FEBS Lett. 1984, 168, 33–37. [Google Scholar] [CrossRef] [Green Version]
- Brunner, P.M.; Heier, P.C.; Mihaly-Bison, J.; Priglinger, U.; Binder, B.R.; Prager, G.W. Density Enhanced Phosphatase-1 down-Regulates Urokinase Receptor Surface Expression in Confluent Endothelial Cells. Blood 2011, 117, 4154–4161. [Google Scholar] [CrossRef] [PubMed] [Green Version]
- Blanco, R.; Gerhardt, H. VEGF and Notch in Tip and Stalk Cell Selection. Cold Spring Harb. Perspect. Med. 2013, 3, a006569. [Google Scholar] [CrossRef] [PubMed] [Green Version]
- Hofmann, J.J.; Iruela-Arispe, M.L. Notch Signaling in Blood Vessels: Who Is Talking to Whom about What? Circ. Res. 2007, 100, 1556–1568. [Google Scholar] [CrossRef] [Green Version]
- Rohlenova, K.; Goveia, J.; García-Caballero, M.; Subramanian, A.; Kalucka, J.; Treps, L.; Falkenberg, K.D.; de Rooij, L.P.M.H.; Zheng, Y.; Lin, L.; et al. Single-Cell RNA Sequencing Maps Endothelial Metabolic Plasticity in Pathological Angiogenesis. Cell Metab. 2020, 31, 862–877.e14. [Google Scholar] [CrossRef]
- Beloglazova, I.B.; Zubkova, E.S.; Dergilev, K.V.; Ratner, E.I.; Guseva, A.A.; Menshikov, M.Y.; Parfenova, Y.V. VEGF in regulation of non-canonical Notch signaling pathway in endothelial cells. Russ. Cardiol. Bull. 2022, 17, 33–39. [Google Scholar] [CrossRef]
- Tian, D.-Y.; Jin, X.-R.; Zeng, X.; Wang, Y. Notch Signaling in Endothelial Cells: Is It the Therapeutic Target for Vascular Neointimal Hyperplasia? Int. J. Mol. Sci. 2017, 18, 1615. [Google Scholar] [CrossRef] [Green Version]
- Liu, H.; Kennard, S.; Lilly, B. NOTCH3 Expression Is Induced in Mural Cells through an Autoregulatory Loop That Requires Endothelial-Expressed JAGGED1. Circ. Res. 2009, 104, 466–475. [Google Scholar] [CrossRef] [Green Version]
- Liu, Z.; Brunskill, E.; Varnum-Finney, B.; Zhang, C.; Zhang, A.; Jay, P.Y.; Bernstein, I.; Morimoto, M.; Kopan, R. The Intracellular Domains of Notch1 and Notch2 Are Functionally Equivalent during Development and Carcinogenesis. Development 2015, 142, 2452–2463. [Google Scholar] [CrossRef]
- Liu, Z.; Chen, S.; Boyle, S.; Zhu, Y.; Zhang, A.; Piwnica-Worms, D.R.; Ilagan, M.X.G.; Kopan, R. The Extracellular Domain of Notch2 Increases Its Cell-Surface Abundance and Ligand Responsiveness during Kidney Development. Dev. Cell 2013, 25, 585–598. [Google Scholar] [CrossRef] [Green Version]
- McDaniell, R.; Warthen, D.M.; Sanchez-Lara, P.A.; Pai, A.; Krantz, I.D.; Piccoli, D.A.; Spinner, N.B. NOTCH2 Mutations Cause Alagille Syndrome, a Heterogeneous Disorder of the Notch Signaling Pathway. Am. J. Hum. Genet. 2006, 79, 169–173. [Google Scholar] [CrossRef] [PubMed] [Green Version]
- Fukushima, K.; Murata, M.; Hachisuga, M.; Tsukimori, K.; Seki, H.; Takeda, S.; Kato, K.; Wake, N. Gene Expression Profiles by Microarray Analysis during Matrigel-Induced Tube Formation in a Human Extravillous Trophoblast Cell Line: Comparison with Endothelial Cells. Placenta 2008, 29, 898–904. [Google Scholar] [CrossRef] [PubMed]
- Wiedemann, E.; Jellinghaus, S.; Ende, G.; Augstein, A.; Sczech, R.; Wielockx, B.; Weinert, S.; Strasser, R.H.; Poitz, D.M. Regulation of Endothelial Migration and Proliferation by Ephrin-A1. Cell. Signal. 2017, 29, 84–95. [Google Scholar] [CrossRef] [PubMed] [Green Version]
- Zhang, X.Q.; Takakura, N.; Oike, Y.; Inada, T.; Gale, N.W.; Yancopoulos, G.D.; Suda, T. Stromal Cells Expressing Ephrin-B2 Promote the Growth and Sprouting of Ephrin-B2+ Endothelial Cells. Blood 2001, 98, 1028–1037. [Google Scholar] [CrossRef] [Green Version]
- Zhao, P.; Jiang, D.; Huang, Y.; Chen, C. EphA2: A Promising Therapeutic Target in Breast Cancer. J. Genet. Genomics 2021, 48, 261–267. [Google Scholar] [CrossRef]
- Adams, R.H.; Diella, F.; Hennig, S.; Helmbacher, F.; Deutsch, U.; Klein, R. The Cytoplasmic Domain of the Ligand EphrinB2 Is Required for Vascular Morphogenesis but Not Cranial Neural Crest Migration. Cell 2001, 104, 57–69. [Google Scholar] [CrossRef] [Green Version]
- Cowan, C.A.; Yokoyama, N.; Saxena, A.; Chumley, M.J.; Silvany, R.E.; Baker, L.A.; Srivastava, D.; Henkemeyer, M. Ephrin-B2 Reverse Signaling Is Required for Axon Pathfinding and Cardiac Valve Formation but Not Early Vascular Development. Dev. Biol. 2004, 271, 263–271. [Google Scholar] [CrossRef] [Green Version]
- Hultgren, N.W.; Fang, J.S.; Ziegler, M.E.; Ramirez, R.N.; Phan, D.T.T.; Hatch, M.M.S.; Welch-Reardon, K.M.; Paniagua, A.E.; Kim, L.S.; Shon, N.N.; et al. Slug Regulates the Dll4-Notch-VEGFR2 Axis to Control Endothelial Cell Activation and Angiogenesis. Nat. Commun. 2020, 11, 5400. [Google Scholar] [CrossRef]
- Fekete, N.; Béland, A.V.; Campbell, K.; Clark, S.L.; Hoesli, C.A. Bags versus Flasks: A Comparison of Cell Culture Systems for the Production of Dendritic Cell–Based Immunotherapies. Transfusion 2018, 58, 1800–1813. [Google Scholar] [CrossRef]
- Soofi, S.S.; Last, J.A.; Lliensiek, S.J.; Nealey, P.F.; Murphy, C.J. Elastic Modulus of Matrigel as Determined by AFM. J. Struct. Biol. 2009, 167, 216–219. [Google Scholar] [CrossRef] [PubMed] [Green Version]
- Stroka, K.M.; Aranda-Espinoza, H. Effects of Morphology vs. Cell-Cell Interactions on Endothelial Cell Stiffness. Cell. Mol. Bioeng. 2011, 4, 9–27. [Google Scholar] [CrossRef] [Green Version]
- Rüdiger, D.; Kick, K.; Goychuk, A.; Vollmar, A.M.; Frey, E.; Zahler, S. Cell-Based Strain Remodeling of a Nonfibrous Matrix as an Organizing Principle for Vasculogenesis. Cell Rep. 2020, 32, 108015. [Google Scholar] [CrossRef] [PubMed]
- Yousif, L.F.; Di Russo, J.; Sorokin, L. Laminin Isoforms in Endothelial and Perivascular Basement Membranes. Cell Adh. Migr. 2013, 7, 101–110. [Google Scholar] [CrossRef] [PubMed] [Green Version]
- Yamamoto, K.; Tanimura, K.; Watanabe, M.; Sano, H.; Uwamori, H.; Mabuchi, Y.; Matsuzaki, Y.; Chung, S.; Kamm, R.D.; Tanishita, K.; et al. Construction of Continuous Capillary Networks Stabilized by Pericyte-like Perivascular Cells. Tissue Eng. Part A 2019, 25, 499–510. [Google Scholar] [CrossRef] [Green Version]
- Kalluri, R. Basement Membranes: Structure, Assembly and Role in Tumour Angiogenesis. Nat. Rev. Cancer 2003, 3, 422–433. [Google Scholar] [CrossRef]
- Stenzel, D.; Franco, C.A.; Estrach, S.; Mettouchi, A.; Sauvaget, D.; Rosewell, I.; Schertel, A.; Armer, H.; Domogatskaya, A.; Rodin, S.; et al. Endothelial Basement Membrane Limits Tip Cell Formation by Inducing Dll4/Notch Signalling in Vivo. EMBO Rep. 2011, 12, 1135–1143. [Google Scholar] [CrossRef] [Green Version]
- Mongiat, M.; Andreuzzi, E.; Tarticchio, G.; Paulitti, A. Extracellular Matrix, a Hard Player in Angiogenesis. Int. J. Mol. Sci. 2016, 17, 1822. [Google Scholar] [CrossRef] [Green Version]
- Alexopoulou, A.N.; Multhaupt, H.A.B.; Couchman, J.R. Syndecans in Wound Healing, Inflammation and Vascular Biology. Int. J. Biochem. Cell Biol. 2007, 39, 505–528. [Google Scholar] [CrossRef]
- Ricard, N.; Bailly, S.; Guignabert, C.; Simons, M. The Quiescent Endothelium: Signalling Pathways Regulating Organ-Specific Endothelial Normalcy. Nat. Rev. Cardiol. 2021, 18, 565–580. [Google Scholar] [CrossRef]
- Nakashima, Y.; Raines, E.W.; Plump, A.S.; Breslow, J.L.; Ross, R. Upregulation of VCAM-1 and ICAM-1 at Atherosclerosis-Prone Sites on the Endothelium in the ApoE-Deficient Mouse. Arterioscler. Thromb. Vasc. Biol. 1998, 18, 842–851. [Google Scholar] [CrossRef] [PubMed] [Green Version]
- Glesne, D.A.; Zhang, W.; Mandava, S.; Ursos, L.; Buell, M.E.; Makowski, L.; Rodi, D.J. Subtractive Transcriptomics: Establishing Polarity Drives in Vitro Human Endothelial Morphogenesis. Cancer Res. 2006, 66, 4030–4040. [Google Scholar] [CrossRef] [Green Version]
- Masri, B.; Morin, N.; Cornu, M.; Knibiehler, B.; Audigier, Y. Apelin (65–77) Activates P70 S6 Kinase and Is Mitogenic for Umbilical Endothelial Cells. FASEB J. Off. Publ. Fed. Am. Soc. Exp. Biol. 2004, 18, 1909–1911. [Google Scholar] [CrossRef] [PubMed]
- Salani, D.; Taraboletti, G.; Rosanò, L.; Di Castro, V.; Borsotti, P.; Giavazzi, R.; Bagnato, A. Endothelin-1 Induces an Angiogenic Phenotype in Cultured Endothelial Cells and Stimulates Neovascularization In Vivo. Am. J. Pathol. 2000, 157, 1703–1711. [Google Scholar] [CrossRef] [Green Version]
- Arnaoutova, I.; George, J.; Kleinman, H.K.; Benton, G. The Endothelial Cell Tube Formation Assay on Basement Membrane Turns 20: State of the Science and the Art. Angiogenesis 2009, 12, 267–274. [Google Scholar] [CrossRef] [PubMed]
- Sieminski, A.L.; Hebbel, R.P.; Gooch, K.J. Improved Microvascular Network In Vitro by Human Blood Outgrowth Endothelial Cells Relative to Vessel-Derived Endothelial Cells. Tissue Eng. 2005, 11, 1332–1345. [Google Scholar] [CrossRef]
- Lidington, E.A.; Moyes, D.L.; McCormack, A.M.; Rose, M.L. A Comparison of Primary Endothelial Cells and Endothelial Cell Lines for Studies of Immune Interactions. Transpl. Immunol. 1999, 7, 239–246. [Google Scholar] [CrossRef]


| Gene Name | Forward | Reverse |
|---|---|---|
| ACTB | cctggcacccagcacaat | gggccggactcgtcatac |
| ACTA2 | aagaggaatcctgaccctgaa | gccagatcttttccatgtcg |
| APLN | gtctcctccatagattggtctgc | ggaatcatccaaactacagccag |
| CAV1 | catcccgatggcactcatctg | tgcactgaatctcaatcaggaag |
| CCL2 | cagccagatgcaatcaatgcc | tggaatcctgaacccacttct |
| CCN1 | ccctcgcggcttaccgactgg | cacaggtcttggaacaggcgc |
| CCN3 | aactgcattgaacagaccaca | attgacggttcctattggtgac |
| CDH1 | atttttccctcgacacccgat | tcccaggcgtagaccaaga |
| CDH2 | agccaaccttaactgaggagt | ggcaagttgattggagggatg |
| CDH5 | acgcctctgtcatgtaccaa | acgatctcatacctggcctg |
| CDH13 | agtgttccatatcaatcagccag | cgagacctcatagcgtagctt |
| CLDN5 | ctctgctggttcgccaacat | cagctcgtacttctgcgaca |
| COL1A1 | gagggccaagacgaagacatc | cagatcacgtcatcgcacaac |
| COL4A1 | ggcatgcctggtattggt | aggccccatatcacccttag |
| DLL1 | tgtgacgagtgtatccgctat | gtgtgcagtagttcaggtcct |
| DLL4 | gcactccctggcaatgtact | gtggtgggtgcagtagttga |
| EDN1 | agagtgtgtctacttctgcca | cttccaagtccatacggaacaa |
| EFNA2 | ctccctgggcttcgagtt | ccgcacgtacaccttcagt |
| EFNA5 | cactcccttttctctaggatttga | gacaggaccttcttccattatctg |
| EFNB1 | tcatgaaggttgggcaaga | cagtgttgtctgcctccttg |
| EFNB3 | tggaactcggcgaataagag | cgatctgagggtacagcaca |
| EFNA1 | aacaagctgtgcaggcatgg | ctccacagatgaggtcttgc |
| EFNA3 | actctcccccagttcacca | gcacctgagggttctctcc |
| EFNB2 | tctttggagggcctggat | ccagcagaacttgcatcttg |
| EPHA2 | ccaggcaggctacgagaa | ggctctcagatgcctcaaac |
| EPHA4 | catgtcccgagtgcttgag | cagtccaccggataggaatc |
| EPHB1 | tggctatgagcctgagaacag | agtgggagcagccttcag |
| EPHB2 | tgtctcagatgatgatggagga | ccgcatcacctggatactgt |
| EPHB4 | cggatcctacccgagtga | tgtgttcagcagggtctcttc |
| EPHB6 | tcctcgaatggcagaaaaag | ttctgcaaggggttattcca |
| ESM1 | cagggggacgggaaaatgc | cagatgccatgtcatgctcc |
| FLT1 | cttatgatgccagcaagtgg | caaaagcccctcttccaagt |
| FN1 | gacgcatcacttgcacttct | gcaggtttcctcgattatcct |
| ITGA5 | ggcttcaacttagacgcggag | tggctggtattagccttgggt |
| ITGAV | attctgtggctgtcggagat | ccttgctgctcttggaactc |
| ITGB1 | ttctccagaaggtggtttcg | acaccagcagccgtgtaac |
| ITGB3 | cagcccgggtcatctgta | agctctccctgactcctcct |
| ITGB5 | ggcttcaacttagacgcggag | tggctggtattagccttgggt |
| JAG1 | tcgctgtatctgtccacctg | agtcactggcacggttgtag |
| JAG2 | tgggactgggacaacgatac | agtggcgctgtagtagttctc |
| KDR | ccttccagaccgttacgtg | agccagagctgcatcatttc |
| LAMA2 | ggcttattcagctggcagag | attctcccagggactttgct |
| LAMA4 | gactgccaacagtgccaac | ccaccctgataggtgccat |
| LAMA5 | ggatgccgaagacatgaac | ttccctcactctttcctgttgt |
| LAMB1 | aacgtggttggaagaacctg | acactccctggaaacagtgg |
| LAMB2 | ggacgaaaagaagtgcttcct | gcagggataccattctctgact |
| LAMC1 | gagttcgtcaacgccgc | cctggttgttgtagtcggtca |
| MMP14 | atcatggcacccttttacca | gcgctccttgaagacaaac |
| NOTCH1 | cggggctaacaaagatatgc | caccttggcggtctcgta |
| NOTCH2 | tggtggcagaactgatcaac | ctgcccagtgaagagcagat |
| NOTCH3 | cctagtcctggctccgaac | gagccggttgtcaatctcc |
| NOTCH4 | gatgggctggacacctacac | cacacgcagtgaaagctacca |
| NRP1 | acgtggaagtcttcgatggag | caccatgtgtttcgtagtcaga |
| OCLN | acaagcggttttatccagagtc | gtcatccacaggcgaagttaat |
| SERPINE1 | ccagctgacaacaggaggag | cccatgagctccttgtacagat |
| PDGFB | tcccgaggagctttatgaga | gggtcatgttcaggtccaac |
| PECAM1 | aacagtgttgacatgaagagcc | tgtaaaacagcacgtcatcctt |
| PKNOX1 | atagacagctatcaagatgggca | gcatcgggttcagagcagttt |
| S100A4 | gatgagcaacttggacagcaa | ctgggctgcttatctgggaag |
| SDC1 | acggctattcccacgtctc | tctggcaggactacagcctc |
| SDC2 | tcattgctggtggagttattgg | agcactggatggtttgcgt |
| SDC3 | tggcgcagtgagaacttcg | ccccgagtagaggtcatccag |
| SDC4 | tccccaccgaacccaagaa | ccttgttggacacatcctcac |
| SNAI1 | tcggaagcctaactacagcga | agatgagcattggcagcgag |
| SNAI2 | cgaactggacacacatacagtg | ctgaggatctctggttgtggt |
| TEK | tccgctggaagttactcaaga | gaactcgcccttcacagaaataa |
| TGFB1 | cgctgcccatcgtgtacta | cgcacgatcatgttggac |
| TJP1 | ctggtgaaatcccggaaaaatga | ttgctgccaaactatcttgtga |
| TIE1 | aagcagacagacgtgatctgg | gcacgatgagccgaaagaag |
| TWIST1 | gtccgcagtcttacgaggag | gcttgagggtctgaatcttgct |
| TWIST2 | gcaagtggaattgggatgc | tcttctgtccgatgtcactgc |
| PLAU | tcaaaaacctgctatgagggga | gggcatggtacgtttgctg |
| PLAUR | tattcccgaagccgttacctc | ggtggcggtcatcctttgg |
| VCAM1 | attcaaactgccctgatggg | ggtaaggttcttgcccactg |
| ICAM1 | ataatgggaatctacagcacct | aacatgactgagtctccaatctg |
| VIM | agtccactgagtaccggagac | catttcacgcatctggcgttc |
| VWF | ccgatgcagccttttcgga | tccccaagatacacggagagg |
| YAP1 | tagccctgcgtagccagtta | tcatgcttagtccactgtctgt |
| ZEB1 | ttacacctttgcatacagaaccc | tttacgattacacccagactgc |
| ZEB2 | gcgatggtcatgcagtcag | caggtggcaggtcattttctt |
| CCN2 | ccctcgcggcttaccgactgg | cacaggtcttggaacaggcgc |
| LGALS3 | cttataacctgcctttgcctgg | gcaacatcattccctctttgga |
| ANGPT1 | tcgtgagagtacgacagacca | tctccgacttcatgttttccac |
| ANGPT2 | accccactgttgctaaagaaga | ccatcctcacgtcgctgaata |
| CD34 | ctacaacacctagtacccttgga | ggtgaacactgtgctgattaca |
| HES1 | gaagcacctccggaacct | gtcacctcgttcatgcactc |
| HEY1 | catacggcaggagggaaag | gcatctagtccttcaatgatgct |
| Gene Name | Decoding Gene Name | Protein Name | Decoding Protein Name |
|---|---|---|---|
| ACTA2 | Actin Alpha 2, Smooth Muscle | α-SMA | Actin Alpha 2, Smooth Muscle |
| ANGPT1 | Angiopoietin 1 | Angiopoietin 1 | |
| ANGPT2 | Angiopoietin 2 | Angiopoietin 2 | |
| APLN | Apelin | Apelin | |
| CAV1 | Caveolin 1 | Caveolin | |
| CCL2 | C-C Motif Chemokine Ligand 2 | MCP-1 | Monocyte Chemoattractant Protein 1 |
| CCN1 | Cellular Communication Network Factor 1 | CYR61 | CYsteine-Rich angiogenic inducer 61 |
| CCN2 | Cellular Communication Network Factor 2 | CTGF | Connective Tissue Growth Factor |
| CCN3 | Cellular Communication Network Factor 3 | NOV | Nephroblastoma OVerexpressed protein |
| CD34 | CD34 molecule | ||
| CDH1 | Cadherin 1 | E-cadherin | Epithelial cadherin |
| CDH13 | Cadherin 13 | T-cadherin/ H-cadherin | Tranceted cadherin/Heart cadherin |
| CDH2 | Cadherin 2 | N-cadherin | Neural cadherin |
| CDH5 | Cadherin 5 | VE-cadherin | Vascular Endothelial cadherin |
| CLDN5 | Claudin-5 | Claudin-5 | |
| COL1A1 | Collagen type I alpha 1 chain | collagen type I alpha 1 chain | |
| COL4A1 | Collagen type IV alpha 1 chain | collagen type IV alpha 1 chain | |
| DLL1 | Delta Like canonical Notch Ligand 1 | DLL1 | Delta Like canonical Notch Ligand 1 |
| DLL4 | Delta Like canonical Notch Ligand 4 | DLL4 | Delta Like canonical Notch Ligand 4 |
| EDN1 | Endothelin 1 | ET-1 | endothelin 1 |
| EFNA1 | ligand ephrin A1 | ephrin A1 | ligand ephrin A1 |
| EFNA2 | ligand ephrin A2 | ephrin A2 | ligand ephrin A2 |
| EFNA3 | ligand ephrin A3 | ephrin A5 | ligand ephrin A3 |
| EFNA5 | ligand ephrin A5 | ephrin A4 | ligand ephrin A5 |
| EFNB1 | ligand ephrin B1 | ephrin B1 | ligand ephrin B1 |
| EFNB2 | ligand ephrin B2 | ephrin B2 | ligand ephrin B2 |
| EFNB3 | ligand ephrin B3 | ephrin B3 | ligand ephrin B3 |
| EPHA2 | EPH receptor A2 | EPH-A2 | EPH receptor A2 |
| EPHA4 | EPH receptor A4 | EPH-A4 | EPH receptor A4 |
| EPHB1 | EPH receptor B1 | EPH-B1 | EPH receptor B1 |
| EPHB2 | EPH receptor B2 | EPH-B2 | EPH receptor B2 |
| EPHB4 | EPH receptor B4 | EPH-B4 | EPH receptor B4 |
| EPHB6 | EPH receptor B6 | EPH-B6 | EPH receptor B6 |
| ESM1 | Endothelial cell Specific Molecule 1 | endocan | |
| FLT1 | Fms Related Receptor Tyrosine Kinase 1 | VEGFR1 | Vascular Endothelial Growth Factor Receptor 1 |
| FN1 | Fibronectin 1 | fibronectin | |
| HES1 | Hes Family BHLH Transcription Factor 1 | HES1 | Hes Family BHLH Transcription Factor 1 |
| HEY1 | Hes Related Family BHLH Transcription Factor With YRPW Motif 1 | HEY1 | Hes Related Family BHLH Transcription Factor With YRPW Motif 1 |
| ICAM1 | InterCellular Adhesion Molecule 1 | ICAM1 | InterCellular Adhesion Molecule 1 |
| ITGA5 | Integrin Subunit Alpha 5 | integrin alpha 5/CD49e | integrin subunit alpha 5 |
| ITGAV | Integrin Subunit Alpha V | integrin alpha V/CD51 | integrin subunit alpha V |
| ITGB1 | Integrin Subunit Beta 1 | integrin beta 1/CD29 | integrin subunit beta 1 |
| ITGB3 | Integrin Subunit Beta 3 | integrin beta 3/CD61 | integrin subunit beta 3 |
| ITGB5 | Integrin Subunit Beta 5 | integrin beta 5 | integrin subunit beta 5 |
| JAG1 | Jagged canonical Notch ligand 1 | Jagged1 | Jagged canonical Notch ligand 1 |
| JAG2 | Jagged canonical Notch ligand 2 | Jagged2 | Jagged canonical Notch ligand 2 |
| KDR | Kinase Insert Domain Receptor | VEGFR-2 | Vascular Endothelial Growth Factor Receptor 2 |
| LAMA2 | Laminin subunit alpha-2 | laminin subunit alpha-2 | |
| LAMA4 | Laminin subunit alpha-4 | laminin subunit alpha-4 | |
| LAMA5 | Laminin subunit alpha-5 | laminin subunit alpha-5 | |
| LAMB1 | Laminin subunit beta-1 | laminin subunit beta-1 | |
| LAMB2 | Laminin subunit beta-1 | laminin subunit beta-1 | |
| LAMC1 | Laminin subunit gamma-1 | laminin subunit gamma-1 | |
| LGALS3 | Galectin-3 | galectin-3 | |
| MMP14 | Matrix MetalloProteinase-14 | MMP14 | Matrix MetalloProteinase-14 |
| NOTCH1 | Notch Receptor 1 | Notch 1 | Notch Receptor 1 |
| NOTCH2 | Notch Receptor 2 | Notch 2 | Notch Receptor 2 |
| NOTCH3 | Notch Receptor 3 | Notch 3 | Notch Receptor 3 |
| NOTCH4 | Notch Receptor 4 | Notch 4 | Notch Receptor 4 |
| NRP1 | Neuropilin-1 | Neuropilin-1 | |
| OCLN | Occludin | Occludin | |
| PDGFB | Platelet-derived growth factor subunit B` | Platelet-derived growth factor subunit B | |
| PECAM1 | Platelet endothelial cell adhesion molecule 1 | CD31 | Cluster of Differentiation 31 |
| PKNOX1 | PBX/Knotted 1 Homeobox 1 | PREP1 | Pbx Regulating Protein-1 |
| PLAU | Plasminogen Activator, Urokinase | Urokinase/uPA | urokinase-type plasminogen activator |
| PLAUR | Plasminogen Activator, Urokinase Receptor | urokinase receptor/uPAR/CD 87 | urokinase plasminogen activator surface receptor/Cluster of Differentiation 87 |
| S100A4 | S100 calcium binding protein A4 | FSP1 | Fibroblast-Specific Protein 1 |
| SDC1 | Syndecan 1 | syndecan 1 | |
| SDC2 | Syndecan 2 | syndecan 2 | |
| SDC3 | Syndecan 3 | syndecan 3 | |
| SDC4 | Syndecan 4 | syndecan 4 | |
| SERPINE1 | Serpin family E member 1 | PAI-1 | Plasminogen Activator Inhibitor-1 |
| SNAI1 | Snail Family Transcriptional Repressor 1 | SNAIL | |
| SNAI2 | Snail Family Transcriptional Repressor 2 | SLUG | |
| TEK | Tunica interna Endothelial cell Kinase | TIE 2/Angiopoietin-1 receptor | Tyrosine Kinase With Ig And EGF Homology Domains-2 |
| TGFB1 | Transforming Growth Factor beta 1 | TGF-b1 | Transforming Growth Factor beta 1 |
| TIE1 | Tyrosine Kinase With Immunoglobulin Like And EGF Like Domains 1 | TIE1Angiopoietin-2 receptor | |
| TJP1 | Tight Junction Protein 1 | TJP-1/ZO-1 | Tight junction protein-1/Zonula occludens-1 |
| TWIST1 | Twist Family BHLH Transcription Factor 1 | TWIST1 | Twist Family BHLH Transcription Factor 1 |
| TWIST2 | Twist Family BHLH Transcription Factor 2 | TWIST2 | Twist Family BHLH Transcription Factor 2 |
| VCAM-1 | Vascular Cell Adhesion Molecule 1 | VCAM-1/CD106 | Vascular Cell Adhesion Molecule 1/Cluster of Differentiation 106 |
| VIM | Vimentin | vimentin | |
| VWF | Von Willebrand Factor | VWF | Von Willebrand Factor |
| YAP1 | Yes1 Associated Transcriptional Regulator | YAP1 | Yes1 Associated transcriptional regulator |
| ZEB1 | Zinc finger E-box Binding homeobox 1 | ZEB1 | Zinc finger E-box Binding homeobox 1 |
| ZEB2 | Zinc finger E-box Binding homeobox 2 | ZEB2 | Zinc finger E-box Binding homeobox 2 |
Publisher’s Note: MDPI stays neutral with regard to jurisdictional claims in published maps and institutional affiliations. |
© 2022 by the authors. Licensee MDPI, Basel, Switzerland. This article is an open access article distributed under the terms and conditions of the Creative Commons Attribution (CC BY) license (https://creativecommons.org/licenses/by/4.0/).
Share and Cite
Beloglazova, I.; Zubkova, E.; Dergilev, K.; Goltseva, Y.; Parfyonova, Y. New Insight on 2D In Vitro Angiogenesis Models: All That Stretches Is Not a Tube. Cells 2022, 11, 3278. https://doi.org/10.3390/cells11203278
Beloglazova I, Zubkova E, Dergilev K, Goltseva Y, Parfyonova Y. New Insight on 2D In Vitro Angiogenesis Models: All That Stretches Is Not a Tube. Cells. 2022; 11(20):3278. https://doi.org/10.3390/cells11203278
Chicago/Turabian StyleBeloglazova, Irina, Ekaterina Zubkova, Konstantin Dergilev, Yulia Goltseva, and Yelena Parfyonova. 2022. "New Insight on 2D In Vitro Angiogenesis Models: All That Stretches Is Not a Tube" Cells 11, no. 20: 3278. https://doi.org/10.3390/cells11203278