
Chromatin Liquid–Liquid Phase Separation (LLPS) Is Regulated by Ionic Conditions and Fiber Length

 ,
,  and
and 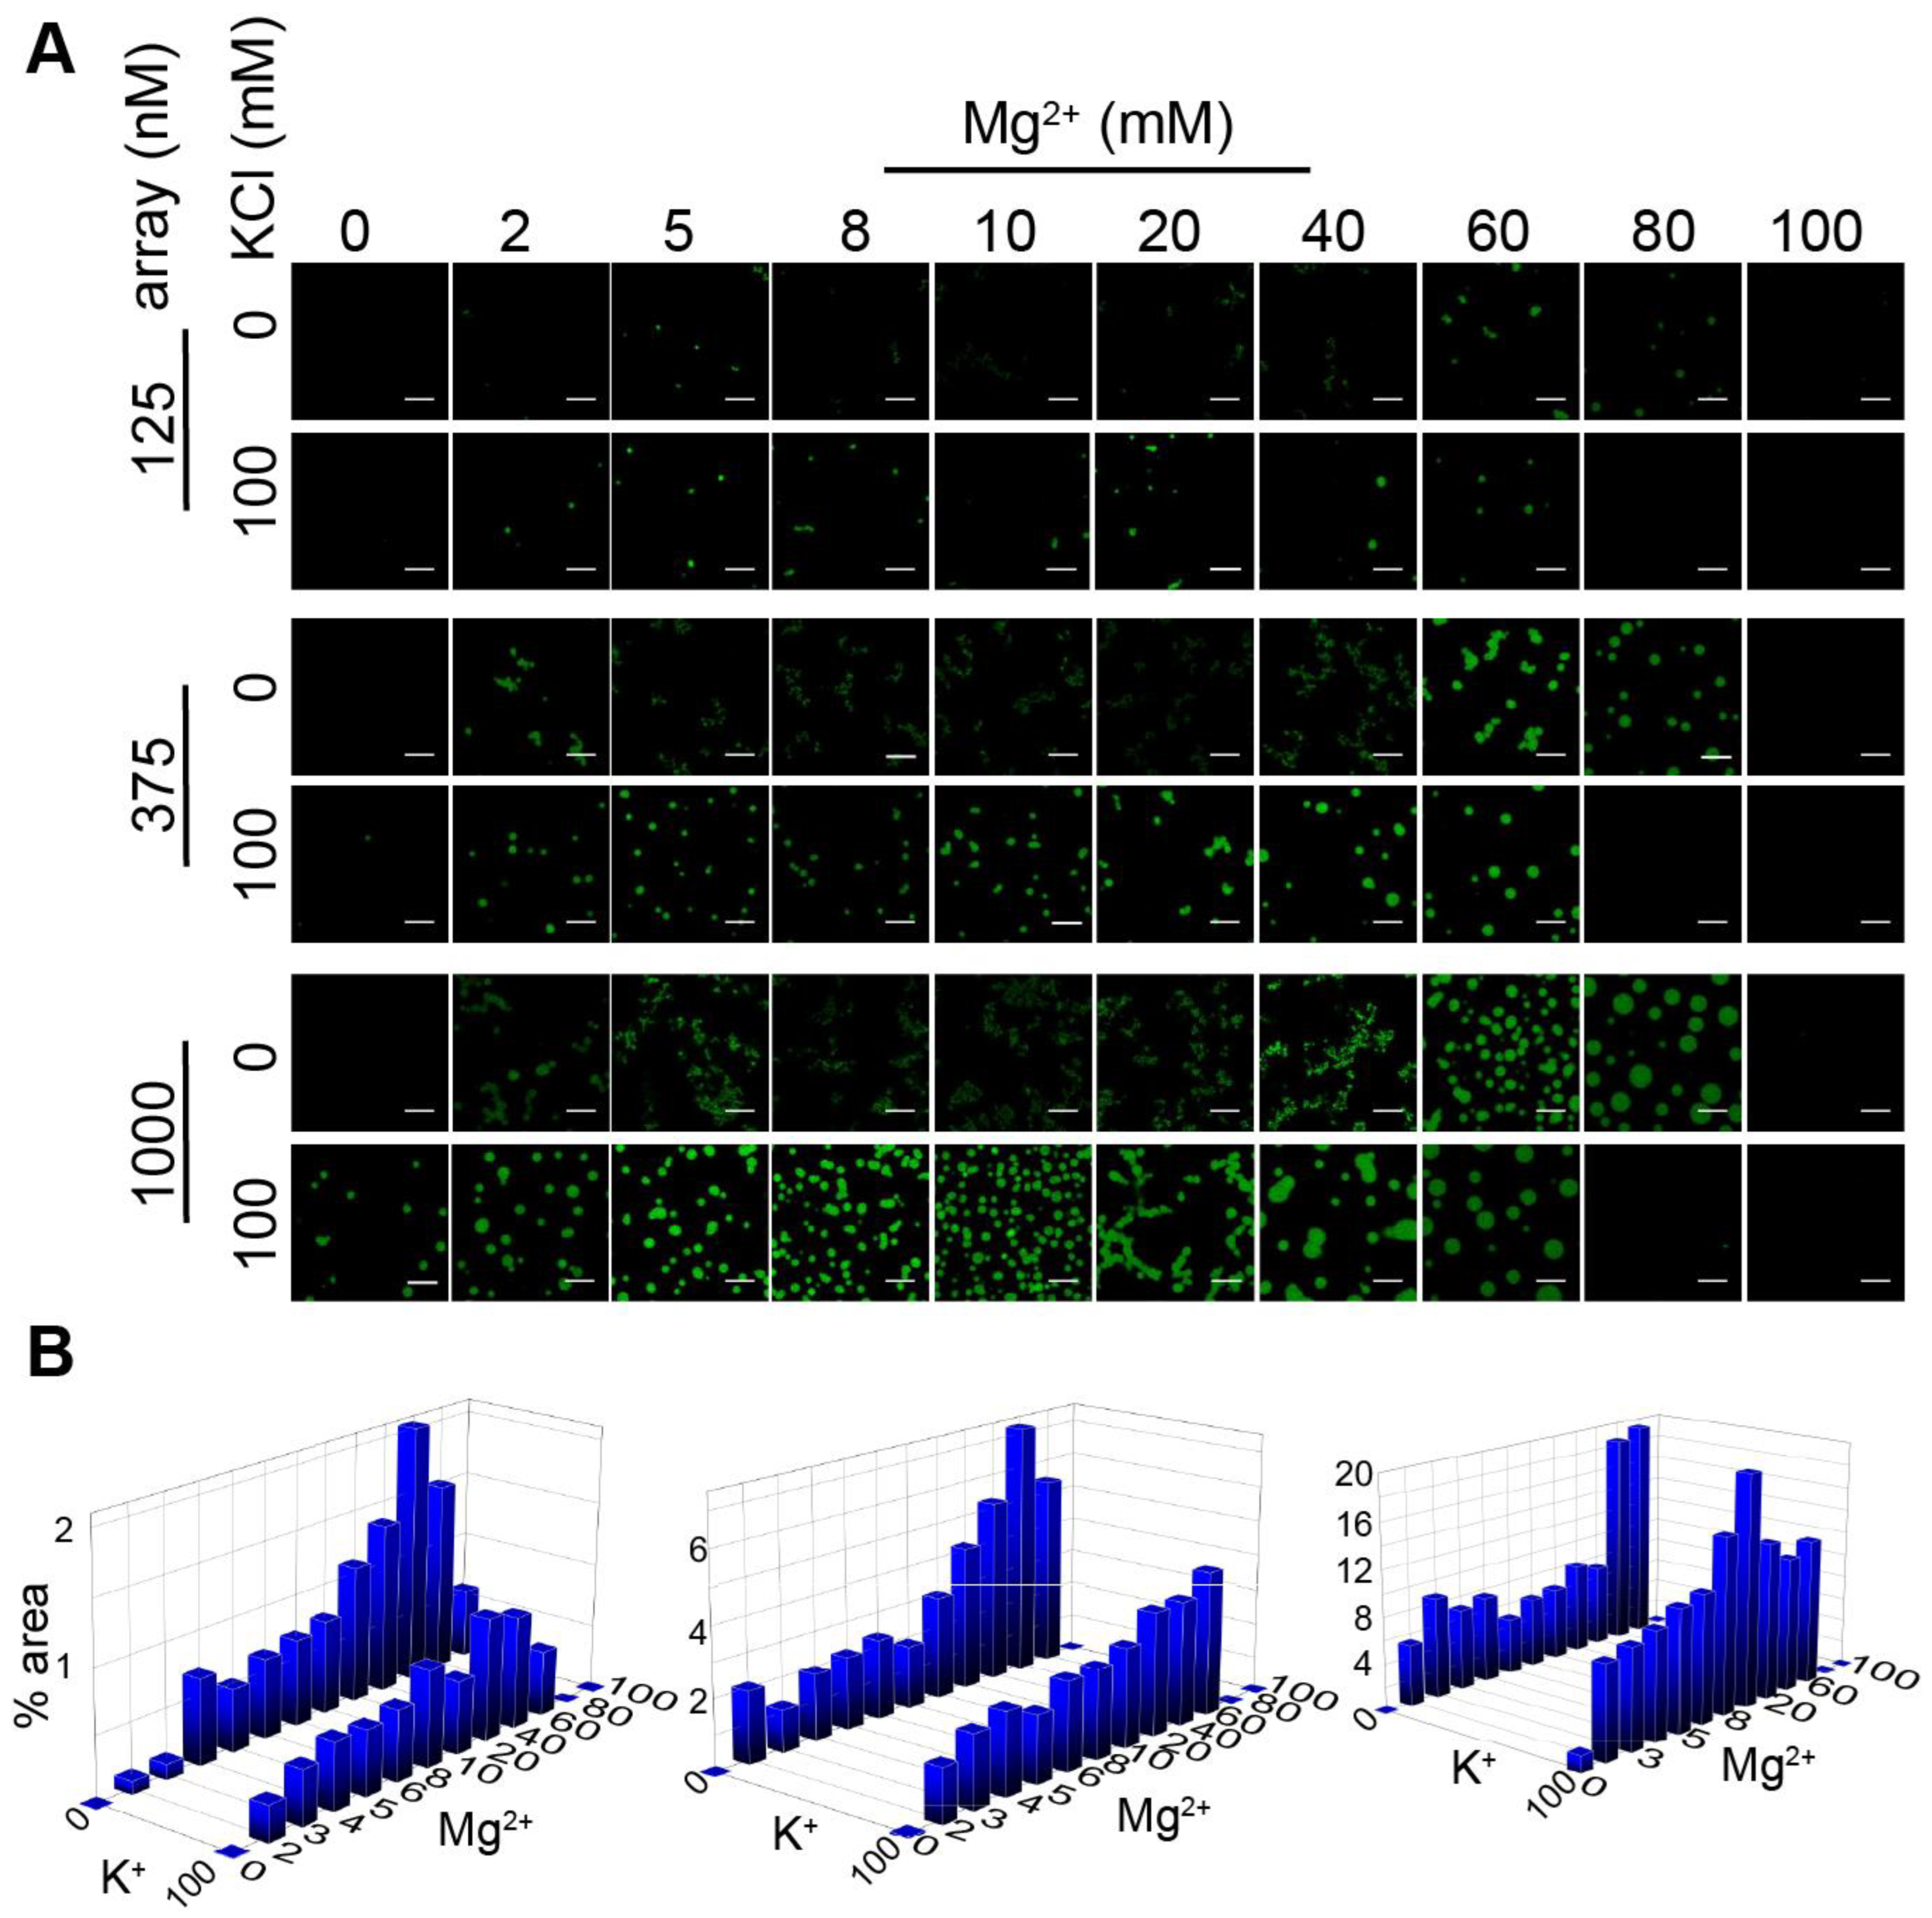
Abstract
:1. Introduction
2. Materials and Methods
2.1. Overexpression and Purification of Histones
2.2. Preparation of Histone Mutants
2.3. Fluorescent Labeling of Histone H2B_T116C
2.4. Histone Octamer Refolding
2.5. DNA Preparation
2.6. Chromatin Preparation
2.7. Preparation of 384-Well Microscopy Plates
2.8. Preparation of Phase Separation Samples
2.9. Two-Color Mixing Assay
2.10. Confocal Fluorescence Microscopy
3. Results and Discussion
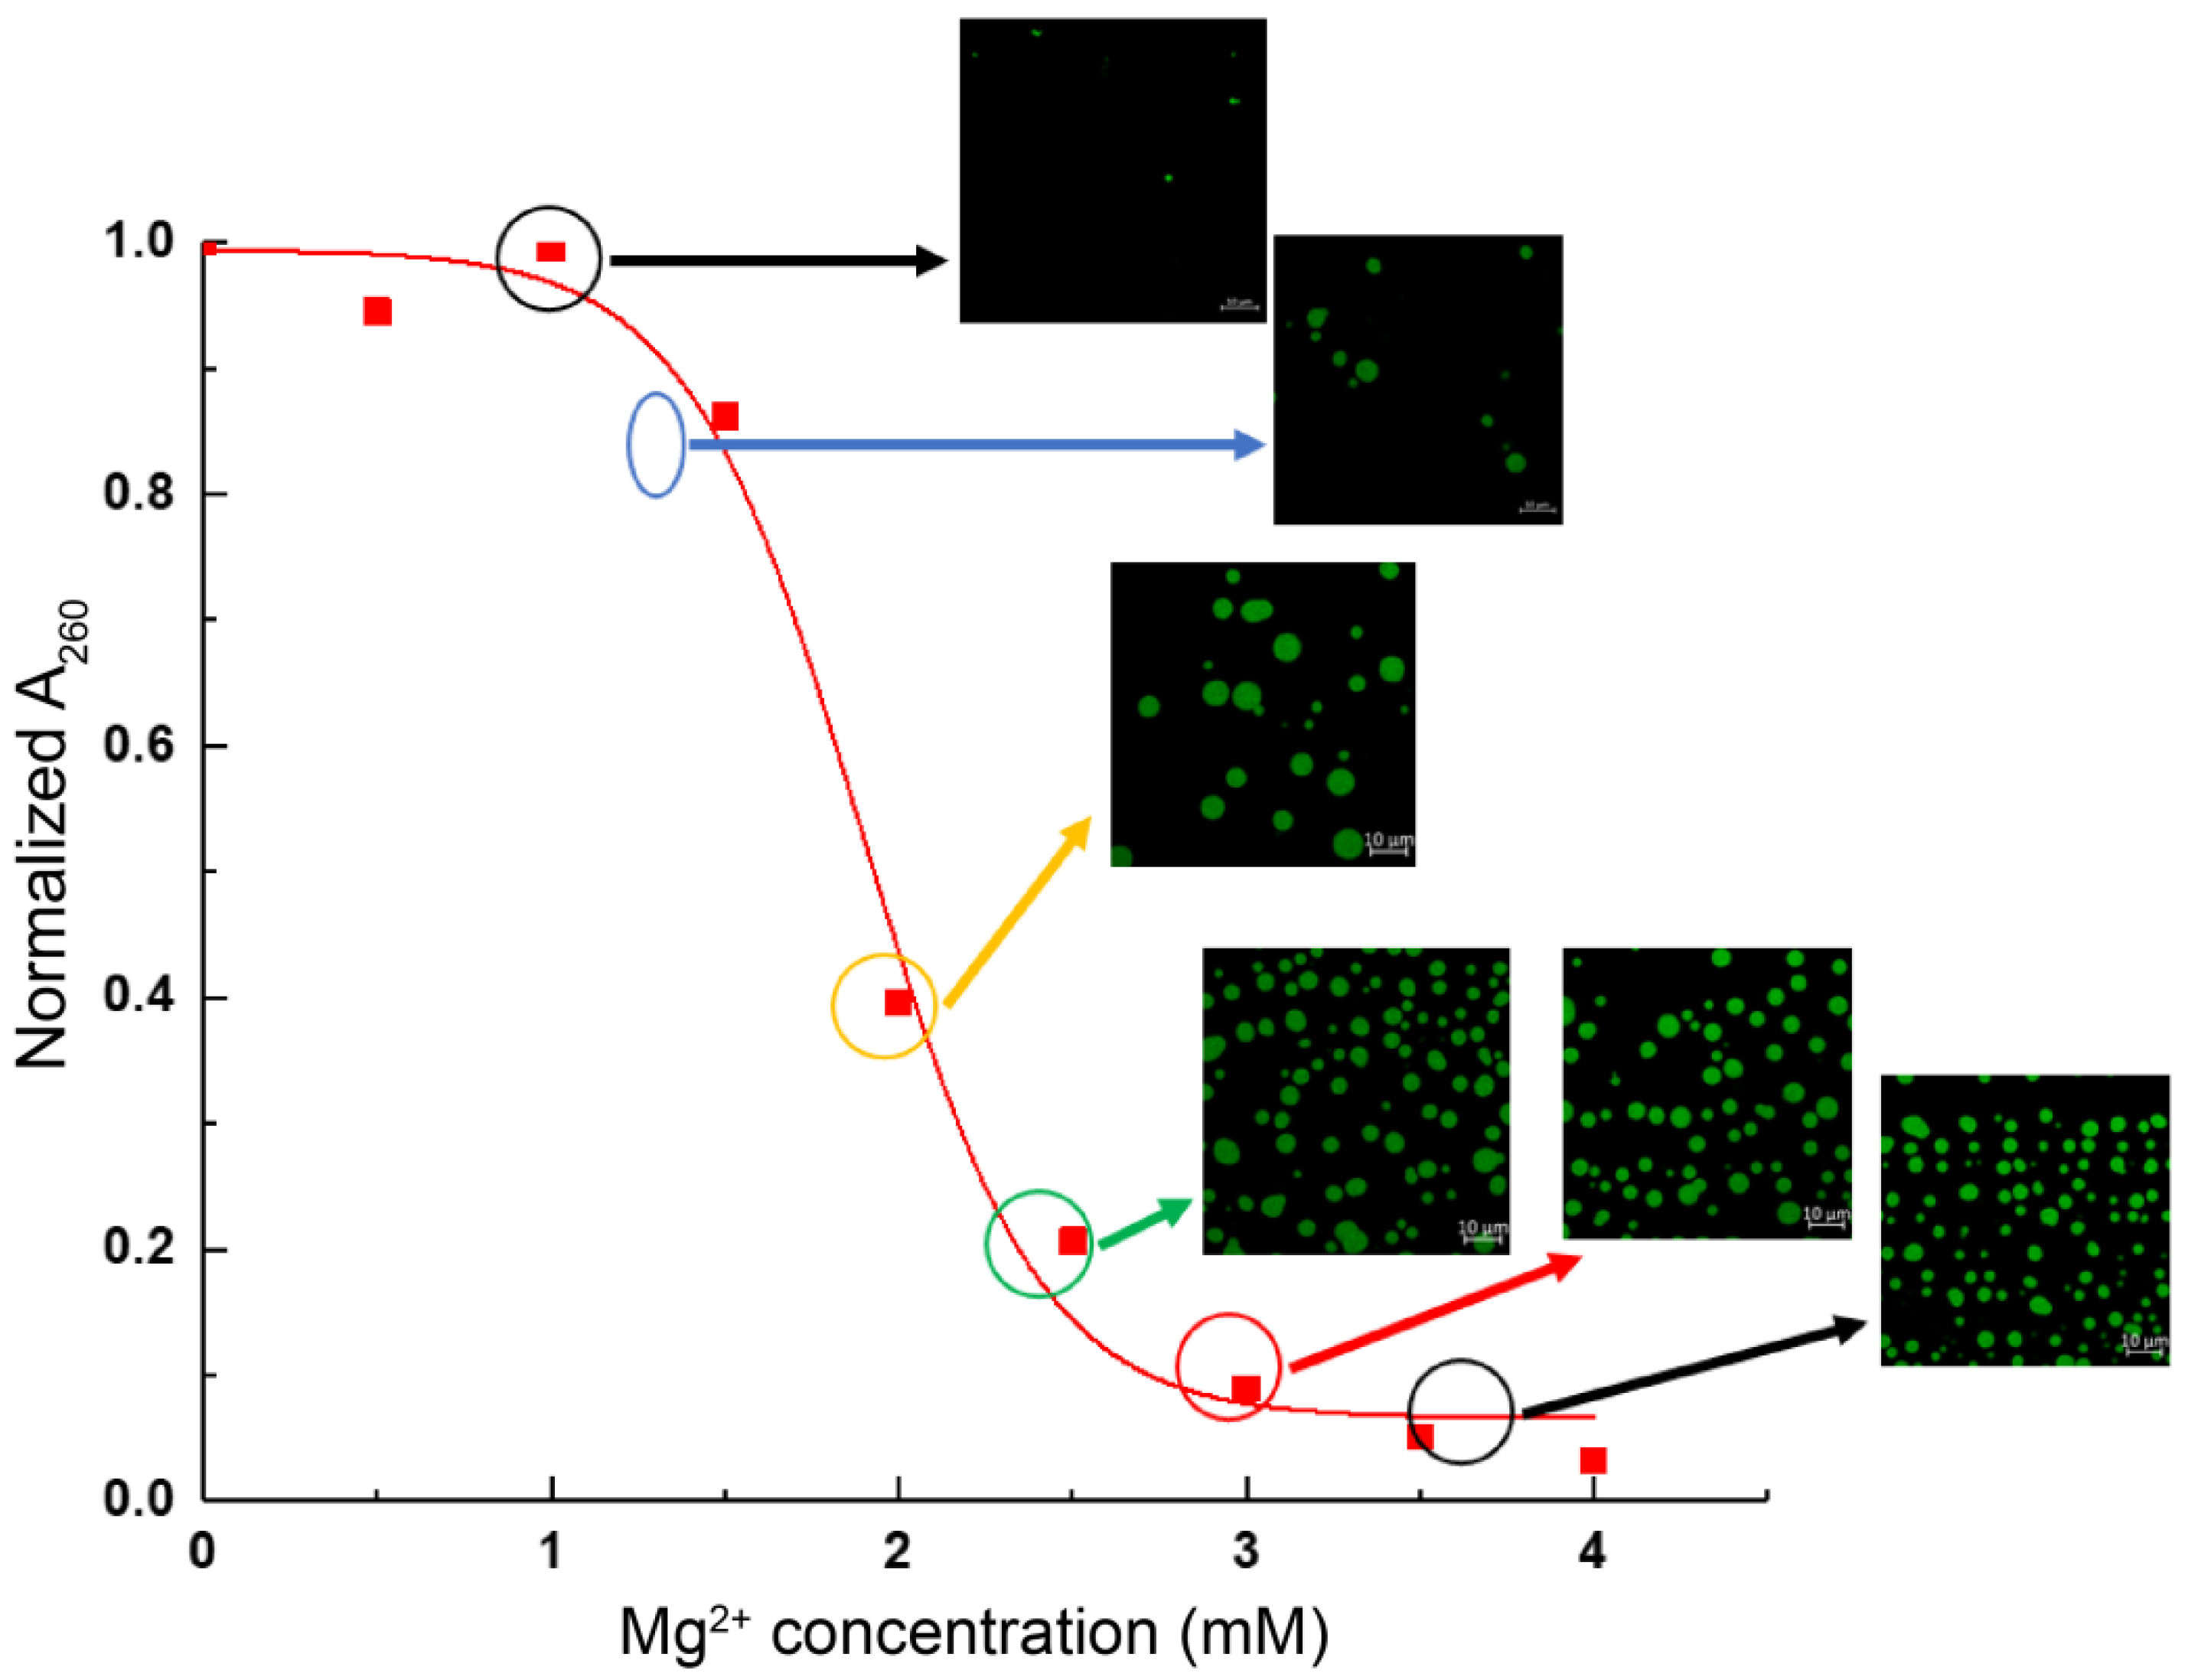
3.1. Chromatin Droplet Formation by LLPS Depends on Ionic Conditions
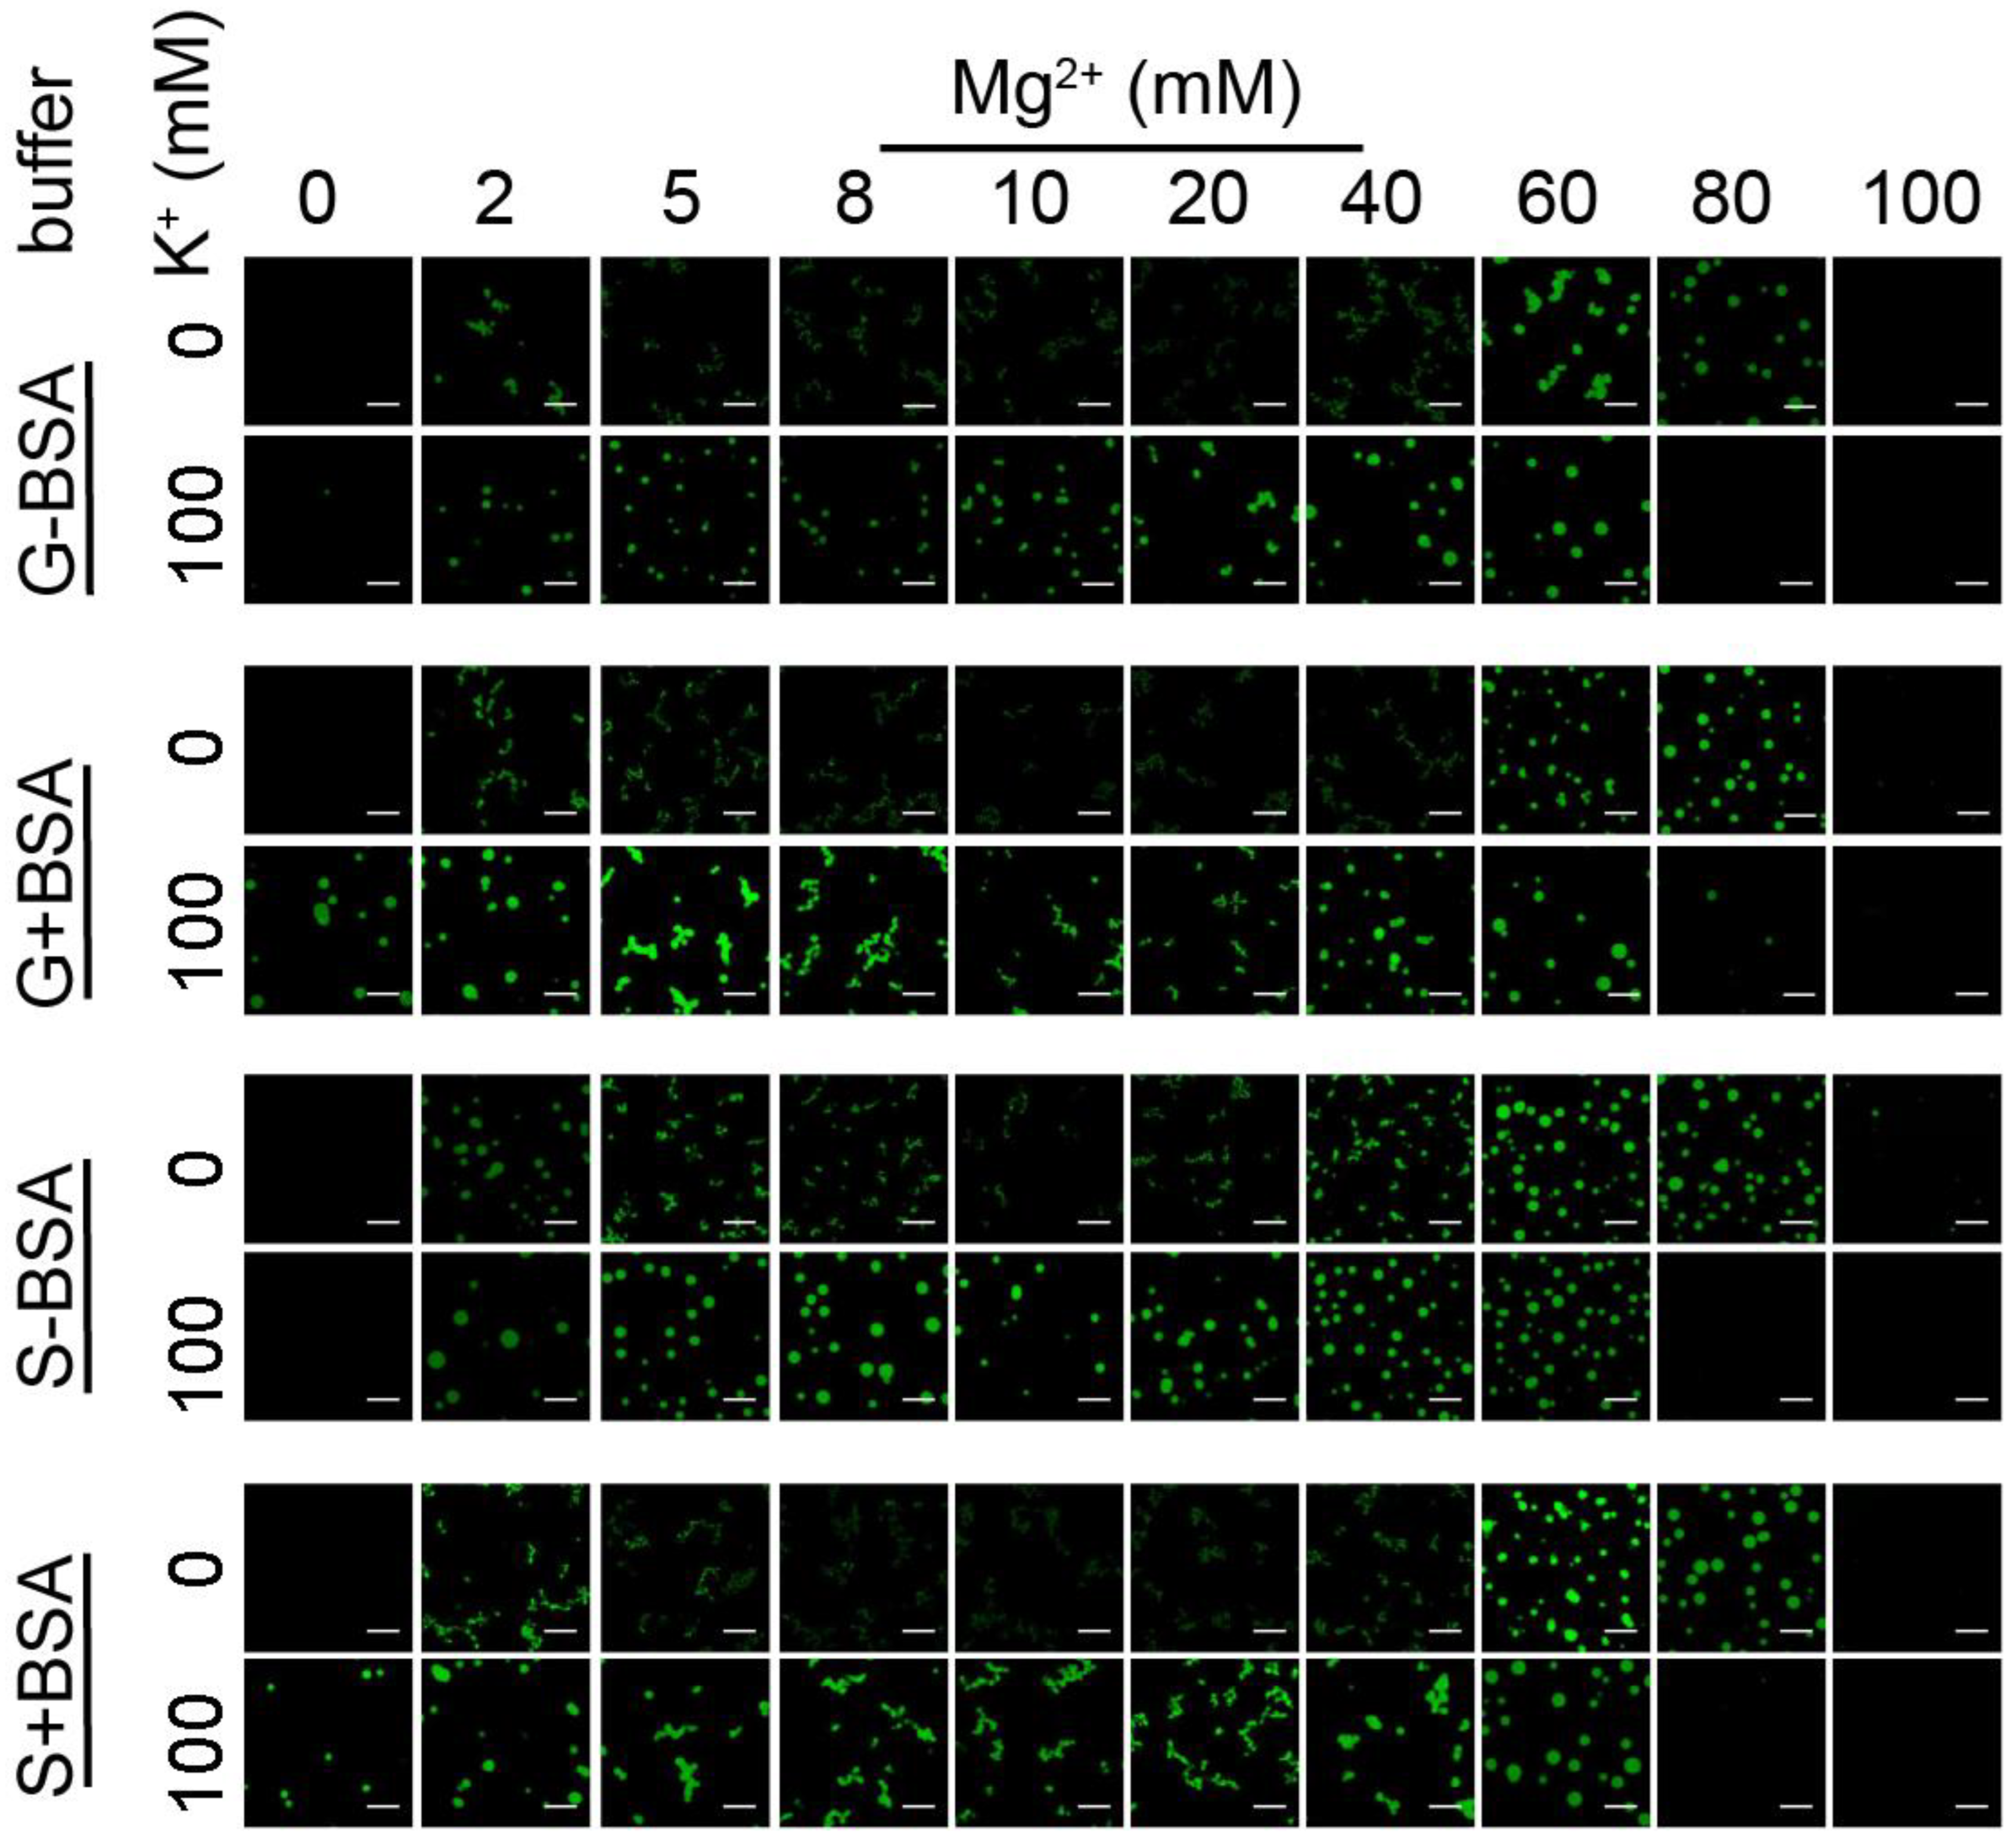
3.2. Chromatin Droplet Formation in Different Buffer Conditions
3.3. Two-Color Mixing Assay Reveals the Liquid-Like Properties of Chromatin Condensates in the Presence of Physiological KCl
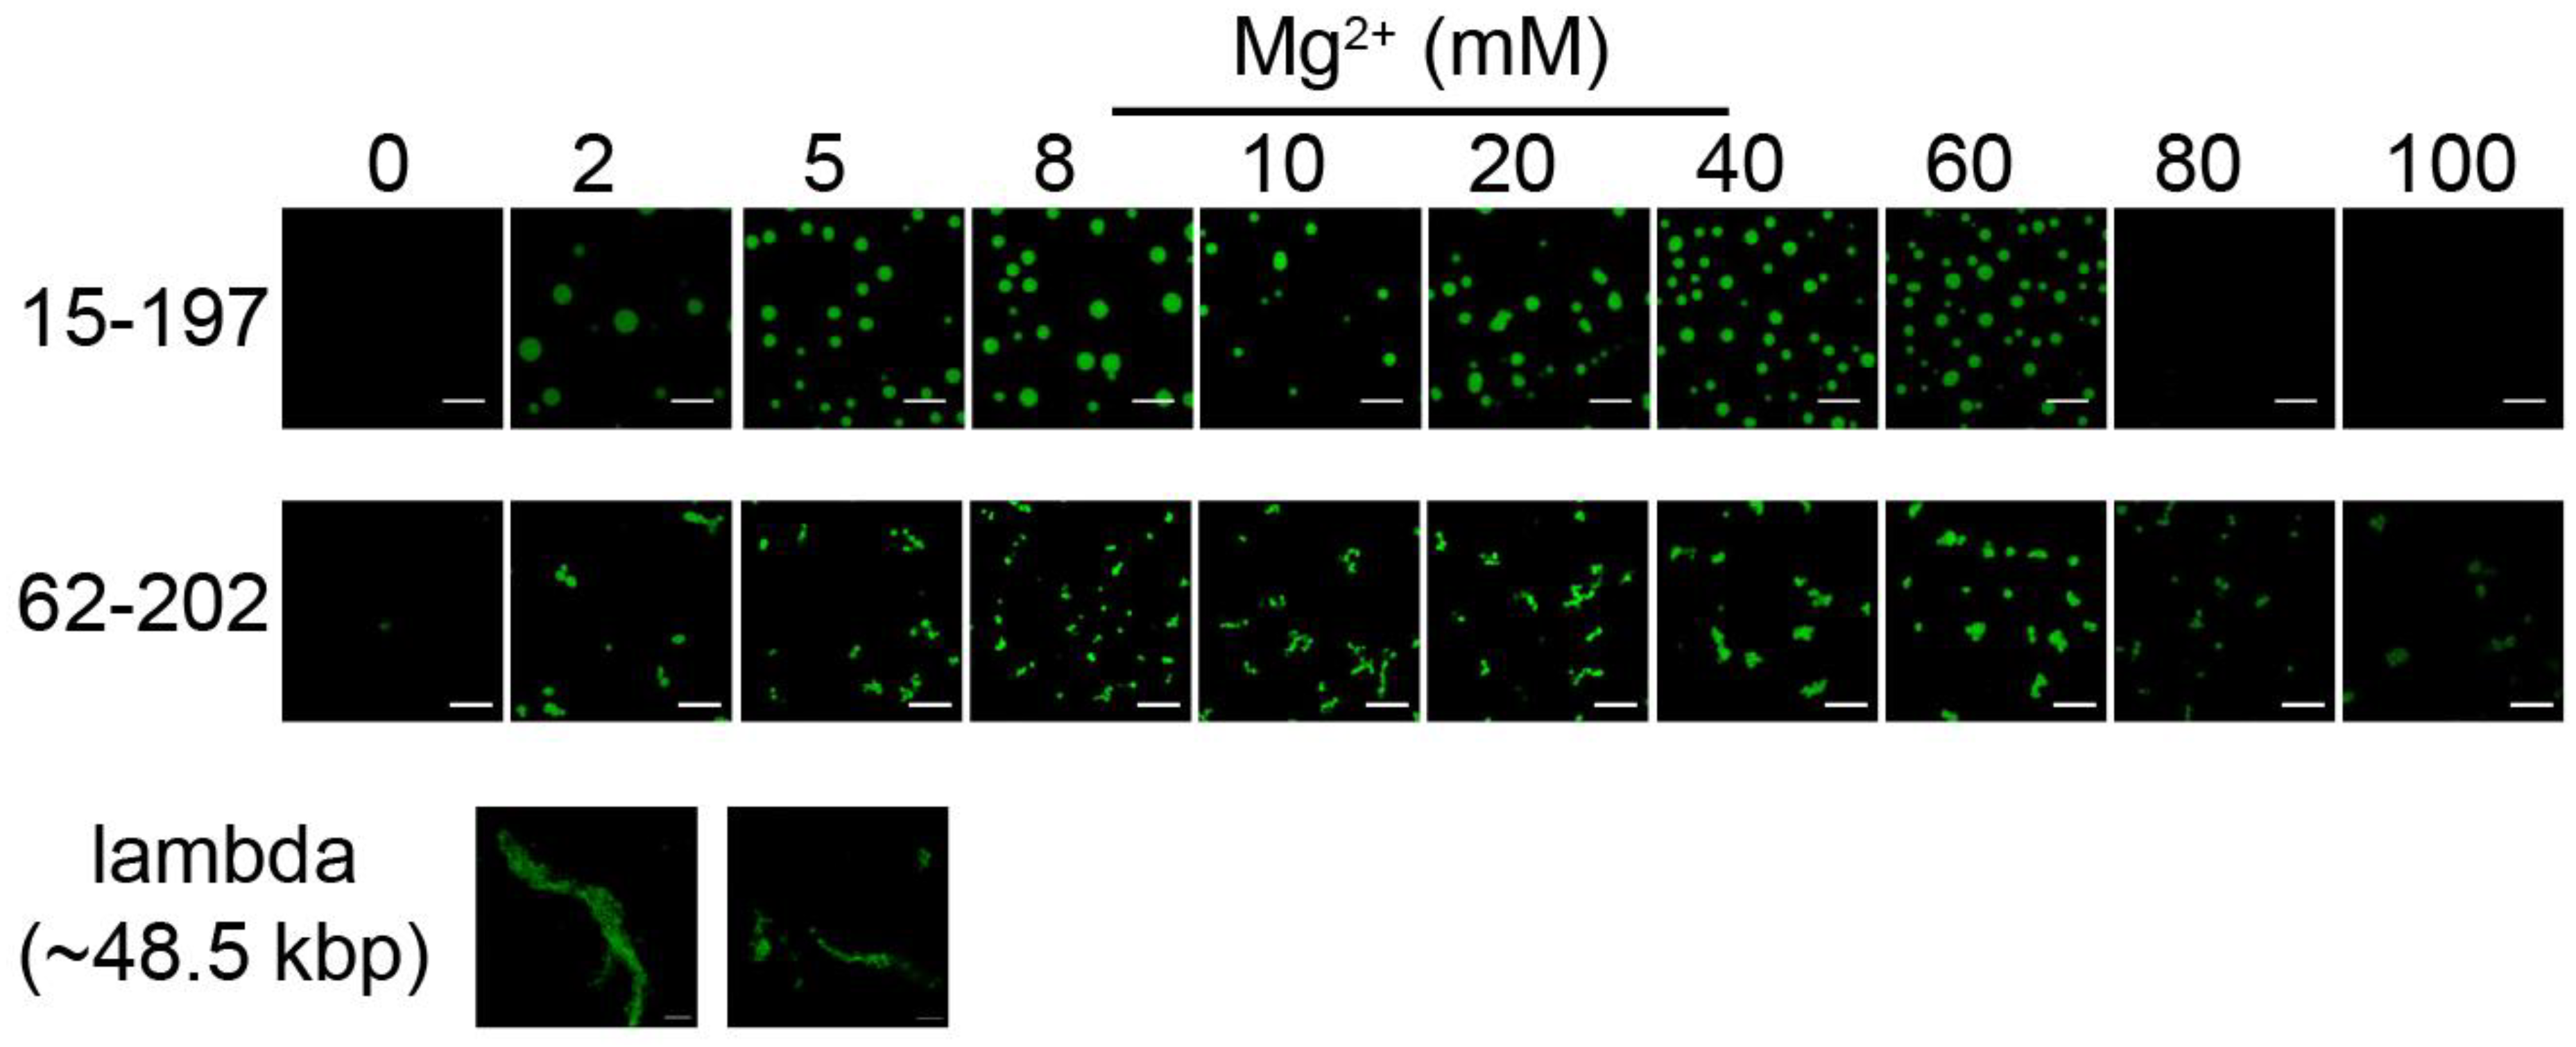
3.4. The Formation of Chromatin Droplets Depends on Nucleosome Array Fiber Length
4. Conclusions
Supplementary Materials
Author Contributions
Funding
Institutional Review Board Statement
Informed Consent Statement
Conflicts of Interest
References
- Kornberg, R.D. Chromatin Structure: A repeating unit of histones and DNA. Science 1974, 184, 868–871. [Google Scholar] [CrossRef] [PubMed]
- Luger, K.; Mader, A.W.; Richmond, R.K.; Sargent, D.F.; Richmond, T.J. Crystal structure of the nucleosome core particle at 2.8 A resolution. Nature 1997, 389, 251–260. [Google Scholar] [CrossRef] [PubMed]
- Widom, J. A relationship between the helical twist of DNA and the ordered positioning of nucleosomes in all eukaryotic cells. Proc. Natl. Acad. Sci. USA 1992, 89, 1095–1099. [Google Scholar] [CrossRef] [PubMed]
- Dixon, J.R.; Jung, I.; Selvaraj, S.; Shen, Y.; Antosiewicz-Bourget, J.E.; Lee, A.Y.; Ye, Z.; Kim, A.; Rajagopal, N.; Xie, W.; et al. Chromatin architecture reorganization during stem cell differentiation. Nature 2015, 518, 331–336. [Google Scholar] [CrossRef]
- Bonev, B.; Mendelson Cohen, N.; Szabo, Q.; Fritsch, L.; Papadopoulos, G.L.; Lubling, Y.; Xu, X.; Lv, X.; Hugnot, J.-P.; Tanay, A.; et al. Multiscale 3D genome rewiring during mouse neural development. Cell 2017, 171, 557–572.e524. [Google Scholar] [CrossRef]
- Lorber, D.; Volk, T. Evaluation of chromatin mesoscale organization. APL Bioeng. 2022, 6, 010902. [Google Scholar] [CrossRef]
- Farr, S.E.; Woods, E.J.; Joseph, J.A.; Garaizar, A.; Collepardo-Guevara, R. Nucleosome plasticity is a critical element of chromatin liquid–liquid phase separation and multivalent nucleosome interactions. Nature Commun. 2021, 12, 2883. [Google Scholar] [CrossRef]
- Shi, X.; Prasanna, C.; Soman, A.; Pervushin, K.; Nordenskiöld, L. Dynamic networks observed in the nucleosome core particles couple the histone globular domains with DNA. Commun. Biol. 2020, 3. [Google Scholar] [CrossRef]
- Shaban, H.A.; Barth, R.; Bystricky, K. Formation of correlated chromatin domains at nanoscale dynamic resolution during transcription. Nucleic Acids Res. 2018, 46, e77. [Google Scholar] [CrossRef]
- Narlikar, G.J. Phase-separation in chromatin organization. J. Biosci. 2020, 45. [Google Scholar] [CrossRef]
- Strickfaden, H. Reflections on the organization and the physical state of chromatin in eukaryotic cells. Genome 2021, 64, 311–325. [Google Scholar] [CrossRef] [PubMed]
- Bajpai, G.; Amiad Pavlov, D.; Lorber, D.; Volk, T.; Safran, S. Mesoscale phase separation of chromatin in the nucleus. eLife 2021, 10. [Google Scholar] [CrossRef] [PubMed]
- Rippe, K. Liquid–liquid phase separation in chromatin. Cold Spring Harb. Perspect. Biol. 2022, 14, a040683. [Google Scholar] [CrossRef] [PubMed]
- Cremer, T.; Cremer, M. Chromosome territories. Cold Spring Harb. Perspect. Biol. 2010, 2, a003889. [Google Scholar] [CrossRef] [PubMed]
- Dixon, J.R.; Selvaraj, S.; Yue, F.; Kim, A.; Li, Y.; Shen, Y.; Hu, M.; Liu, J.S.; Ren, B. Topological domains in mammalian genomes identified by analysis of chromatin interactions. Nature 2012, 485, 376–380. [Google Scholar] [CrossRef]
- Wachsmuth, M.; Knoch, T.A.; Rippe, K. Dynamic properties of independent chromatin domains measured by correlation spectroscopy in living cells. Epigenetics Chromatin 2016, 9. [Google Scholar] [CrossRef]
- Valouev, A.; Johnson, S.M.; Boyd, S.D.; Smith, C.L.; Fire, A.Z.; Sidow, A. Determinants of nucleosome organization in primary human cells. Nature 2011, 474, 516–520. [Google Scholar] [CrossRef]
- Beel, A.J.; Azubel, M.; Matteï, P.J.; Kornberg, R.D. Structure of mitotic chromosomes. Mol. Cell. 2021, 81, 4369–4376. [Google Scholar] [CrossRef]
- Ricci, M.A.; Manzo, C.; García-Parajo, M.F.; Lakadamyali, M.; Cosma, M.P. Chromatin fibers are formed by heterogeneous groups of nucleosomes in vivo. Cell 2015, 160, 1145–1158. [Google Scholar] [CrossRef]
- Rattner, J.B.; Hamkalo, B.A. Nucleosome packing in interphase chromatin. J. Cell. Biol. 1979, 81, 453–457. [Google Scholar] [CrossRef]
- Andersson, K.; Mähr, R.; Björkroth, B.; Daneholt, B. Rapid reformation of the thick chromosome fiber upon completion of RNA synthesis at the Balbiani ring genes in Chironomus tentans. Chromosoma 1982, 87, 33–48. [Google Scholar] [CrossRef] [PubMed]
- Lowary, P.T.; Widom, J. New DNA sequence rules for high affinity binding to histone octamer and sequence-directed nucleosome positioning. J. Mol. Biol. 1998, 276, 19–42. [Google Scholar] [CrossRef]
- Thåström, A.; Bingham, L.M.; Widom, J. Nucleosomal locations of dominant DNA sequence motifs for histone-DNA interactions and nucleosome positioning. J. Mol. Biol. 2004, 338, 695–709. [Google Scholar] [CrossRef]
- Chen, P.; Li, W.; Li, G. Structures and functions of chromatin fibers. Annu. Rev. Biophys. 2021, 50, 95–116. [Google Scholar] [CrossRef] [PubMed]
- Bian, Q.; Belmont, A.S. Revisiting higher-order and large-scale chromatin organization. Curr. Opin. Cell Biol. 2012, 24, 359–366. [Google Scholar] [CrossRef] [PubMed]
- Grigoryev, S.A.; Woodcock, C.L. Chromatin organization — The 30nm fiber. Exp. Cell Res. 2012, 318, 1448–1455. [Google Scholar] [CrossRef]
- Maeshima, K.; Rogge, R.; Tamura, S.; Joti, Y.; Hikima, T.; Szerlong, H.; Krause, C.; Herman, J.; Seidel, E.; DeLuca, J.; et al. Nucleosomal arrays self-assemble into supramolecular globular structures lacking 30-nm fibers. EMBO J. 2016, 35, 1115–1132. [Google Scholar] [CrossRef]
- Korolev, N.; Allahverdi, A.; Yang, Y.; Fan, Y.; Lyubartsev, A.P.; Nordenskiöld, L. Electrostatic origin of salt-induced nucleosome array compaction. Biophys. J. 2010, 99, 1896–1905. [Google Scholar] [CrossRef]
- Dorigo, B.; Schalch, T.; Bystricky, K.; Richmond, T.J. Chromatin fiber folding: Requirement for the histone H4 N-terminal tail. J. Mol. Biol. 2003, 327, 85–96. [Google Scholar] [CrossRef]
- Schwarz, P.M.; Hansen, J.C. Formation and stability of higher order chromatin structures. Contribution of the histone octamer. J. Biol. Chem. 1994, 269, 16284–16289. [Google Scholar] [CrossRef]
- Schwarz, P.M.; Felthauser, A.; Fletcher, T.M.; Hansen, J.C. Reversible oligonucleosome self-association: Dependence on divalent cations and core histone tail domains. Biochemistry 1996, 35, 4009–4015. [Google Scholar] [CrossRef] [PubMed]
- Hansen, J.C. Conformational dynamics of the chromatin fiber in solution: Determinants, mechanisms, and functions. Annu. Rev. Biophys. Biomol. Struct. 2002, 31, 361–392. [Google Scholar] [CrossRef] [PubMed]
- Ausio, J. Analytical ultracentrifugation and the characterization of chromatin structure. Biophys. Chem. 2000, 86, 141–153. [Google Scholar] [CrossRef]
- Allahverdi, A.; Yang, R.; Korolev, N.; Fan, Y.; Davey, C.A.; Liu, C.F.; Nordenskiöld, L. The effects of histone H4 tail acetylations on cation-induced chromatin folding and self-association. Nucleic Acids Res. 2011, 39, 1680–1691. [Google Scholar] [CrossRef]
- Hansen, J.C.; Maeshima, K.; Hendzel, M.J. The solid and liquid states of chromatin. Epigenetics Chromatin 2021, 14, 50. [Google Scholar] [CrossRef]
- Lyon, A.S.; Peeples, W.B.; Rosen, M.K. A framework for understanding the functions of biomolecular condensates across scales. Nat. Rev. Mol. Cell. Biol. 2021, 22, 215–235. [Google Scholar] [CrossRef] [PubMed]
- Wang, B.; Zhang, L.; Dai, T.; Qin, Z.; Lu, H.; Zhang, L.; Zhou, F. Liquid–liquid phase separation in human health and diseases. Signal Transduct. Target. Ther. 2021, 6. [Google Scholar] [CrossRef]
- Mehta, S.; Zhang, J. Liquid–liquid phase separation drives cellular function and dysfunction in cancer. Nat. Rev. Cancer 2022, 22, 239–252. [Google Scholar] [CrossRef]
- Antifeeva, I.A.; Fonin, A.V.; Fefilova, A.S.; Stepanenko, O.V.; Povarova, O.I.; Silonov, S.A.; Kuznetsova, I.M.; Uversky, V.N.; Turoverov, K.K. Liquid–liquid phase separation as an organizing principle of intracellular space: Overview of the evolution of the cell compartmentalization concept. Cell. Mol. Life Sci. 2022, 79. [Google Scholar] [CrossRef]
- Lu, H.; Yu, D.; Hansen, A.S.; Ganguly, S.; Liu, R.; Heckert, A.; Darzacq, X.; Zhou, Q. Phase-separation mechanism for C-terminal hyperphosphorylation of RNA polymerase II. Nature 2018, 558, 318–323. [Google Scholar] [CrossRef]
- Banani, S.F.; Lee, H.O.; Hyman, A.A.; Rosen, M.K. Biomolecular condensates: Organizers of cellular biochemistry. Nat. Rev. Mol. Cell. Biol. 2017, 18, 285–298. [Google Scholar] [CrossRef] [PubMed]
- Gibson, B.A.; Doolittle, L.K.; Schneider, M.W.G.; Jensen, L.E.; Gamarra, N.; Henry, L.; Gerlich, D.W.; Redding, S.; Rosen, M.K. Organization of chromatin by intrinsic and regulated phase separation. Cell 2019, 179, 470–484. [Google Scholar] [CrossRef] [PubMed]
- Strickfaden, H.; Tolsma, T.O.; Sharma, A.; Underhill, D.A.; Hansen, J.C.; Hendzel, M.J. Condensed chromatin behaves like a solid on the mesoscale In vitro and in living cells. Cell 2020, 183, 1772–1784. [Google Scholar] [CrossRef] [PubMed]
- Shi, X.; Prasanna, C.; Pervushin, K.; Nordenskiöld, L. Solid-state NMR 13C, 15N assignments of human histone H3 in the nucleosome core particle. Biomol. NMR Assign. 2020, 14, 99–104. [Google Scholar] [CrossRef]
- Shi, X.; Prasanna, C.; Nagashima, T.; Yamazaki, T.; Pervushin, K.; Nordenskiold, L. Structure and dynamics in the nucleosome revealed by solid-state NMR. Angew. Chem. 2018, 57, 9734–9738. [Google Scholar] [CrossRef]
- Chen, Q.; Yang, R.; Korolev, N.; Liu, C.F.; Nordenskiöld, L. Regulation of nucleosome stacking and chromatin compaction by the histone H4 N-terminal tail–H2A acidic patch interaction. J. Mol. Biol. 2017, 429, 2075–2092. [Google Scholar] [CrossRef]
- Shoaib, M.; Chen, Q.; Shi, X.; Nair, N.; Prasanna, C.; Yang, R.; Walter, D.; Frederiksen, K.S.; Einarsson, H.; Svensson, J.P.; et al. Histone H4 lysine 20 mono-methylation directly facilitates chromatin openness and promotes transcription of housekeeping genes. Nature Commun. 2021, 12. [Google Scholar] [CrossRef]
- Korolev, N.; Zinchenko, A.; Soman, A.; Chen, Q.; Wong, S.Y.; Berezhnoy, N.V.; Basak, R.; van der Maarel, J.R.C.; van Noort, J.; Nordenskiöld, L. Reconstituted TAD-size chromatin fibers feature heterogeneous nucleosome clusters. Sci. Rep. 2022, 12. [Google Scholar] [CrossRef]
- Soman, A.; Wong, S.Y.; Korolev, N.; Surya, W.; Lattmann, S.; Vogirala, V.K.; Chen, Q.; Berezhnoy, N.V.; van Noort, J.; Rhodes, D.; et al. Columnar structure of human telomeric chromatin. Nature 2022, 609, 1048–1055. [Google Scholar] [CrossRef]
- Huynh, V.A.T.; Robinson, P.J.J.; Rhodes, D. A method for the in vitro reconstitution of a defined “30nm” chromatin fibre containing stoichiometric amounts of the linker histone. J. Mol. Biol. 2005, 345, 957–968. [Google Scholar] [CrossRef]
- Robinson, P.J.J.; Fairall, L.; Huynh, V.A.T.; Rhodes, D. EM measurements define the dimensions of the “30-nm” chromatin fiber: Evidence for a compact, interdigitated structure. Proc. Natl. Acad. Sci. USA 2006, 103, 6506–6511. [Google Scholar] [CrossRef] [PubMed]
- Robinson, P.J.J.; An, W.; Routh, A.; Martino, F.; Chapman, L.; Roeder, R.G.; Rhodes, D. 30 nm chromatin fibre decompaction requires both H4-K16 acetylation and linker histone eviction. J. Mol. Biol. 2008, 381, 816–825. [Google Scholar] [CrossRef] [PubMed]
- Routh, A.; Sandin, S.; Rhodes, D. Nucleosome repeat length and linker histone stoichiometry determine chromatin fiber structure. Proc. Natl. Acad. Sci. USA 2008, 105, 8872–8877. [Google Scholar] [CrossRef] [PubMed]
- Wang, L.; Gao, Y.; Zheng, X.; Liu, C.; Dong, S.; Li, R.; Zhang, G.; Wei, Y.; Qu, H.; Li, Y.; et al. Histone modifications regulate chromatin compartmentalization by contributing to a phase separation mechanism. Mol. Cell 2019, 76, 646–659.e646. [Google Scholar] [CrossRef] [PubMed]
- Wang, L.; Hu, M.; Zuo, M.-Q.; Zhao, J.; Wu, D.; Huang, L.; Wen, Y.; Li, Y.; Chen, P.; Bao, X.; et al. Rett syndrome-causing mutations compromise MeCP2-mediated liquid–liquid phase separation of chromatin. Cell Res. 2020, 30, 393–407. [Google Scholar] [CrossRef] [PubMed]
- Hergeth, S.P.; Schneider, R. The H1 linker histones: Multifunctional proteins beyond the nucleosomal core particle. EMBO Rep. 2015, 16, 1439–1453. [Google Scholar] [CrossRef]
- Bednar, J.; Garcia-Saez, I.; Boopathi, R.; Cutter, A.R.; Papai, G.; Reymer, A.; Syed, S.H.; Lone, I.N.; Tonchev, O.; Crucifix, C.; et al. Structure and dynamics of a 197 bp nucleosome in complex with linker histone H1. Mol. Cell 2017, 66, 384–397.e388. [Google Scholar] [CrossRef]
- Wang, S.; Vogirala, V.K.; Soman, A.; Berezhnoy, N.V.; Liu, Z.B.; Wong, A.S.W.; Korolev, N.; Su, C.-J.; Sandin, S.; Nordenskiöld, L. Linker histone defines structure and self-association behaviour of the 177 bp human chromatosome. Sci. Rep. 2021, 11. [Google Scholar] [CrossRef]
- Turner, A.L.; Watson, M.; Wilkins, O.G.; Cato, L.; Travers, A.; Thomas, J.O.; Stott, K. Highly disordered histone H1−DNA model complexes and their condensates. Proc. Natl. Acad. Sci. USA 2018, 115, 11964–11969. [Google Scholar] [CrossRef]


Publisher’s Note: MDPI stays neutral with regard to jurisdictional claims in published maps and institutional affiliations. |
© 2022 by the authors. Licensee MDPI, Basel, Switzerland. This article is an open access article distributed under the terms and conditions of the Creative Commons Attribution (CC BY) license (https://creativecommons.org/licenses/by/4.0/).
Share and Cite
Chen, Q.; Zhao, L.; Soman, A.; Arkhipova, A.Y.; Li, J.; Li, H.; Chen, Y.; Shi, X.; Nordenskiöld, L. Chromatin Liquid–Liquid Phase Separation (LLPS) Is Regulated by Ionic Conditions and Fiber Length. Cells 2022, 11, 3145. https://doi.org/10.3390/cells11193145
Chen Q, Zhao L, Soman A, Arkhipova AY, Li J, Li H, Chen Y, Shi X, Nordenskiöld L. Chromatin Liquid–Liquid Phase Separation (LLPS) Is Regulated by Ionic Conditions and Fiber Length. Cells. 2022; 11(19):3145. https://doi.org/10.3390/cells11193145
Chicago/Turabian StyleChen, Qinming, Lei Zhao, Aghil Soman, Anastasia Yu Arkhipova, Jindi Li, Hao Li, Yinglu Chen, Xiangyan Shi, and Lars Nordenskiöld. 2022. "Chromatin Liquid–Liquid Phase Separation (LLPS) Is Regulated by Ionic Conditions and Fiber Length" Cells 11, no. 19: 3145. https://doi.org/10.3390/cells11193145