

FGFR2 Mutation p.Cys342Arg Enhances Mitochondrial Metabolism-Mediated Osteogenesis via FGF/FGFR-AMPK-Erk1/2 Axis in Crouzon Syndrome
 and
and 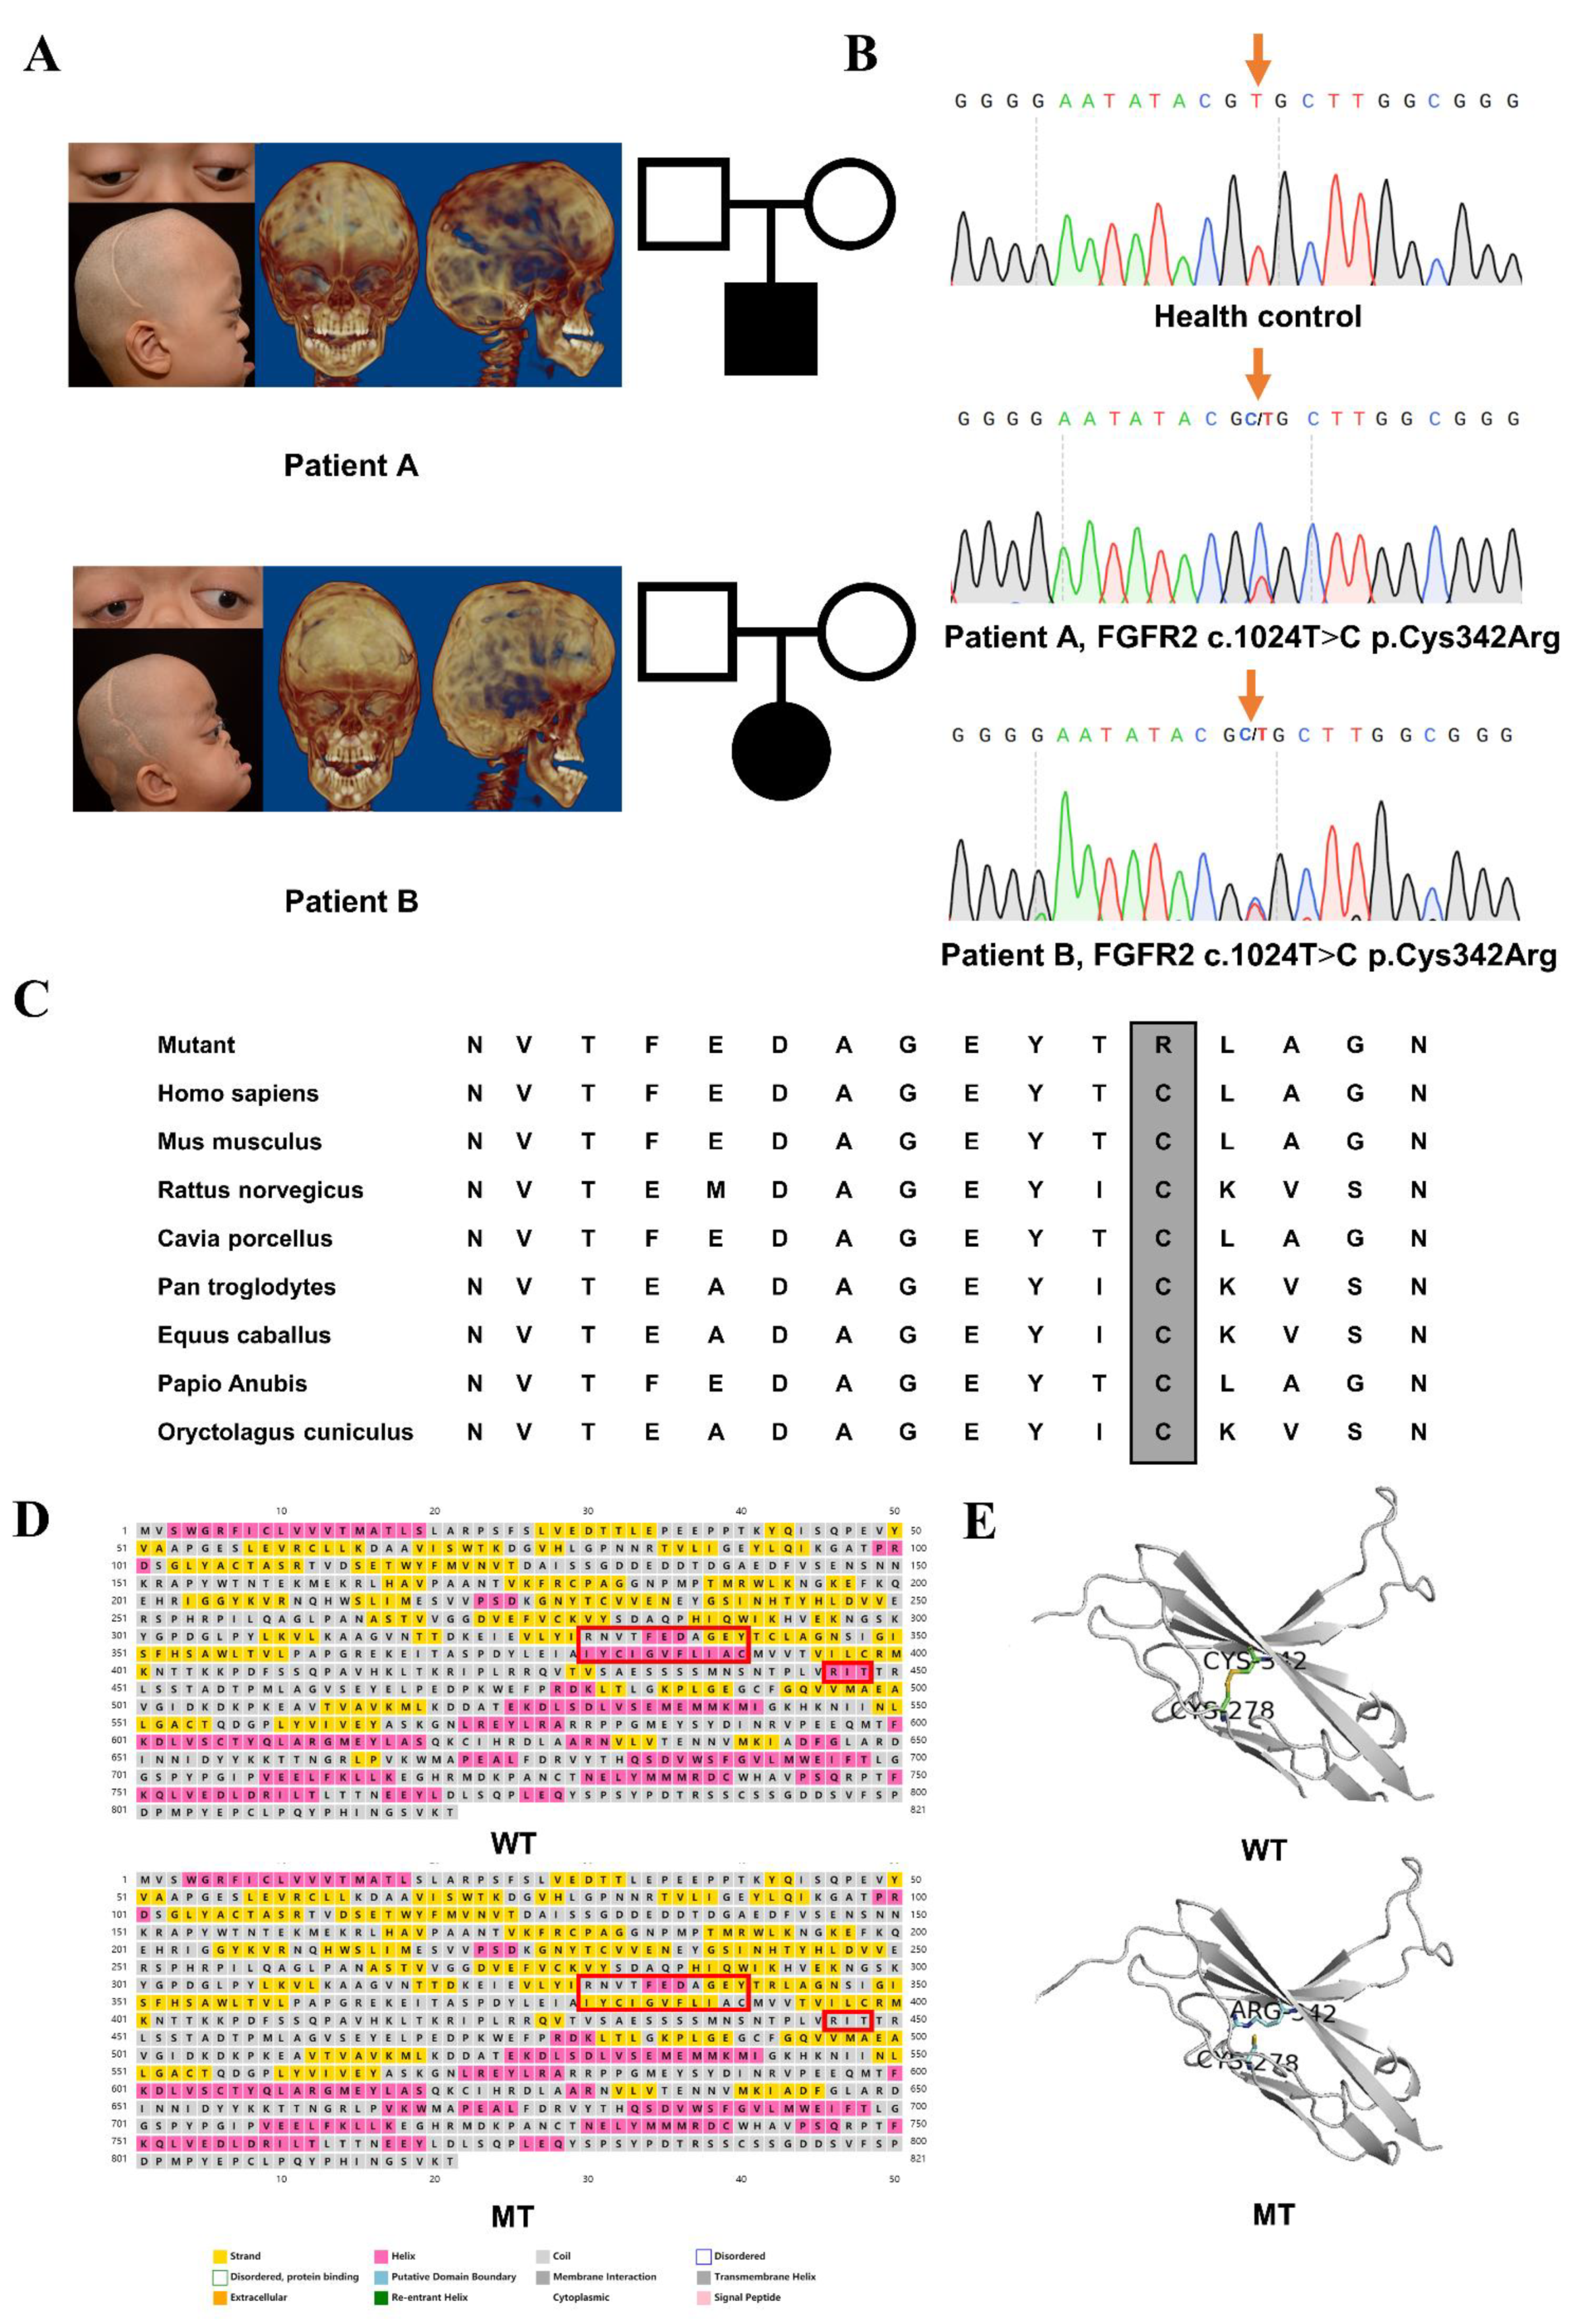
Abstract
:1. Introduction
2. Materials and Methods
2.1. Participants and Clinical Evaluations
2.2. Mutation Screening and Pathogenic Analysis
2.3. Cell Culture, Transfection and Osteogenic Induction
2.4. Cell Proliferation Assay
2.5. Quantitative Real-Time PCR
2.6. Western Blot Analysis
2.7. Staining and Activity of ALP
2.8. Alizarin Red Staining and Quantification of Mineralized Osteoblast Cultures
2.9. XF24 Cell Mitochondria Stress Test
2.10. Mitochondrial Staining
2.11. Culture of Calvarias
2.12. Micro-CT Scan and Analysis
2.13. H&E Staining
2.14. Statistical Analysis
3. Results
3.1. Clinical Findings
3.2. Identified Mutation and Pathogenic Assessments
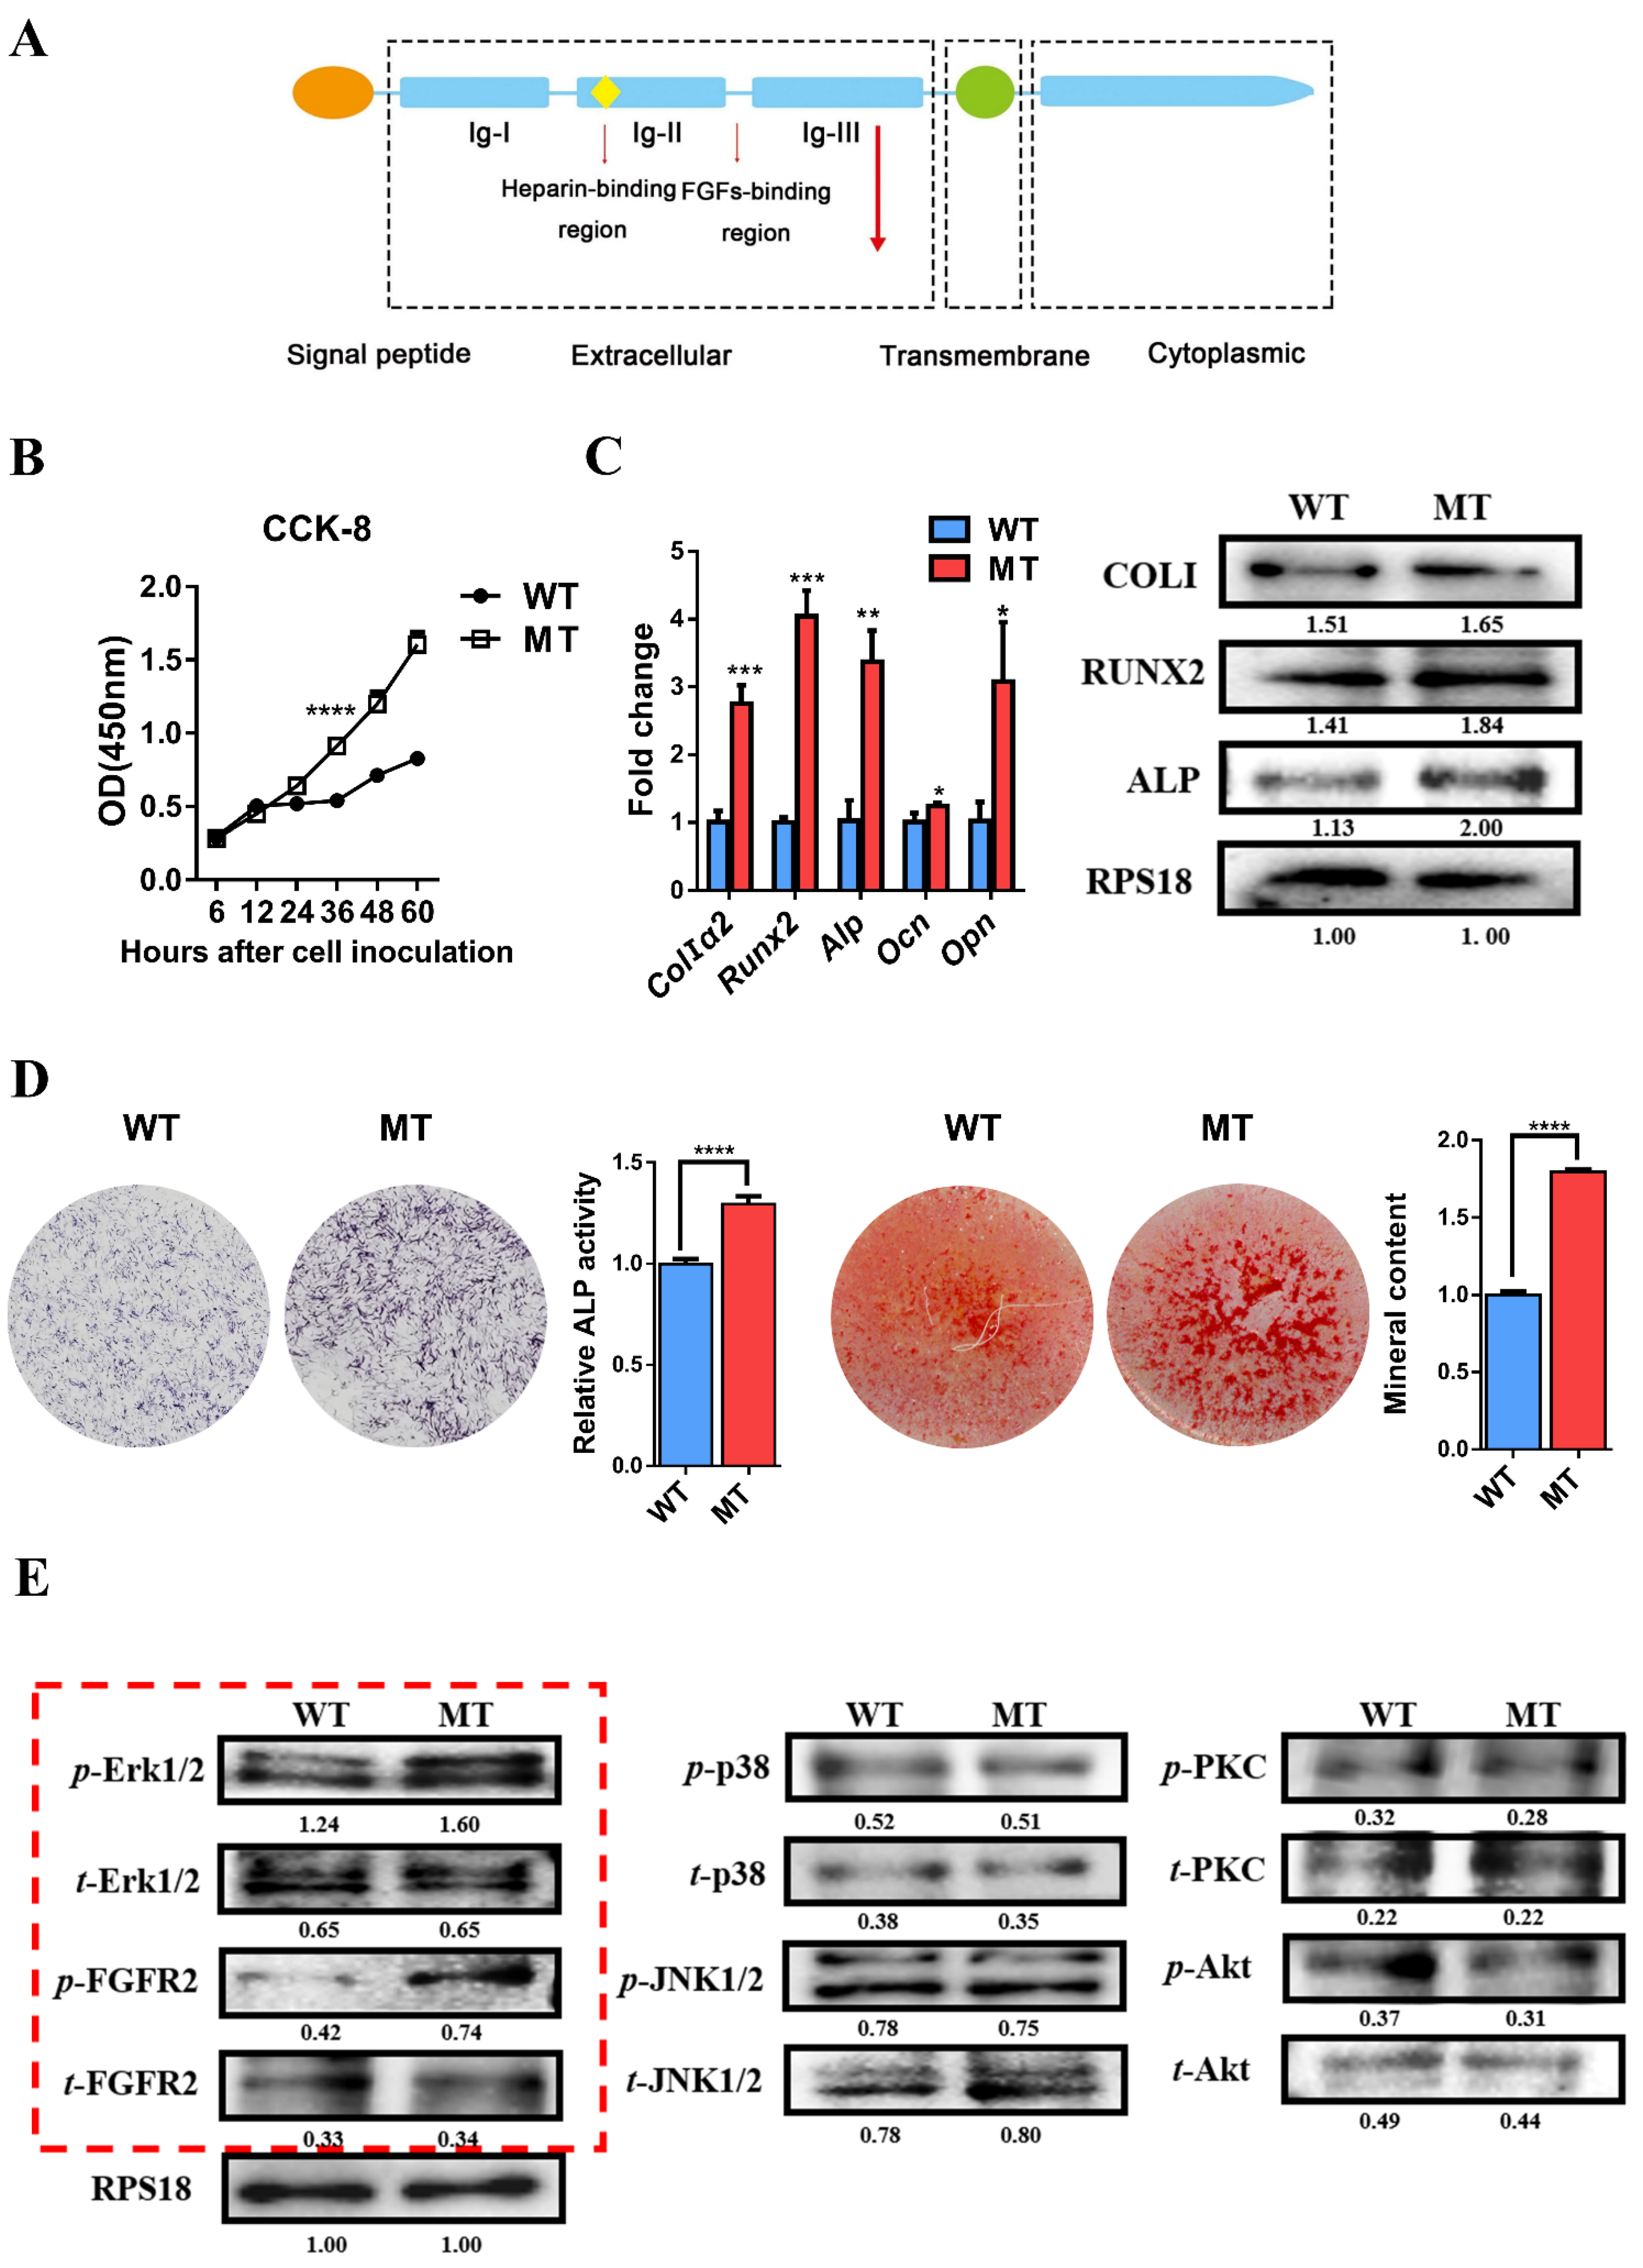
3.3. Mutation of FGFR2 Promotes Osteogenic Differentiation of Pre-Osteoblasts and Overactivation of Erk1/2 Pathway Influences Osteogenesis
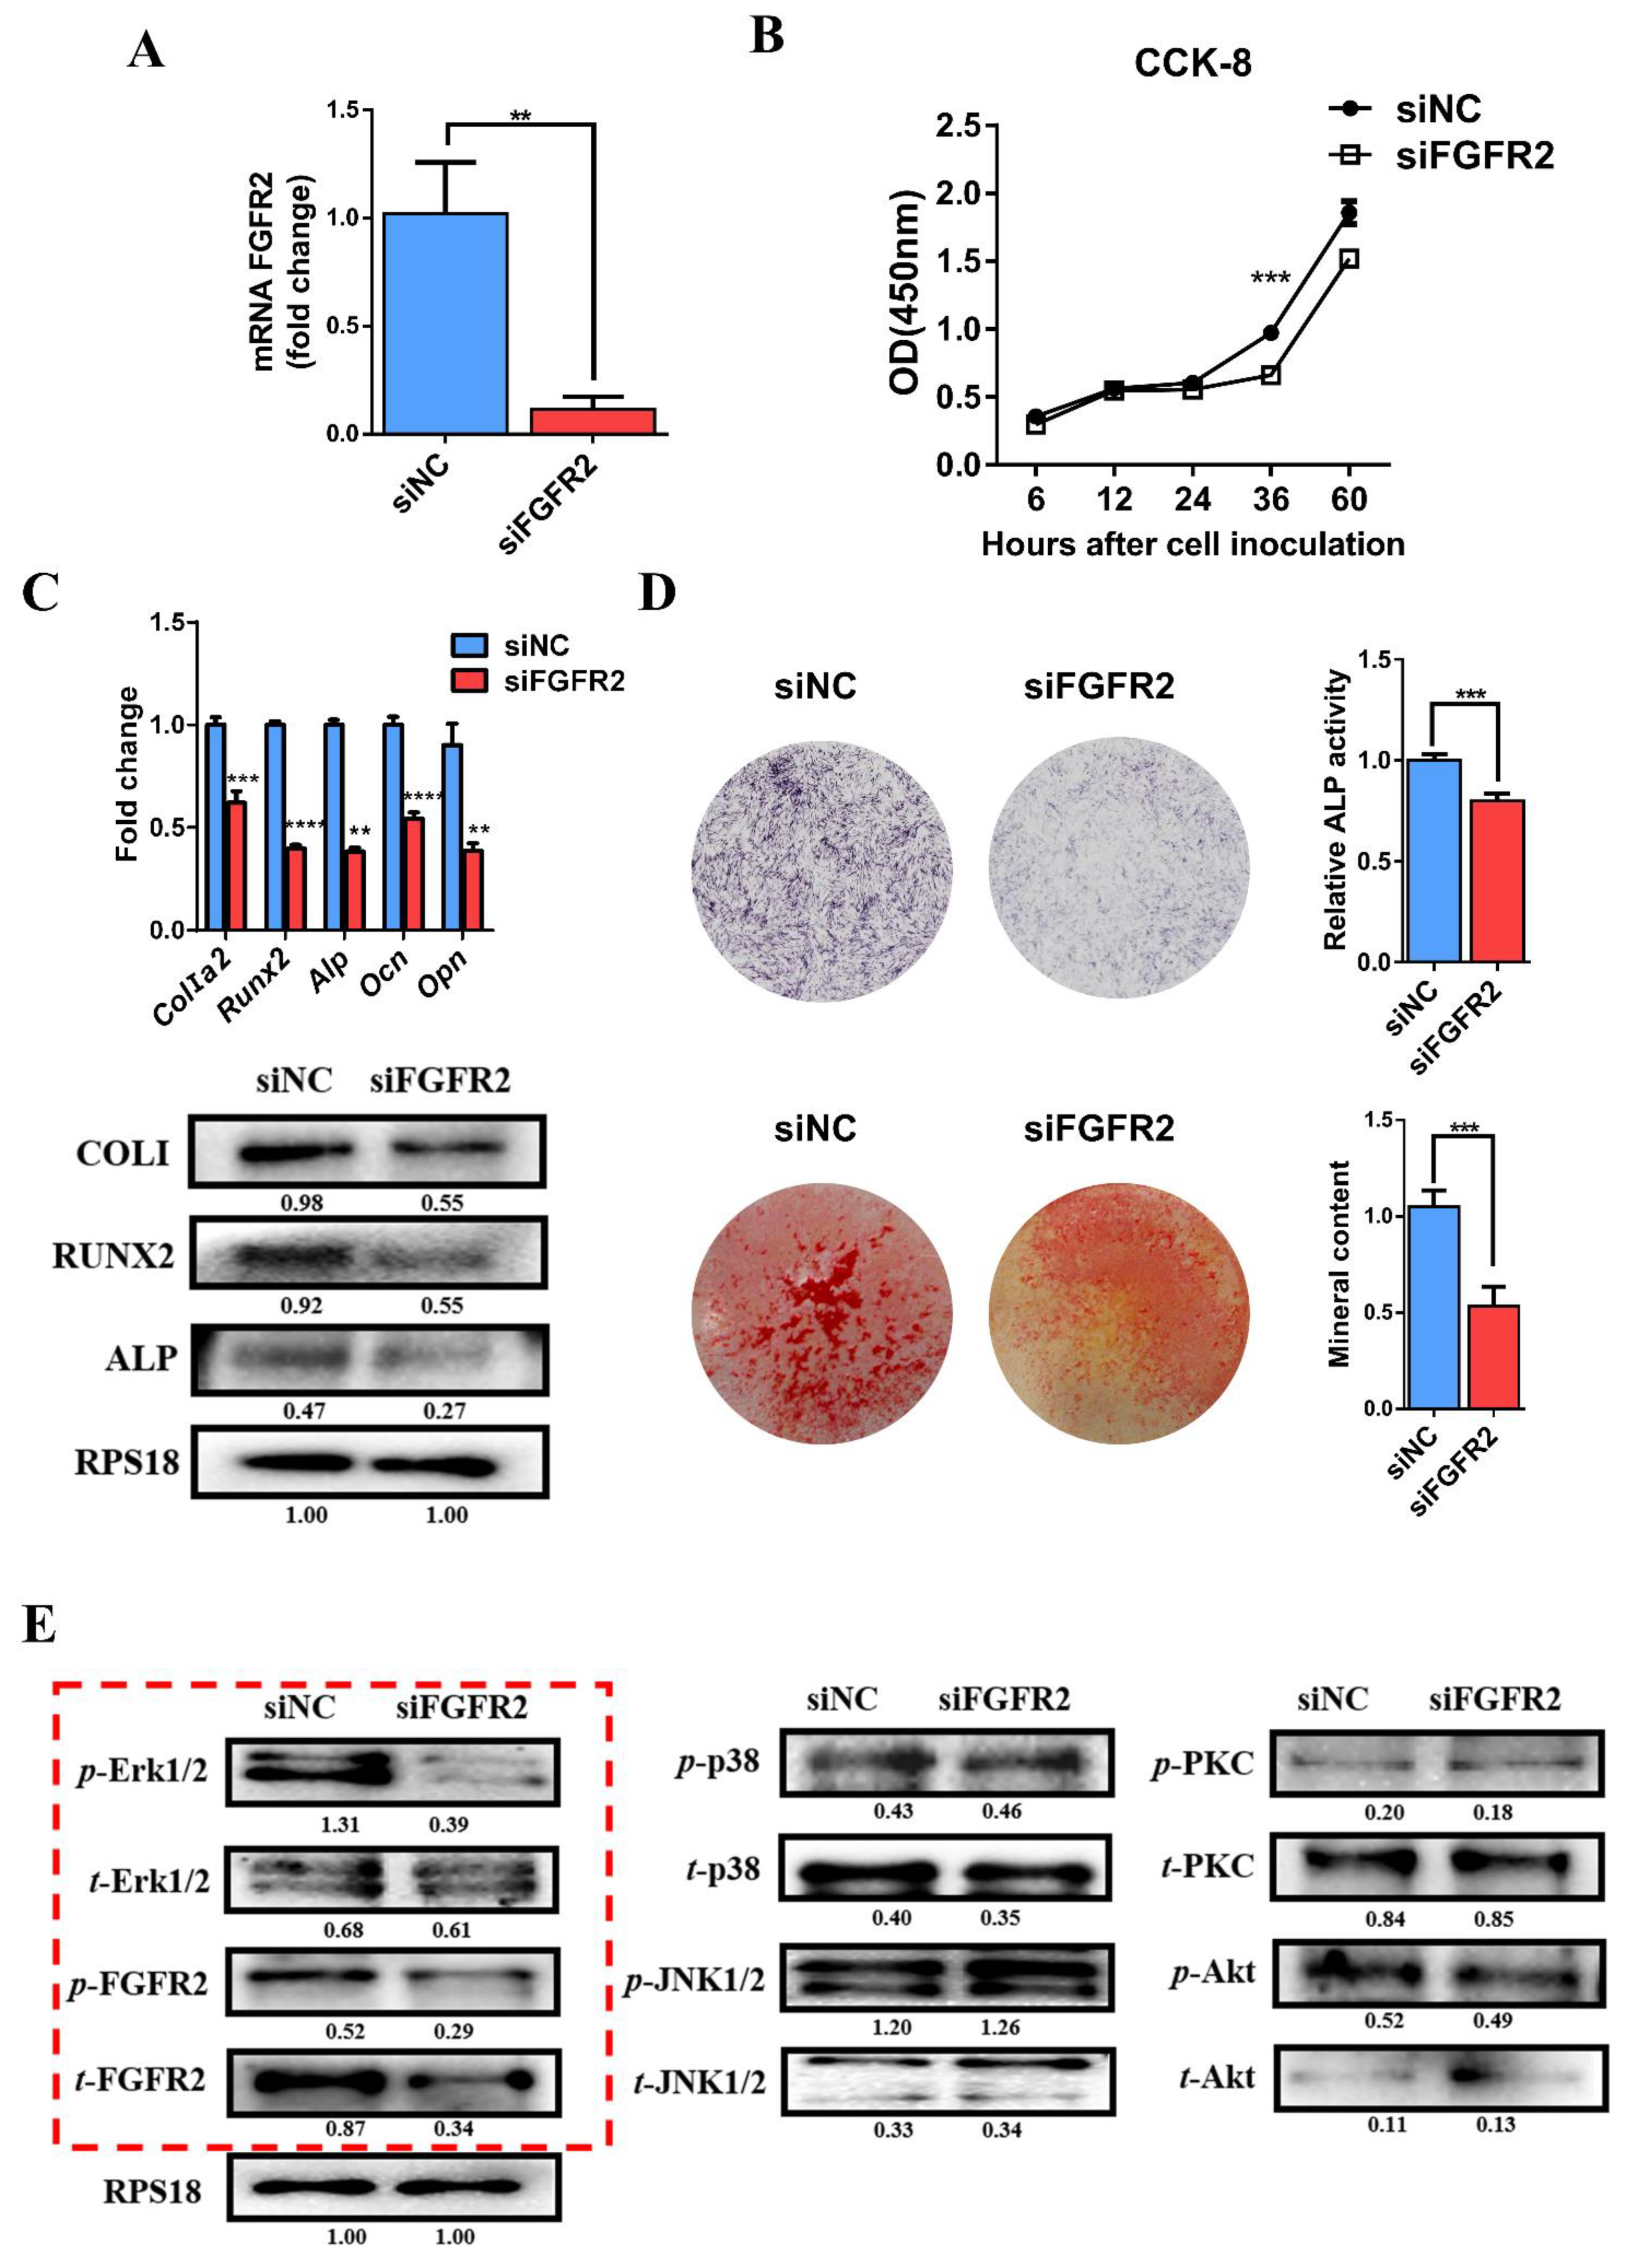
3.4. siRNA-Induced Knockdown of FGFR2 Expression Inhibits Osteogenic Differentiation and Erk1/2 Signaling Pathway In Vitro
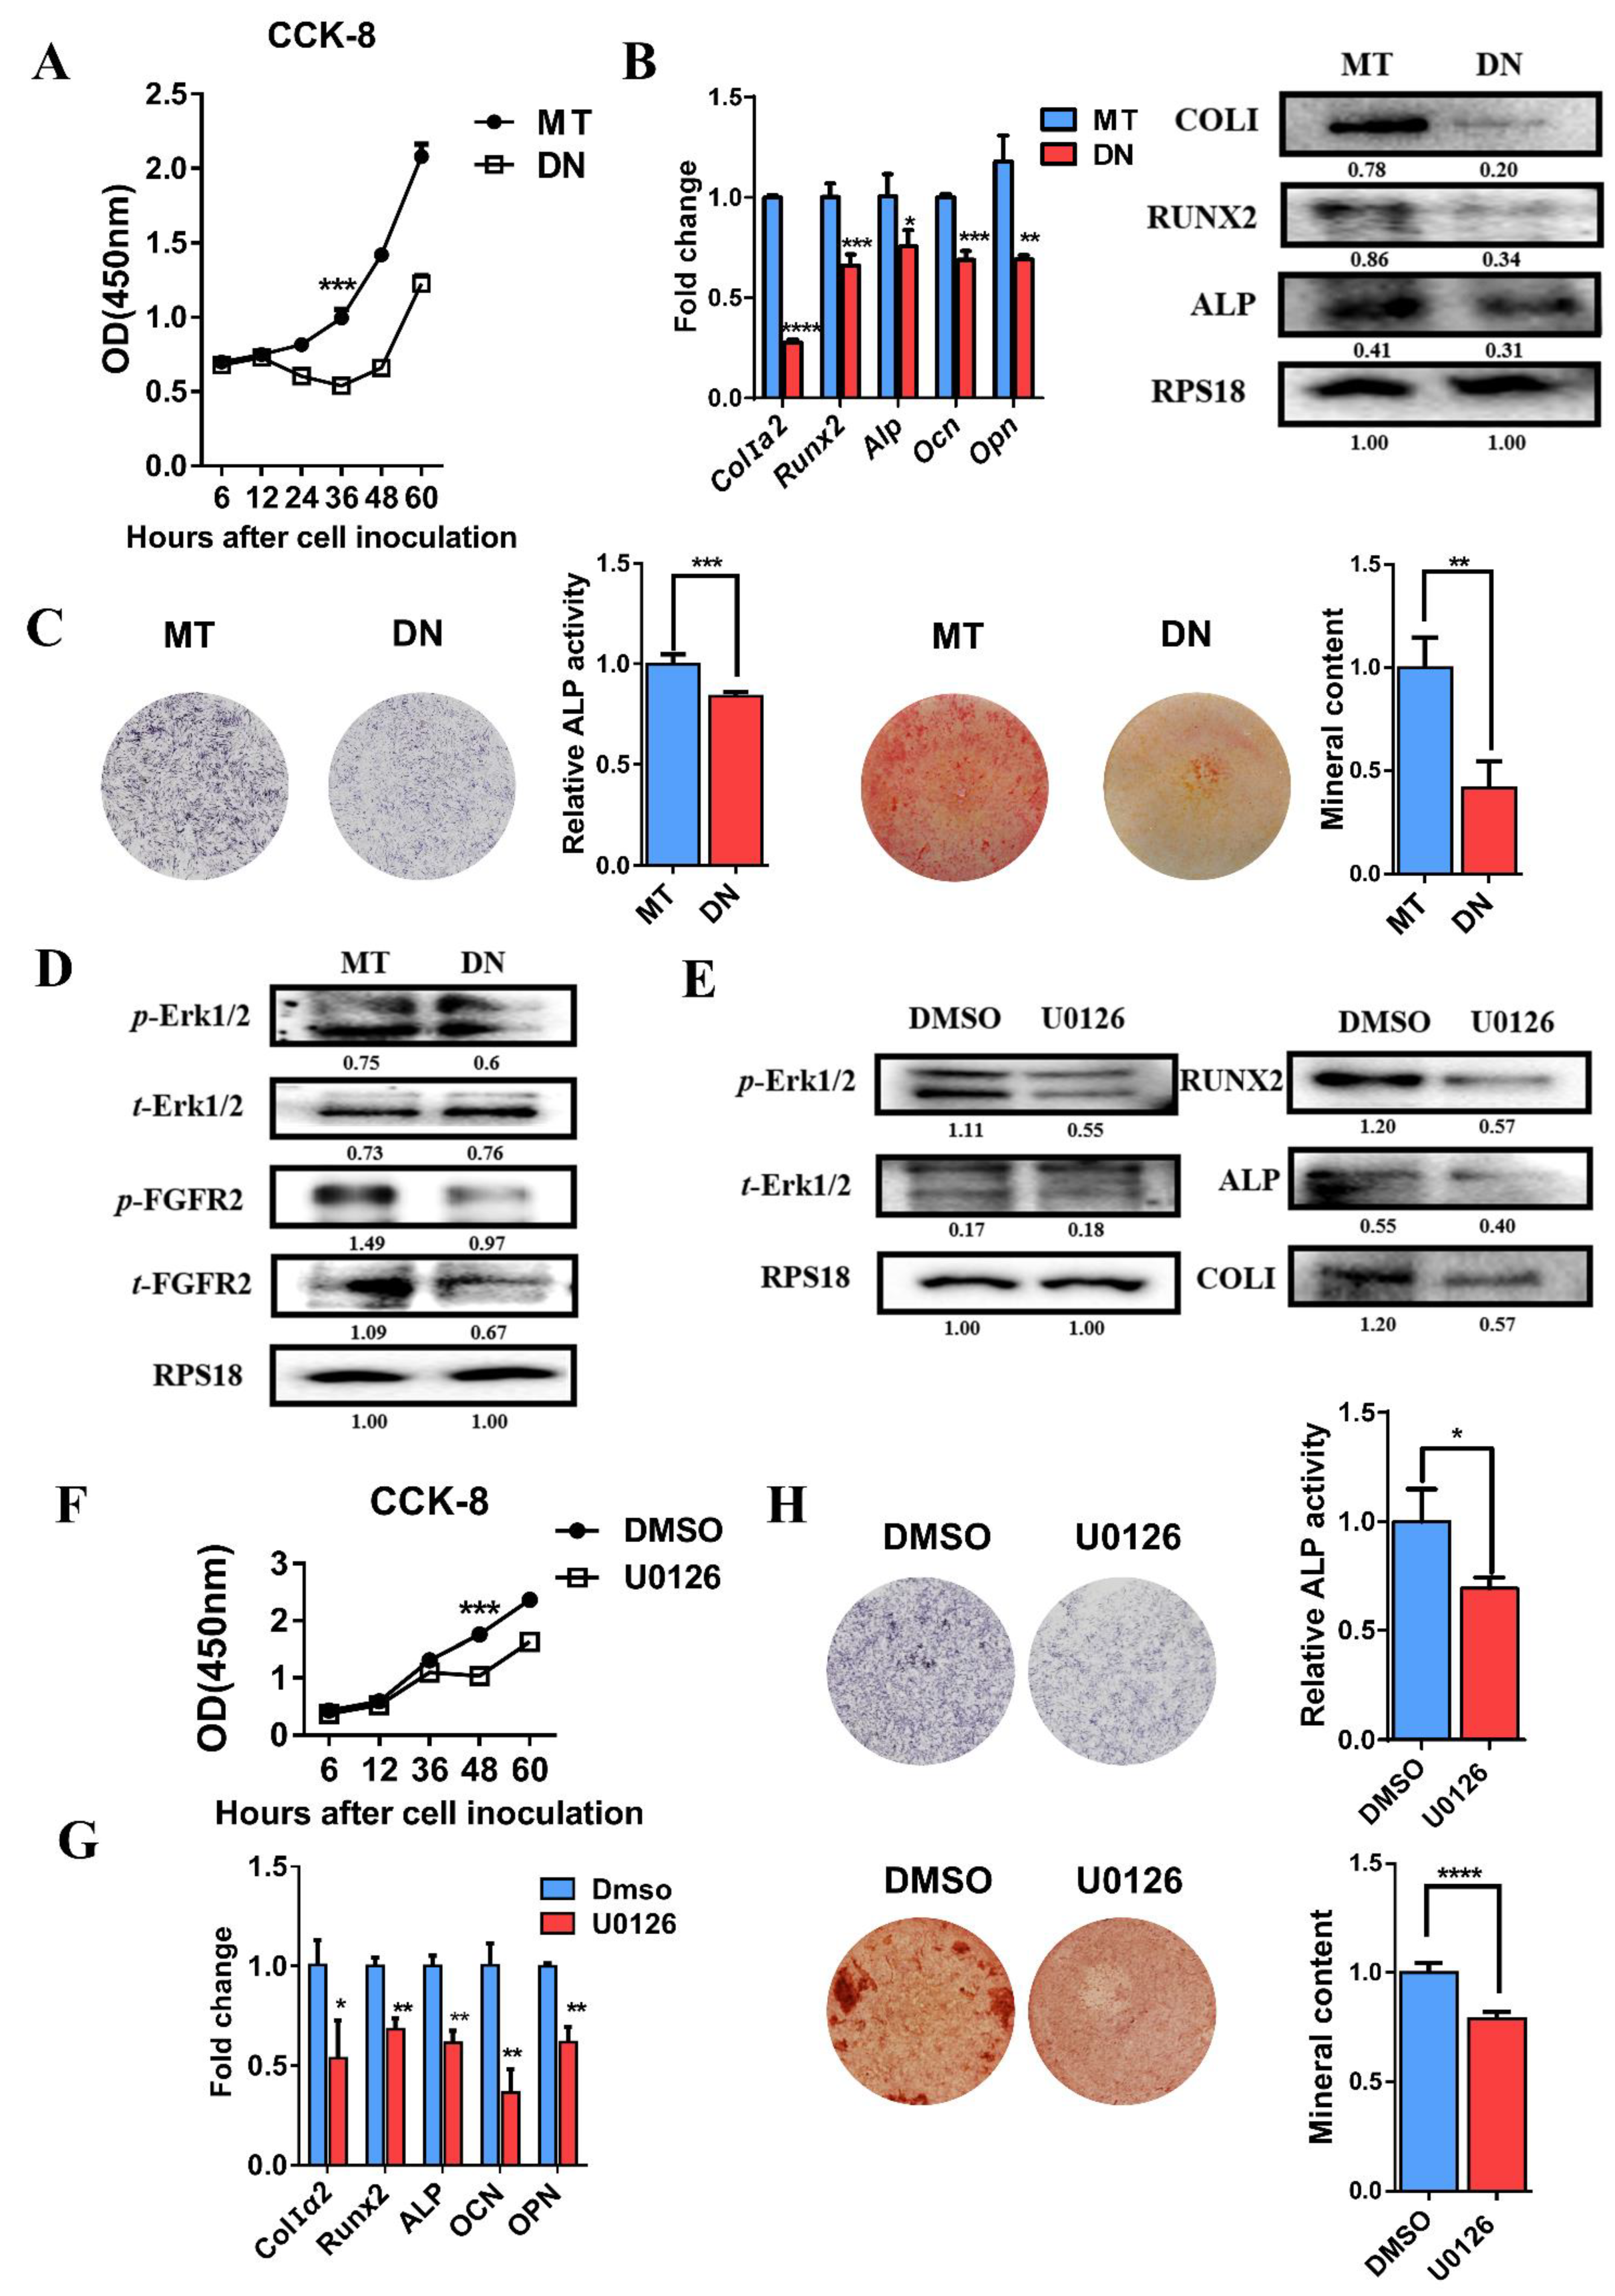
3.5. Domain Negative FGFR2 Yields the Weakened Osteogenic Differentiation through Erk1/2 Signaling Pathway
3.6. Decreased Osteogenic Differentiation Activity after Using Erk1/2 Inhibitor U0126
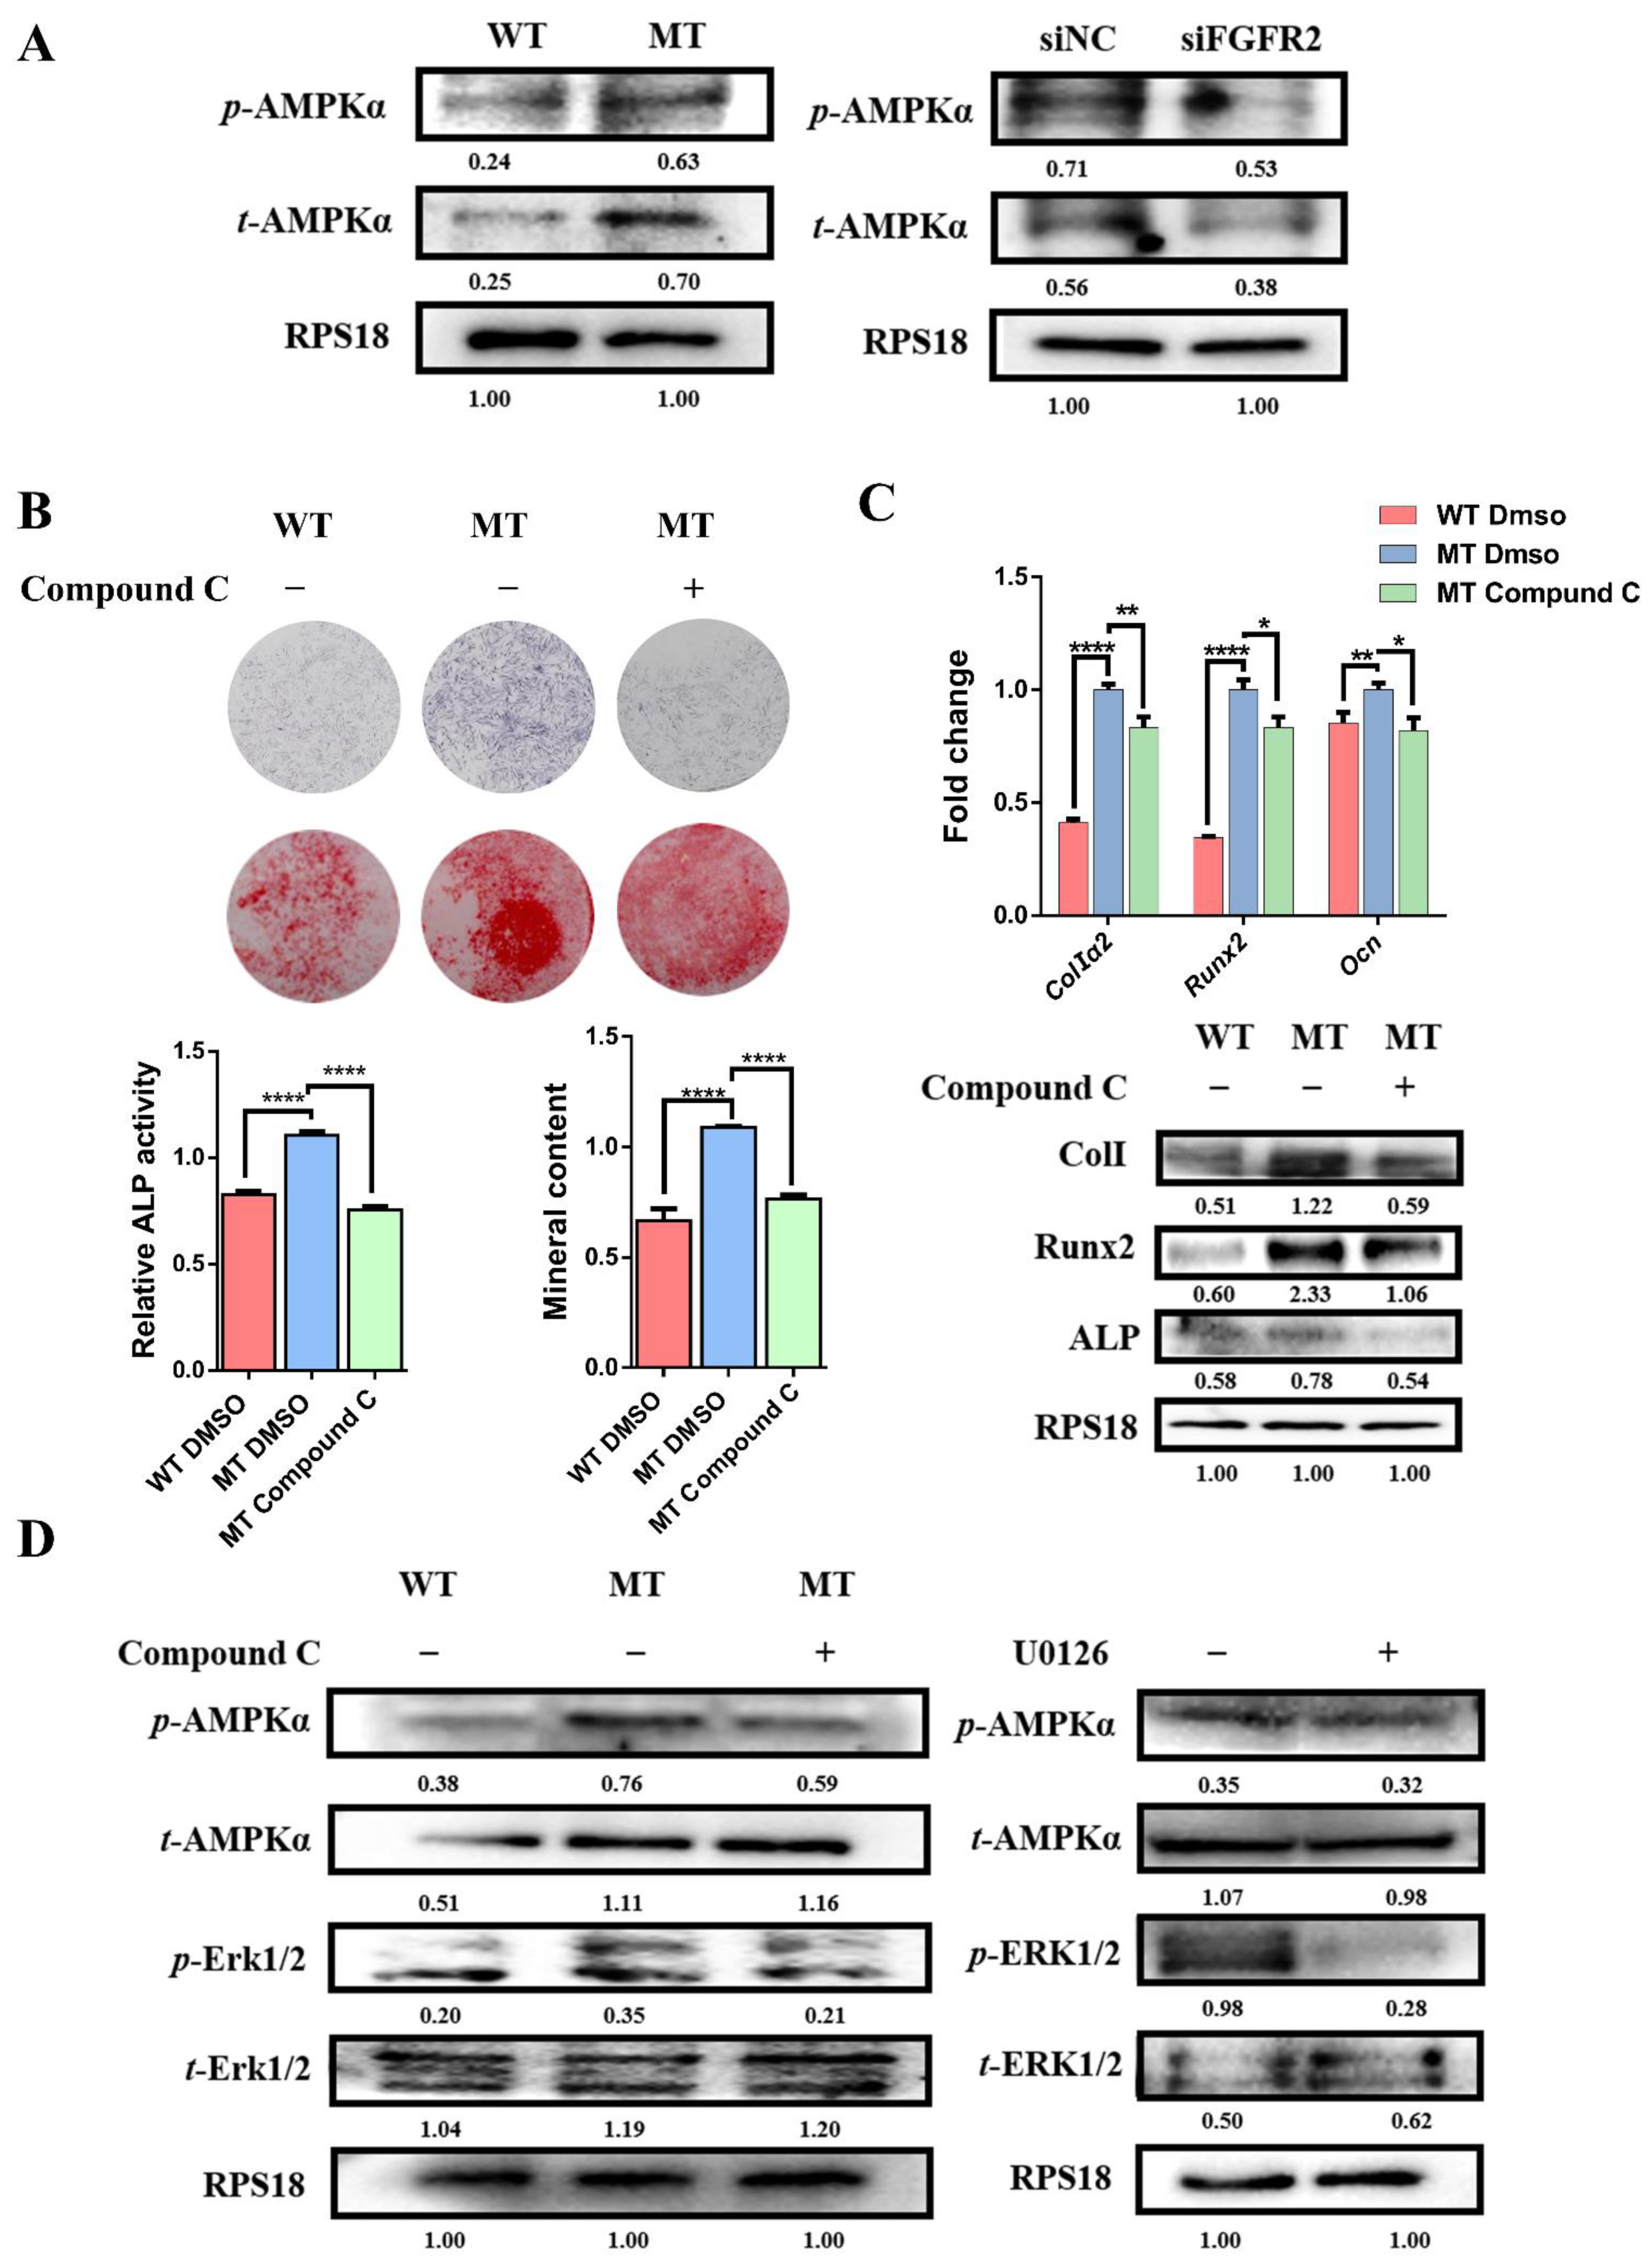
3.7. Activation of AMPK-Erk1/2 Pathway Contributes to Dysregulated Osteogenesis by FGFR2 p.Cys342Arg
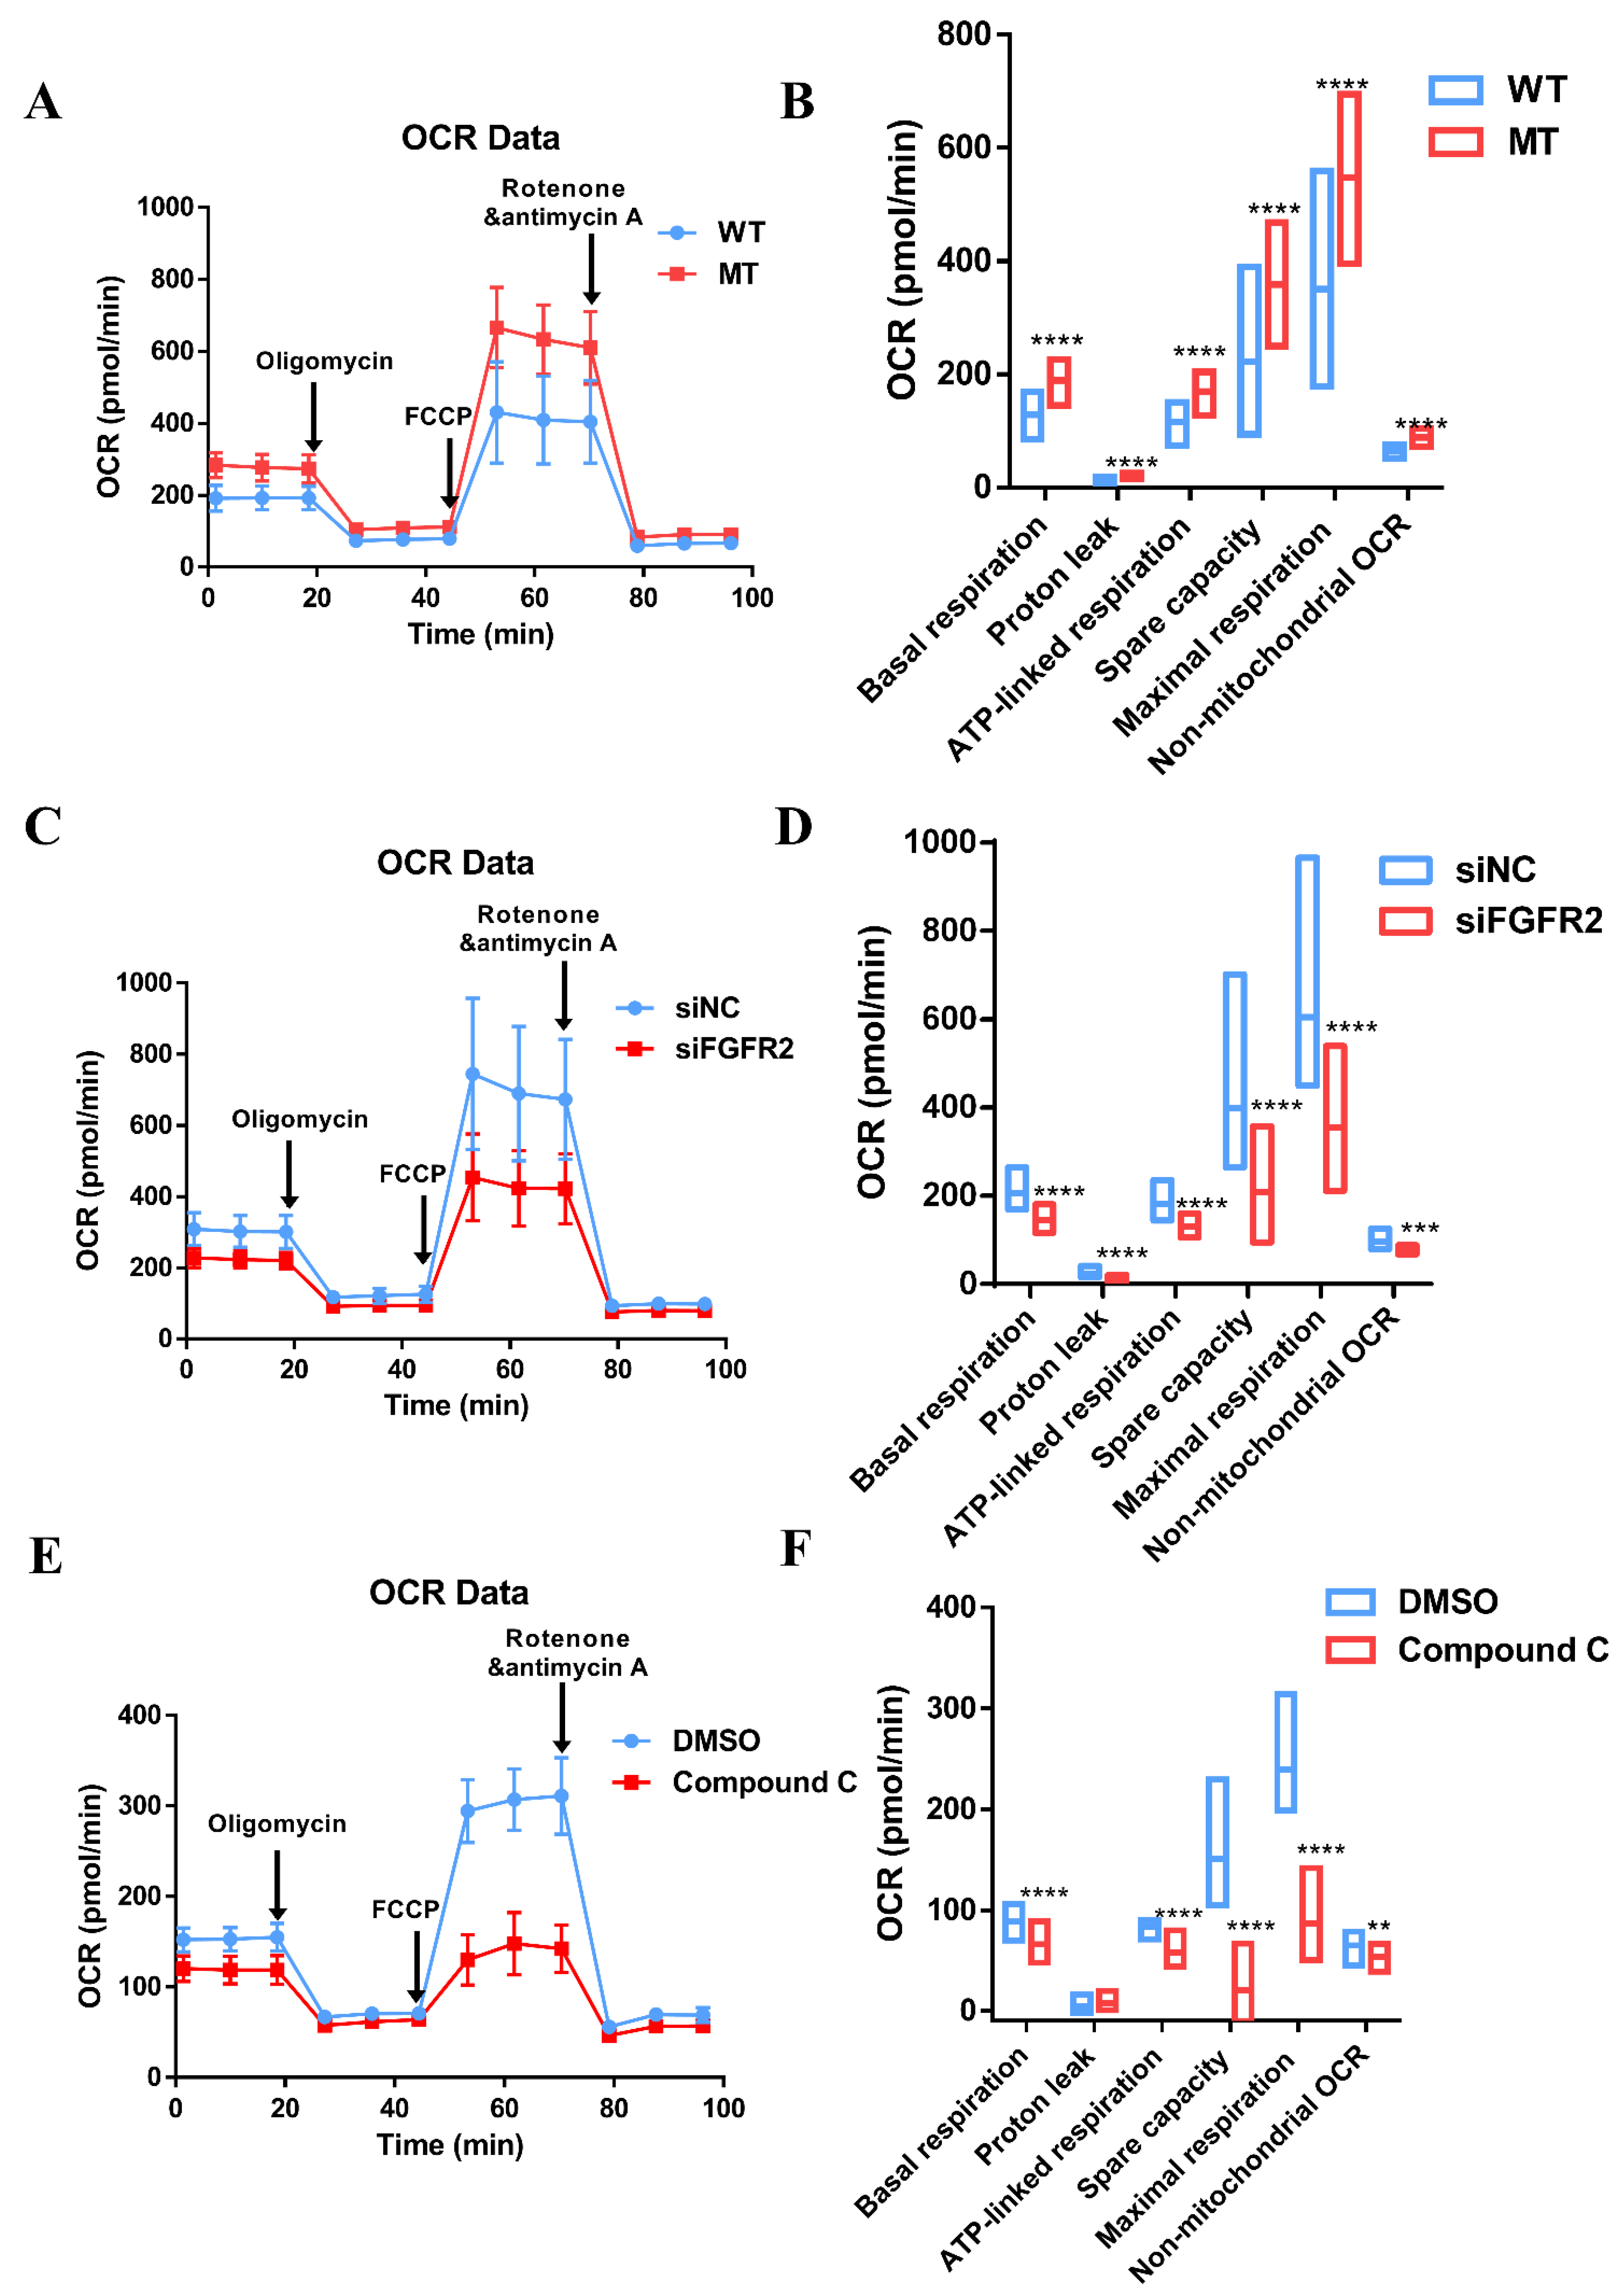
3.8. Augmentation of Mitochondria Respiration Function Impacted by Overactivated FGF/FGFR-AMPK
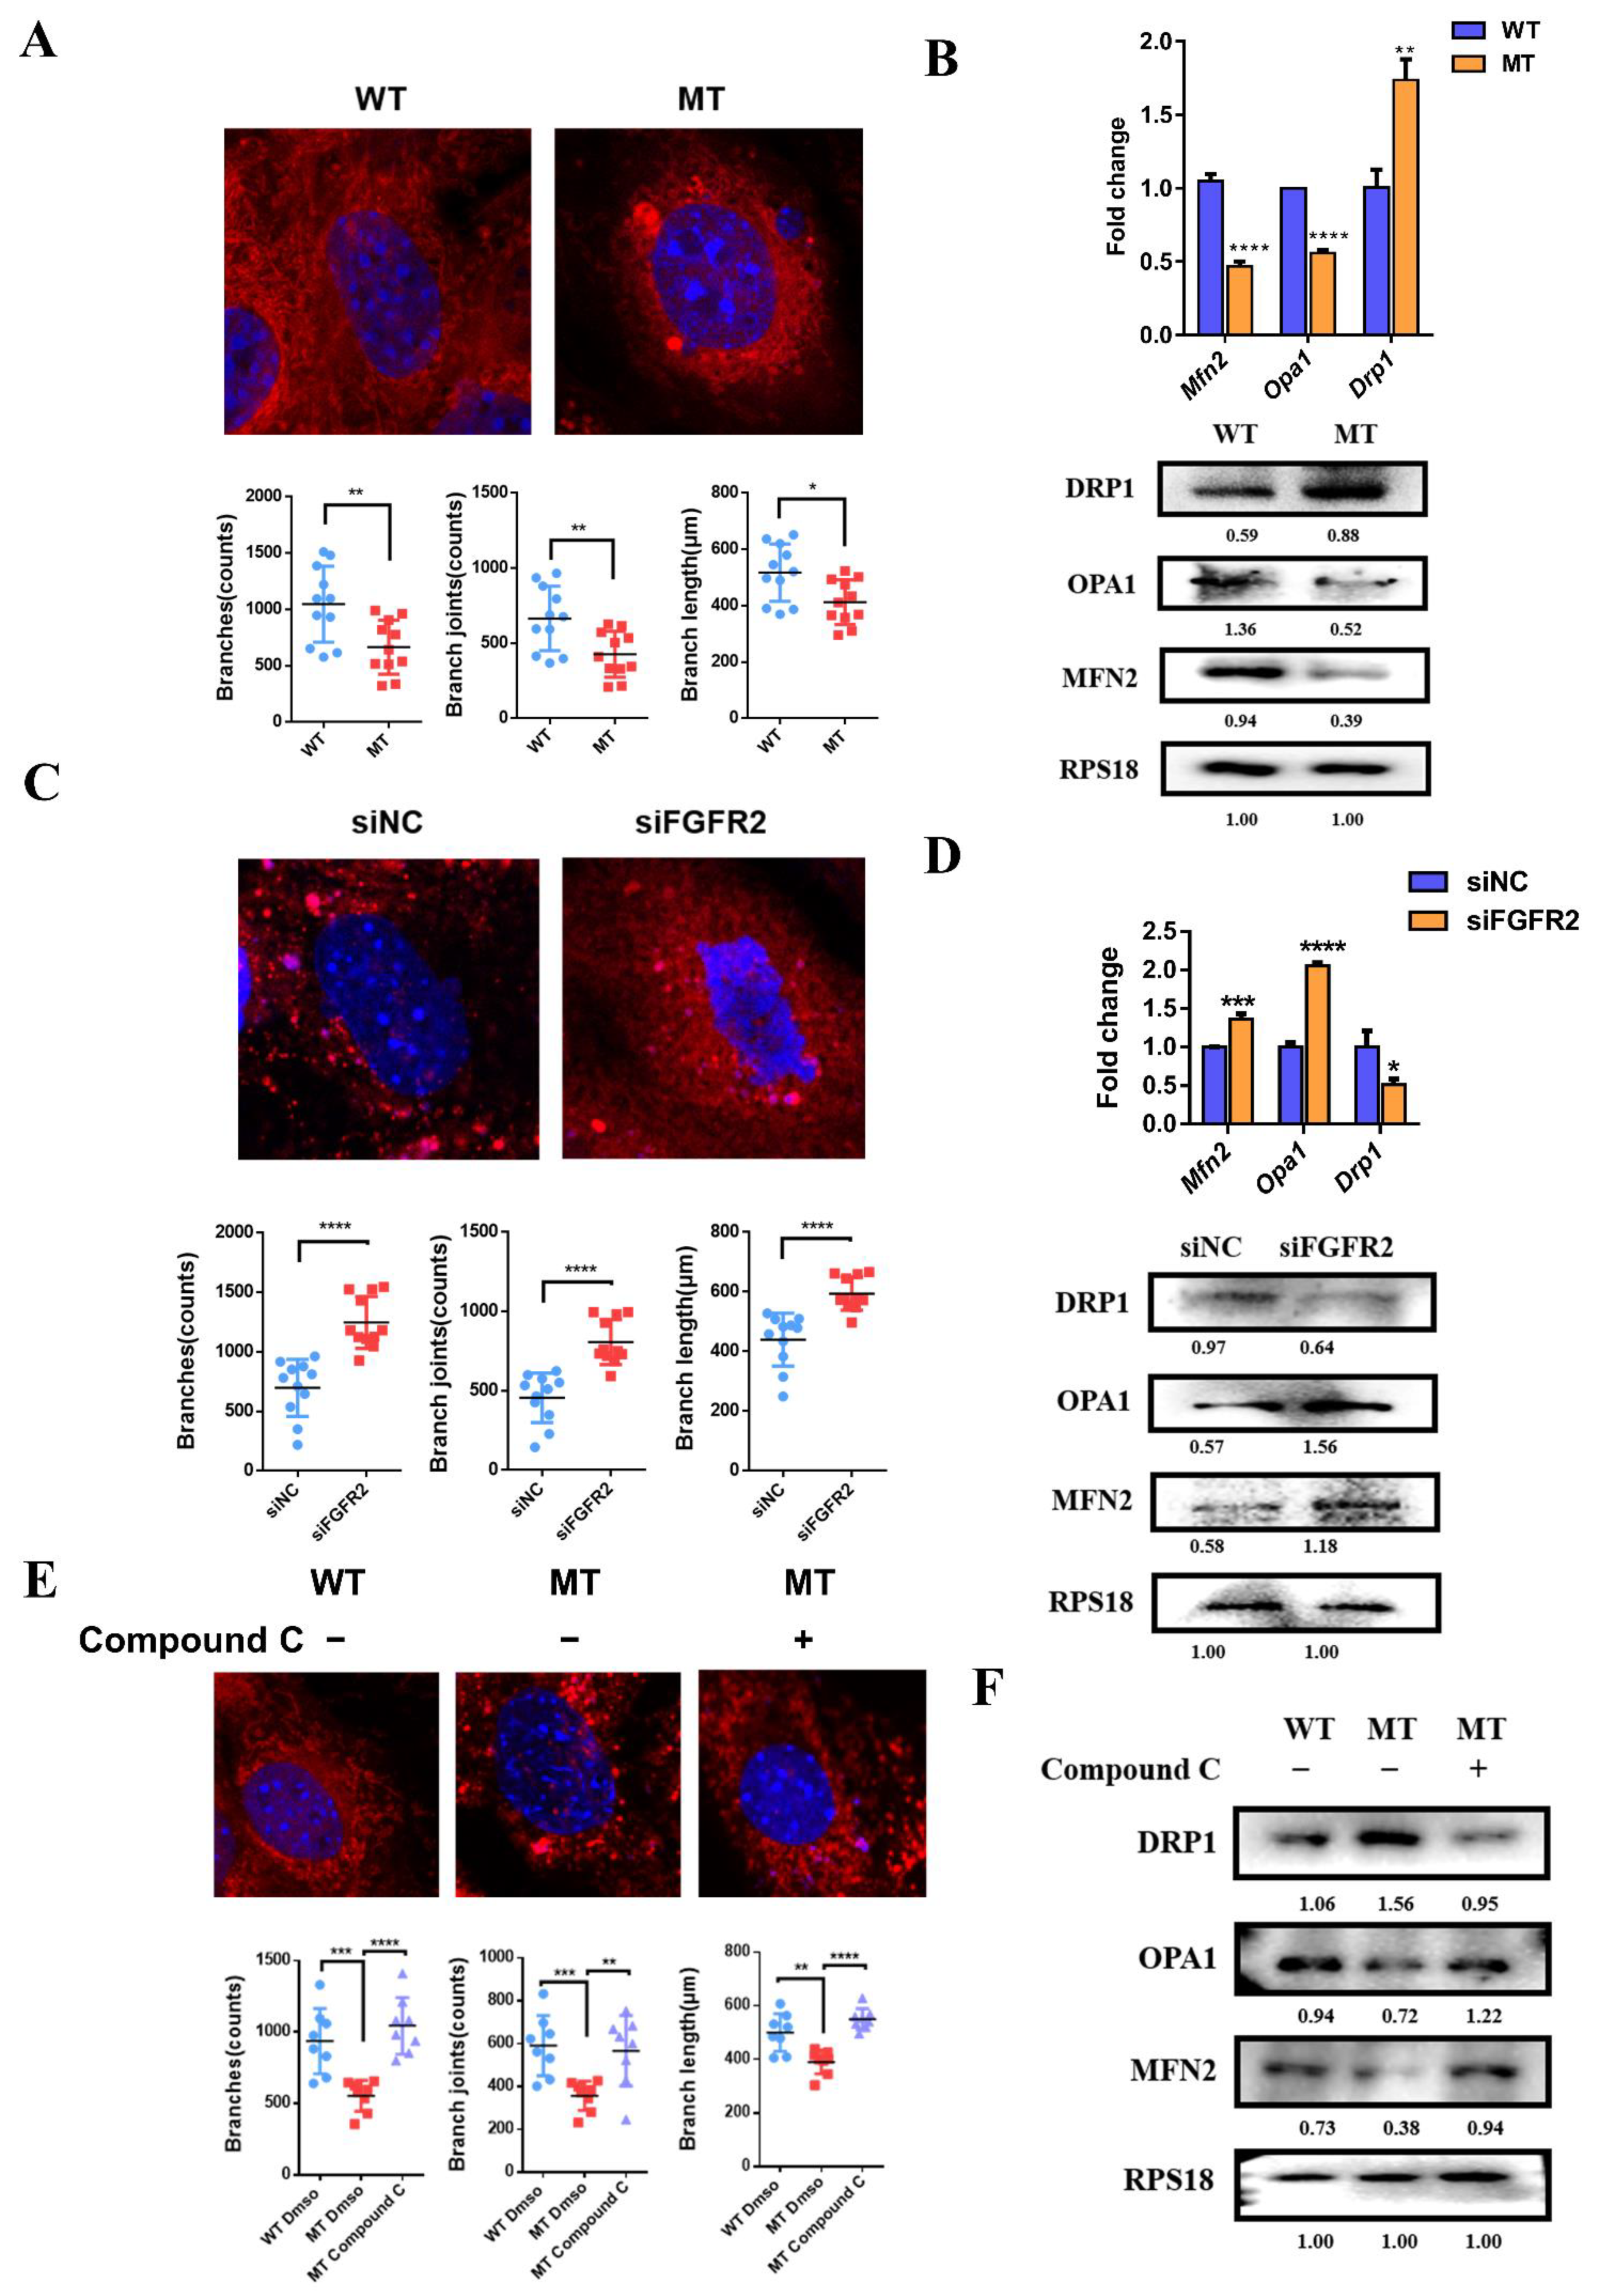
3.9. The Effects of FGF/FGFR2-AMPK Axis on Mitochondrial Morphology
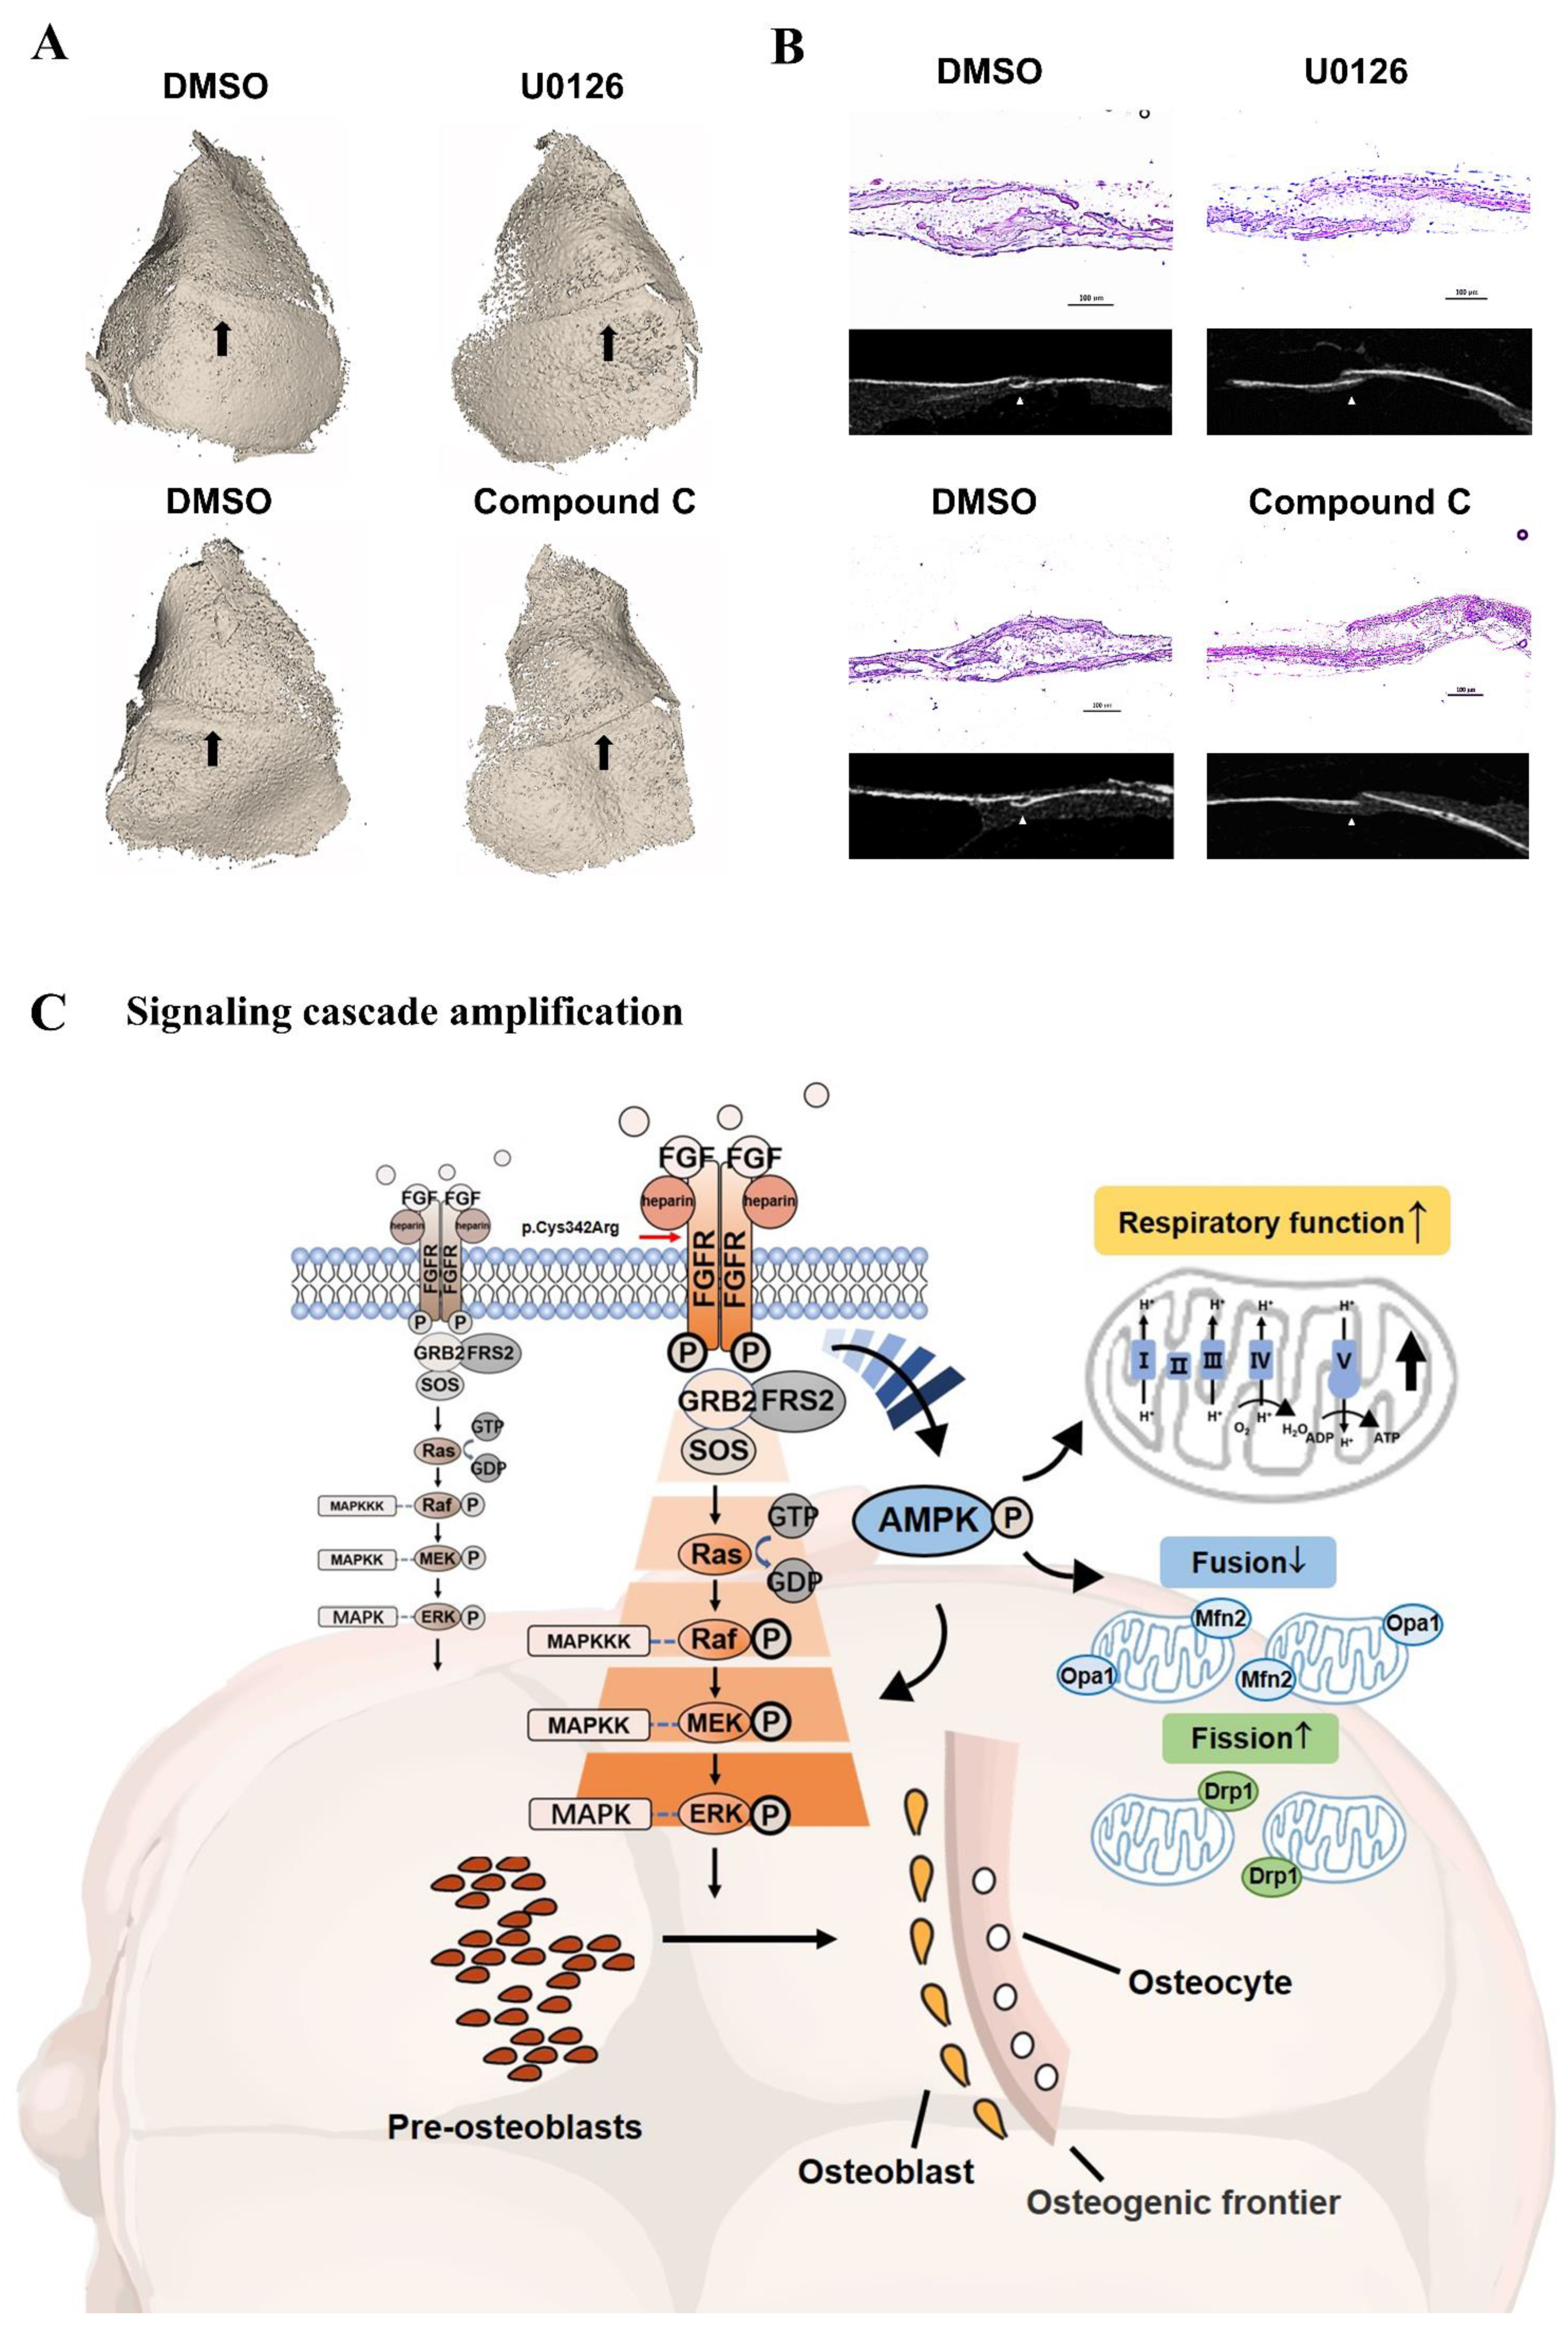
3.10. Inhibitors Attenuated the Closure of Coronal Sutures of Cultured Calvarias
4. Discussion
5. Conclusions
Supplementary Materials
Author Contributions
Funding
Institutional Review Board Statement
Informed Consent Statement
Data Availability Statement
Conflicts of Interest
References
- Mitulla, B.; Hinkel, G.K.; Lorenz, P. [Crouzon syndrome (Mc K 12350)]. Kinderarztl. Prax. 1991, 59, 278–280. [Google Scholar] [PubMed]
- Wang, J.C.; Nagy, L.; Demke, J.C. Syndromic Craniosynostosis. Facial Plast. Surg. Clin. N. Am. 2016, 24, 531–543. [Google Scholar] [CrossRef] [PubMed]
- Lin, Y.; Gao, H.; Ai, S.; Eswarakumar, J.V.P.; Zhu, Y.; Chen, C.; Li, T.; Liu, B.; Jiang, H.; Liu, Y.; et al. FGFR2 mutations and associated clinical observations in two Chinese patients with Crouzon syndrome. Mol. Med. Rep. 2017, 16, 5841–5846. [Google Scholar] [CrossRef] [PubMed] [Green Version]
- Wilkie, A.O.; Bochukova, E.G.; Hansen, R.M.; Taylor, I.B.; Rannan-Eliya, S.V.; Byren, J.C.; Wall, S.A.; Ramos, L.; Venancio, M.; Hurst, J.A.; et al. Clinical dividends from the molecular genetic diagnosis of craniosynostosis. Am. J. Med. Genet. A 2007, 143A, 1941–1949. [Google Scholar] [CrossRef]
- Bonaventure, J.; El Ghouzzi, V. Molecular and cellular bases of syndromic craniosynostoses. Expert. Rev. Mol. Med. 2003, 5, 1–17. [Google Scholar] [CrossRef]
- Glaser, R.L.; Jiang, W.; Boyadjiev, S.A.; Tran, A.K.; Zachary, A.A.; Van Maldergem, L.; Johnson, D.; Walsh, S.; Oldridge, M.; Wall, S.A.; et al. Paternal origin of FGFR2 mutations in sporadic cases of Crouzon syndrome and Pfeiffer syndrome. Am. J. Hum. Genet. 2000, 66, 768–777. [Google Scholar] [CrossRef] [Green Version]
- Reardon, W.; Winter, R.M.; Rutland, P.; Pulleyn, L.J.; Jones, B.M.; Malcolm, S. Mutations in the fibroblast growth factor receptor 2 gene cause Crouzon syndrome. Nat. Genet. 1994, 8, 98–103. [Google Scholar] [CrossRef]
- Breitbart, A.S.; Eaton, C.; Mccarthy, J.G. Crouzons Syndrome Associated with Acanthosis Nigricans—Ramifications for the Craniofacial Surgeon. Ann. Plast. Surg. 1989, 22, 310–315. [Google Scholar] [CrossRef]
- Kariya, H.; Nakano, H.; Ishii, N.; Kaimi, Y.; Imai, K.; Nakanishi, Y.; Kunihiro, N.; Fukai, K. Crouzon syndrome with acanthosis nigricans and prominent diffuse hyperpigmentation associated with gain-of-function A391E mutation in FGFR3 gene. J. Dermatol. 2020, 47, e451–e452. [Google Scholar] [CrossRef]
- Ornitz, D.M.; Itoh, N. Fibroblast growth factors. Genome Biol. 2001, 2, REVIEWS3005. [Google Scholar] [CrossRef]
- Ornitz, D.M.; Xu, J.; Colvin, J.S.; McEwen, D.G.; MacArthur, C.A.; Coulier, F.; Gao, G.; Goldfarb, M. Receptor specificity of the fibroblast growth factor family. J. Biol. Chem. 1996, 271, 15292–15297. [Google Scholar] [CrossRef] [PubMed] [Green Version]
- Schlessinger, J. Cell signaling by receptor tyrosine kinases. Cell 2000, 103, 211–225. [Google Scholar] [CrossRef] [Green Version]
- Dorey, K.; Amaya, E. FGF signalling: Diverse roles during early vertebrate embryogenesis. Development 2010, 137, 3731–3742. [Google Scholar] [CrossRef] [PubMed] [Green Version]
- Yun, Y.R.; Won, J.E.; Jeon, E.; Lee, S.; Kang, W.; Jo, H.; Jang, J.H.; Shin, U.S.; Kim, H.W. Fibroblast growth factors: Biology, function, and application for tissue regeneration. J. Tissue Eng. 2010, 2010, 218142. [Google Scholar] [CrossRef]
- Raucci, A.; Bellosta, P.; Grassi, R.; Basilico, C.; Mansukhani, A. Osteoblast proliferation or differentiation is regulated by relative strengths of opposing signaling pathways. J. Cell. Physiol. 2008, 215, 442–451. [Google Scholar] [CrossRef]
- Dailey, L.; Ambrosetti, D.; Mansukhani, A.; Basilico, C. Mechanisms underlying differential responses to FGF signaling. Cytokine Growth Factor Rev. 2005, 16, 233–247. [Google Scholar] [CrossRef]
- Wang, Y.; Sun, M.; Uhlhorn, V.L.; Zhou, X.; Peter, I.; Martinez-Abadias, N.; Hill, C.A.; Percival, C.J.; Richtsmeier, J.T.; Huso, D.L.; et al. Activation of p38 MAPK pathway in the skull abnormalities of Apert syndrome Fgfr2(+P253R) mice. BMC Dev. Biol. 2010, 10, 22. [Google Scholar] [CrossRef] [Green Version]
- Yin, L.; Du, X.; Li, C.; Xu, X.; Chen, Z.; Su, N.; Zhao, L.; Qi, H.; Li, F.; Xue, J.; et al. A Pro253Arg mutation in fibroblast growth factor receptor 2 (Fgfr2) causes skeleton malformation mimicking human Apert syndrome by affecting both chondrogenesis and osteogenesis. Bone 2008, 42, 631–643. [Google Scholar] [CrossRef]
- Miraoui, H.; Oudina, K.; Petite, H.; Tanimoto, Y.; Moriyama, K.; Marie, P.J. Fibroblast growth factor receptor 2 promotes osteogenic differentiation in mesenchymal cells via ERK1/2 and protein kinase C signaling. J. Biol. Chem. 2009, 284, 4897–4904. [Google Scholar] [CrossRef] [Green Version]
- Kan, S.H.; Elanko, N.; Johnson, D.; Cornejo-Roldan, L.; Cook, J.; Reich, E.W.; Tomkins, S.; Verloes, A.; Twigg, S.R.; Rannan-Eliya, S.; et al. Genomic screening of fibroblast growth-factor receptor 2 reveals a wide spectrum of mutations in patients with syndromic craniosynostosis. Am. J. Hum. Genet. 2002, 70, 472–486. [Google Scholar] [CrossRef]
- Dicus Brookes, C.; Golden, B.A.; Turvey, T.A. Craniosynostosis syndromes. Atlas Oral Maxillofac. Surg. Clin. N. Am. 2014, 22, 103–110. [Google Scholar] [CrossRef] [PubMed]
- Valente, A.J.; Maddalena, L.A.; Robb, E.L.; Moradi, F.; Stuart, J.A. A simple ImageJ macro tool for analyzing mitochondrial network morphology in mammalian cell culture. Acta Histochem. 2017, 119, 315–326. [Google Scholar] [CrossRef] [PubMed]
- Garrett, I.R. Assessing bone formation using mouse calvarial organ cultures. Methods Mol. Med. 2003, 80, 183–198. [Google Scholar] [PubMed]
- Shum, L.C.; White, N.S.; Mills, B.N.; Bentley, K.L.; Eliseev, R.A. Energy Metabolism in Mesenchymal Stem Cells During Osteogenic Differentiation. Stem Cells Dev. 2016, 25, 114–122. [Google Scholar] [CrossRef] [Green Version]
- Herzig, S.; Shaw, R.J. AMPK: Guardian of metabolism and mitochondrial homeostasis. Nat. Rev. Mol. Cell Biol. 2018, 19, 121–135. [Google Scholar] [CrossRef] [PubMed] [Green Version]
- Park, W.J.; Meyers, G.A.; Li, X.; Theda, C.; Day, D.; Orlow, S.J.; Jones, M.C.; Jabs, E.W. Novel FGFR2 mutations in Crouzon and Jackson-Weiss syndromes show allelic heterogeneity and phenotypic variability. Hum. Mol. Genet. 1995, 4, 1229–1233. [Google Scholar] [CrossRef]
- Rutland, P.; Pulleyn, L.J.; Reardon, W.; Baraitser, M.; Hayward, R.; Jones, B.; Malcolm, S.; Winter, R.M.; Oldridge, M.; Slaney, S.F.; et al. Identical mutations in the FGFR2 gene cause both Pfeiffer and Crouzon syndrome phenotypes. Nat. Genet. 1995, 9, 173–176. [Google Scholar] [CrossRef] [PubMed]
- Lee, K.K.L.; Peskett, E.; Quinn, C.M.; Aiello, R.; Adeeva, L.; Moulding, D.A.; Stanier, P.; Pauws, E. Overexpression of Fgfr2c causes craniofacial bone hypoplasia and ameliorates craniosynostosis in the Crouzon mouse. Dis. Model Mech. 2018, 11, dmm035311. [Google Scholar] [CrossRef] [Green Version]
- Kanazawa, I.; Yamaguchi, T.; Yano, S.; Yamauchi, M.; Sugimoto, T. Activation of AMP kinase and inhibition of Rho kinase induce the mineralization of osteoblastic MC3T3-E1 cells through endothelial NOS and BMP-2 expression. Am. J. Physiol. Endocrinol. Metab. 2009, 296, E139–E146. [Google Scholar] [CrossRef] [Green Version]
- Hardie, D.G.; Ross, F.A.; Hawley, S.A. AMPK: A nutrient and energy sensor that maintains energy homeostasis. Nat. Rev. Mol. Cell. Biol. 2012, 13, 251–262. [Google Scholar] [CrossRef]
- Wang, Y.G.; Qu, X.H.; Yang, Y.; Han, X.G.; Wang, L.; Qiao, H.; Fan, Q.M.; Tang, T.T.; Dai, K.R. AMPK promotes osteogenesis and inhibits adipogenesis through AMPK-Gfi1-OPN axis. Cell Signal. 2016, 28, 1270–1282. [Google Scholar] [CrossRef] [PubMed]
- Ren, C.; Hao, X.; Wang, L.; Hu, Y.; Meng, L.; Zheng, S.; Ren, F.; Bu, W.; Wang, H.; Li, D.; et al. Metformin Carbon Dots for Promoting Periodontal Bone Regeneration via Activation of ERK/AMPK Pathway. Adv. Healthc. Mater. 2021, 10, e2100196. [Google Scholar] [CrossRef] [PubMed]
- Yuan, P.; Ito, K.; Perez-Lorenzo, R.; Del Guzzo, C.; Lee, J.H.; Shen, C.H.; Bosenberg, M.W.; McMahon, M.; Cantley, L.C.; Zheng, B. Phenformin enhances the therapeutic benefit of BRAF(V600E) inhibition in melanoma. Proc. Natl. Acad. Sci. USA 2013, 110, 18226–18231. [Google Scholar] [CrossRef] [PubMed] [Green Version]
- Wang, Y.; An, H.; Liu, T.; Qin, C.; Sesaki, H.; Guo, S.; Radovick, S.; Hussain, M.; Maheshwari, A.; Wondisford, F.E.; et al. Metformin Improves Mitochondrial Respiratory Activity through Activation of AMPK. Cell Rep. 2019, 29, 1511–1523.e5. [Google Scholar] [CrossRef]
- Hao, Y.; Wu, M.; Wang, J. Fibroblast growth factor-2 ameliorates tumor necrosis factor-alpha-induced osteogenic damage of human bone mesenchymal stem cells by improving oxidative phosphorylation. Mol. Cell. Probes 2020, 52, 101538. [Google Scholar] [CrossRef]
- Mishra, P.; Chan, D.C. Metabolic regulation of mitochondrial dynamics. J. Cell Biol. 2016, 212, 379–387. [Google Scholar] [CrossRef] [Green Version]
- Zhang, L.; Gan, X.; He, Y.; Zhu, Z.; Zhu, J.; Yu, H. Drp1-dependent mitochondrial fission mediates osteogenic dysfunction in inflammation through elevated production of reactive oxygen species. PLoS ONE 2017, 12, e0175262. [Google Scholar] [CrossRef] [Green Version]
- Zhang, L.; Gan, X.; Zhu, Z.; Yang, Y.; He, Y.; Yu, H. Reactive oxygen species regulatory mechanisms associated with rapid response of MC3T3-E1 cells for vibration stress. Biochem. Biophys. Res. Commun. 2016, 470, 510–515. [Google Scholar] [CrossRef]
- Toyama, E.Q.; Herzig, S.; Courchet, J.; Lewis, T.L., Jr.; Loson, O.C.; Hellberg, K.; Young, N.P.; Chen, H.; Polleux, F.; Chan, D.C.; et al. Metabolism. AMP-activated protein kinase mediates mitochondrial fission in response to energy stress. Science 2016, 351, 275–281. [Google Scholar] [CrossRef]


Publisher’s Note: MDPI stays neutral with regard to jurisdictional claims in published maps and institutional affiliations. |
© 2022 by the authors. Licensee MDPI, Basel, Switzerland. This article is an open access article distributed under the terms and conditions of the Creative Commons Attribution (CC BY) license (https://creativecommons.org/licenses/by/4.0/).
Share and Cite
Wang, Y.; Liu, Y.; Chen, H.; Liu, X.; Zhang, Y.; Wang, Y.; Gu, Y. FGFR2 Mutation p.Cys342Arg Enhances Mitochondrial Metabolism-Mediated Osteogenesis via FGF/FGFR-AMPK-Erk1/2 Axis in Crouzon Syndrome. Cells 2022, 11, 3129. https://doi.org/10.3390/cells11193129
Wang Y, Liu Y, Chen H, Liu X, Zhang Y, Wang Y, Gu Y. FGFR2 Mutation p.Cys342Arg Enhances Mitochondrial Metabolism-Mediated Osteogenesis via FGF/FGFR-AMPK-Erk1/2 Axis in Crouzon Syndrome. Cells. 2022; 11(19):3129. https://doi.org/10.3390/cells11193129
Chicago/Turabian StyleWang, Yidi, Yue Liu, Haotian Chen, Xiaojing Liu, Yi Zhang, Yixiang Wang, and Yan Gu. 2022. "FGFR2 Mutation p.Cys342Arg Enhances Mitochondrial Metabolism-Mediated Osteogenesis via FGF/FGFR-AMPK-Erk1/2 Axis in Crouzon Syndrome" Cells 11, no. 19: 3129. https://doi.org/10.3390/cells11193129