
Metabolomics in Diabetic Retinopathy: From Potential Biomarkers to Molecular Basis of Oxidative Stress

Abstract
:1. Introduction
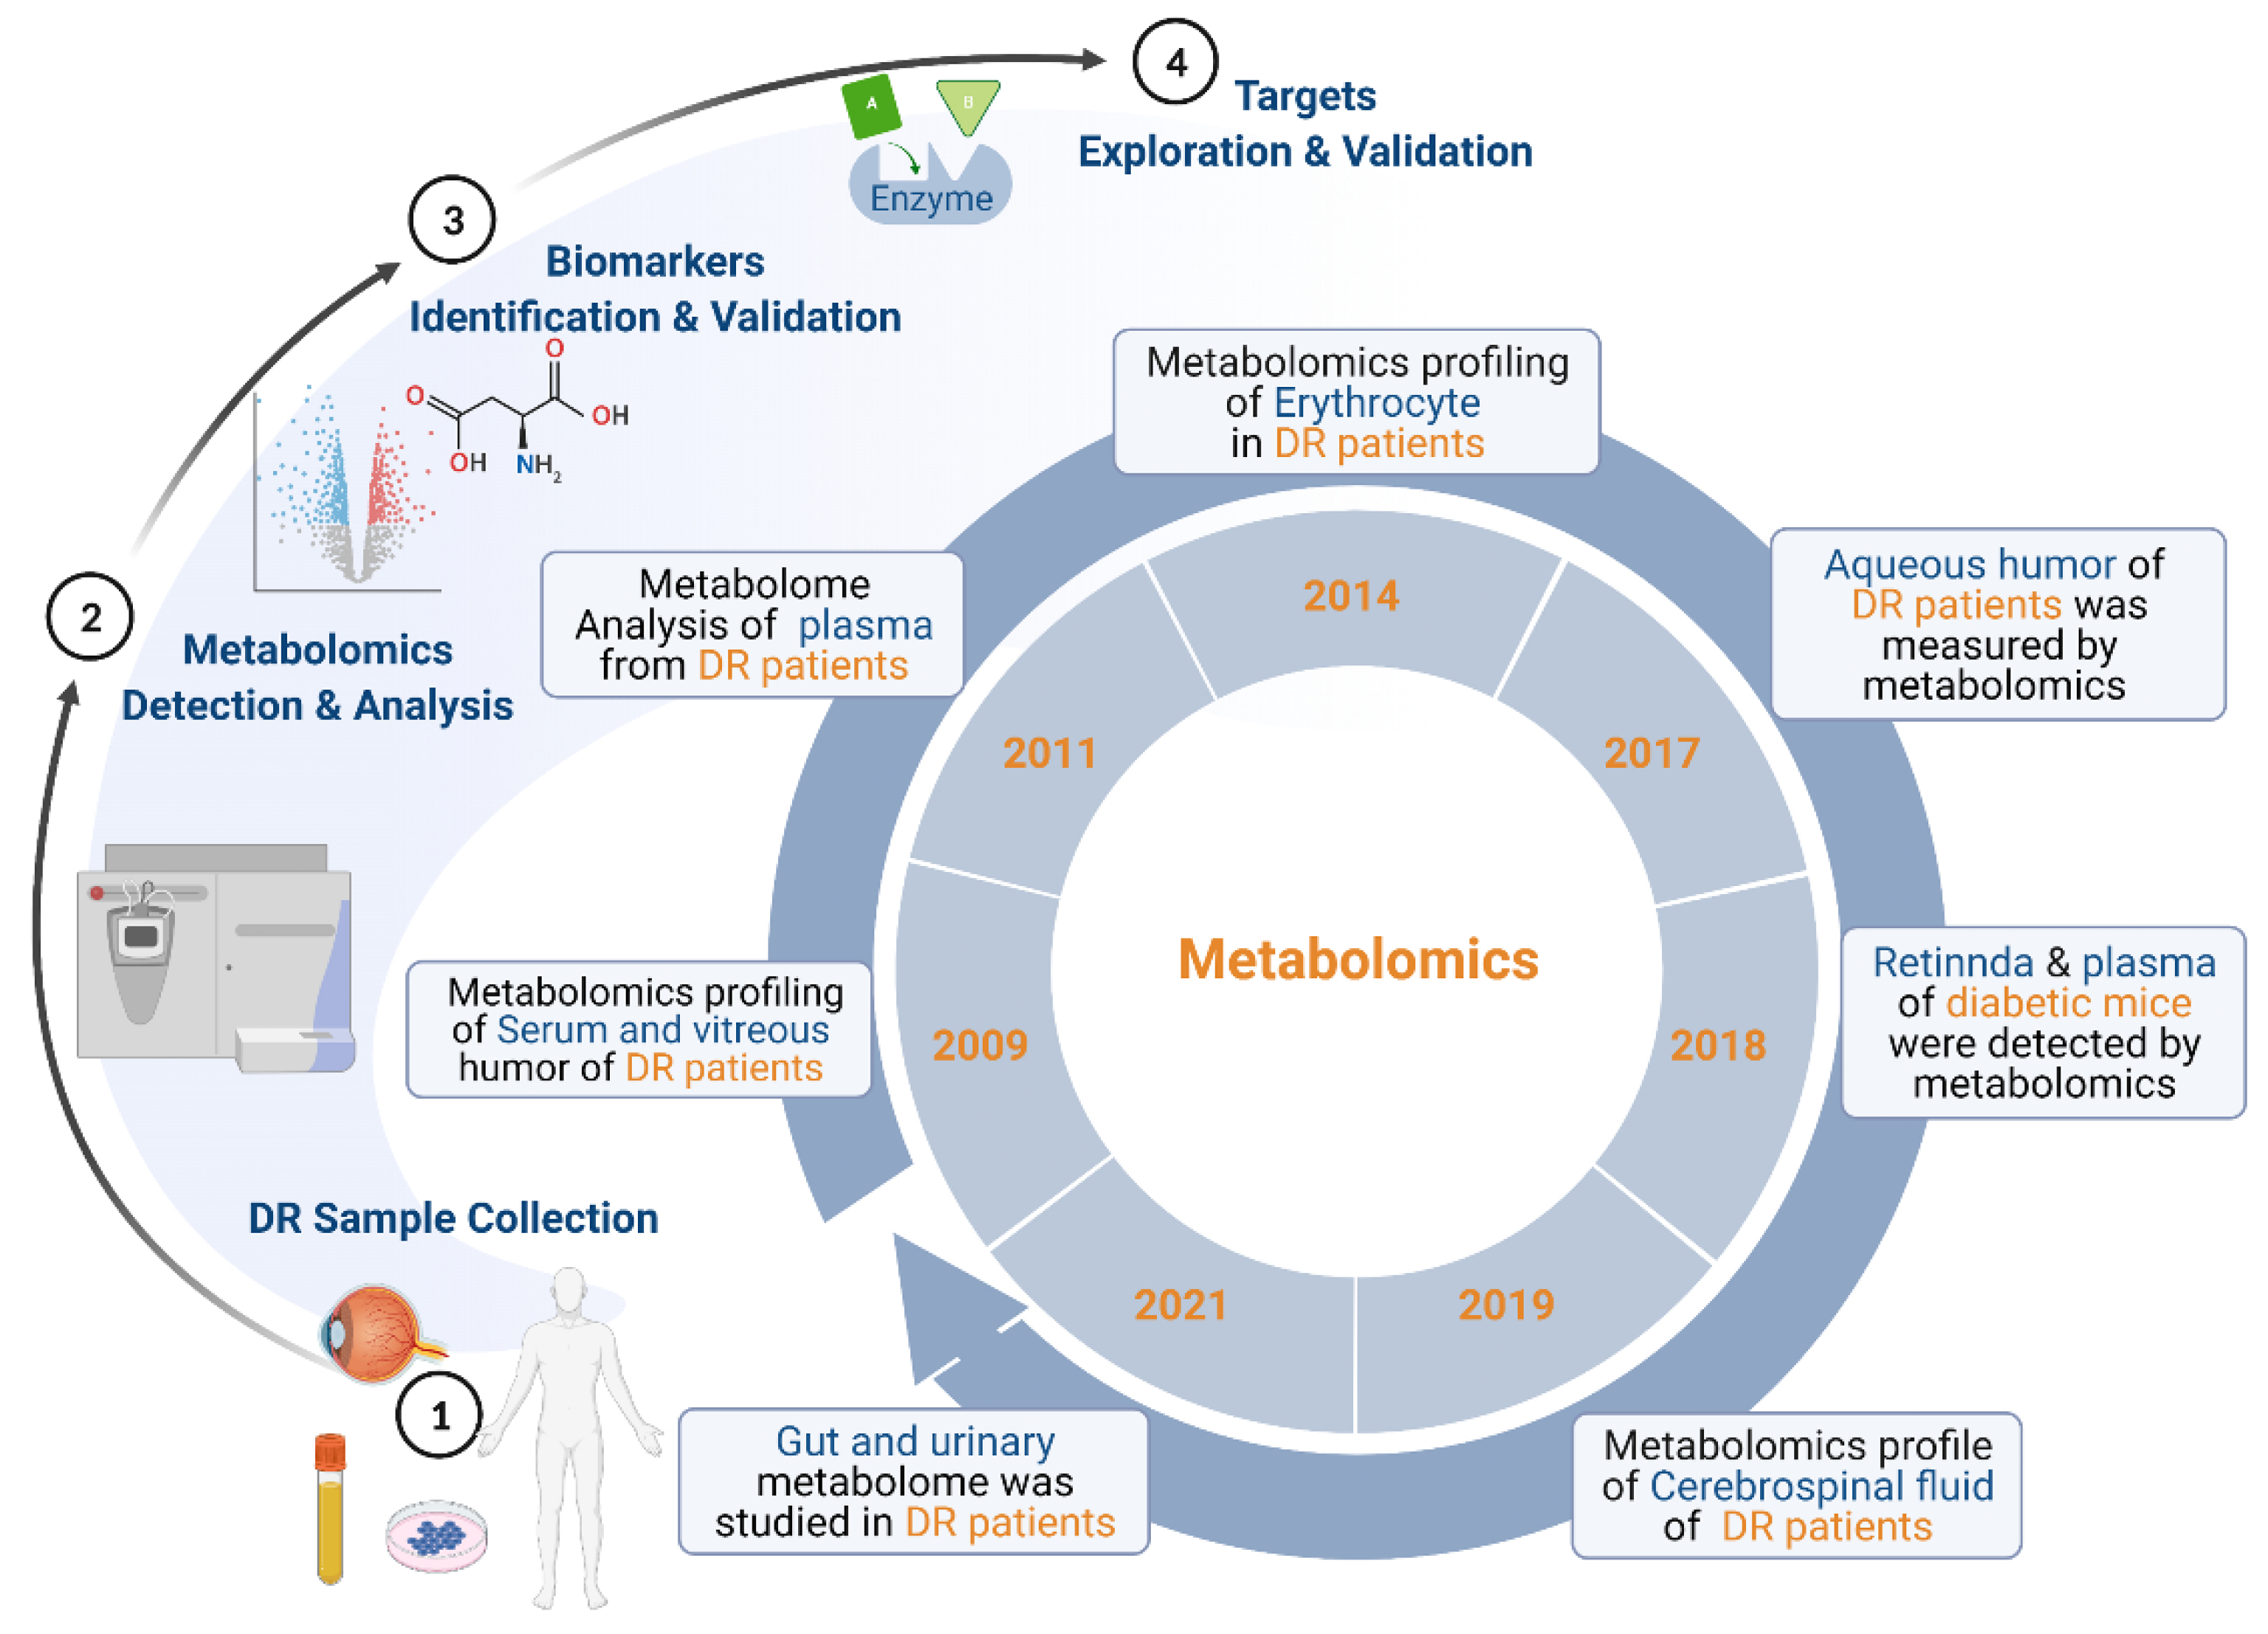
2. Overview of Metabolomics of DR
3. Potential Metabolomics Biomarkers of DR
3.1. Potential Biomarkers in Human Serum
3.2. Potential Biomarkers in Human Plasma
3.3. Potential Biomarkers in Human Vitreous Humor
3.4. Potential Biomarkers in Other Human Samples
4. Metabolic Pathways Associated with DR
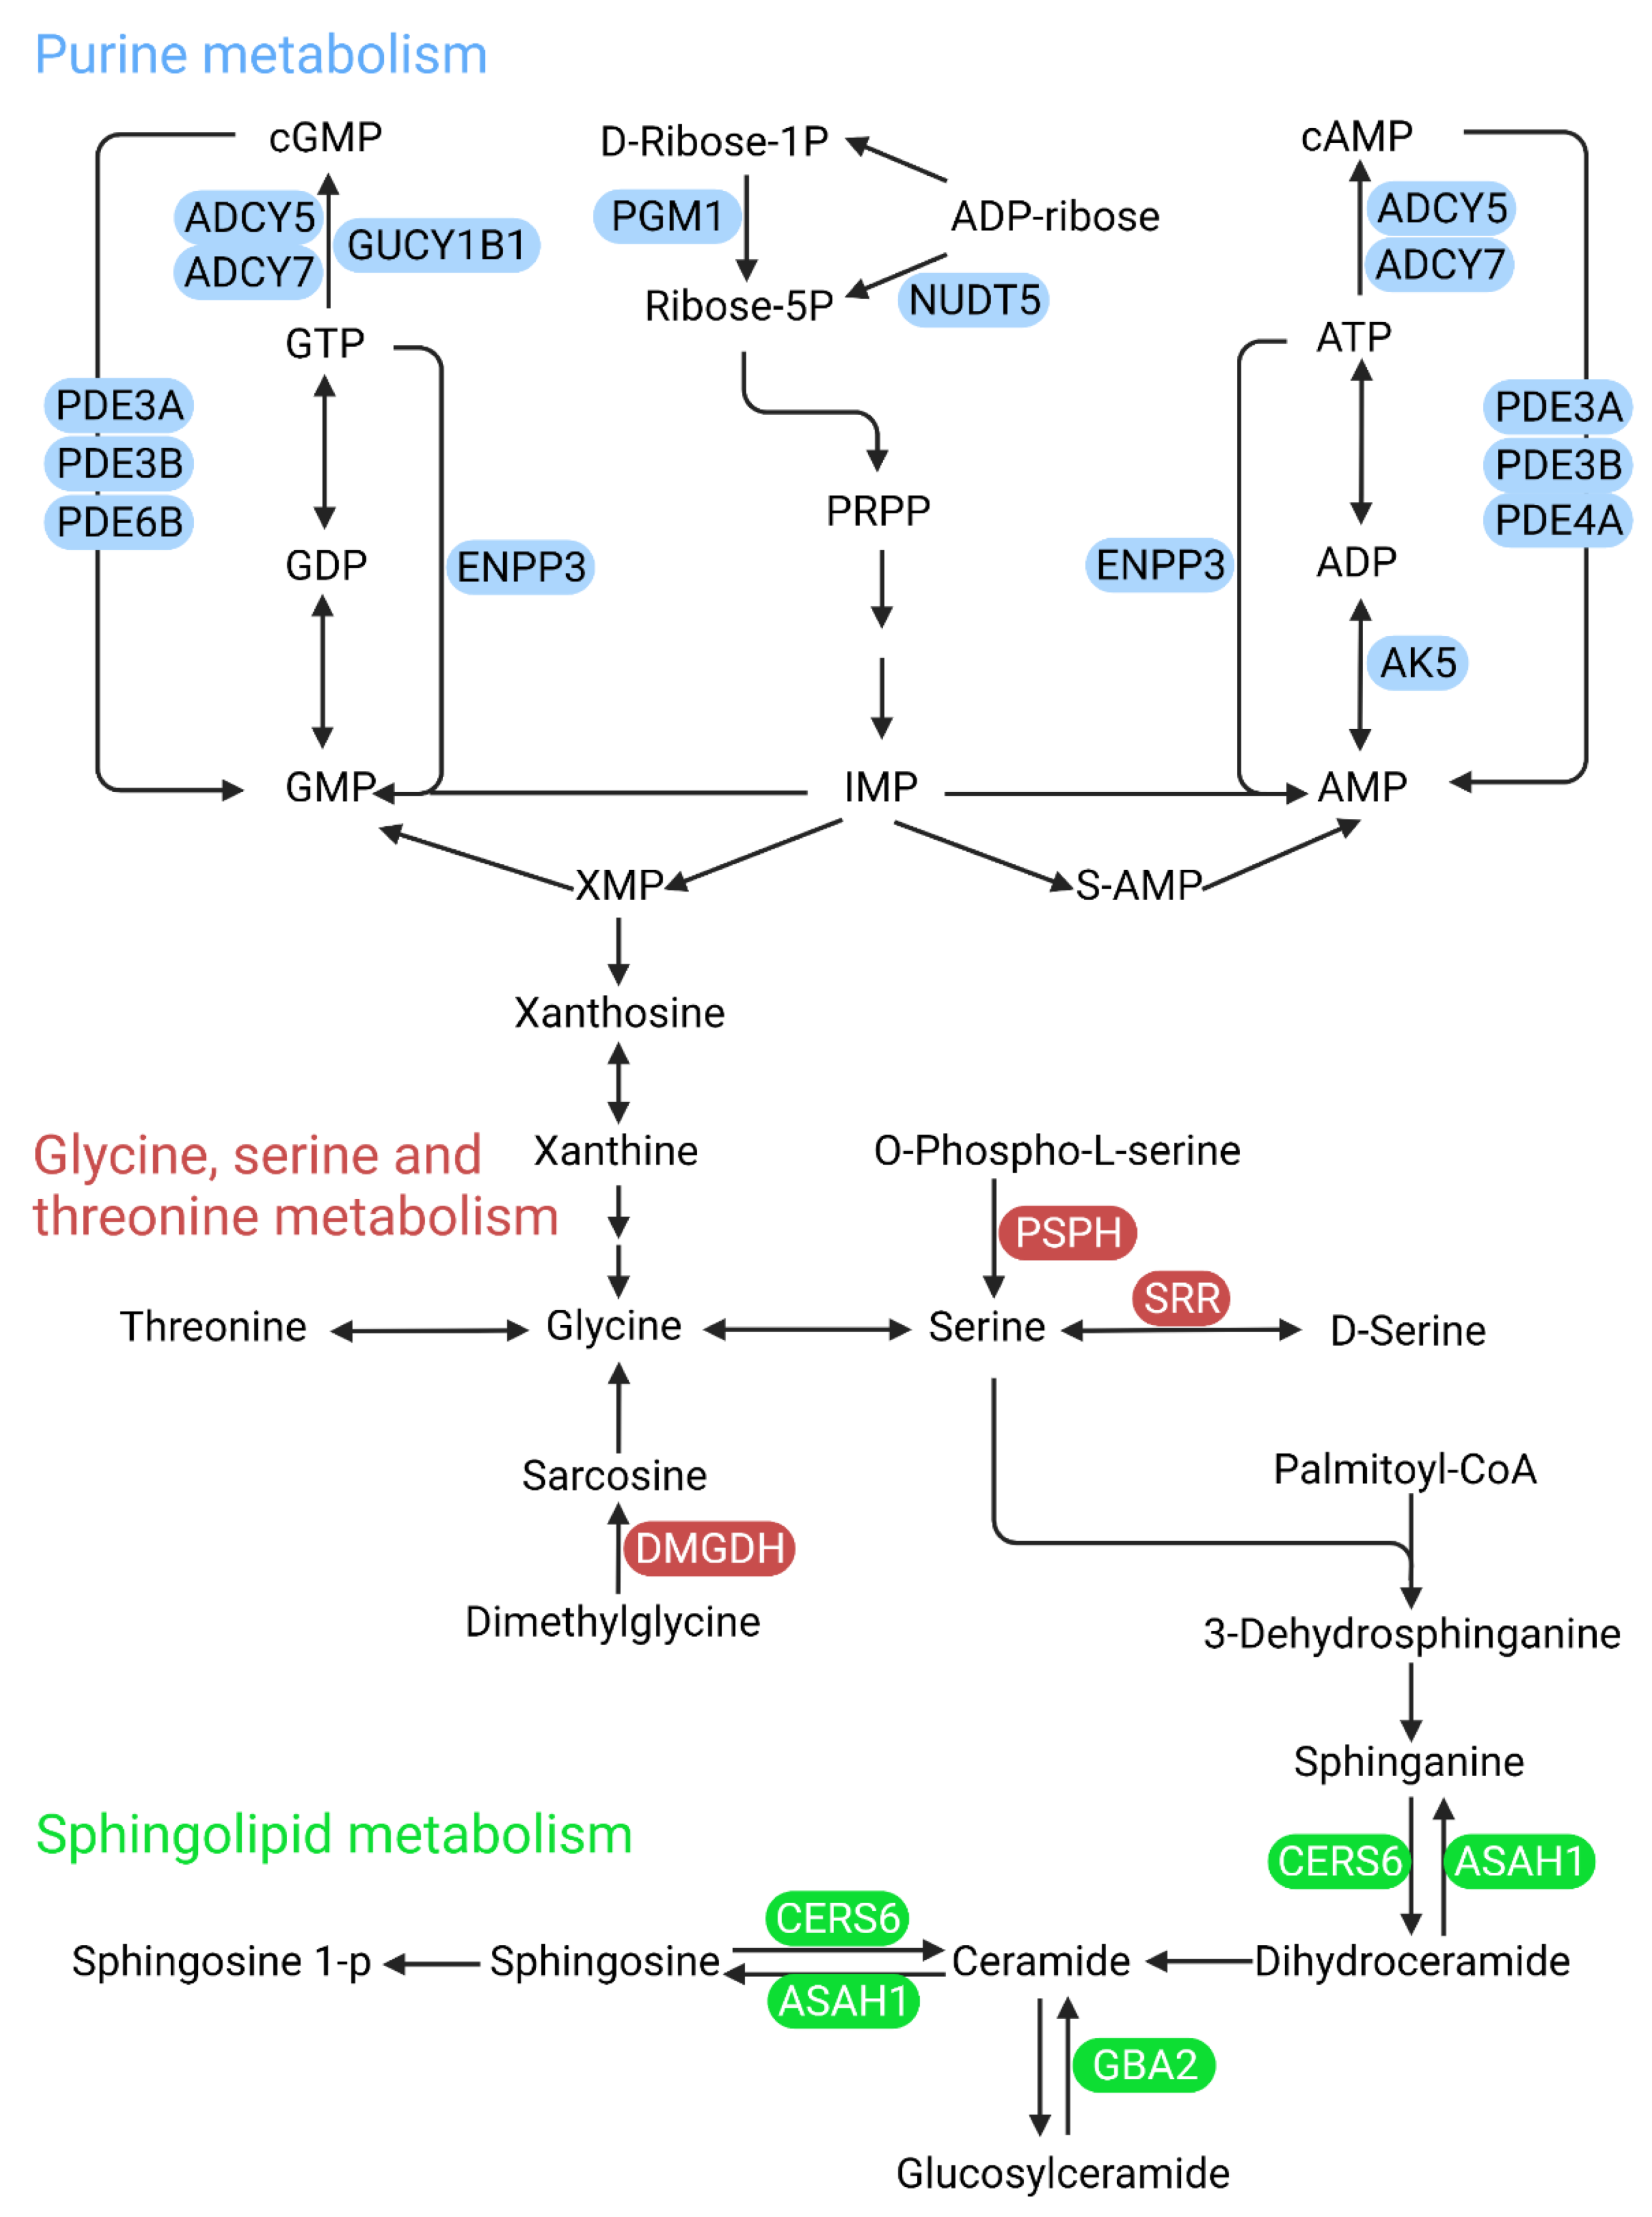
4.1. Pyrimidine Metabolism
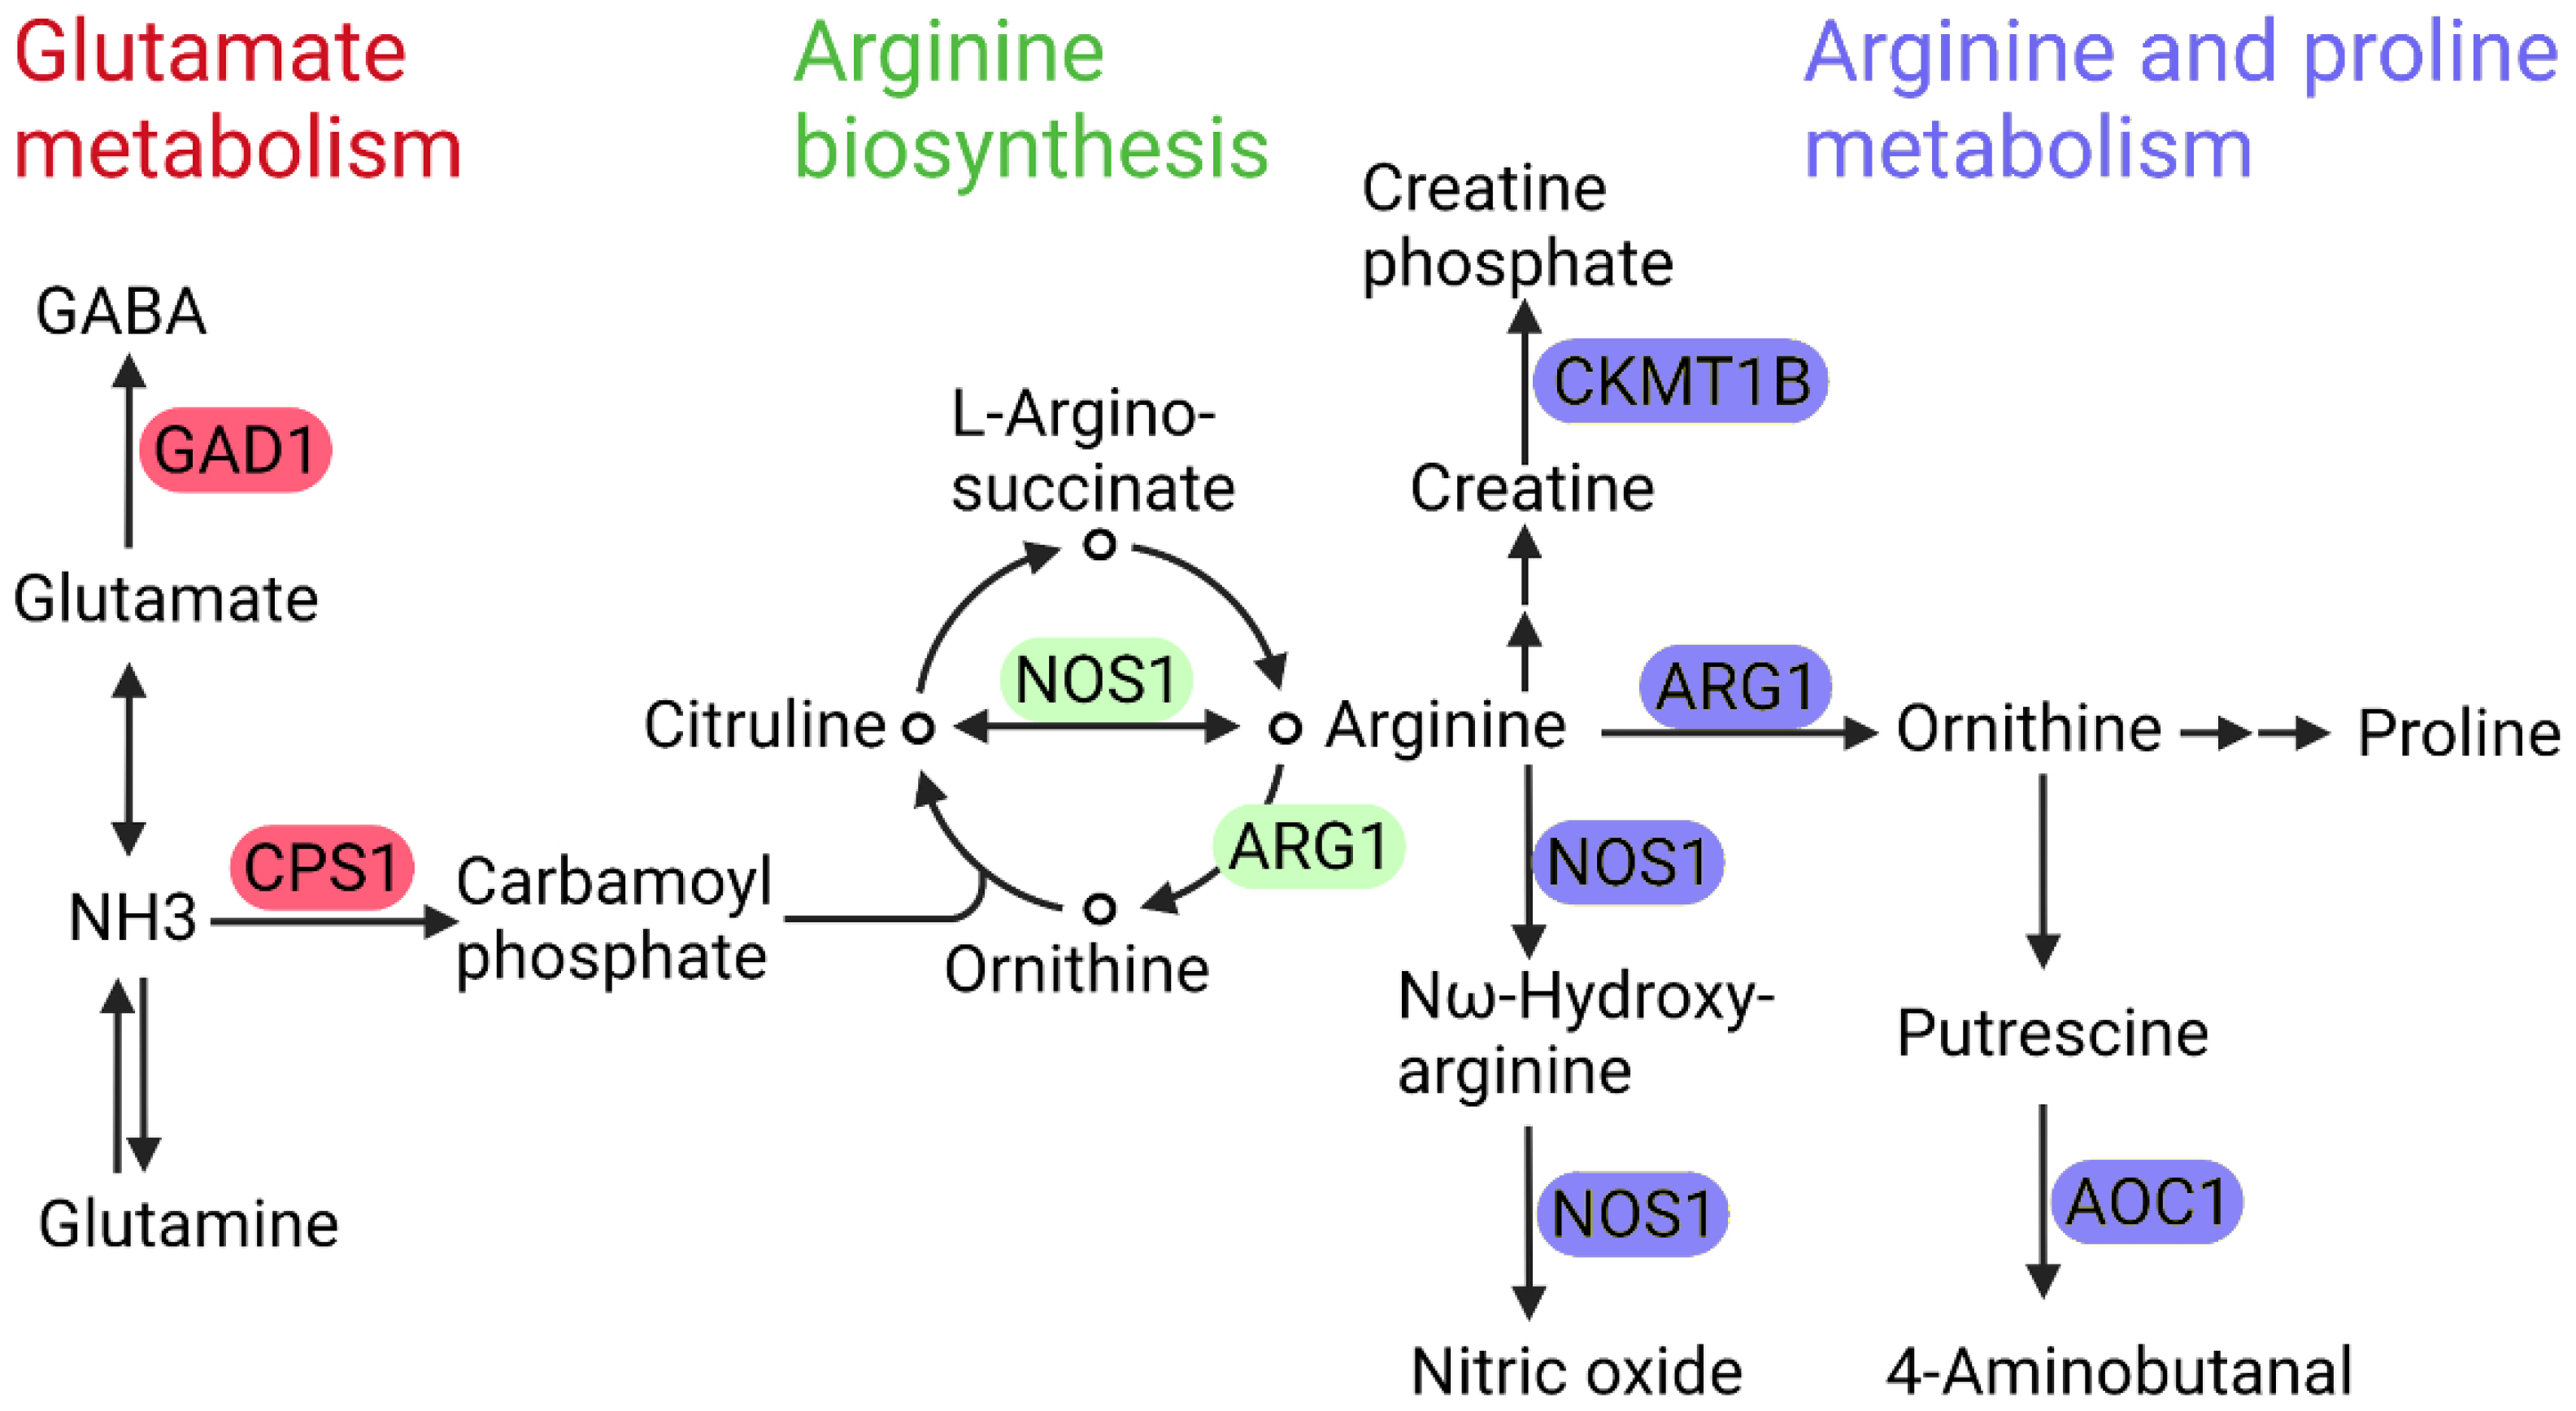
4.2. Glutamate Metabolism and Branched-Chain Amino Acid (BCAA) Metabolism
4.3. Pantothenate and CoA Biosynthesis
4.4. Polyol Pathway
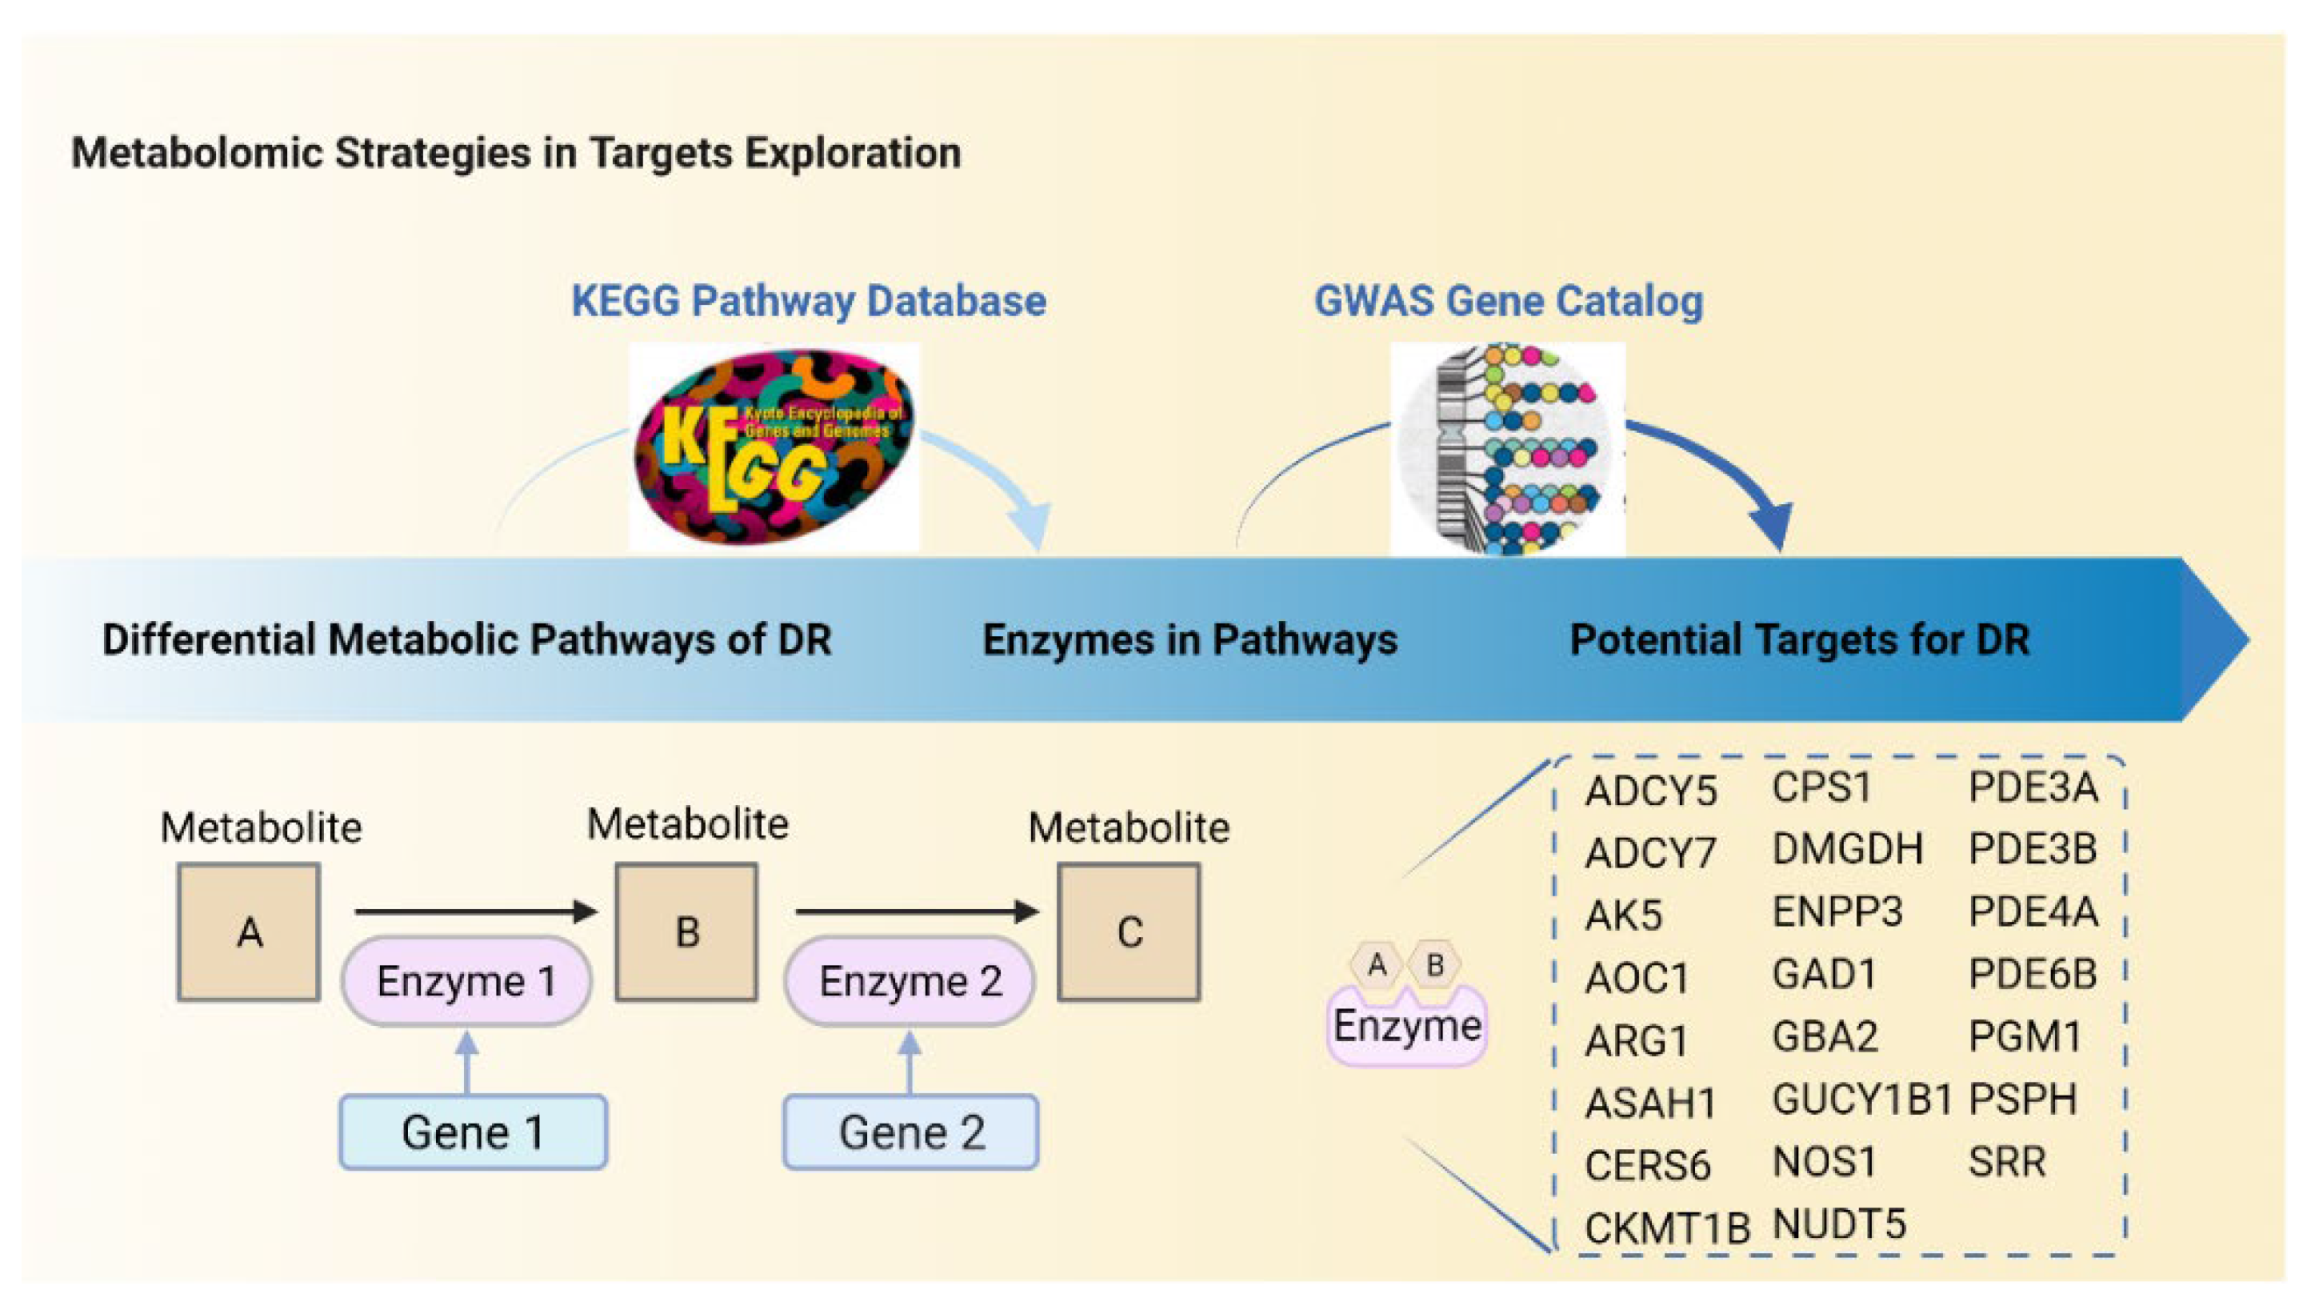
5. Predictions of Metabolism-Based Molecular Targets in DR
5.1. Arginase 1 and Nitric Oxide Synthase 1
5.2. Phosphodiesterase
6. Conclusions
Author Contributions
Funding
Conflicts of Interest
References
- American Diabetes Association. Diagnosis and classification of diabetes mellitus. Diabetes Care 2011, 34 (Suppl. S1), S62–S69. [Google Scholar] [CrossRef] [PubMed]
- Cheung, N.; Mitchell, P.; Wong, T.Y. Diabetic retinopathy. Lancet 2010, 376, 124–136. [Google Scholar] [CrossRef]
- Wong, T.Y.; Cheung, C.M.; Larsen, M.; Sharma, S.; Simó, R. Diabetic retinopathy. Nat. Rev. Dis. Prim. 2016, 2, 16012. [Google Scholar] [CrossRef] [PubMed]
- Leasher, J.L.; Bourne, R.R.A.; Flaxman, S.R.; Jonas, J.B.; Keeffe, J.; Naidoo, K.; Pesudovs, K.; Price, H.; White, R.A.; Wong, T.Y.; et al. Global Estimates on the Number of People Blind or Visually Impaired by Diabetic Retinopathy: A Meta-analysis from 1990 to 2010. Diabetes Care 2016, 39, 1643–1649. [Google Scholar] [CrossRef]
- Teo, Z.L.; Tham, Y.C.; Yu, M.; Chee, M.L.; Rim, T.H.; Cheung, N.; Bikbov, M.M.; Wang, Y.X.; Tang, Y.; Lu, Y.; et al. Global Prevalence of Diabetic Retinopathy and Projection of Burden through 2045: Systematic Review and Meta-analysis. Ophthalmology 2021, 128, 1580–1591. [Google Scholar] [CrossRef]
- Ting, D.S.W.; Tan, K.-A.; Phua, V.; Tan, G.S.W.; Wong, C.W.; Wong, T.Y. Biomarkers of diabetic retinopathy. Curr. Diabetes Rep. 2016, 16, 125. [Google Scholar] [CrossRef]
- Hirsch, I.B.; Brownlee, M. Beyond hemoglobin A1c—Need for additional markers of risk for diabetic microvascular complications. JAMA 2010, 303, 2291–2292. [Google Scholar] [CrossRef]
- The Diabetes Control and Complications Trial Research Group. The Effect of Intensive Treatment of Diabetes on the Development and Progression of Long-Term Complications in Insulin-Dependent Diabetes Mellitus. N. Engl. J. Med. 1993, 329, 977–986. [Google Scholar] [CrossRef]
- Stitt, A.W.; Curtis, T.M.; Chen, M.; Medina, R.J.; McKay, G.J.; Jenkins, A.; Gardiner, T.A.; Lyons, T.J.; Hammes, H.-P.; Simó, R.; et al. The progress in understanding and treatment of diabetic retinopathy. Prog. Retin. Eye Res. 2016, 51, 156–186. [Google Scholar] [CrossRef]
- Ajlan, R.S.; Silva, P.S.; Sun, J.K. Vascular endothelial growth factor and diabetic retinal disease. Semin. Ophthalmol. 2016, 31, 40–48. [Google Scholar] [CrossRef]
- Li, A.S.; Veerappan, M.; Mittal, V.; Do, D.V. Anti-VEGF agents in the management of diabetic macular edema. Expert Rev. Ophthalmol. 2020, 15, 285–296. [Google Scholar] [CrossRef]
- Bandello, F.; Cicinelli, M.V. 19th EURETINA Congress Keynote Lecture: Diabetic Retinopathy Today. Ophthalmologica 2020, 243, 163–171. [Google Scholar] [CrossRef]
- Hammes, H.-P. Diabetic retinopathy: Hyperglycaemia, oxidative stress and beyond. Diabetologia 2018, 61, 29–38. [Google Scholar] [CrossRef]
- Clish, C.B. Metabolomics: An emerging but powerful tool for precision medicine. Cold Spring Harb. Mol. Case Study 2015, 1, a000588. [Google Scholar] [CrossRef]
- Laíns, I.; Gantner, M.; Murinello, S.; Lasky-Su, J.A.; Miller, J.W.; Friedlander, M.; Husain, D. Metabolomics in the study of retinal health and disease. Prog. Retin. Eye Res. 2019, 69, 57–79. [Google Scholar] [CrossRef]
- Li, X.; Luo, X.; Lu, X.; Duan, J.; Xu, G. Metabolomics study of diabetic retinopathy using gas chromatography-mass spectrometry: A comparison of stages and subtypes diagnosed by Western and Chinese medicine. Mol. BioSyst. 2011, 7, 2228–2237. [Google Scholar] [CrossRef]
- Xia, J.F.; Wang, Z.H.; Liang, Q.L.; Wang, Y.M.; Li, P.; Luo, G.A. Correlations of six related pyrimidine metabolites and diabetic retinopathy in Chinese type 2 diabetic patients. Clin. Chim. Acta 2011, 412, 940–945. [Google Scholar] [CrossRef]
- Xia, J.; Wang, Z.; Zhang, F. Association between Related Purine Metabolites and Diabetic Retinopathy in Type 2 Diabetic Patients. Int. J. Endocrinol. 2014, 2014, 651050. [Google Scholar] [CrossRef]
- Chen, L.; Cheng, C.Y.; Choi, H.; Ikram, M.K.; Sabanayagam, C.; Tan, G.S.; Tian, D.; Zhang, L.; Venkatesan, G.; Tai, E.S.; et al. Plasma Metabonomic Profiling of Diabetic Retinopathy. Diabetes 2016, 65, 1099–1108. [Google Scholar] [CrossRef]
- Rhee, S.Y.; Jung, E.S.; Park, H.M.; Jeong, S.J.; Kim, K.; Chon, S.; Yu, S.Y.; Woo, J.T.; Lee, C.H. Plasma glutamine and glutamic acid are potential biomarkers for predicting diabetic retinopathy. Metabolomics 2018, 14, 89. [Google Scholar] [CrossRef] [Green Version]
- Peng, L.; Sun, B.; Liu, M.; Huang, J.; Liu, Y.; Xie, Z.; He, J.; Chen, L.; Wang, D.; Zhu, Y.; et al. Plasma metabolic profile reveals PGF2α protecting against non-proliferative diabetic retinopathy in patients with type 2 diabetes. Biochem. Biophys. Res. Commun. 2018, 496, 1276–1283. [Google Scholar] [CrossRef]
- Zhu, X.R.; Yang, F.Y.; Lu, J.; Zhang, H.R.; Sun, R.; Zhou, J.B.; Yang, J.K. Plasma metabolomic profiling of proliferative diabetic retinopathy. Nutr. Metab. 2019, 16, 37. [Google Scholar] [CrossRef]
- Sumarriva, K.; Uppal, K.; Ma, C.; Herren, D.J.; Wang, Y.; Chocron, I.M.; Warden, C.; Mitchell, S.L.; Burgess, L.G.; Goodale, M.P.; et al. Arginine and Carnitine Metabolites Are Altered in Diabetic Retinopathy. Investig. Ophthalmol. Vis. Sci. 2019, 60, 3119–3126. [Google Scholar] [CrossRef]
- Sun, Y.; Zou, H.; Li, X.; Xu, S.; Liu, C. Plasma Metabolomics Reveals Metabolic Profiling for Diabetic Retinopathy and Disease Progression. Front. Endocrinol. 2021, 12, 757088. [Google Scholar] [CrossRef] [PubMed]
- Peters, K.S.; Rivera, E.; Warden, C.; Harlow, P.A.; Mitchell, S.L.; Calcutt, M.W.; Samuels, D.C.; Brantley, M.A., Jr. Plasma Arginine and Citrulline are Elevated in Diabetic Retinopathy. Am. J. Ophthalmol. 2021, 235, 154–162. [Google Scholar] [CrossRef]
- Abhary, S.; Kasmeridis, N.; Burdon, K.P.; Kuot, A.; Whiting, M.J.; Yew, W.P.; Petrovsky, N.; Craig, J.E. Diabetic retinopathy is associated with elevated serum asymmetric and symmetric dimethylarginines. Diabetes Care 2009, 32, 2084–2086. [Google Scholar] [CrossRef]
- Xuan, Q.; Ouyang, Y.; Wang, Y.; Wu, L.; Li, H.; Luo, Y.; Zhao, X.; Feng, D.; Qin, W.; Hu, C.; et al. Multiplatform Metabolomics Reveals Novel Serum Metabolite Biomarkers in Diabetic Retinopathy Subjects. Adv. Sci. 2020, 7, 2001714. [Google Scholar] [CrossRef] [PubMed]
- Xuan, Q.; Zheng, F.; Yu, D.; Ouyang, Y.; Zhao, X.; Hu, C.; Xu, G. Rapid lipidomic profiling based on ultra-high performance liquid chromatography-mass spectrometry and its application in diabetic retinopathy. Anal. Bioanal. Chem. 2020, 412, 3585–3594. [Google Scholar] [CrossRef]
- Yun, J.H.; Kim, J.M.; Jeon, H.J.; Oh, T.; Choi, H.J.; Kim, B.J. Metabolomics profiles associated with diabetic retinopathy in type 2 diabetes patients. PLoS ONE 2020, 15, e0241365. [Google Scholar] [CrossRef]
- Zuo, J.; Lan, Y.; Hu, H.; Hou, X.; Li, J.; Wang, T.; Zhang, H.; Zhang, N.; Guo, C.; Peng, F.; et al. Metabolomics-based multidimensional network biomarkers for diabetic retinopathy identification in patients with type 2 diabetes mellitus. BMJ Open Diabetes Res. Care 2021, 9, e001443. [Google Scholar] [CrossRef] [PubMed]
- Yousri, N.A.; Suhre, K.; Yassin, E.; Al-Shakaki, A.; Robay, A.; Elshafei, M.; Chidiac, O.; Hunt, S.C.; Crystal, R.G.; Fakhro, K.A. Metabolic and Metabo-Clinical Signatures of Type 2 Diabetes, Obesity, Retinopathy, and Dyslipidemia. Diabetes 2021, 71, 184–205. [Google Scholar] [CrossRef] [PubMed]
- Koehrer, P.; Saab, S.; Berdeaux, O.; Isaïco, R.; Grégoire, S.; Cabaret, S.; Bron, A.M.; Creuzot-Garcher, C.P.; Bretillon, L.; Acar, N. Erythrocyte phospholipid and polyunsaturated fatty acid composition in diabetic retinopathy. PLoS ONE 2014, 9, e106912. [Google Scholar] [CrossRef] [PubMed]
- Ye, P.; Zhang, X.; Xu, Y.; Xu, J.; Song, X.; Yao, K. Alterations of the Gut Microbiome and Metabolome in Patients with Proliferative Diabetic Retinopathy. Front. Microbiol. 2021, 12, 667632. [Google Scholar] [CrossRef] [PubMed]
- Zhou, Z.; Zheng, Z.; Xiong, X.; Chen, X.; Peng, J.; Yao, H.; Pu, J.; Chen, Q.; Zheng, M. Gut Microbiota Composition and Fecal Metabolic Profiling in Patients with Diabetic Retinopathy. Front. Cell Dev. Biol. 2021, 9, 732204. [Google Scholar] [CrossRef]
- Fort, P.E.; Rajendiran, T.M.; Soni, T.; Byun, J.; Shan, Y.; Looker, H.C.; Nelson, R.G.; Kretzler, M.; Michailidis, G.; Roger, J.E.; et al. Diminished retinal complex lipid synthesis and impaired fatty acid β-oxidation associated with human diabetic retinopathy. JCI Insight 2021, 6, e152109. [Google Scholar] [CrossRef]
- Jin, H.; Zhu, B.; Liu, X.; Jin, J.; Zou, H. Metabolic characterization of diabetic retinopathy: An (1)H-NMR-based metabolomic approach using human aqueous humor. J. Pharm. Biomed. Anal. 2019, 174, 414–421. [Google Scholar] [CrossRef]
- Kunikata, H.; Ida, T.; Sato, K.; Aizawa, N.; Sawa, T.; Tawarayama, H.; Murayama, N.; Fujii, S.; Akaike, T.; Nakazawa, T. Metabolomic profiling of reactive persulfides and polysulfides in the aqueous and vitreous humors. Sci. Rep. 2017, 7, 41984. [Google Scholar] [CrossRef]
- Wang, H.; Fang, J.; Chen, F.; Sun, Q.; Xu, X.; Lin, S.H.; Liu, K. Metabolomic profile of diabetic retinopathy: A GC-TOFMS-based approach using vitreous and aqueous humor. Acta Diabetol. 2020, 57, 41–51. [Google Scholar] [CrossRef]
- Young, S.P.; Nessim, M.; Falciani, F.; Trevino, V.; Banerjee, S.P.; Scott, R.A.H.; Murray, P.I.; Wallace, G.R. Metabolomic analysis of human vitreous humor differentiates ocular inflammatory disease. Mol. Vis. 2009, 15, 1210–1217. [Google Scholar]
- Barba, I.; Garcia-Ramírez, M.; Hernández, C.; Alonso, M.A.; Masmiquel, L.; García-Dorado, D.; Simó, R. Metabolic fingerprints of proliferative diabetic retinopathy: An 1H-NMR-based metabonomic approach using vitreous humor. Investig. Ophthalmol. Vis. Sci. 2010, 51, 4416–4421. [Google Scholar] [CrossRef]
- Schwartzman, M.L.; Iserovich, P.; Gotlinger, K.; Bellner, L.; Dunn, M.W.; Sartore, M.; Grazia Pertile, M.; Leonardi, A.; Sathe, S.; Beaton, A.; et al. Profile of lipid and protein autacoids in diabetic vitreous correlates with the progression of diabetic retinopathy. Diabetes 2010, 59, 1780–1788. [Google Scholar] [CrossRef] [Green Version]
- Paris, L.P.; Johnson, C.H.; Aguilar, E.; Usui, Y.; Cho, K.; Hoang, L.T.; Feitelberg, D.; Benton, H.P.; Westenskow, P.D.; Kurihara, T.; et al. Global metabolomics reveals metabolic dysregulation in ischemic retinopathy. Metabolomics 2016, 12, 15. [Google Scholar] [CrossRef] [PubMed]
- Haines, N.R.; Manoharan, N.; Olson, J.L.; D’Alessandro, A.; Reisz, J.A. Metabolomics Analysis of Human Vitreous in Diabetic Retinopathy and Rhegmatogenous Retinal Detachment. J. Proteome Res. 2018, 17, 2421–2427. [Google Scholar] [CrossRef] [PubMed]
- Lin, A.L.; Roman, R.J.; Regan, K.A.; Bolch, C.A.; Chen, C.J.; Iyer, S.S.R. Eicosanoid Profiles in the Vitreous Humor of Patients with Proliferative Diabetic Retinopathy. Int. J. Mol. Sci. 2020, 21, 7451. [Google Scholar] [CrossRef] [PubMed]
- Tomita, Y.; Cagnone, G.; Fu, Z.; Cakir, B.; Kotoda, Y.; Asakage, M.; Wakabayashi, Y.; Hellström, A.; Joyal, J.S.; Talukdar, S.; et al. Vitreous metabolomics profiling of proliferative diabetic retinopathy. Diabetologia 2021, 64, 70–82. [Google Scholar] [CrossRef] [PubMed]
- Zhao, T.; Wang, Y.; Guo, X.; Li, H.; Jiang, W.; Xiao, Y.; Deng, B.; Sun, Y. Altered oxylipin levels in human vitreous indicate imbalance in pro-/anti-inflammatory homeostasis in proliferative diabetic retinopathy. Exp. Eye Res. 2022, 214, 108799. [Google Scholar] [CrossRef] [PubMed]
- Lin, H.T.; Cheng, M.L.; Lo, C.J.; Lin, G.; Lin, S.F.; Yeh, J.T.; Ho, H.Y.; Lin, J.R.; Liu, F.C. (1)H Nuclear Magnetic Resonance (NMR)-Based Cerebrospinal Fluid and Plasma Metabolomic Analysis in Type 2 Diabetic Patients and Risk Prediction for Diabetic Microangiopathy. J. Clin. Med. 2019, 8, 874. [Google Scholar] [CrossRef]
- Curovic, V.R.; Suvitaival, T.; Mattila, I.; Ahonen, L.; Trošt, K.; Theilade, S.; Hansen, T.W.; Legido-Quigley, C.; Rossing, P. Circulating Metabolites and Lipids Are Associated to Diabetic Retinopathy in Individuals with Type 1 Diabetes. Diabetes 2020, 69, 2217–2226. [Google Scholar] [CrossRef]
- Wang, H.; Li, S.; Wang, C.; Wang, Y.; Fang, J.; Liu, K. Plasma and Vitreous Metabolomics Profiling of Proliferative Diabetic Retinopathy. Investig. Ophthalmol. Vis. Sci. 2022, 63, 17. [Google Scholar] [CrossRef]
- Quek, D.Q.Y.; He, F.; Sultana, R.; Banu, R.; Chee, M.L.; Nusinovici, S.; Thakur, S.; Qian, C.; Cheng, C.-Y.; Wong, T.Y.; et al. Novel Serum and Urinary Metabolites Associated with Diabetic Retinopathy in Three Asian Cohorts. Metabolites 2021, 11, 614. [Google Scholar] [CrossRef]
- Wang, X.; Li, Y.; Xie, M.; Deng, L.; Zhang, M.; Xie, X. Urine metabolomics study of Bushen Huoxue Prescription on diabetic retinopathy rats by UPLC-Q-exactive Orbitrap-MS. Biomed. Chromatogr. 2020, 34, e4792. [Google Scholar] [CrossRef]
- Sas, K.M.; Lin, J.; Rajendiran, T.M.; Soni, T.; Nair, V.; Hinder, L.M.; Jagadish, H.V.; Gardner, T.W.; Abcouwer, S.F.; Brosius, F.C., III; et al. Shared and distinct lipid-lipid interactions in plasma and affected tissues in a diabetic mouse model. J. Lipid Res. 2018, 59, 173–183. [Google Scholar] [CrossRef]
- Ge, N.; Kong, L.; Zhang, A.-H.; Sun, Y.; Zhao, M.-Q.; Zhang, B.; Xu, L.; Ke, X.; Sun, H.; Wang, X.-J. Identification of key lipid metabolites during metabolic dysregulation in the diabetic retinopathy disease mouse model and efficacy of Keluoxin capsule using an UHPLC-MS-based non-targeted lipidomics approach. RSC Adv. 2021, 11, 5491–5505. [Google Scholar] [CrossRef]
- Wiggenhauser, L.M.; Qi, H.; Stoll, S.J.; Metzger, L.; Bennewitz, K.; Poschet, G.; Krenning, G.; Hillebrands, J.L.; Hammes, H.P.; Kroll, J. Activation of Retinal Angiogenesis in Hyperglycemic pdx1 (-/-) Zebrafish Mutants. Diabetes 2020, 69, 1020–1031. [Google Scholar] [CrossRef]
- Chetwynd, A.J.; Dunn, W.B.; Rodriguez-Blanco, G. Collection and Preparation of Clinical Samples for Metabolomics. Adv. Exp. Med. Biol. 2017, 965, 19–44. [Google Scholar] [CrossRef]
- Vignoli, A.; Tenori, L.; Morsiani, C.; Turano, P.; Capri, M.; Luchinat, C. Serum or Plasma (and Which Plasma), That Is the Question. J. Proteome Res. 2022, 21, 1061–1072. [Google Scholar] [CrossRef]
- Yu, Z.; Kastenmüller, G.; He, Y.; Belcredi, P.; Möller, G.; Prehn, C.; Mendes, J.; Wahl, S.; Roemisch-Margl, W.; Ceglarek, U.; et al. Differences between Human Plasma and Serum Metabolite Profiles. PLoS ONE 2011, 6, e21230. [Google Scholar] [CrossRef]
- Floyd, J.L.; Grant, M.B. The gut–eye axis: Lessons learned from murine models. Ophthalmol. Ther. 2020, 9, 499–513. [Google Scholar] [CrossRef]
- Emwas, A.-H.M. The strengths and weaknesses of NMR spectroscopy and mass spectrometry with particular focus on metabolomics research. In Metabonomics; Humana Press: New York, NY, USA, 2015; pp. 161–193. [Google Scholar]
- Barnes, S.; Benton, H.P.; Casazza, K.; Cooper, S.J.; Cui, X.; Du, X.; Engler, J.; Kabarowski, J.H.; Li, S.; Pathmasiri, W. Training in metabolomics research. I. Designing the experiment, collecting and extracting samples and generating metabolomics data. J. Mass Spectrom. 2016, 51, 461–475. [Google Scholar] [CrossRef]
- Johnson, C.H.; Ivanisevic, J.; Siuzdak, G. Metabolomics: Beyond biomarkers and towards mechanisms. Nat. Rev. Mol. Cell Biol. 2016, 17, 451–459. [Google Scholar] [CrossRef]
- Fang, Y.; Xu, J.; Li, Z.; Yang, Z.; Xiong, L.; Jin, Y.; Wang, Q.; Xie, S.; Zhu, W.; Chang, S. Design and synthesis of novel pyrimido [5, 4-d] pyrimidine derivatives as GPR119 agonist for treatment of type 2 diabetes. Bioorganic Med. Chem. 2018, 26, 4080–4087. [Google Scholar] [CrossRef]
- Balestri, F.; Quattrini, L.; Coviello, V.; Sartini, S.; Da Settimo, F.; Cappiello, M.; Moschini, R.; Del Corso, A.; Mura, U.; La Motta, C. Acid derivatives of pyrazolo [1, 5-a] pyrimidine as aldose reductase differential inhibitors. Cell Chem. Biol. 2018, 25, 1414–1418.e3. [Google Scholar] [CrossRef]
- Pang, L.-Q.; Liang, Q.-L.; Wang, Y.-M.; Ping, L.; Luo, G.-A. Simultaneous determination and quantification of seven major phospholipid classes in human blood using normal-phase liquid chromatography coupled with electrospray mass spectrometry and the application in diabetes nephropathy. J. Chromatogr. B 2008, 869, 118–125. [Google Scholar] [CrossRef] [PubMed]
- Gheni, G.; Ogura, M.; Iwasaki, M.; Yokoi, N.; Minami, K.; Nakayama, Y.; Harada, K.; Hastoy, B.; Wu, X.; Takahashi, H.; et al. Glutamate Acts as a Key Signal Linking Glucose Metabolism to Incretin/cAMP Action to Amplify Insulin Secretion. Cell Rep. 2014, 9, 661–673. [Google Scholar] [CrossRef]
- Bringmann, A.; Pannicke, T.; Biedermann, B.; Francke, M.; Iandiev, I.; Grosche, J.; Wiedemann, P.; Albrecht, J.; Reichenbach, A. Role of retinal glial cells in neurotransmitter uptake and metabolism. Neurochem. Int. 2009, 54, 143–160. [Google Scholar] [CrossRef]
- Brosnan, J.T.; Brosnan, M.E. Glutamate: A truly functional amino acid. Amino Acids 2013, 45, 413–418. [Google Scholar] [CrossRef]
- Ambati, J.; Chalam, K.V.; Chawla, D.K.; D’Angio, C.T.; Guillet, E.G.; Rose, S.J.; Vanderlinde, R.E.; Ambati, B.K. Elevated γ-Aminobutyric Acid, Glutamate, and Vascular Endothelial Growth Factor Levels in the Vitreous of Patients with Proliferative Diabetic Retinopathy. Arch. Ophthalmol. 1997, 115, 1161–1166. [Google Scholar] [CrossRef]
- Ishikawa, S.; Nakazawa, M.; Ishikawa, A.; Ishiguro, S.-I.; Tamai, M. Alteration of glutamine concentration in the vitreous humor in patients with proliferative vitreoretinopathy. Curr. Eye Res. 1995, 14, 191–197. [Google Scholar] [CrossRef]
- Lieth, E.; Barber, A.J.; Xu, B.; Dice, C.; Ratz, M.J.; Tanase, D.; Strother, J.M. Glial reactivity and impaired glutamate metabolism in short-term experimental diabetic retinopathy. Penn State Retina Research Group. Diabetes 1998, 47, 815–820. [Google Scholar] [CrossRef]
- Bogdanov, P.; Corraliza, L.; Villena, J.A.; Carvalho, A.R.; Garcia-Arumí, J.; Ramos, D.; Ruberte, J.; Simó, R.; Hernández, C. The db/db Mouse: A Useful Model for the Study of Diabetic Retinal Neurodegeneration. PLoS ONE 2014, 9, e97302. [Google Scholar] [CrossRef]
- Ng, Y.-K.; Zeng, X.-X.; Ling, E.-A. Expression of glutamate receptors and calcium-binding proteins in the retina of streptozotocin-induced diabetic rats. Brain Res. 2004, 1018, 66–72. [Google Scholar] [CrossRef] [PubMed]
- Santiago, A.R.; Gaspar, J.M.; Baptista, F.I.; Cristóvão, A.J.; Santos, P.F.; Kamphuis, W.; Ambrósio, A.F. Diabetes changes the levels of ionotropic glutamate receptors in the rat retina. Mol. Vis. 2009, 15, 1620–1630. [Google Scholar]
- Ola, M.S.; Alhomida, A.S.; LaNoue, K.F. Gabapentin Attenuates Oxidative Stress and Apoptosis in the Diabetic Rat Retina. Neurotox. Res. 2019, 36, 81–90. [Google Scholar] [CrossRef] [PubMed]
- Ma, T.; Liu, T.; Xie, P.; Jiang, S.; Yi, W.; Dai, P.; Guo, X. UPLC-MS-based urine nontargeted metabolic profiling identifies dysregulation of pantothenate and CoA biosynthesis pathway in diabetic kidney disease. Life Sci. 2020, 258, 118160. [Google Scholar] [CrossRef]
- Hatano, M.; Hodges, R.E.; Evans, T.C.; Hagemann, R.F.; Leeper, D.B.; Bean, W.B.; Krehl, W.A. Urinary excretion of pantothenic acid by diabetic patients and by alloxan-diabetic rats. Am. J. Clin. Nutr. 1967, 20, 960–967. [Google Scholar] [CrossRef]
- Slyshenkov, V.S.; Rakowska, M.; Wojtczak, L. Protective effect of pantothenic acid and related compounds against permeabilization of Ehrlich ascites tumour cells by digitonin. Acta Biochim. Pol. 1996, 43, 407–410. [Google Scholar] [CrossRef]
- Demirci, B.; Demir, O.; Dost, T.; Birincioglu, M. Protective effect of vitamin B5 (dexpanthenol) on cardiovascular damage induced by streptozocin in rats. Bratisl. Lek. Listy 2014, 115, 190–196. [Google Scholar] [CrossRef]
- Depeint, F.; Bruce, W.R.; Shangari, N.; Mehta, R.; O’Brien, P.J. Mitochondrial function and toxicity: Role of B vitamins on the one-carbon transfer pathways. Chem. Biol. Interact. 2006, 163, 113–132. [Google Scholar] [CrossRef]
- Kang, Q.; Yang, C. Oxidative stress and diabetic retinopathy: Molecular mechanisms, pathogenetic role and therapeutic implications. Redox Biol. 2020, 37, 101799. [Google Scholar] [CrossRef]
- Oates, P.J. Polyol Pathway and Diabetic Peripheral Neuropathy. In International Review of Neurobiology; Academic Press: Cambridge, MA, USA, 2002; Volume 50, pp. 325–392. [Google Scholar]
- Dagher, Z.; Park, Y.S.; Asnaghi, V.; Hoehn, T.; Gerhardinger, C.; Lorenzi, M. Studies of Rat and Human Retinas Predict a Role for the Polyol Pathway in Human Diabetic Retinopathy. Diabetes 2004, 53, 2404–2411. [Google Scholar] [CrossRef]
- Li, C.; Miao, X.; Li, F.; Wang, S.; Liu, Q.; Wang, Y.; Sun, J. Oxidative Stress-Related Mechanisms and Antioxidant Therapy in Diabetic Retinopathy. Oxidative Med. Cell. Longev. 2017, 2017, 9702820. [Google Scholar] [CrossRef] [PubMed]
- Tam, V.; Patel, N.; Turcotte, M.; Bossé, Y.; Paré, G.; Meyre, D. Benefits and limitations of genome-wide association studies. Nat. Rev. Genet. 2019, 20, 467–484. [Google Scholar] [CrossRef]
- Shastry, B.S. SNPs: Impact on gene function and phenotype. Methods Mol. Biol. 2009, 578, 3–22. [Google Scholar] [CrossRef]
- Visscher, P.M.; Brown, M.A.; McCarthy, M.I.; Yang, J. Five years of GWAS discovery. Am. J. Hum. Genet. 2012, 90, 7–24. [Google Scholar] [CrossRef]
- Milne, R.L.; Kuchenbaecker, K.B.; Michailidou, K.; Beesley, J.; Kar, S.; Lindström, S.; Hui, S.; Lemaçon, A.; Soucy, P.; Dennis, J.; et al. Identification of ten variants associated with risk of estrogen-receptor-negative breast cancer. Nat. Genet. 2017, 49, 1767–1778. [Google Scholar] [CrossRef]
- Sud, A.; Kinnersley, B.; Houlston, R.S. Genome-wide association studies of cancer: Current insights and future perspectives. Nat. Rev. Cancer 2017, 17, 692–704. [Google Scholar] [CrossRef]
- Zhao, W.; Rasheed, A.; Tikkanen, E.; Lee, J.J.; Butterworth, A.S.; Howson, J.M.M.; Assimes, T.L.; Chowdhury, R.; Orho-Melander, M.; Damrauer, S.; et al. Identification of new susceptibility loci for type 2 diabetes and shared etiological pathways with coronary heart disease. Nat. Genet. 2017, 49, 1450–1457. [Google Scholar] [CrossRef]
- Khan, N.; Paterson, A.D.; Roshandel, D.; Raza, A.; Ajmal, M.; Waheed, N.K.; Azam, M.; Qamar, R. Association of IGF1 and VEGFA polymorphisms with diabetic retinopathy in Pakistani population. Acta Diabetol. 2020, 57, 237–245. [Google Scholar] [CrossRef]
- Olivares-González, L.; Martínez-Fernández de la Cámara, C.; Hervás, D.; Marín, M.P.; Lahoz, A.; Millán, J.M.; Rodrigo, R. cGMP-Phosphodiesterase Inhibition Prevents Hypoxia-Induced Cell Death Activation in Porcine Retinal Explants. PLoS ONE 2016, 11, e0166717. [Google Scholar] [CrossRef]
- Patel, C.; Rojas, M.; Narayanan, S.P.; Zhang, W.; Xu, Z.; Lemtalsi, T.; Jittiporn, K.; Caldwell, R.; Caldwell, R. Arginase as a Mediator of Diabetic Retinopathy. Front. Immunol. 2013, 4, 173. [Google Scholar] [CrossRef]
- Elms, S.C.; Toque, H.A.; Rojas, M.; Xu, Z.; Caldwell, R.W.; Caldwell, R.B. The role of arginase I in diabetes-induced retinal vascular dysfunction in mouse and rat models of diabetes. Diabetologia 2013, 56, 654–662. [Google Scholar] [CrossRef] [PubMed]
- Fawad Ali Shah, S.; Iqbal, T.; Naveed, N.; Akram, S.; Arshad Rafiq, M.; Hussain, S. ARG1 single nucleotide polymorphisms rs2781666 and rs2781665 confer risk of Type 2 diabetes mellitus. EXCLI J. 2018, 17, 847–855. [Google Scholar] [CrossRef]
- Wu, G.; Morris, S.M., Jr. Arginine metabolism: Nitric oxide and beyond. Biochem. J. 1998, 336, 1–17. [Google Scholar] [CrossRef] [PubMed]
- Zhou, L.; Sun, C.-B.; Liu, C.; Fan, Y.; Zhu, H.-Y.; Wu, X.-W.; Hu, L.; Li, Q.-P. Upregulation of arginase activity contributes to intracellular ROS production induced by high glucose in H9c2 cells. Int. J. Clin. Exp. Pathol. 2015, 8, 2728–2736. [Google Scholar]
- Shosha, E.; Fouda, A.Y.; Narayanan, S.P.; Caldwell, R.W.; Caldwell, R.B. Is the Arginase Pathway a Novel Therapeutic Avenue for Diabetic Retinopathy? J. Clin. Med. 2020, 9, 425. [Google Scholar] [CrossRef]
- Manganiello, V.C.; Fontana, J.; Degerman, E.; Ahmad, F. Cyclic Nucleotide Phosphodiesterases. In Encyclopedia of Respiratory Medicine; Laurent, G.J., Shapiro, S.D., Eds.; Academic Press: Oxford, UK, 2006; pp. 589–594. [Google Scholar]
- Kilanowska, A.; Ziółkowska, A. Role of Phosphodiesterase in the Biology and Pathology of Diabetes. Int. J. Mol. Sci. 2020, 21, 8244. [Google Scholar] [CrossRef]
- Heimann, E.; Jones, H.A.; Resjö, S.; Manganiello, V.C.; Stenson, L.; Degerman, E. Expression and Regulation of Cyclic Nucleotide Phosphodiesterases in Human and Rat Pancreatic Islets. PLoS ONE 2010, 5, e14191. [Google Scholar] [CrossRef]
- Vujkovic, M.; Keaton, J.M.; Lynch, J.A.; Miller, D.R.; Zhou, J.; Tcheandjieu, C.; Huffman, J.E.; Assimes, T.L.; Lorenz, K.; Zhu, X.; et al. Discovery of 318 new risk loci for type 2 diabetes and related vascular outcomes among 1.4 million participants in a multi-ancestry meta-analysis. Nat. Genet. 2020, 52, 680–691. [Google Scholar] [CrossRef]
- Mahajan, A.; Taliun, D.; Thurner, M.; Robertson, N.R.; Torres, J.M.; Rayner, N.W.; Payne, A.J.; Steinthorsdottir, V.; Scott, R.A.; Grarup, N.; et al. Fine-mapping type 2 diabetes loci to single-variant resolution using high-density imputation and islet-specific epigenome maps. Nat. Genet. 2018, 50, 1505–1513. [Google Scholar] [CrossRef]
- Li, Y.R.; Li, J.; Zhao, S.D.; Bradfield, J.P.; Mentch, F.D.; Maggadottir, S.M.; Hou, C.; Abrams, D.J.; Chang, D.; Gao, F.; et al. Meta-analysis of shared genetic architecture across ten pediatric autoimmune diseases. Nat. Med. 2015, 21, 1018–1027. [Google Scholar] [CrossRef]
- Defer, N.; Best-Belpomme, M.; Hanoune, J. Tissue specificity and physiological relevance of various isoforms of adenylyl cyclase. Am. J. Physiol. Ren. Physiol. 2000, 279, F400–F416. [Google Scholar] [CrossRef] [PubMed]
- Mahajan, A.; Go, M.J.; Zhang, W.; Below, J.E.; Gaulton, K.J.; Ferreira, T.; Horikoshi, M.; Johnson, A.D.; Ng, M.C.; Prokopenko, I.; et al. Genome-wide trans-ancestry meta-analysis provides insight into the genetic architecture of type 2 diabetes susceptibility. Nat. Genet. 2014, 46, 234–244. [Google Scholar] [CrossRef] [PubMed]
- Dupuis, J.; Langenberg, C.; Prokopenko, I.; Saxena, R.; Soranzo, N.; Jackson, A.U.; Wheeler, E.; Glazer, N.L.; Bouatia-Naji, N.; Gloyn, A.L.; et al. New genetic loci implicated in fasting glucose homeostasis and their impact on type 2 diabetes risk. Nat. Genet. 2010, 42, 105–116. [Google Scholar] [CrossRef] [PubMed]
- Xue, A.; Wu, Y.; Zhu, Z.; Zhang, F.; Kemper, K.E.; Zheng, Z.; Yengo, L.; Lloyd-Jones, L.R.; Sidorenko, J.; Wu, Y.; et al. Genome-wide association analyses identify 143 risk variants and putative regulatory mechanisms for type 2 diabetes. Nat. Commun. 2018, 9, 2941. [Google Scholar] [CrossRef]
- Hodson, D.J.; Mitchell, R.K.; Marselli, L.; Pullen, T.J.; Gimeno Brias, S.; Semplici, F.; Everett, K.L.; Cooper, D.M.; Bugliani, M.; Marchetti, P.; et al. ADCY5 couples glucose to insulin secretion in human islets. Diabetes 2014, 63, 3009–3021. [Google Scholar] [CrossRef] [Green Version]


| Species | Samples | Subjects | Platforms | Differential Metabolites | Study |
|---|---|---|---|---|---|
| Human | Plasma | 64 DR 25 controls | GC–MS | Arachidonic acid, citric acid, glucose, linoleic acid, l-aspartic acid, methymaleic acid, pyruvic acids, stearic acid, trans-oleic acid, β-hydroxybutyric acid | Li et al. (2011) [16] |
| 38 DR 37 controls | HPLC–MS | ↑: cytosine, cytidine, thynidine | Xia et al. (2011) [17] | ||
| 39 DR 35 NDR | UPLC-MS | ↑: adenosine, inosine, uric acid, xanthine | Xia et al. (2014) [18] | ||
| 80 DR 80 controls | GC-MS | ↑: erythritol, gluconic acid, lactose/cellobiose, mannose, maltose/trehalose, ribose, urea, 1,5-gluconolactone, 2-deoxyribonic acid, 3,4-dihydroxybutyric acid ↓: 1,5-anhydroglucitol | Chen et al. (2016) [19] | ||
| 52 PDR 72 NPDR 59 NDR | UPLC-MS, GC-MS | 7 amino acids (asparagine, aspartic acid, glutamic acid, glutamine, glycine, methionine, pyroglutamic acid), 6 organic compounds (citric acid, lactic acid, phosphoric acid, succinic acid, urea, uric acid), 7 carbohydrates (fructose, glucose, myo-inositol, 1,5-anhydroglucitol, 3 saccharides), 11 LysoPCs | Rhee et al. (2018) [20] | ||
| 28 NPDR 22 NDR | LC-MS | PGF2α | Peng et al. (2018) [21] | ||
| 21 PDR 21 NDR | UPLC-MS | 63 metabolites (e.g., acetic acid, cytidine sulfite, dihydrouracil, fumaric acid, imidazolone, L-serine, malonic acid, sulfate, uridine, and β-alanine) | Zhu et al. (2019) [22] | ||
| 83 DR 90 NDR | LC-MS | 126 metabolites (e.g., arginine, acylcarnitine, argininic acid, citrulline, dehydroxycarnitine, glutamic γ-semialdehyde) | Sumarriva et al. (2019) [23] | ||
| 21 PDR 21 NPDR 32 NDR | UPLC-MS | Acetylcarnitine, butyryl carnitine, cholic acid, D-glucuronic acid, D-(+)-pantothenic acid, dehydroisoandrosterone sulfate, pantothenic acid, pseudouridine, hypoxanthine, N2,N2-dimethylguanosine, N-acetyltryptophan, leucylleucine, sn-glycero-3-phosphocholine, propionylcarnitine, inosine, urocanic acid, N-fructosyl isoleucine, kynurenic acid, phenylacetylglutamine, glutamine, (−)-riboflavin, 3-methylhistidine, | Sun et al. (2021) [24] | ||
| 64 PDR 92 NPDR 159 NDR | LC-MS | ↑: arginine, citrulline | Peters et al. (2021) [25] | ||
| Serum | 176 DR 329 NDR | LC-MS | ↑: asymmetric dimethylarginine (ADMA), L-arginine, symmetric dimethylarginine (SDMA) | Abhary et al. (2009) [26] | |
| 689 DR 216 controls | GC-MS, LC-MS | 12-hydroxyeicosatetraenoic acid (12-HETE) and 2-piperidone | Xuan et al. (2020) [27] | ||
| 43 DR 44 controls | UHPLC–MS | ↑: 13 lipid (sub)classes (Cers, CerG1s, ChEs, DGs, FAs, LPCs, LPEs, LPC-Os, LPE-ps, PCs, PC-Os, PE-ps, SMs) | Xuan et al. (2020) [28] | ||
| 51 PDR 123 NPDR 143 NDR | LC–MS | DR vs. NDR: 62 metabolites PDR vs. NDR: 53 metabolites NPDR vs. NDR: 30 metabolites PDR vs. NPDR: 8 metabolites | Yun et al. (2020) [29] | ||
| 69 DR 69 NDR | UPLC-MS | ↑: nicotinuric acid, o-cresol, ornithine, phenylacetylglutamine, p-cresol ↓: alpha-linolenic acid, arachidonic acid, cis-docosahexaenoic acid, gamma-linolenic acid, linolelaidic acid, linoleic acid, palmitoleic acid, cis-7-hexadecenoic acid, hexadecanoic acid, elaidic acid | Zuo et al. (2021) [30] | ||
| 123 DR 116 NDR | Metabolon DiscoveryHD4 | Glycoursodeoxycholate, tryptophan, xanthine, phenylacetylglutamine, X-23997, X-13729, 1-palmitoyl-GPA (16:0), and 5-methylthioadenosine (MTA) | Yousri et al. (2022) [31] | ||
| Erythrocyte | 70 DR 14 controls | LC-MS | ↓: arachidonic acid, docosahexaenoic acid, N-6 PUFAs, N-3 PUFAs | Koehrer et al. (2014) [32] | |
| Stool | 45 PDR 90 NDR | UPLC-MS | Alantolactone, adenine, corosolic acid, desogestrel, D-erythro-sphinganine, HETE, leukotriene | Ye et al. (2021) [33] | |
| 21 PDR 14 NDR | UPLC-MS | ↑: betonicin, butylparaben, traumatic acid, thromboxane B3, salicyluric acid, pyro-L-glutaminyl-L-glutamine, harman, flazine, β-carboline ↓: D-proline, armillaramide, N-gamma-L-glutamyl-D-alanine, N-acetyl-L-methionine, L-threo-3-phenylserine, (R)-pelletierine | Zhou et al. (2021) [34] | ||
| Retina | 20 NPDR 20 NDR | UHPLC-MS | ↓: long-chain ACs (C ≥ 14), longer-chain FAHFAs, DAGs, TAGs, PCs, Cer | Fort et al. (2021) [35] | |
| Aqueous humor | 14 DR 13 NDR | NMR | ↑: asparagine, DMA, glutamine, histidine, threonine ↓: lactate, succinate, 2HB | Jin et al. (2019) [36] | |
| Aqueous and vitreous humor | 18 PDR 22 controls | LC-MS | Cysteine persulfides (CysSSH), cystine, oxidized glutathione trisulfide (GSSSG) | Kunikata et al. (2017) [37] | |
| Vitreous humor: 28 PDR 22 no diabetes Aqueous humor: 23 PDR 25 no diabetes | GC-MS | Vitreous humor: alanine, alloisoleucine, creatinine, glutamine, leucine, lysine, ornithine, pyroglutamic acid, pyruvic acid, phenylalanine, uric acid, threonine, valine, myoinositol, hydroxylamine; Aqueous humor: citrulline, D-glucose, isocitric acid, fructose 6-phosphate, L-lactic acid, threonic acid, myoinositol, D-2,3-dihydroxypropanoic acid | Wang et al. (2019) [38] | ||
| Vitreous humor | 2 PDR 2 PVR 7 no diabetes | NMR | unclear | Young et al. (2009) [39] | |
| 22 PDR 22 no diabetes | NMR | ↑: glucose, lactate ↓: ascorbic acid, galactitol | Barba et al. (2010) [40] | ||
| 16 NPDR 15 PDR 16 no diabetes | LC-MS | ↑: 5-HETE ↓: 14(15)-EET, 11(12)-EET | Schwartzman et al. (2010) [41] | ||
| 20 PDR 31 no diabetes | HPLC-MS | ↑: allantoin, arginine, citrulline, decanoylcarnitine, proline, ornithine, octanoylcarnitine, methionine | Paris et al. (2015) [42] | ||
| 9 PDR 8 controls | UHPLC-MS | Ascorbate, carnitine, citrulline, creatinine, dehydroascorbate, fumarate, glutamine, malate, N-amidino-L-aspartate, sn-glycerol 3-phosphate, proline, pyruvate, tripeptide, ribose, triacanthine, a-ketoglutarate, 5-oxoproline | Haines et al. (2018) [43] | ||
| 31 PDR 13 no diabetes | LC-MS | ↑: 5-HETE, 12-HETE, 20-HETE, and 20-COOH-AA | Lin et al. (2020) [44] | ||
| 35 PDR19 no diabetes | UHPLC-MS | ↑: allantoin, citrulline, dimethylglycine, glycine, lactate, ornithine, pyruvate, proline, urate, N-acetylserine, α-ketoglutarate ↓: creatine, succinate | Tomita et al. (2020) [45] | ||
| 41 PDR 22 no diabetes | UHPLC-MS | ↑: 21 oxylipins (ARA, DHA, DTA, EPA, 8S-HETrE, 9-OxoODE, 9S-HOTrE, 9S-HODE, 13S-HOTrE, 13-OxoODE, ±12(13) -EpOME, 12S-HETE, ±12 (13)-DiHOME, ±9(10)-EpOME, ±9(10)-DiHOME, 13S(γ)-HOTrE, 15-deoxy-Δ12,14-PGJ2, 15S-HETrE, ±14,15-DiHETrE, ±19,20-EpDPE, and 13,14-dihydro PGF2α) | Zhao et al. (2022) [46] | ||
| CSF and plasma | 19 DR 14 controls | NMR | Alanine, histidine, leucine, pyruvate, tyrosine, and valine | Lin et al. (2019) [47] | |
| Plasma and serum | 228 PDR 276 NPDR 141 NDR | GC-MS, UHPLC-MS | ↑: 2,4-DHBA, 3,4-DHBA, 3,4-DHBA, ribitol ↓: LPC(16:1), PC(32:1), PC(32:2), TG(50:1), TG(50:2), TG(14:0/16:0/18:1), TG(50:3) | Curovic et al. (2020) [48] | |
| Plasma and vitreous humor | Plasma: 88 PDR 51 controlsVitreous: 51 PDR 23 controls | UPLC-MS | (↑ plasma and vitreous): pantetheine, (24R)-Cholest-5-ene-3-beta,24-diol, alpha-N-phenylacetyl-L-glutamine; (↓ plasma and vitreous): pipecolic acid; (plasma ↑, vitreous ↓): pyroglutamic acid | Wang et al. (2022) [49] | |
| Plasma, serum, and urine | 666 DR 2211 NDR | NMR | Serum/plasma: cholesterol esters, creatinine, tyrosine Urine: citrate, ethanolamine, formate, hypoxanthine | Quek et al. (2021) [50] | |
| Rat | Urine | 6 DR rats 6 controls | UPLC-MS | ↑: cholic acid, kynurenic acid, phenylacetylglycine, p-cresol sulfate, 3-methyldioxyindole, 5-l-glutamyl-taurine ↓: hippuric acid, indoxyl sulfate, p-cresol glucuronide | Wang et al. (2020) [51] |
| Mice | Plasma and retina | 10 db/db mice 10 db/+ mice | LC-MS | 133 lipids in plasma 61 lipids in retina 15 lipids in plasma and retina (e.g., DAG 34:2, DAG 38:5, LPC 18:1, PC 36:4, SM 36:2) | Sas et al. (2018) [52] |
| Blood | 20 db/db mice 10 db/m mice | UHPLC-MS | Arachidonic acid, cortisol, docosahexaenoic acid, lysoPC (18:0), leukotriene B4, prostaglandin D2, γ-linolenic acid | Ge et al. (2021) [53] | |
| Zebra-fish | whole body | 50 pdx1−/− zebrafish | UHPLC–MS | ↑: glutamate, proline, taurine ↓: ornithine, spermidine, tyrosine | Wiggenhauser et al. (2021) [54] |
| Samples | Cohorts | Biomarkers | AUC | Sensitivity | Specificity | Study |
|---|---|---|---|---|---|---|
| Serum | DR VS. NDR | A biomarker panel (12-HETE and 2-piperidone) | 0.946 | 0.894 | 0.919 | Xuan et al. (2020) [27] |
| NPDR VS. NDR | A biomarker panel (12-HETE and 2-piperidone) | 0.958 | 0.929 | 0.901 | Xuan et al. (2020) [27] | |
| DR VS. NDR | A biomarker panel (linoleic acid, nicotinuric acid, ornithine, and phenylacetylglutamine) | 0.920 | 0.960 | 0.780 | Zuo et al. (2021) [30] | |
| Plasma | DR VS. NDR | Cytidine | 0.849 | 0.737 | 0.919 | Xia et al. (2011) [17] |
| DR VS. NDR | Adenosine | 0.913 | 0.947 | 1.000 | Xia et al. (2014) [18] | |
| DR VS. NDR | 1,5-Gluconolactone, 2-deoxyribonic acid, gluconic acid, and urea | 0.71, 0.68, 0.72, 0.69, respectively | unclear | unclear | Chen et al. (2016) [19] | |
| DR VS. NDR | Ratio of the levels of glutamine to glutamic acid | 0.742 | unclear | unclear | Rhee et al. (2018) [20] | |
| DR VS. NDR | A biomarker panel (alanine, histidine, leucine, pyruvate, tyrosine, and valine) | 0.836 | unclear | unclear | Lin et al. (2019) [47] | |
| PDR VS. NDR | Fumaric acid, uridine, acetic acid, and cytidine | 0.96, 0.95, 1.00, 0.95, respectively | unclear | unclear | Zhu et al. (2019) [22] | |
| DR VS. NDR | A risk score (pseudouridine) | 0.800 | 0.976 | 0.531 | Sun et al. (2021) [24] | |
| PDR VS. (NPDR and NDR) | A risk score (pseudouridine, glutamate, leucylleucine and N-acetyltryptophan) | 0.820 | 0.762 | 0.774 | Sun et al. (2021) [24] | |
| Vitreous humor | PDR VS. no diabetes | A biomarker panel (galactitol and ascorbic acid) | unclear | 0.860 | 0.810 | Barba et al. (2010) [40] |
| PDR VS. no diabetes | Xanthine, proline, citrulline, pyruvate | 1.000, 0.986, 0.972, 0.944, respectively | unclear | unclear | Haines et al. (2018) [43] | |
| PDR VS. no diabetes | DTA, EPA, DHA, ARA, ±9(10)-DiHOME, ±19,20-EpDPE, and ±12(13)-EpOME | 0.960, 0.803, 0.871, 0.942, 0.805, 0.819, 0.828, respectively | unclear | unclear | Zhao et al. (2022) [46] | |
| PDR VS. no diabetes | A biomarker panel (pyroglutamic acid and pyruvic acid) | 0.951 | 0.955 | 0.857 | Wang et al. (2019) [38] | |
| Aqueous humor | PDR VS. no diabetes | A biomarker panel (D-2,3-dihydroxypropanoic acid, isocitric acid, fructose 6-phosphate, and L-lactic acid) | 0.965 | 0.880 | 0.957 | Wang et al. (2019) [38] |
| Cerebrospinal fluid | DR VS. NDR | A biomarker panel (alanine, histidine, leucine, pyruvate, tyrosine, and valine) | 0.858 | unclear | unclear | Lin et al. (2019) [47] |
| Stool | PDR VS. NDR | A classifier (Top 5 are alantolactone, desogestrel, adenine, D-erythro-sphinganine, and corosolic acid.) | 0.960 | 0.846 | 0.936 | Ye et al. (2021) [33] |
| Samples | Pathways | Reported Times |
|---|---|---|
| Plasma | Purine metabolism | 4 |
| Arginine and proline metabolism | 3 | |
| Pyrimidine metabolism | 3 | |
| Alanine, aspartate and glutamate metabolism | 2 | |
| Cysteine and methionine metabolism | 2 | |
| 4-hydroxybenzeneacetic acid | 1 | |
| Arachidonic acid metabolism | 1 | |
| Aspartate and asparagine metabolism | 1 | |
| Caffeine metabolism | 1 | |
| Creatinine metabolism | 1 | |
| D-glutamine metabolism | 1 | |
| Fumaric acid metabolism | 1 | |
| Galactose metabolism | 1 | |
| Glyceryl-glycoside metabolism | 1 | |
| Histidine metabolism | 1 | |
| Leukotrienes metabolism | 1 | |
| Linoleic acid metabolism | 1 | |
| Lysine metabolism | 1 | |
| Myo-inositol metabolism | 1 | |
| Niacin metabolism | 1 | |
| Nitrogen metabolism | 1 | |
| Pantothenate and CoA biosynthesis | 1 | |
| Pentose phosphate metabolism | 1 | |
| Phenylalanine metabolism | 1 | |
| Polyol metabolism | 1 | |
| Riboflavin metabolism | 1 | |
| Sphingolipid metabolism | 1 | |
| Sulfur metabolism | 1 | |
| Urea cycle | 1 | |
| α-linolenic acid metabolism | 1 | |
| Vitreous | Arginine and proline metabolism | 2 |
| Valine, leucine, and isoleucine biosynthesis | 2 | |
| Alanine, aspartate and glutamate metabolism | 1 | |
| Aminoacyl-tRNA biosynthesis | 1 | |
| Glycine and serine metabolism | 1 | |
| Glycolysis | 1 | |
| Nitrogen metabolism | 1 | |
| Pantothenate and CoA biosynthesis | 1 | |
| Pentose phosphate pathway | 1 | |
| Phenylalanine metabolism | 1 | |
| Purine metabolism | 1 | |
| Taurine and hypotaurine metabolism | 1 |
Publisher’s Note: MDPI stays neutral with regard to jurisdictional claims in published maps and institutional affiliations. |
© 2022 by the authors. Licensee MDPI, Basel, Switzerland. This article is an open access article distributed under the terms and conditions of the Creative Commons Attribution (CC BY) license (https://creativecommons.org/licenses/by/4.0/).
Share and Cite
Jian, Q.; Wu, Y.; Zhang, F. Metabolomics in Diabetic Retinopathy: From Potential Biomarkers to Molecular Basis of Oxidative Stress. Cells 2022, 11, 3005. https://doi.org/10.3390/cells11193005
Jian Q, Wu Y, Zhang F. Metabolomics in Diabetic Retinopathy: From Potential Biomarkers to Molecular Basis of Oxidative Stress. Cells. 2022; 11(19):3005. https://doi.org/10.3390/cells11193005
Chicago/Turabian StyleJian, Qizhi, Yingjie Wu, and Fang Zhang. 2022. "Metabolomics in Diabetic Retinopathy: From Potential Biomarkers to Molecular Basis of Oxidative Stress" Cells 11, no. 19: 3005. https://doi.org/10.3390/cells11193005