Article

NLRP1 Inflammasome Activation in the Hippocampal Formation in Alzheimer’s Disease: Correlation with Neuropathological Changes and Unbiasedly Estimated Neuronal Loss

1
Department of Neuroscience, Croatian Institute for Brain Research, University of Zagreb School of Medicine, Šalata 12, 10000 Zagreb, Croatia
2
BRAIN Centre, Institute of Psychiatry, Psychology, and Neuroscience, King’s College London, London WC2R 2LS, UK
3
Nash Family Department of Neuroscience, Friedman Brain Institute, and Ronald M. Loeb Center for Alzheimer’s Disease, Icahn School of Medicine at Mount Sinai, New York, NY 10029, USA
*
Author to whom correspondence should be addressed.
Cells 2022, 11(14), 2223; https://doi.org/10.3390/cells11142223
Submission received: 29 April 2022 / Revised: 12 July 2022 / Accepted: 16 July 2022 / Published: 17 July 2022
(This article belongs to the Special Issue Biomarkers of Alzheimer’s Disease: New Insights)

Abstract

:
Neuroinflammation is one of the core pathological features of Alzheimer’s disease (AD) as both amyloid β (Aβ) and tau monomers and oligomers can trigger the long-term pro-inflammatory phenotype of microglial cells with consequent overactivation of the inflammasomes. To investigate the NLRP1 inflammasome activation in AD, we analyzed the expression of NLRP1, ASC, cleaved gasdermin (cGSDMD), and active caspase-6 (CASP-6) proteins in each hippocampal subdivision (hilar part of CA3, CA2/3, CA1, subiculum) of postmortem tissue of 9 cognitively healthy controls (HC) and 11 AD patients whose disease duration varied from 3 to 7 years after the clinical diagnosis. The total number of neurons, along with the total number of neurofibrillary tangles (NFTs), were estimated in Nissl- and adjacent modified Bielschowsky-stained sections, respectively, using the optical disector method. The same 9 HC and 11 AD cases were additionally semiquantitatively analyzed for expression of IBA1, HLA-DR, and CD68 microglial markers. Our results show that the expression of NLRP1, ASC, and CASP-6 is present in a significantly greater number of hippocampal formation neurons in AD brains compared to controls, suggesting that the NLRP1 inflammasome is more active in the AD brain. None of the investigated inflammasome and microglial markers were found to correlate with the age of the subjects or the duration of AD. However, besides positive correlations with microglial IBA1 expression in the subiculum and with microglial CD68 expression in the CA1 field and subiculum in the AD group, the overall NLRP1 expression in the hippocampal formation was positively correlated with the number of NFTs, thus providing a causal link between neuroinflammation and neurofibrillary degeneration. The accumulation of AT8-immunoreactive phosphorylated tau proteins that we observed at nuclear pores of large pyramidal neurons of the Ammon’s horn further supports their role in the extent of neuronal dysfunction and degeneration in AD. This is important because unlike fibrillar amyloid-β deposits that are not related to dementia severity, total NFTs and neuron numbers in the hippocampal formation, especially in the CA1 field, are the best correlates of cognitive deterioration in both human brain aging and AD. Our findings also support the notion that the CA2 field vulnerability is strongly linked to specific susceptibilities to different tauopathies, including primary age-related tauopathy. Altogether, these findings contrast with reports of nonsignificant microglial activation in aged nonhuman primates and indicate that susceptibility to inflammasome activation may render the human brain comparatively more vulnerable to neurodegenerative changes and AD. In conclusion, our results confirm a key role of NLRP1 inflammasome in AD pathogenesis and suggest NLRP1 as a potential diagnostic marker and therapeutic target to slow or prevent AD progression.

1. Introduction

Microglia are the most abundant immunocompetent cells in the brain. These brain-residing macrophages mediate nonspecific, innate immunity, and play important roles in the maintenance of homeostasis and neuroinflammation [1,2]. From the earliest descriptions of neuropathological changes in Alzheimer’s disease (AD), neuroinflammation has been one of the noted core features (for review, see [3]). Numerous studies have indicated that pathogenic forms of both amyloid β (Aβ) and tau protein monomers and oligomers can trigger the activation of microglial cells and induce their long-term proinflammatory phenotype [4,5,6,7,8,9,10,11,12]. However, in contrast to older paradigms where microglial activation had been considered as a mere biological response to Aβ accumulation, recent findings indicate that inflammation may parallel or even precede the development of AD pathological changes [13,14,15,16]. It is not known what initiates such changes, but it is presumed that disruption of the homeostatic levels of inflammatory mediators and neuroprotective molecules leads to chronic, uncontrolled neuroinflammation [17]. One of the possible mechanisms of chronic inflammatory response in the prodromal stages of AD could be the overactivation of the inflammasomes.
Inflammasomes are associated with inflammatory caspases 1, 4, 5, 11, and 12, and mediate some of the main programmed cell-death pathways [18]. Inflammasomes are supramolecular protein complexes that assemble in the cytosol in response to pathogens, noxious substances, metabolic perturbations (e.g., increased levels of free fatty acids and mitochondrial reactive oxygen species), and after sensing various damage-associated signals within cytoplasm through nucleotide-binding and oligomerization domain (NOD) of the NOD-like leucine-rich repeat receptors (NLRs) [19]. NLR family pyrin domain-containing 1 (NLRP1) is a 1429 amino-acid-long protein, known to form an inflammasome complex and activate caspase-1 upon degradation of its N-terminal part by the proteasome in neurons, whereas NLRP3 (NLR family pyrin domain-containing 3 protein) is the main NLRP family member in the brain, predominantly expressed in microglia. NLRP3 is a tripartite protein, consisting of an N-terminal pyrin domain (PYD), a central NOD, and a C-terminal leucine-rich repeat motif [20]. To activate caspase-1, both NLRP1 and NLRP3 inflammasomes recruit the adaptor protein ASC (apoptosis-associated speck-like protein containing a Caspase-Activation and Recruitment Domain), encoded by the PYCARD gene [18]. It is believed that ASC has a pivotal role in inflammasome assembly and activation. Once assembled, this inflammasome complex functions as an upstream activator of the NF-κB signaling pathway, which is known to play a key role in the regulation of inflammation, the innate immune response, and apoptosis [21]. Active caspase-1 (CASP-1) promotes proteolytic maturation of IL-1β and IL-18 and cleaves the gasdermin D (GSDMD) with the consequent formation of plasma membrane pores that lead to pathological ion fluxes resulting in pyroptotic cell death and release of inflammatory cytokines [18]. CASP-1 is also responsible for the CASP-6 activation [22] as cleavage of the CASP-6 in neurons is occurring downstream of the NLRP1 inflammasome activation [23]. Active CASP-6 is associated with AD pathological changes [24] and is present in all pathological alterations of AD, neurofibrillary tangles (NFTs), neuropil threads, and neuritic plaques, as well as pretangles [25,26]. It is also detectable inside neurons with or without NFTs [26]. In addition, intraneuronal CASP-6 activation increases with the progression of the disease [26].
The best-studied inflammasomes in AD are NLRP3 and NLRP1 [27,28,29,30,31,32,33,34]. Many AD patients have altered, proinflammatory gut microbiota, which is not detrimental just to the intestinal barrier, but can disrupt the blood-brain barrier, contributing to the reactive microglial response in the brain [35]. Gut dysbiosis induces NLRP3 inflammasome activation [35,36], and transplantation of a healthy gut microbiota into a rat model with AD-like pathology was shown to attenuate neuroinflammation and reduce Aβ, tau, and NLRP3 expression [37]. Inflammasomes are also highly expressed in other cells of the central nervous system. Unlike NLRP3, the NLRP1 inflammasome is predominantly expressed in pyramidal neurons and oligodendrocytes [38]. Intriguingly, in an Italian cohort of 542 subjects, four out of nine selected nonsynonymous NLRP1 polymorphisms were found to be associated with AD [28]. Moreover, the expression of the NLRP1 increases upon the addition of Aβ in neuronal cell cultures and is increasingly expressed in several animal models of AD [30]. Likewise, silencing the NLRP1 gene improves cognitive abilities and has a protective effect on neurons in animal models of AD [30,39,40,41,42].
Compared to controls, hippocampal NLRP1 immunoreactivity is higher in AD brains, whereas the NLRP1 inflammasome stress-induced activation in vitro results in elevated Aβ levels as a part of an acute protective response [23]. Therefore, cellular stress caused by various agents in sporadic AD or mutations of the genes in familial AD cases may trigger NLRP1 inflammasome activation, and further, promote an inflammatory response through astrocytes and microglia interplay [23].
Although these findings suggest that excessive NLRP1 inflammasome activation could contribute to the development and progression of AD, probably through its prodromal stage, the actual causes of its overactivation and exact chronology of pathological changes are not known. The present study provides a comparison of the NLRP1 inflammasome activation in the hippocampal formation (HF) of autopsy samples from AD and healthy controls (HC).

2. Materials and Methods

2.1. Human Brain Tissue Autopsy Samples

Archival human postmortem brain samples from 9 AD and 11 cognitively HC cases were selected from the Huddinge Brain Bank (Huddinge University Hospital, Stockholm). This tissue was chosen because of the extensive neuropathological characterization. The demographic data on the AD and control groups are shown in Table 1. The clinical diagnosis of AD was based on combined DSM-IV and NINCDS-ADRDA criteria [43], while the final neuropathological diagnosis was based on CERAD criteria [44]. All subjects in the control group died of non-neurological causes, and thioflavin-S, Congo red, Bielschowsky silver staining, and anti-tau immunohistochemistry showed no AD lesions nor lesions consistent with age-related changes.
Brain tissue was fixed in 4% paraformaldehyde buffered with 0.1% phosphate buffer within 24 h after death. For counting the number of neurons and NFTs, hippocampal tissue was sampled in a systematic-random manner: the left hippocampus was removed from each brain and cut in the rostrocaudal direction into 3 mm-thick blocks, with a random position for the first cut within the first rostral interval. Each block was dehydrated through a graded series of ethanol solutions, paraffin-embedded, and sectioned at 12 μm for staining. For assessment of inflammasome markers, a single random section was taken from the random block taken from the hippocampal body.

2.2. Immunohistochemical and Immunofluorescent Staining

Tissue sections were deparaffinized in xylene and rehydrated in the decreasing concentrations of ethanol (100%–twice, 96%, and 70%). Antigen retrieval was performed in a boiling citrate buffer (anhydrous citric acid solution 10 mM, pH 6), 5 times short (around 1 min) at high microwave power (700 W) and 20 min at low microwave power (300 W). Endogenous peroxidase activity was inhibited by incubating slides in 0.02% H2O2 in methanol (150 mL methanol and 50 mL water) for 30 min. Unspecific signal was blocked with 5% bovine serum albumin (BSA) + 0.5% Triton/PBS for 1 h at RT. Primary antibodies (NLRP1, Abcam, AB_776633; ASC, Invitrogen, AB_2804676; GSDMD, Cell Signaling, AB_2799099; Caspase-6, Antibodies-online, AB_2290879; IBA1, FUJIFILM Wako Shibayagi, AB_839504; CD68, Agilent, AB_2314148; HLA-DR, Agilent, AB_2313661) were diluted in blocking solution to working concentrations (NLRP1 1:100, ASC 1:100, GSDMD 1:500, caspase-6 1:100, IBA1 1:250, CD68 1:1250 and HLA-DR 1:300). After overnight incubation with primary antibodies in a humidified chamber at 4 °C, slides were incubated in the goat antirabbit or antimouse (for CD68 and HLA-DR) biotinylated secondary antibody (1:200) for 60 min (Vector Laboratories, Newark, CA, USA, AB_2336810, AB_2336811) followed by the application of the ABC complex also for 60 min at RT (Vector Laboratories, AB_2336810, AB_2336811). 3,3′-diaminobenzidine (Sigma, cat. #D0426) was used as chromogen for developing the peroxidase activity. Negative-control sections were not incubated in the primary antibodies. Sections were dehydrated before mounting in Histomount (Poly-Mount, Catalog #08381-120). Double-labeling immunofluorescence experiments were also performed. Deparaffinization, rehydration, and antigen-retrieval steps were performed as described above. Nonspecific binding was blocked with 1% BSA in 0.5% Triton/PBS for 1 h at RT. Primary antibodies (NLRP1, Abcam, AB_776633; ASC, Invitrogen, AB_2804676; Caspase-6, Antibodies-online, AB_2290879; CD68, Agilent, AB_2314148; HLA-DR, Agilent, AB_2313661; AT8, Thermo Fisher, AB_223647) were diluted in blocking solution to working concentrations (NLRP1 1:100, ASC 1:100, caspase-6 1:100, CD68 1:1250, HLA-DR 1:300, and AT8 1:200). Sections were incubated at 4 °C overnight. After washing, slides were incubated in the appropriate secondary goat antirabbit or antimouse antibodies conjugated with fluorophores (AlexaFluor TM AF488 goat, anti-mouse IgG, Thermo Fisher Scientific, Waltham, MA, USA, AB_2534088; AlexaFluor AF488 goat, anti-rabbit IgG, Thermo Fisher Scientific, AB_2576217; AlexaFluor AF546 goat, anti-mouse IgG, Thermo Fisher Scientific, AB_2534089; AlexaFluor AF546 goat, anti-rabbit IgG, Thermo Fisher Scientific, AB_2534093) for 2 h at RT before application of TrueBlack lipofuscin Autofluorescence quencher (5 μL TrueBlack + 100 μL 70% EtOH) 45 s per sample. After washing, samples were covered with the mounting medium with 4′,6-diamidino-2-phenylindole (DAPI, Vectashield Antifade Mounting Medium with DAPI) and imaged on the confocal microscope Olympus FV3000 (Tokyo, Japan).

2.3. Analysis of Immunohistochemically Stained Sections

Quantification was performed by E.Š., who was blind to the experimental group and the identity of the cases. Tissue-section analysis and images of the slides were obtained with an Olympus BX53 microscope (Olympus, Tokyo, Japan). The total number of all immunoreactive cells in a section randomly selected prior to staining and taken from the hippocampal body and the four hippocampal subfields were analyzed (hilar region of the CA3, CA2/3, CA1, and subiculum) using Image J software (National Institutes of Health, Bethesda, MD, USA, https://imagej.nih.gov/ij/ [accessed on 16 December 2021]). The results were presented as the number of immunoreactive cells per region of interest. All three microglial markers were analyzed by E.Š., K.I., and L.L.H. Microglial markers IBA1 and HLA-DR were analyzed semiquantitatively according to the following scale: 0—immunoreactivity is not present; 1—several immunoreactive cells are present, all cells are ramified microglia; 2—moderate number of immunoreactive cells, mostly ramified, few activated cells; 3—many diffusely distributed immunoreactive cells, mostly activated; and 4—many large clusters of activated microglial cells. Microglial marker CD68 was analyzed semiquantitatively according to the following scale: 0—immunoreactivity is not present; 1—several immunoreactive cells are present; 2—moderate number of immunoreactive cells; 3—many diffusely distributed immunoreactive cells; and 4—many large clusters of immunoreactive microglial cells.

2.4. Unbiased Quantification of Neurons and Neurofibrillary Tangles

Quantification was performed by G.Š., who was blind to the experimental group and the identity of the cases. The total number of neurons and neurofibrillary tangles (NFTs) in each hippocampal subdivision was estimated in Nissl- and adjacent modified Bielschowsky-stained sections (Bielschowsky-staining modification according to Yamamoto and Hirano [45]), respectively, using the optical disector method, as described previously in detail [46]. In short, using an automated Olympus Video Stereological Analysis System (BICO, Copenhagen, Denmark) by using a low-power magnification we first delineated the subfields of the HF. Then, estimates of the reference volume of the delineated subdivisions were made using the Cavalieri principle, after correction for the shrinkage due to histological processing. For the determination of the shrinkage in the 3rd dimension, we used the value of the squared root of the previously determined areal (2-dimensional) shrinkage as a correction factor on slab thickness. The average value of shrinkage for Nissl-stained sections of HC cases was on average 18% (SD = 8.5), for AD cases 23.6% (SD = 7.2), and overall 20.8% (SD = 8.2). The average value of shrinkage for Bielschowsky-stained sections of HC cases was on average 18.1% (SD = 9), for AD cases 24.9% (SD = 8.2), and overall 21.5% (SD = 9.1). The second step was measuring the numerical density of neurons and NFTs by using the disector method [47]. An estimate of numerical density within an individual with a predetermined coefficient of error of less than 0.10 was achieved with about 100 observations per one field in one hippocampus performed in a systematic-random manner using a stepping meander path function. Assuming that all cells have one, and only one, nucleus, estimates of the number of neurons were based on counting nuclei in Nissl-stained sections at high magnification using an ×100 oil immersion objective with high numerical aperture, the appropriate superimposed counting frames of variable size (90 × 90 µm for subiculum and hilar part of the CA3 field, 60 × 60 µm for CA1 and CA2/3). The disector height was set at 10 µm. Neurons for which the clearest nuclear profiles fell within the disector volume and did not touch the left and bottom borders of the superimposed counting frames nor the superior “look-up” plane were counted, whereas NFTs were counted if characteristic silver-staining positive structures fulfilled the same criteria in modified Bielschowsky-stained sections [48]. Finally, the total numbers of neurons and NFTs were obtained by multiplying the numerical density of the particular hippocampal subdivision with its reference volume.

2.5. Statistical Analysis

Because we had a relatively small sample size in both AD and HC groups and the median value better represented the center of distribution for most of the investigated variables, we used the nonparametric Mann–Whitney U test and reported a two-tailed p-value, whereas correlations were performed using Spearman’s correlation coefficient rS and correlation test. In those cases where analyzed variables were unbiasedly estimated using the optical disector method, such as the number of neurons and the number of NFTs, and the data were normally distributed, we used Student’s t-test, and Pearson’s correlation coefficient rP, and correlation test. The level of statistical significance in all tests was set at α = 0.05. All statistical tests and graphs were made in GraphPad Prism version 9.3.1. (GraphPad Software, San Diego, CA, USA).

3. Results

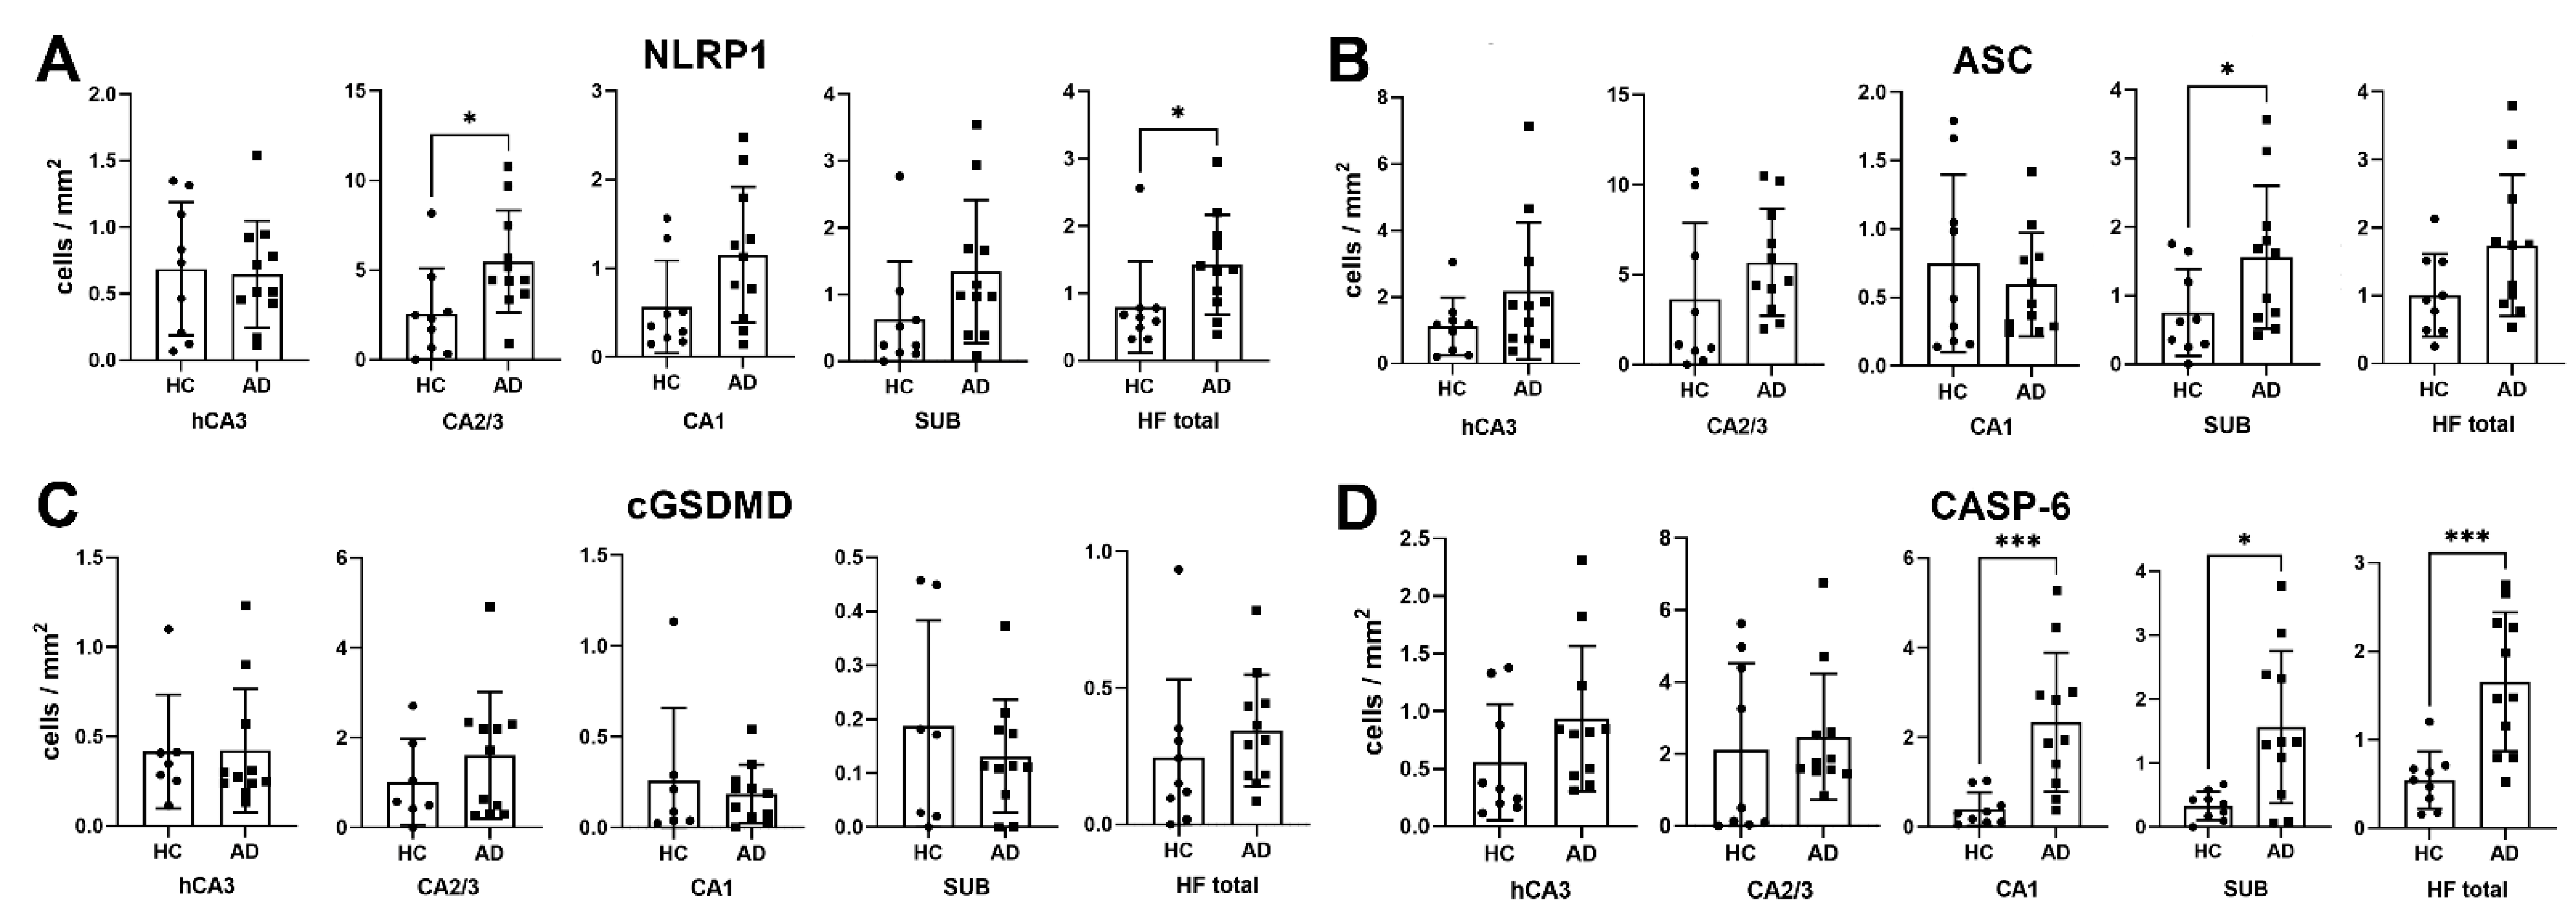
3.1. Analysis of NLRP1, ASC, cGSDMD, and Caspase-6 Immunostaining

Results of the NLRP1, ASC, cGSDMD, and CASP-6 immunostaining assessment are shown in Table 2. Compared to the HC group, NLRP1 immunoreactivity was found in the significantly greater number of the CA2/3 neurons of the AD group (p = 0.02) and also when all fields in both groups were analyzed together (HF total, p = 0.03, Figure 1A). The ASC immunoreactivity was observed in the significantly greater number of neurons in the AD group in the subiculum only (p = 0.04, Figure 1B). The cGSDMD immunoreactivity was the weakest of all markers analyzed and also not significantly different in the number of immunoreactive neurons between the HC and the AD groups in any of the HF fields (Figure 1C). The CASP-6 immunoreactivity was observed in a significantly higher number of HF neurons (p = 0.0008), especially in the CA1 (0.0005) and subiculum (p = 0.02, Figure 1D).

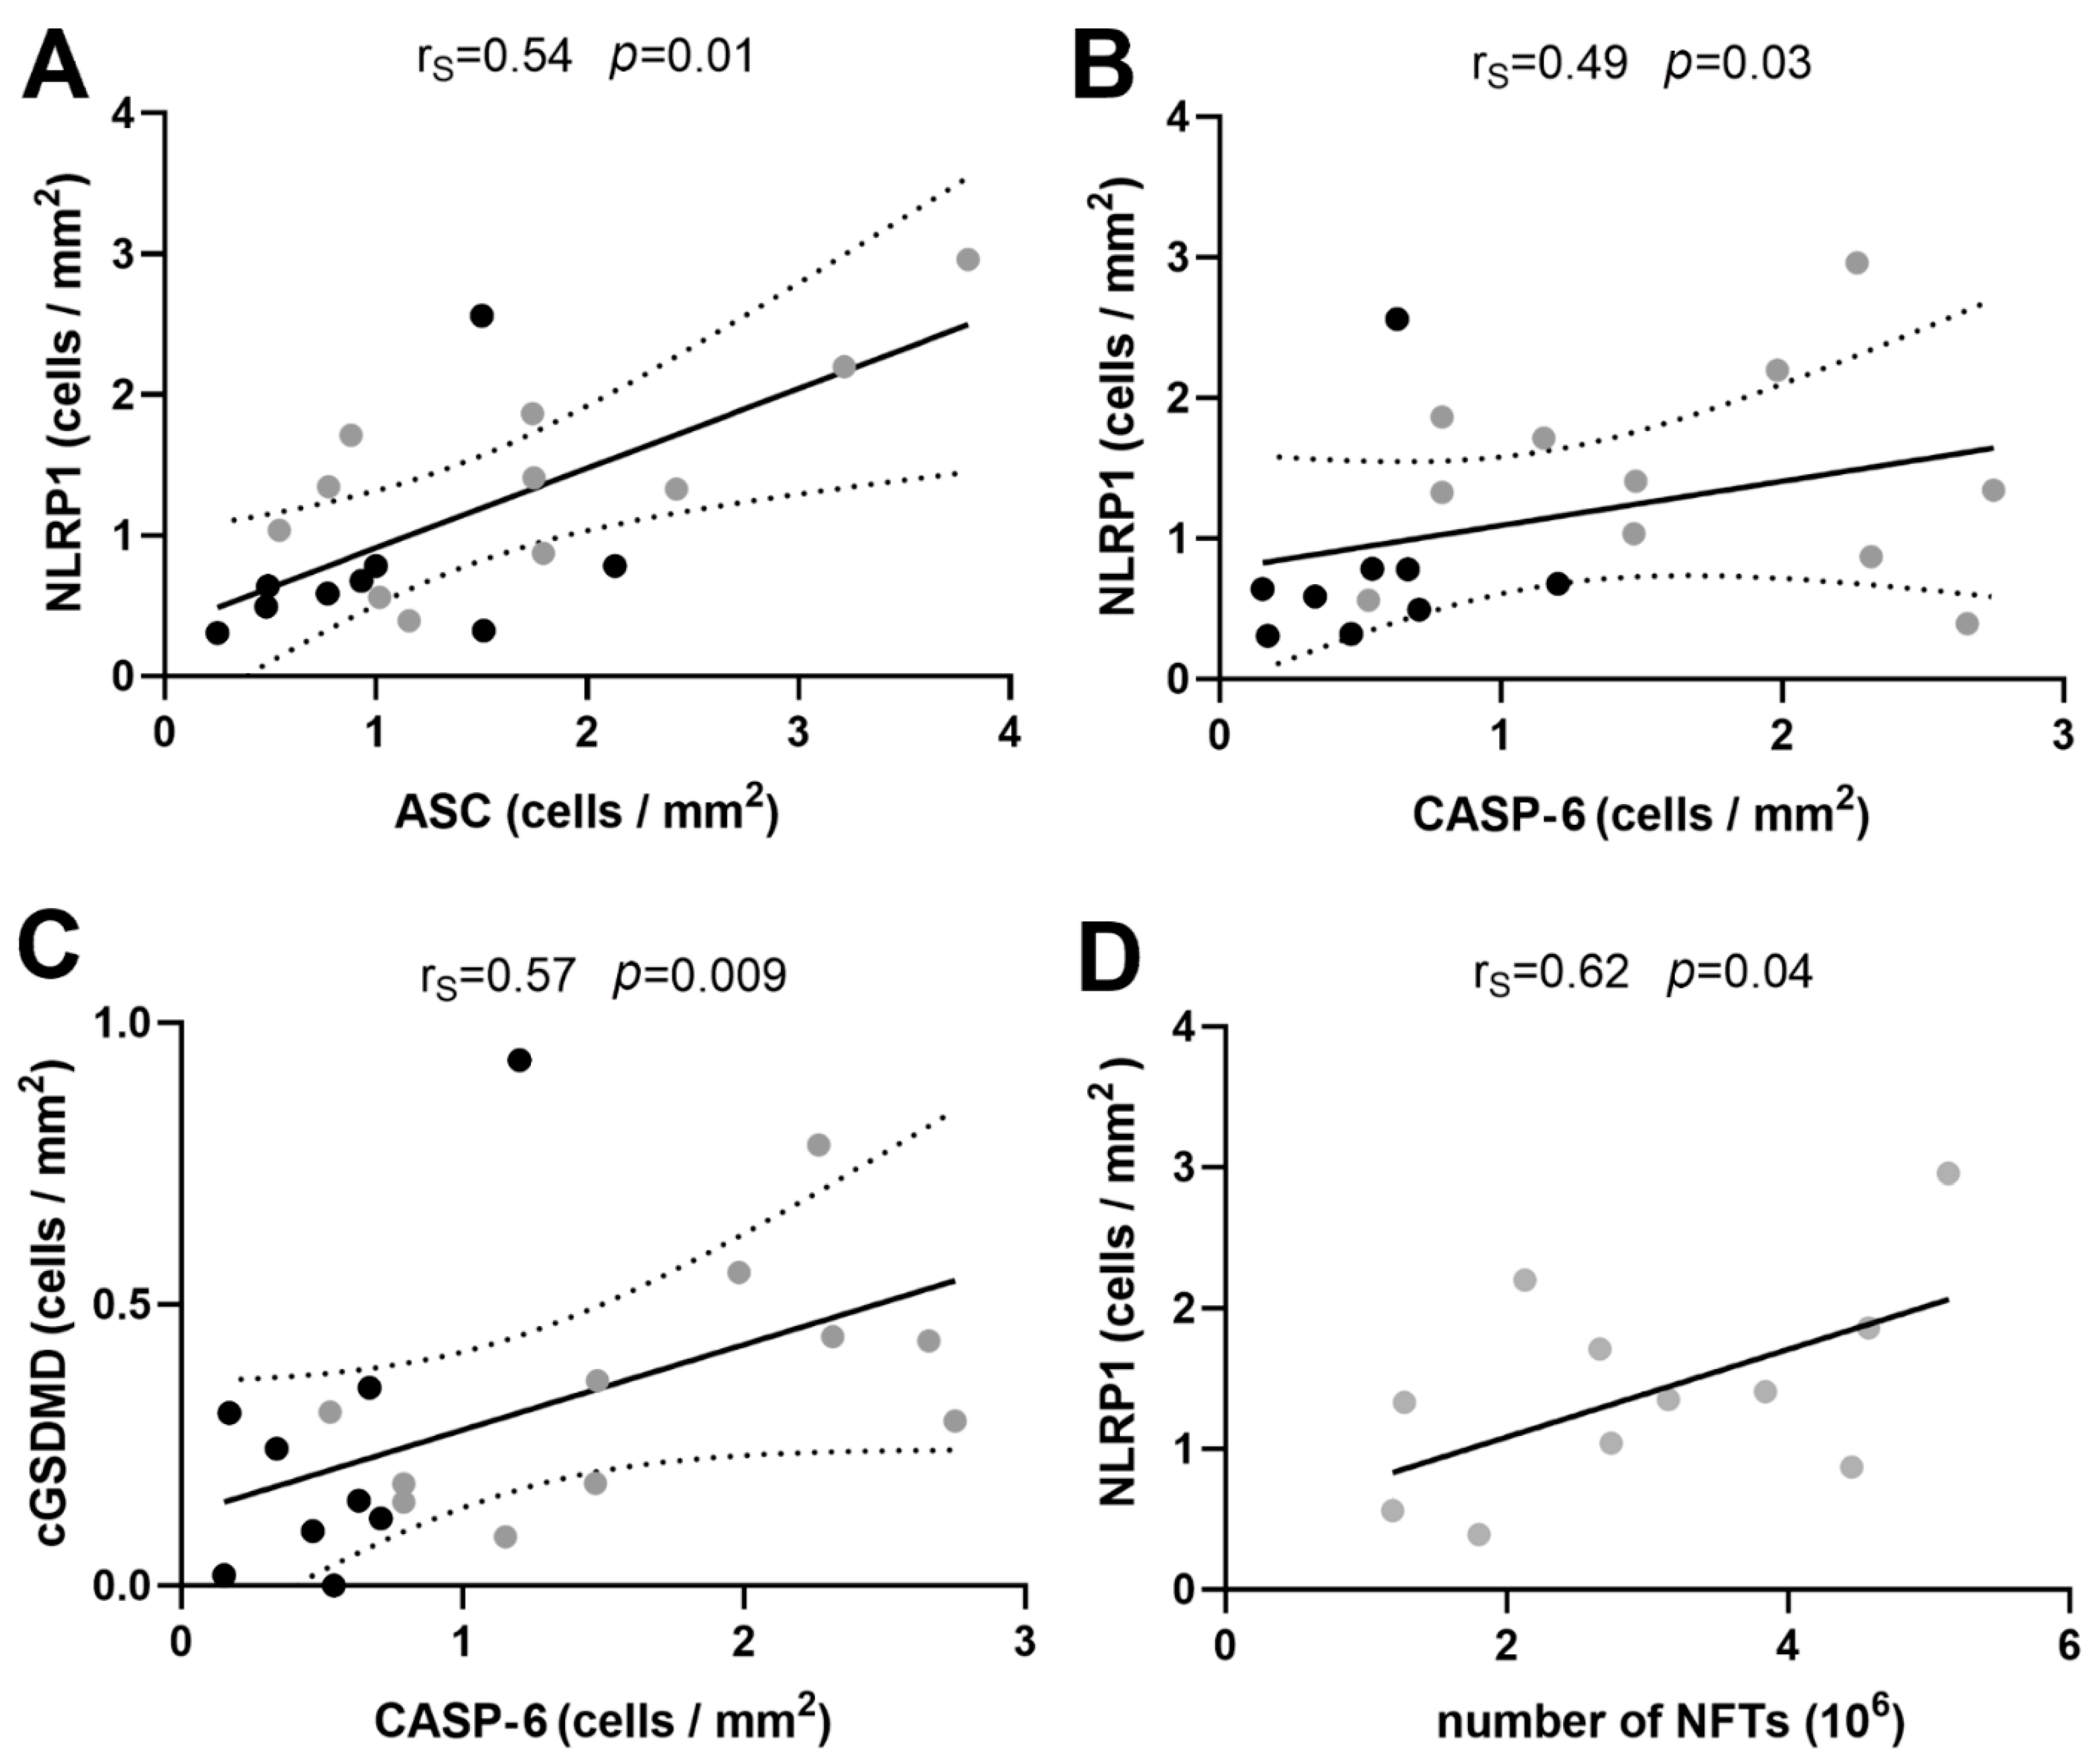
3.2. Correlations between Immunohistochemical Markers of Inflammasome Activation

We found a significantly positive correlation between the overall numbers of HF neurons immunoreactive for NLRP1 and ASC per unit of tissue (Spearman’s coefficient of correlation rS = 0.54, p = 0.01, Figure 2A) as well as between the numbers of HF neurons immunoreactive for NLRP1 and CASP-6 per unit of tissue (rS = 0.49, p = 0.03, Figure 2B). While the correlation between ASC and CASP-6 was weak (rS = 0.41) and not significant (p = 0.07) as well as the correlation between ASC and cGSDMD (rS = 0.44, p = 0.053), the correlation between the total number of CASP-6 immunoreactive neurons per squared millimeter of HF tissue significantly positively correlated with the total number of cGSDMD immunoreactive neurons (rs = 0.57, p = 0.009, Figure 2C).

3.3. Correlation of Immunohistochemical Markers with the Age of the Subjects and Duration of Disease

We correlated the immunostaining analyses of all four markers (Table 3) with the age of the subjects and the duration of AD. Neither of the markers correlated with the age of the subjects (NLRP1 rS = 0.05, p = 0.84; ASC rS = 0.14, p = 0.55; cGSDMD rS = −0.06, p = 0.79; CASP-6 rS = −0.03, p = 0.44). Likewise, no marker had a correlation with the duration of the disease (NLRP1 rS = 0.52, p = 0.1; ASC rS = 0.45, p = 0.17; cGSDMD rS = 0.42, p = 0.19; CASP-6 rS = 0.11, p = 0.76).

3.4. Correlations between NLRP1 Inflammasome, Neurofibrillary Tangles, Number of Neurons, and Disease Duration

The proportion of the number of NFTs and the number of neurons (Table 4) in the AD group was in the relatively narrow band of values (mean ± SD: hCA3 0.17 ± 0.14, CA2/3 0.22 ± 0.11, CA1 0.52 ± 0.22, subiculum 0.28 ± 0.19). Interestingly, this proportion did not correlate with the duration of the disease (hCA3 rP = −0.38, p = 0.35; CA2/3 rP = 0.2, p = 0.64; CA1 rP = 0.35, p = 0.29; subiculum rP = −0.36, p = 0.28), meaning that there might be some ‘fixed’ number of hippocampal neurons that are predisposed and will develop neurofibrillary pathology. The total number of NLRP1-immunoreactive neurons per area of hippocampal formation tissue significantly positively correlated with the total number of NFTs (Figure 2D).

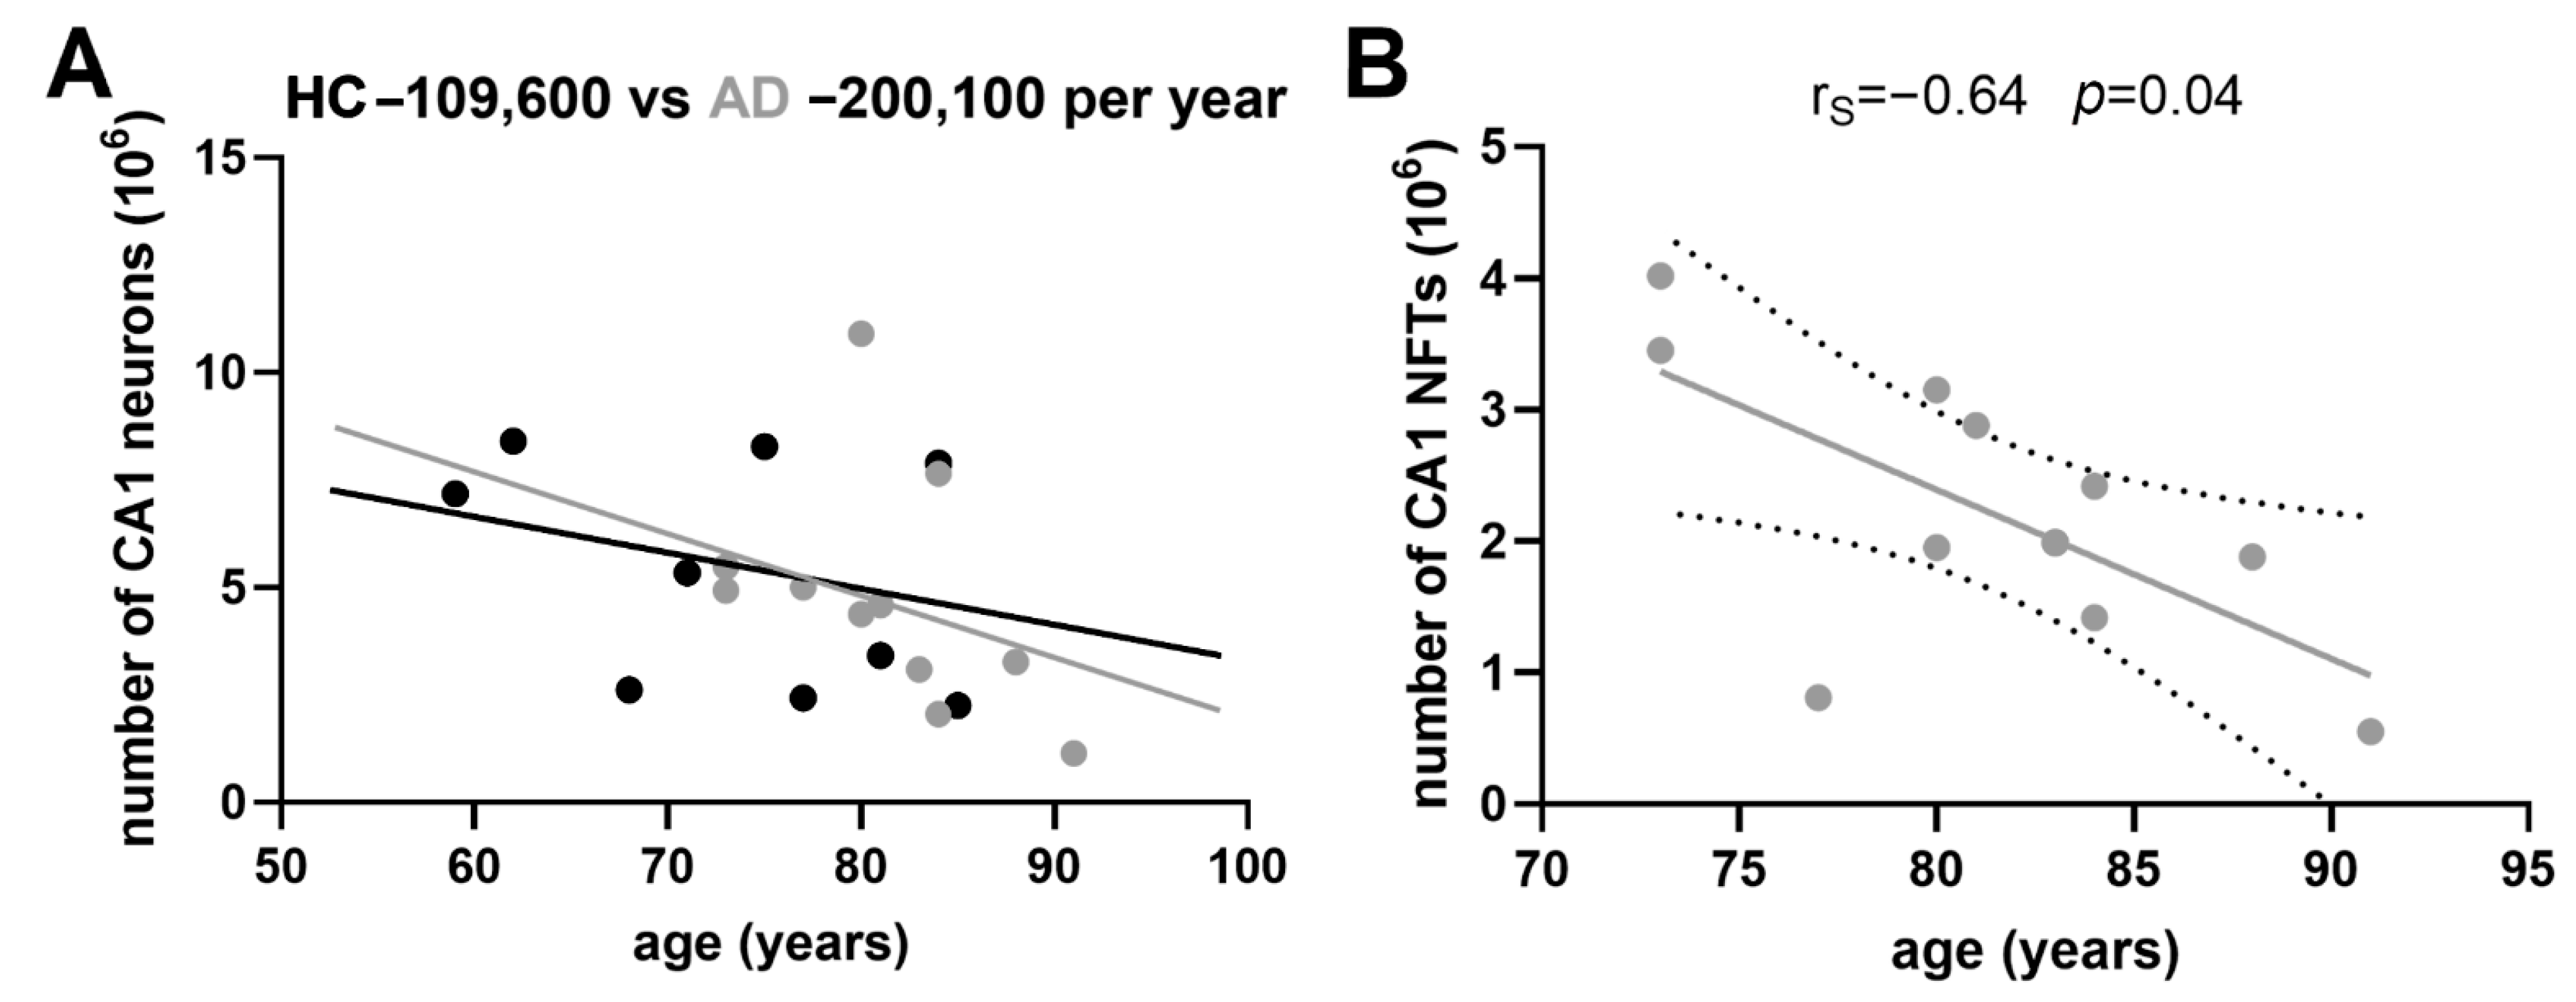
3.5. Age-Related Neuronal Loss and Number of Neurofibrillary Tangles

The slope of age-related neuronal loss was much steeper in AD patients than in HC for all the fields analyzed. The average negative difference was: −44.5 for the hCA3, −35.1 for the CA2/3 field, −90.5 for the CA1 field (−109.6 in HC vs. −200.1 in AD, Figure 3A), and −40.5 for the subiculum (all numbers are in thousands of neurons per year). The number of NFTs did not correlate with the age of AD subject in any of the HF fields analyzed (hCA3 rS = 0.33, p = 0.32; CA2/3 rS = 0.14, p = 0.67; subiculum rS = −0.16, p = 0.65), except in the CA1 field, where it significantly negatively correlated with age (rS = −0.64, p = 0.04), meaning that younger AD patients had more NFTs in the CA1 field than older ones (Figure 3B).

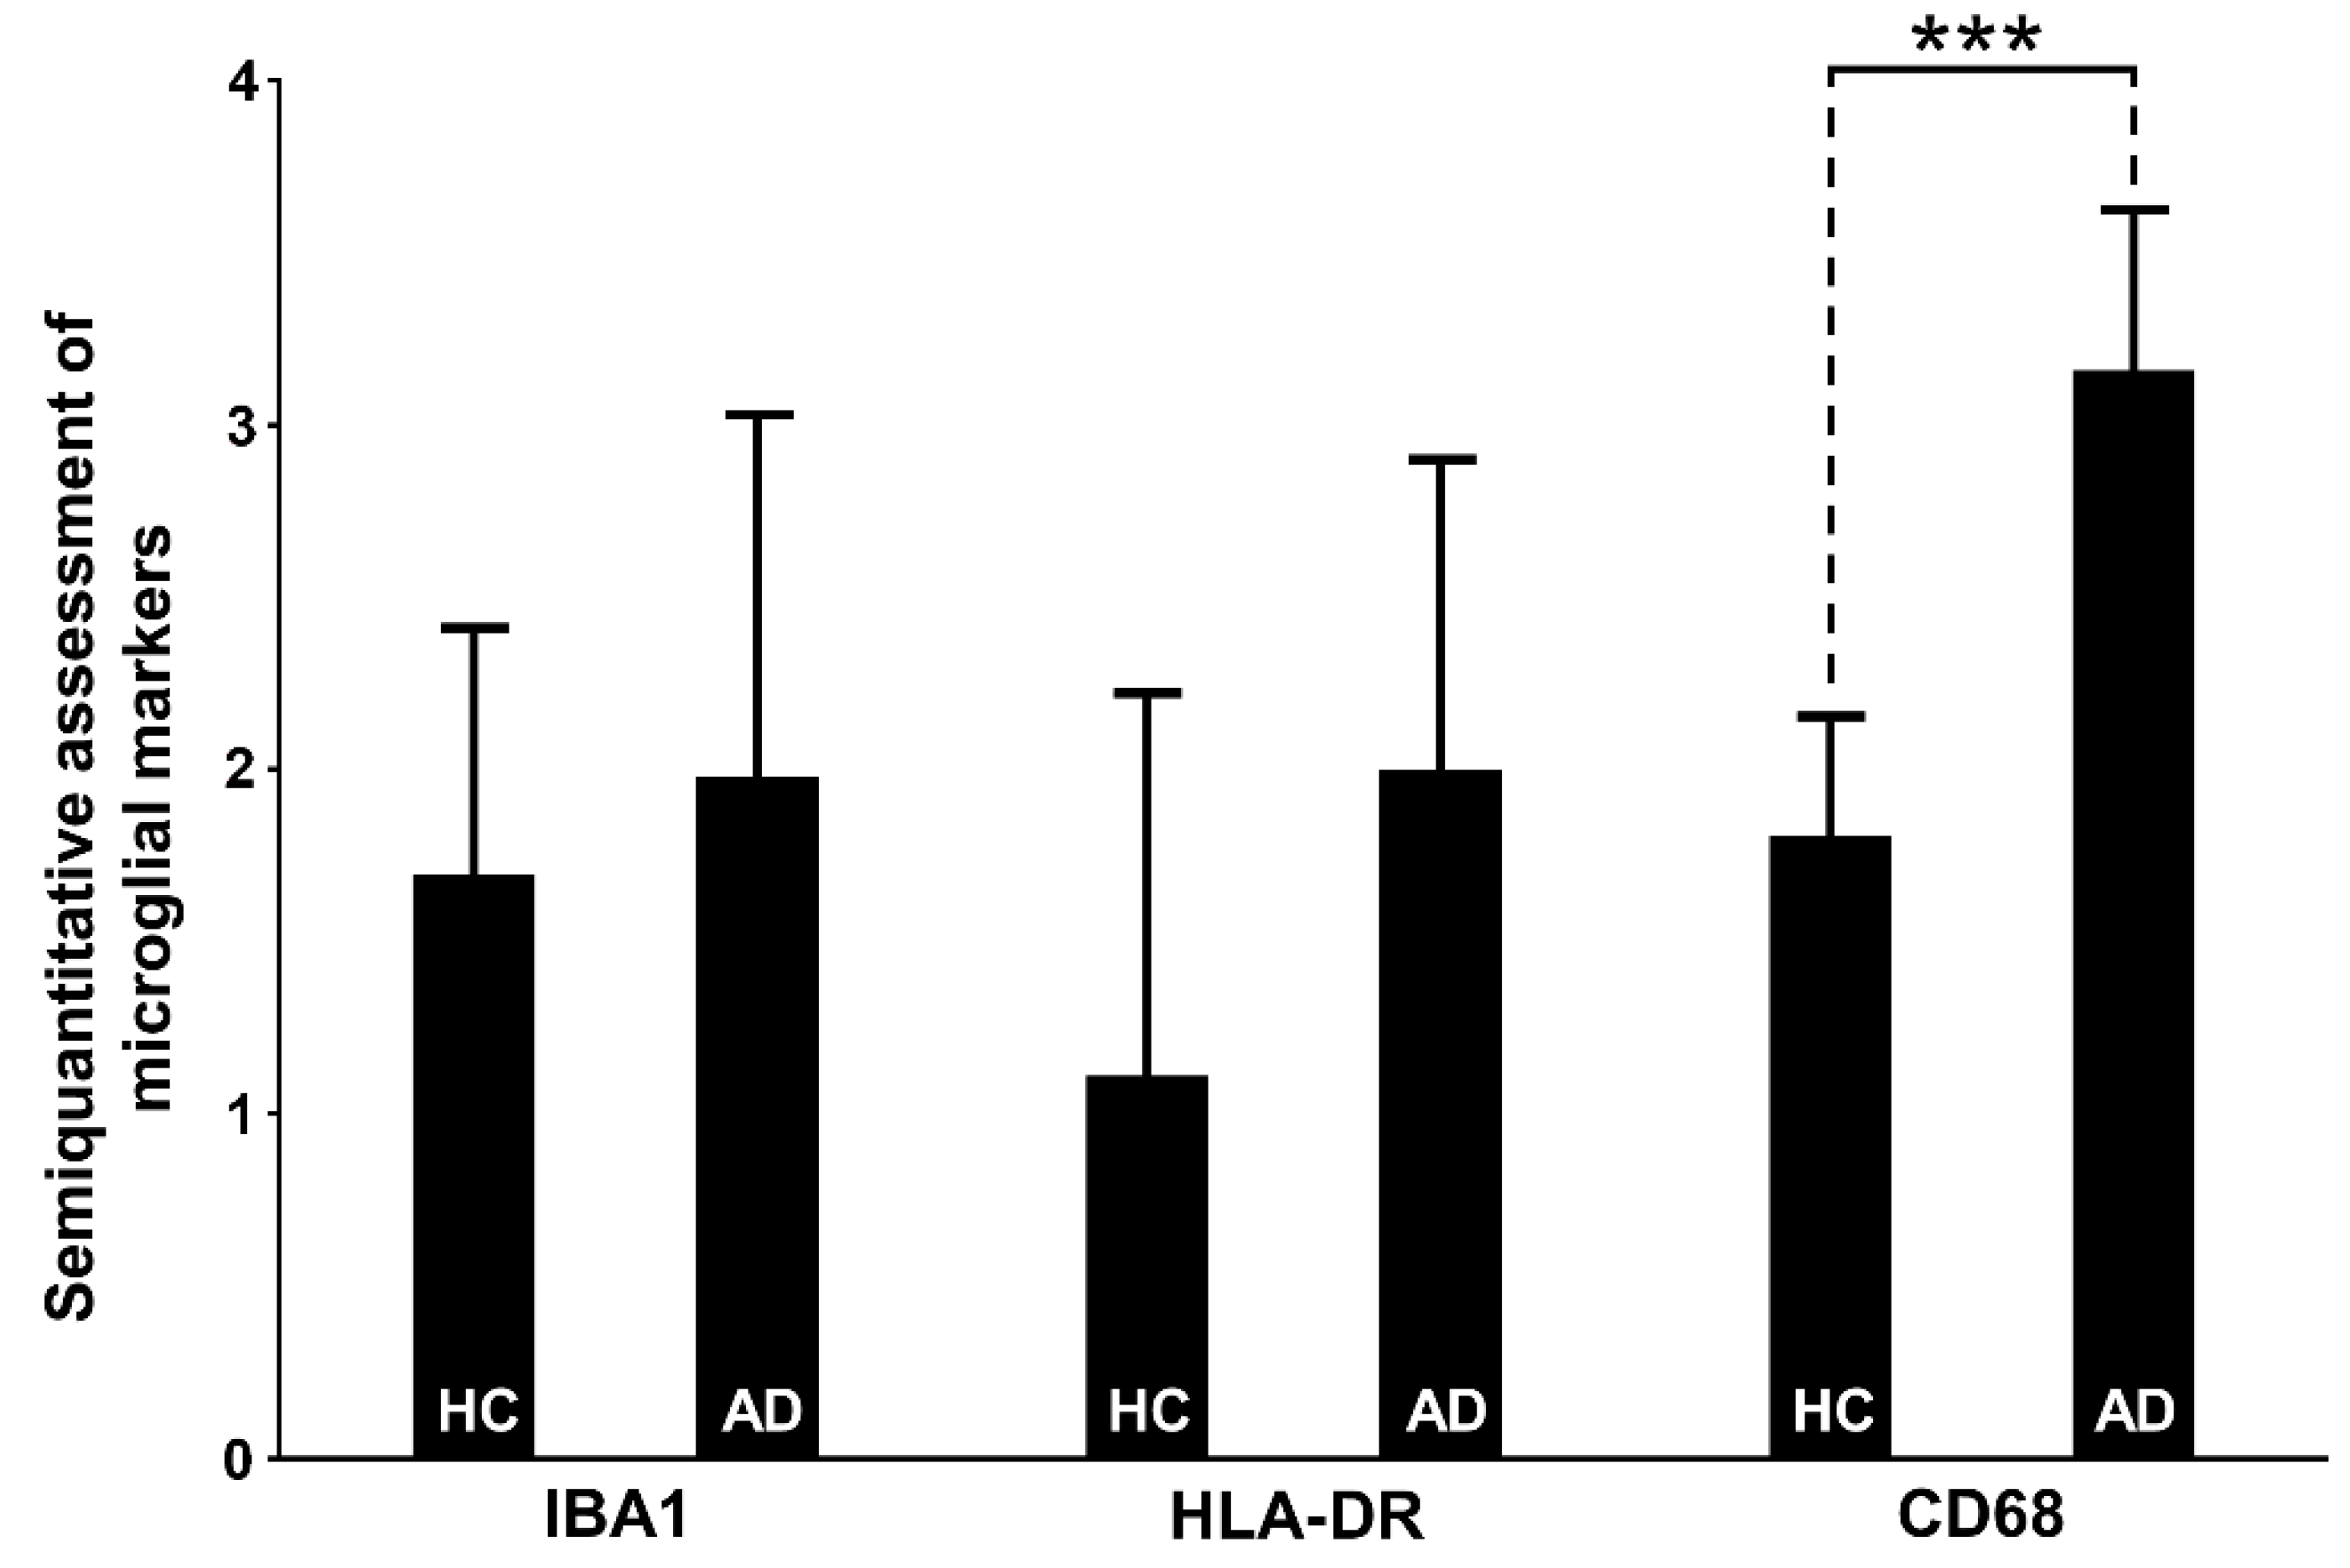
3.6. Assessment of Microglial Markers

3.6.1. IBA1

Despite the observed qualitative differences, the IBA1 marker did not show a significant difference in any of the HF fields between the AD and HC groups, nor when testing the total sum of all positive microglial cells per sample (p = 0.23; Table 5, Figure 4). However, we found that the degree of semiquantitatively-assessed expression of IBA1-expressing microglia correlated positively with the CD68-immunoreactive microglia (rS = 0.55, p = 0.02). IBA1 expression positively correlated with the NLRP1 in the subiculum (rs = 0.47, p = 0.04) and negatively with the ASC in hCA3 (r = −0.46, p = 0.04). In our samples, the IBA1 marker predominantly stained ramified microglia (Figure 5). The staining was not so intense and did not show large clusters as in the case of CD68 or HLA-DR. Only exceptionally, the irregularly ramified, ameboid microglial cells were stained with IBA1. In the HC group, IBA1 was most pronounced in the hCA3, whereas in the AD group the greatest number of IBA11-expressing microglial cells was also found in the CA2/3. The lowest numbers of IBA1-immunopositive microglia in the HC group were found in the CA1 and subiculum, whereas the lowest values for IBA1 in AD were found in the hCA3.

3.6.2. HLA-DR

HLA-DR characteristically showed strongly activated microglial cells whose somas were irregularly thickened and of high signal intensity (Figure 6), in contrast to IBA1, which typically labels microglia with long and highly branched processes (Figure 5). Despite the trend of higher expression of HLA-DR in the AD group, the measured difference was not statistically significant (Table 5, Figure 4). The only significant quantitative difference between AD and HC was found in the CA1, where the overall number of labeled microglial cells was greater in the AD group (p = 0.003, Table 5). In both HC and AD groups analyzed together, HLA-DR immunoreactivity was correlated with the CD68 labeling in the CA1 and subiculum. While HC had a higher number of HLA-DR-immunopositive microglial cells in the subiculum and CA2/3, the AD cases had more HLA-DR-expressing microglial cells in the CA1 followed by the subiculum, and the lowest number in CA2/3 (Table 5). The most significant correlation of HLA-DR expression was with CASP-6 expression in the CA1 field (rS = 0.62, p = 0.004, Table 2).

3.6.3. CD68

For CD68, we used the same 0-4 semiquantitative scale, but as CD68 is not a suitable marker for the morphological characterization of microglia, this time with slightly different descriptions. Essentially, in our samples, CD68 was seen predominantly as a diffusely distributed pointing signal or in a form of clusters, and we assessed the apparent local density of those typical clusters of punctate immunoreactivity patterns that reflect strong microglial activation (Figure 7). CD68 expression was significantly higher in the AD group throughout the HF (Table 5, Figure 4), and especially in CA1 and subiculum (p < 0.0001, Table 5). The highest signal in the AD group was in the CA1 while the lowest was in the CA2/3. Contrary, in the HC group, CA2/3 and hCA3 had the highest CD68 signal, whereas CA1 was the region with the lowest signal intensity. CD68 labeling was correlated with IBA1 in the CA2/3, and with HLA-DR in the CA1 and subiculum. CD68 expression was also positively correlated with NLRP1 (rS = 0.45, p = 0.04) and CASP-6 (rS = 0.76, p = 0.0001) in the CA1, and with NLRP1 (rS = 0.61, p = 0.004), CASP-6 (rS = 0.65, p = 0.002), and ASC (rS = 0.5, p = 0.03) in the subiculum (Table 2).
None of the microglial markers (Iba 1, HLA-DR, CD68) correlated with the AD duration.

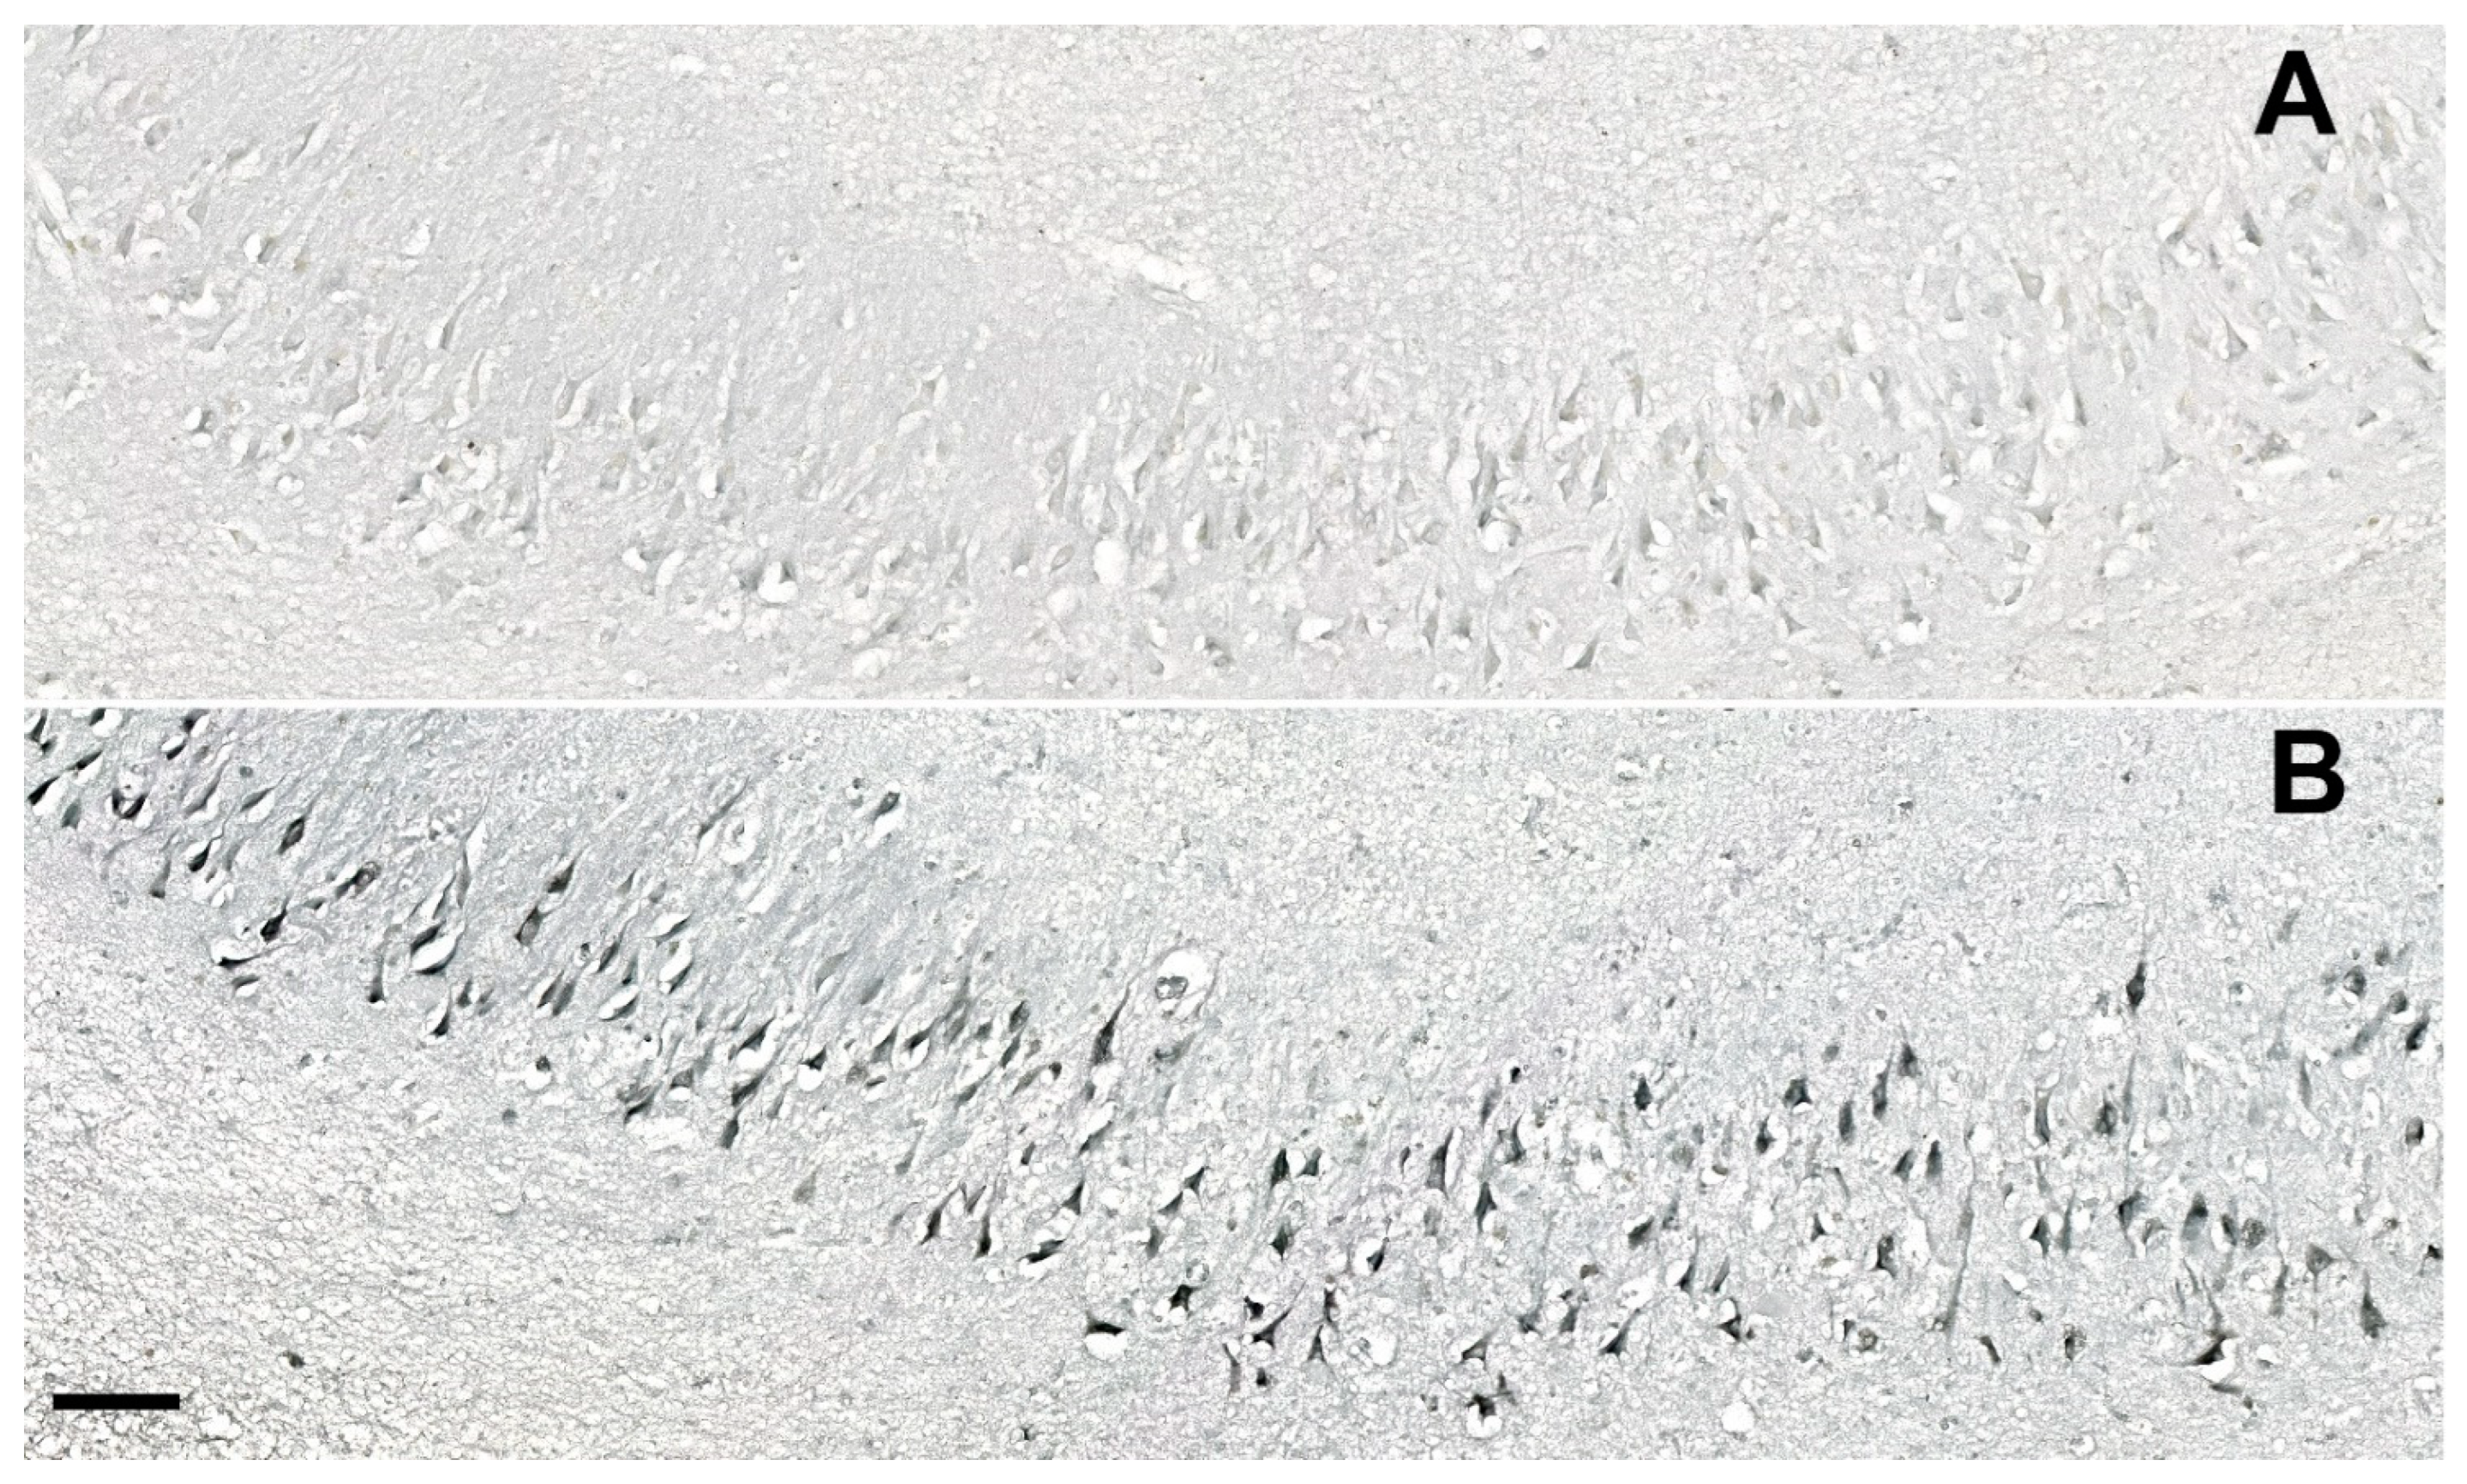
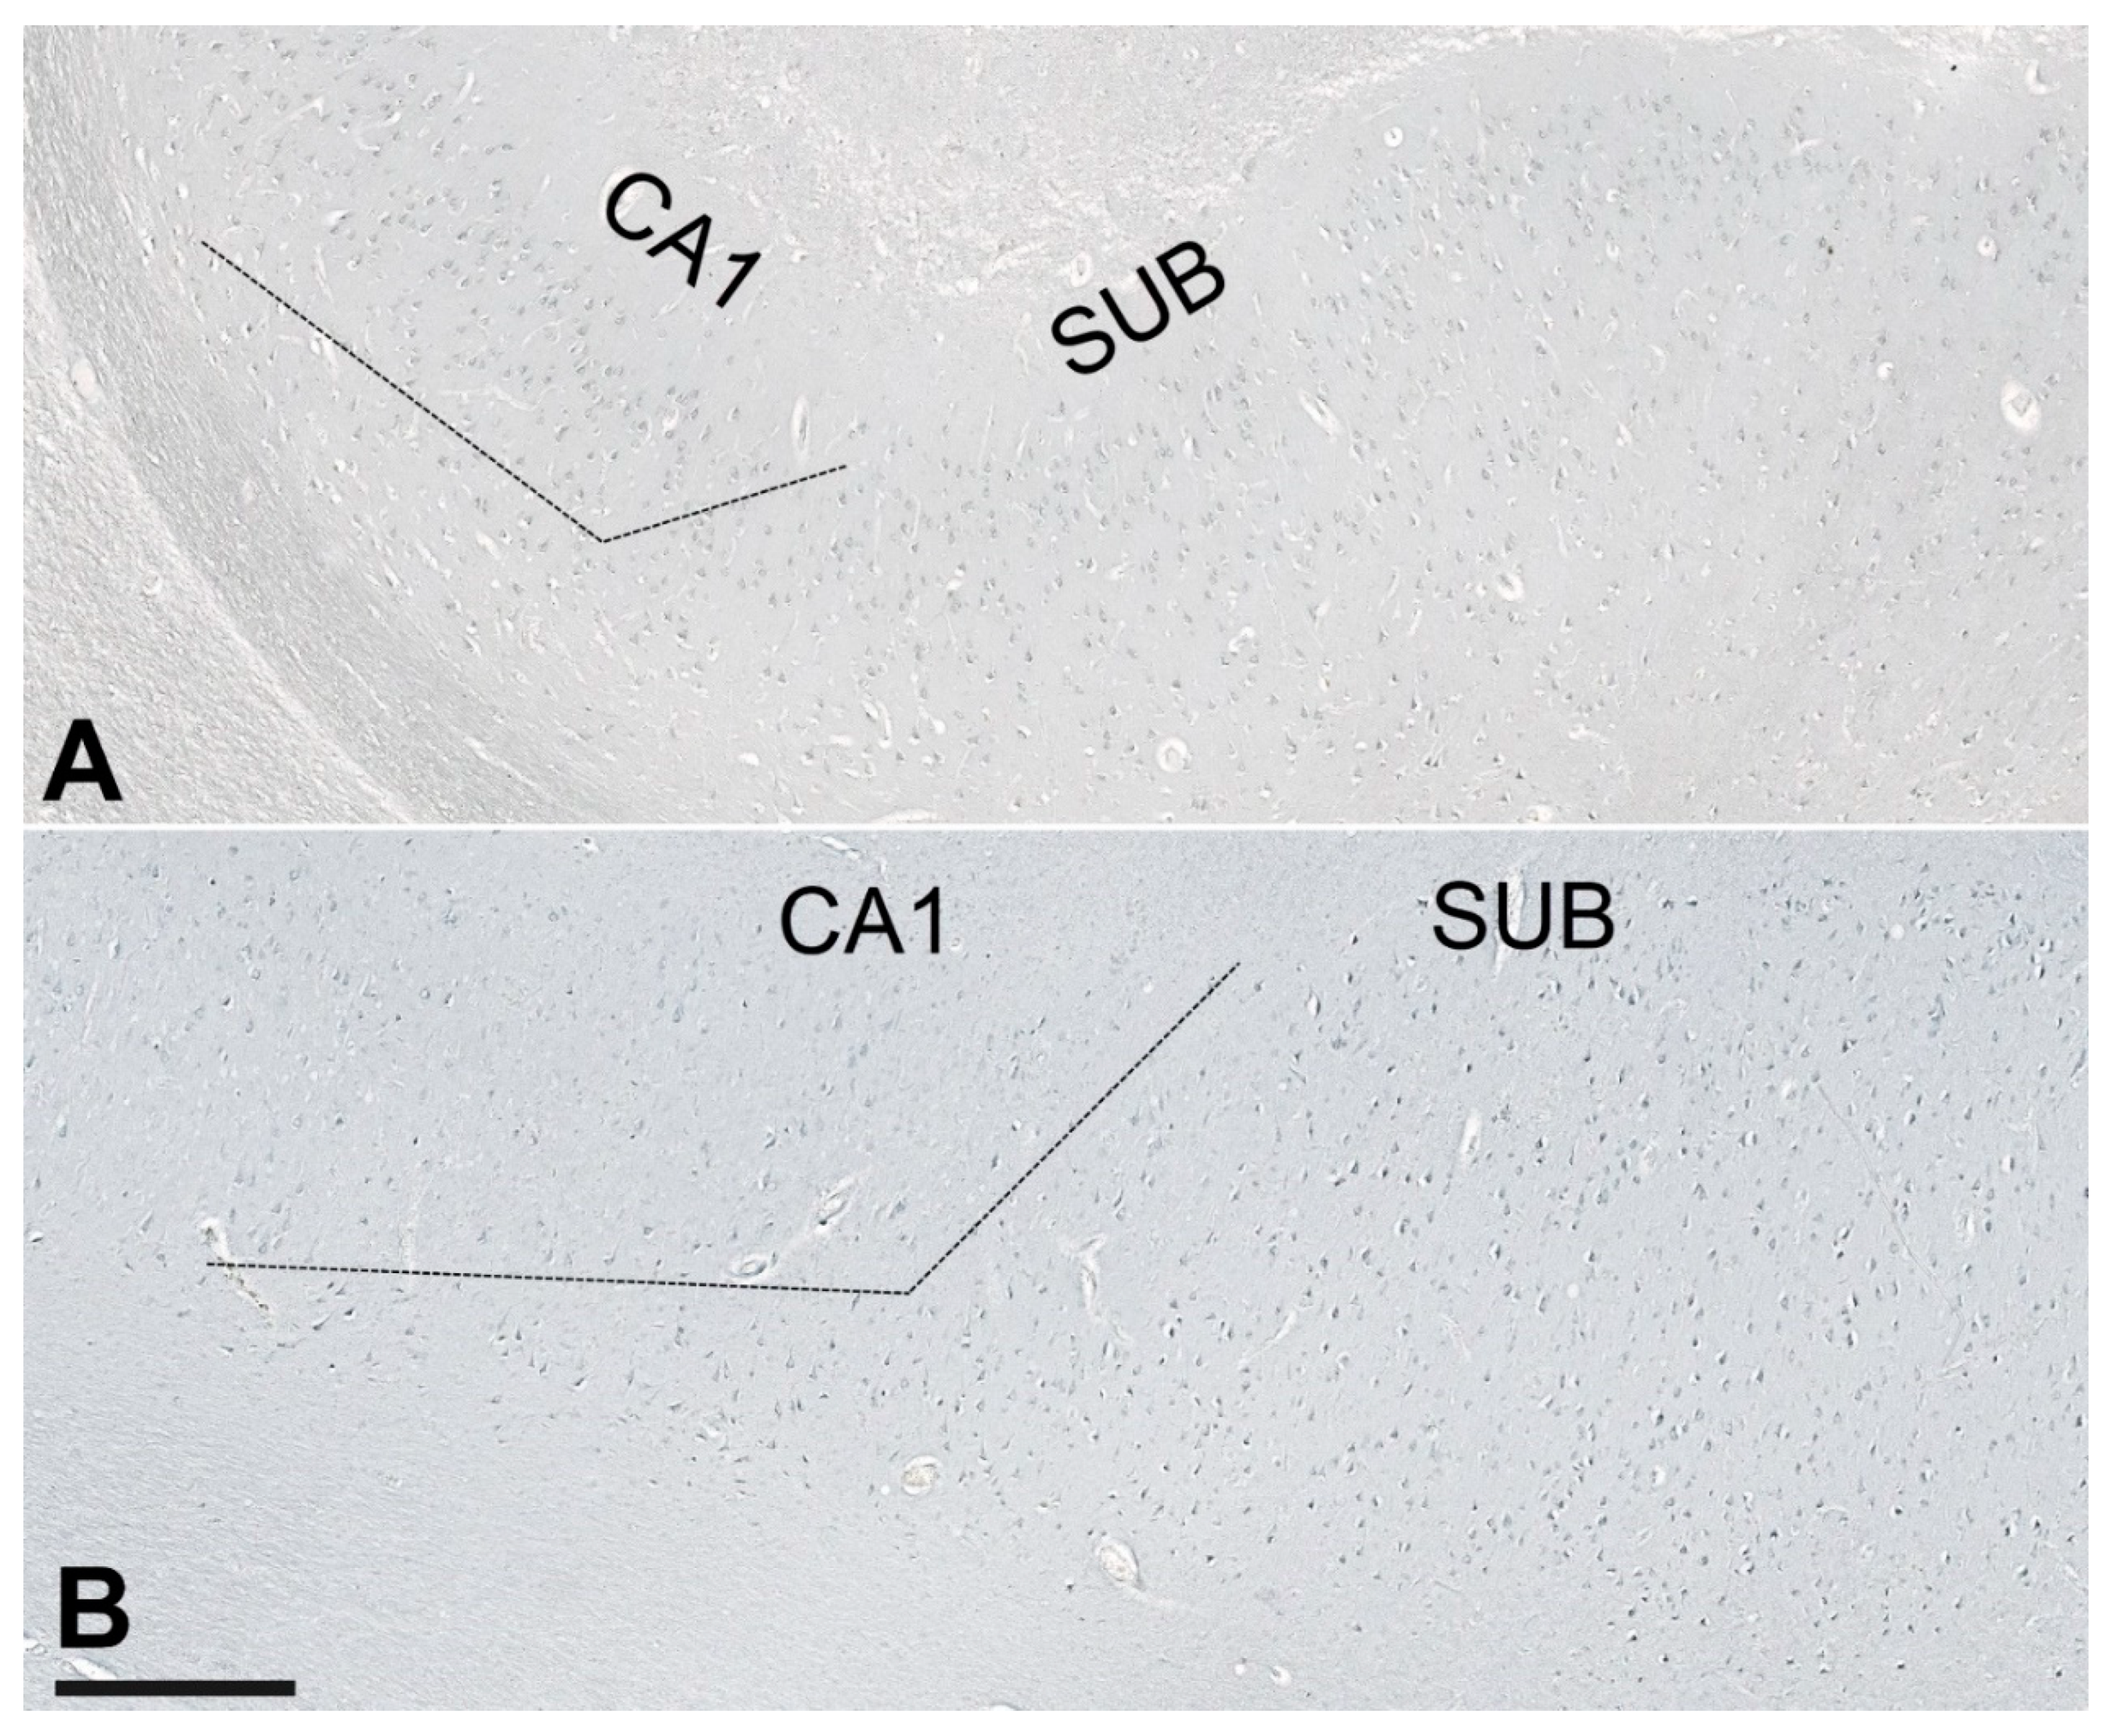
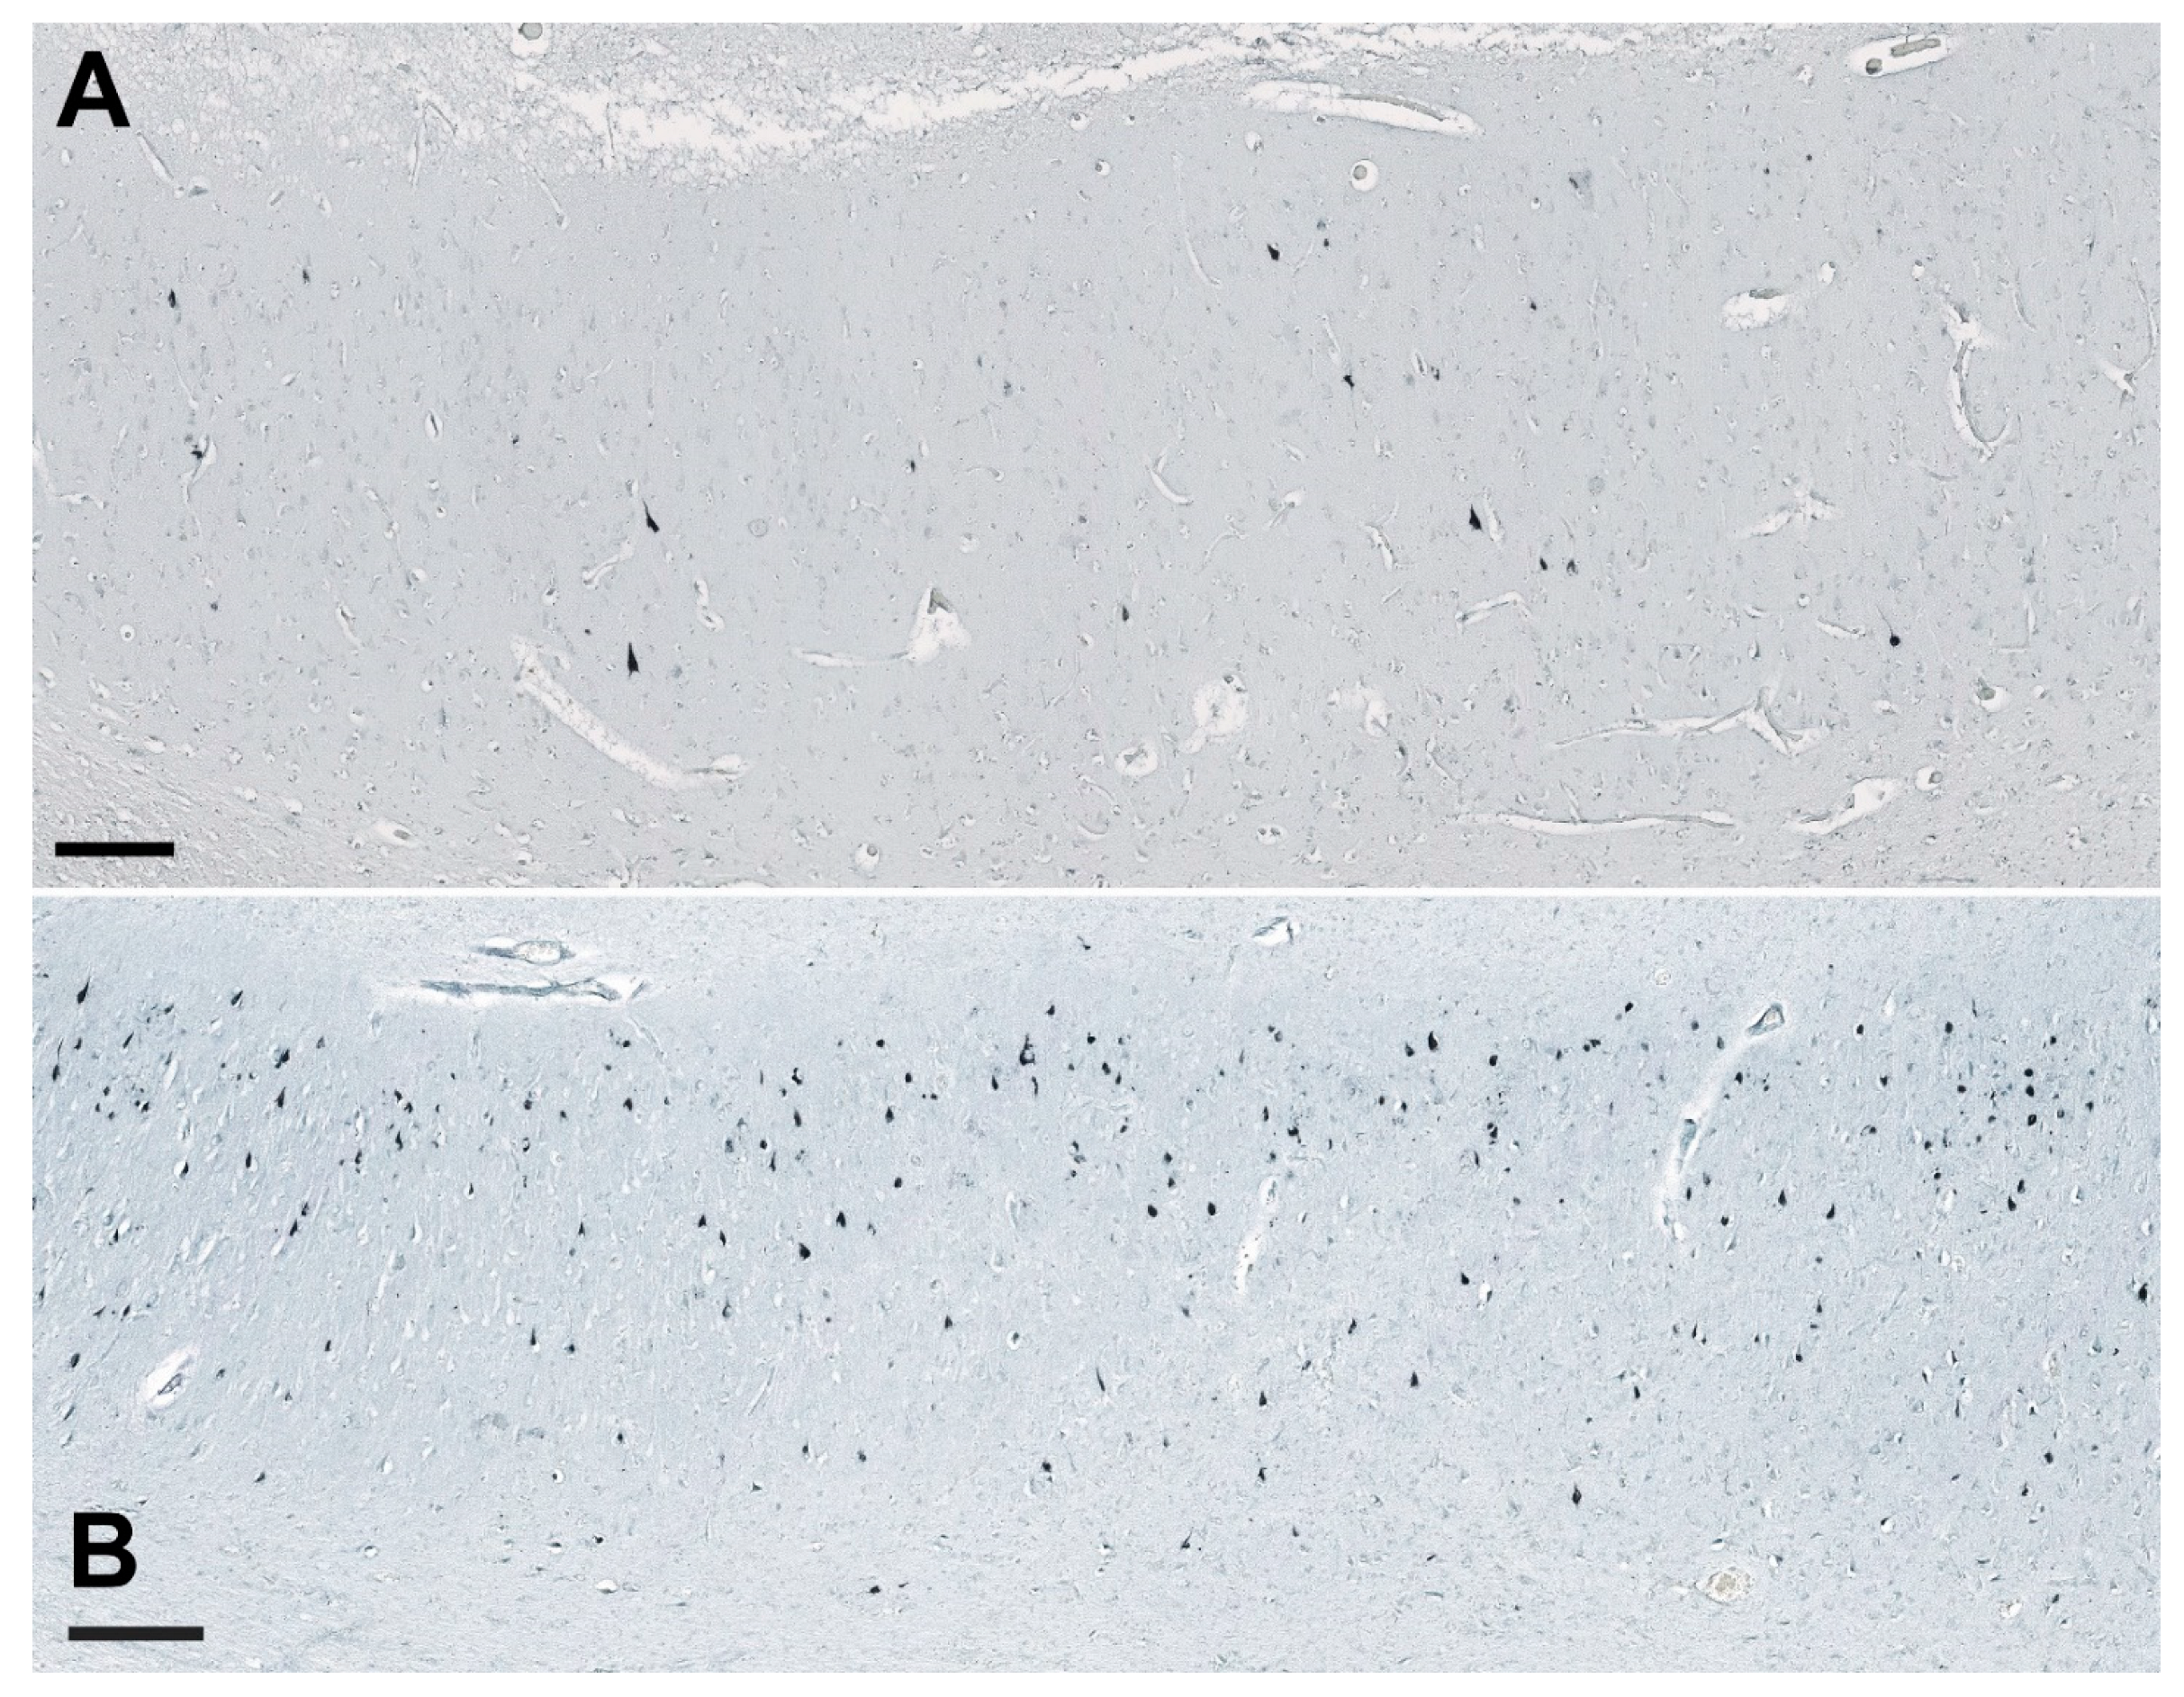
3.7. Illustrations of the Most Significant Findings

Compared to HC, the NLRP1 staining was always present in the many neurons in AD cases throughout the hippocampal formation, and especially in the CA2/3 field (Figure 8). Immunostaining of the NLRP1 in the CA2/3 field in HC (case 9) and AD (case 11) brain. The difference in the number of NLRP1-immunoreactive neurons between the HC and AD groups in the CA2/3 field was statistically significant (see Figure 1). The ASC immunohistochemical staining showed a significantly higher quantity of labeled cells in the subiculum in the AD group (Figure 9), but comparisons between the HC and AD groups in hCA3, CA2/3, and CA1 were not significant as was the hippocampal formation viewed as a whole.
The cGSDMD staining was strongest in the CA2/3 region and lowest in the subiculum, but differences among respective hippocampal fields were not significant. The strongest CASP-6 staining was found in the CA2/3 region in both HC and AD cases. A highly significant difference was found in the CA1 field, where AD cases had many more strongly CASP-6-immunoreactive neurons than HC (illustrated in Figure 10). Only rare and weakly CASP-6 immunoreactive neurons were present in the subiculum and CA1 field in the HC group.

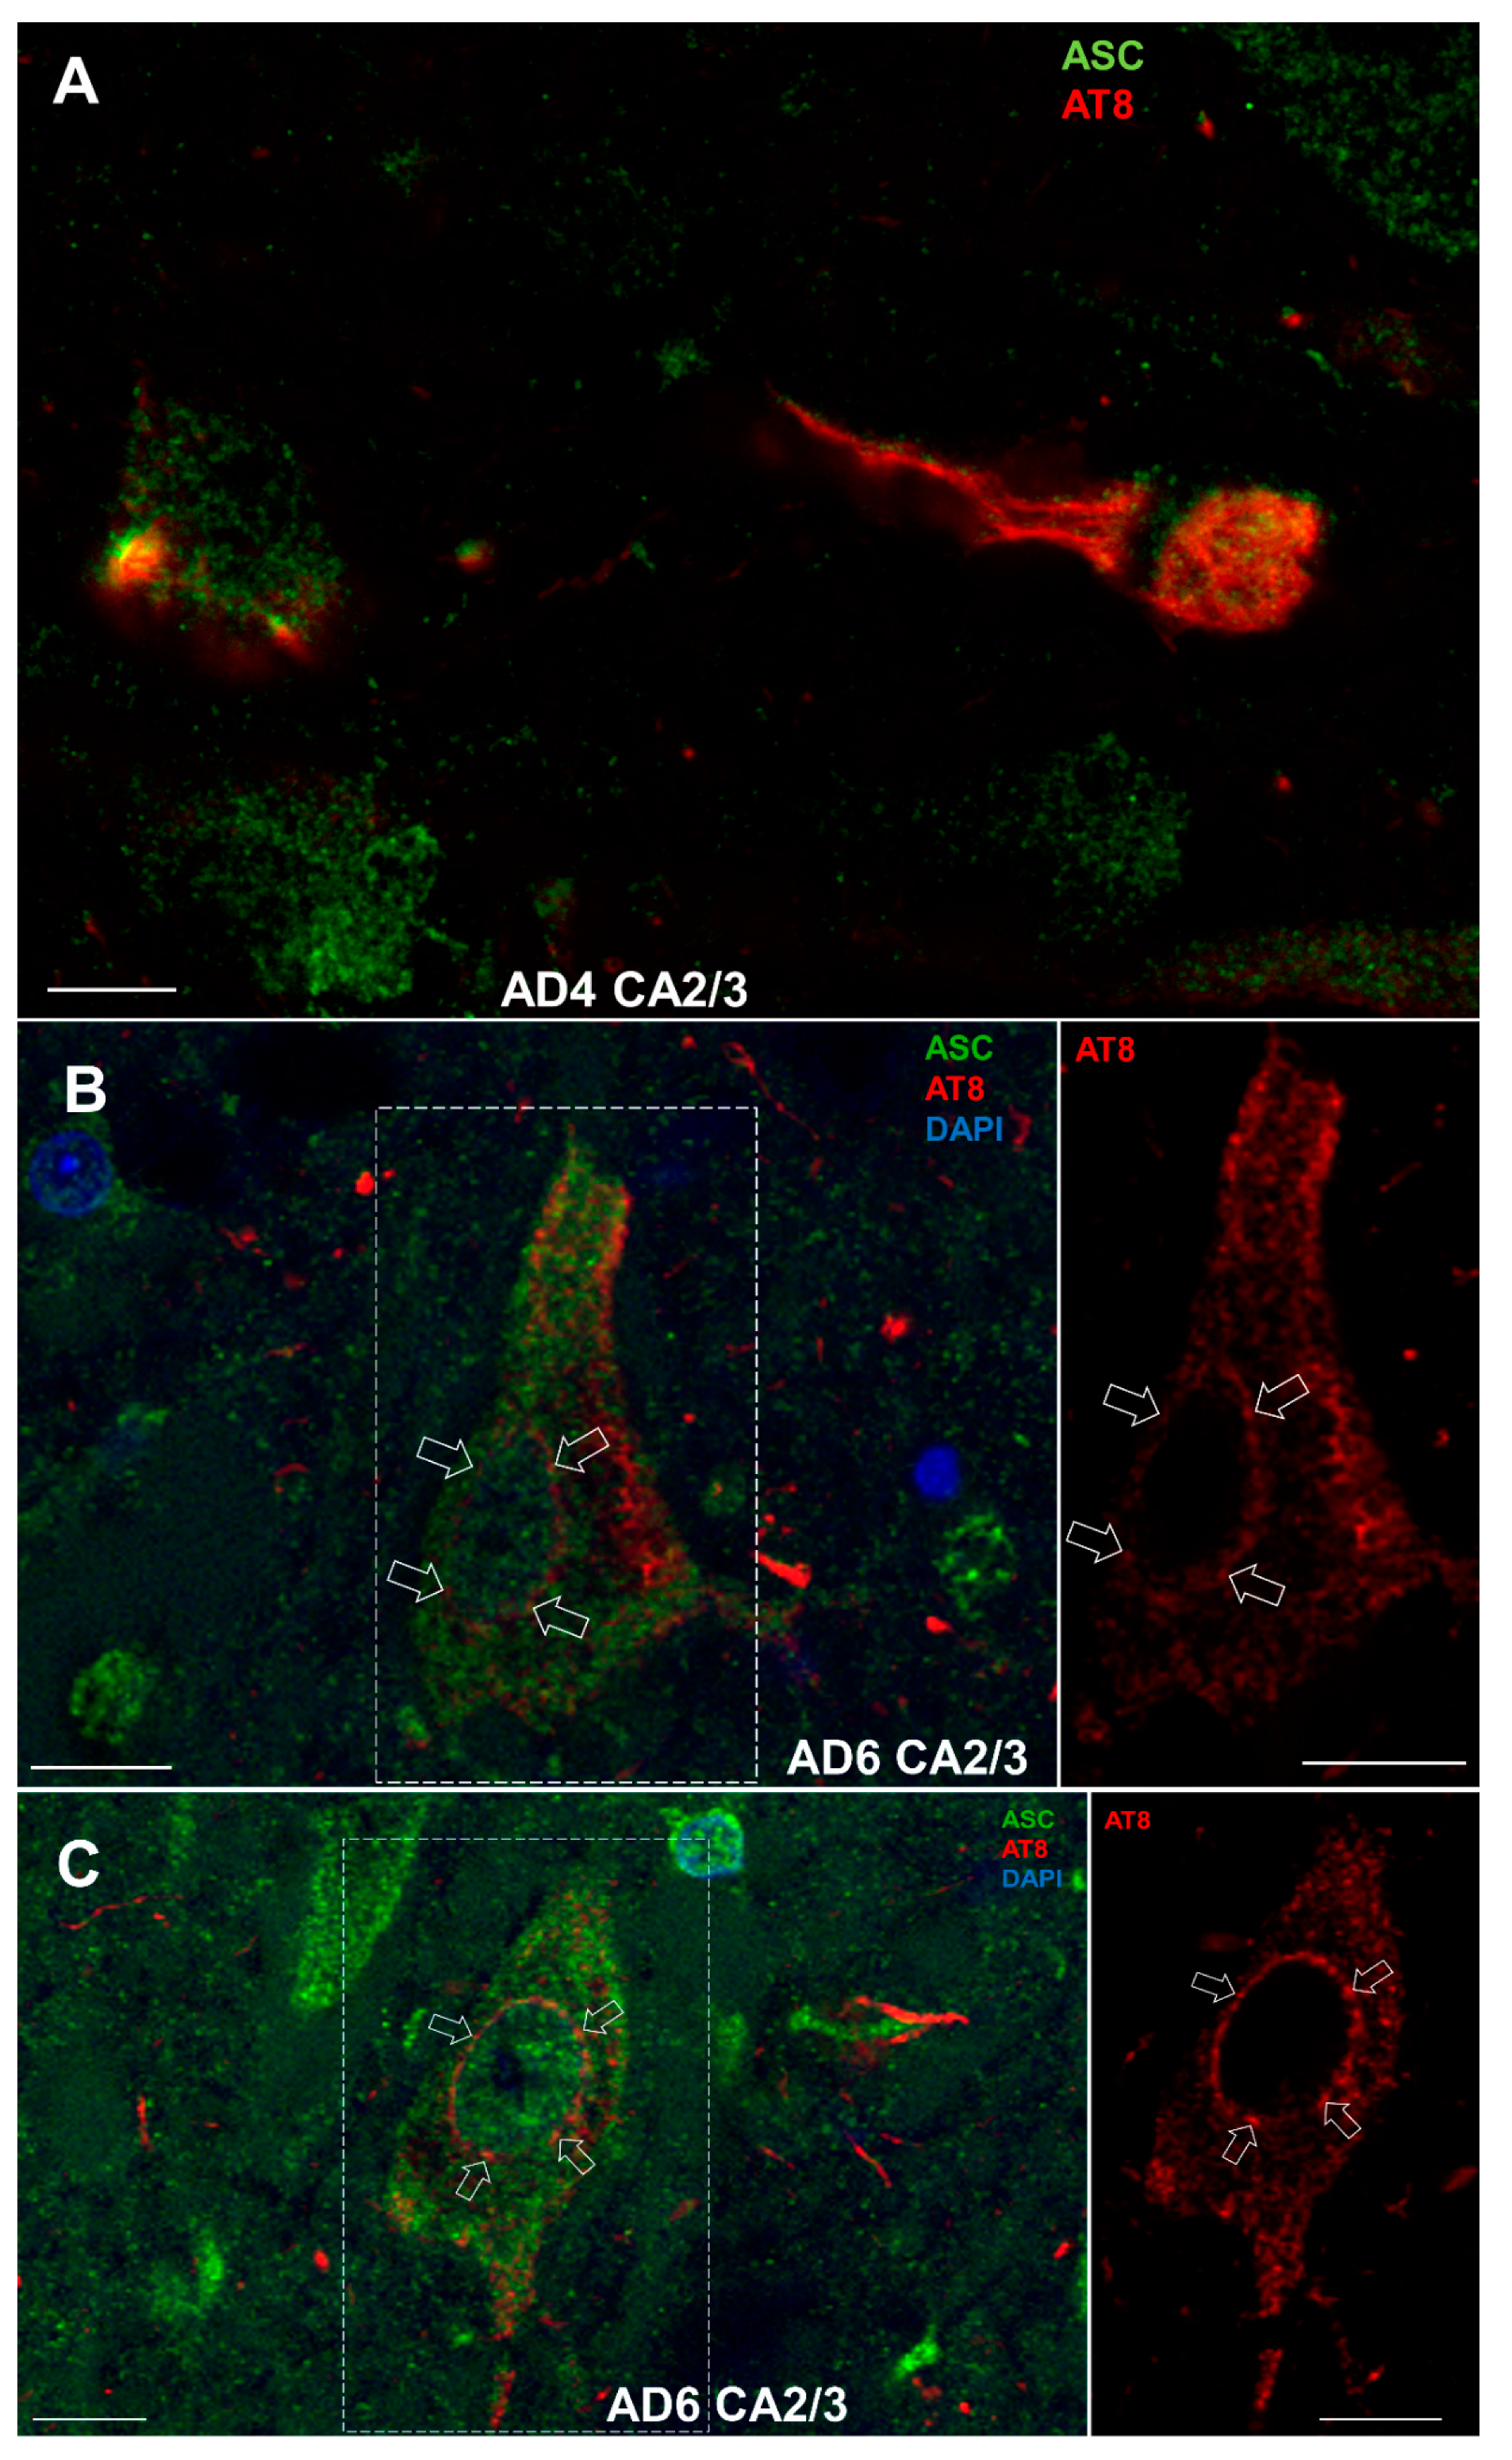
3.8. Double-Labeling Experiments

Costainings were performed for the following combinations: NLRP1 and ASC, NLRP1 and AT8, NLRP1 and CD68, NLRP1 and HLA-DR, CASP-6 and AT8, CASP-6 and CD-68, CASP-6 and HLA-DR, ASC and AT8, and ASC and HLA-DR.

3.8.1. Colocalization of NLRP1 with ASC, AT8, CD68, and HLA-DR

NLRP1 inflammasome in some neurons colocalized with ASC protein (open arrows in Figure 11A), but in some ASC, protein was present in absence of NLRP1 inflammasome (e.g., full arrow in Figure 11A). Larger and brighter ASC signals probably correspond to self-oligomerized ASC protein-forming aggregates. Such aggregates were occasionally also found in the extracellular space of AD brains (arrowheads in Figure 11A), sometimes in association with NLRP1 (double arrowheads in Figure 11A). AD brains generally showed much higher expression of NLRP1 inflammasome (Figure 11A,B) and HLA-DR-immunoreactive microglial cells (C) than healthy control brains (Figure 11D).

3.8.2. Colocalization of ASC with AT8

ASC protein very often colocalized in neurons with tau protein phosphorylated at Ser202 and Thr205 residues (AT8 epitope) (Figure 12A–C). The most striking observation was the accumulation of AT8-immunoreactive tau proteins at nuclear pores of large pyramidal neurons of the Ammon’s horn (Figure 12B,C).

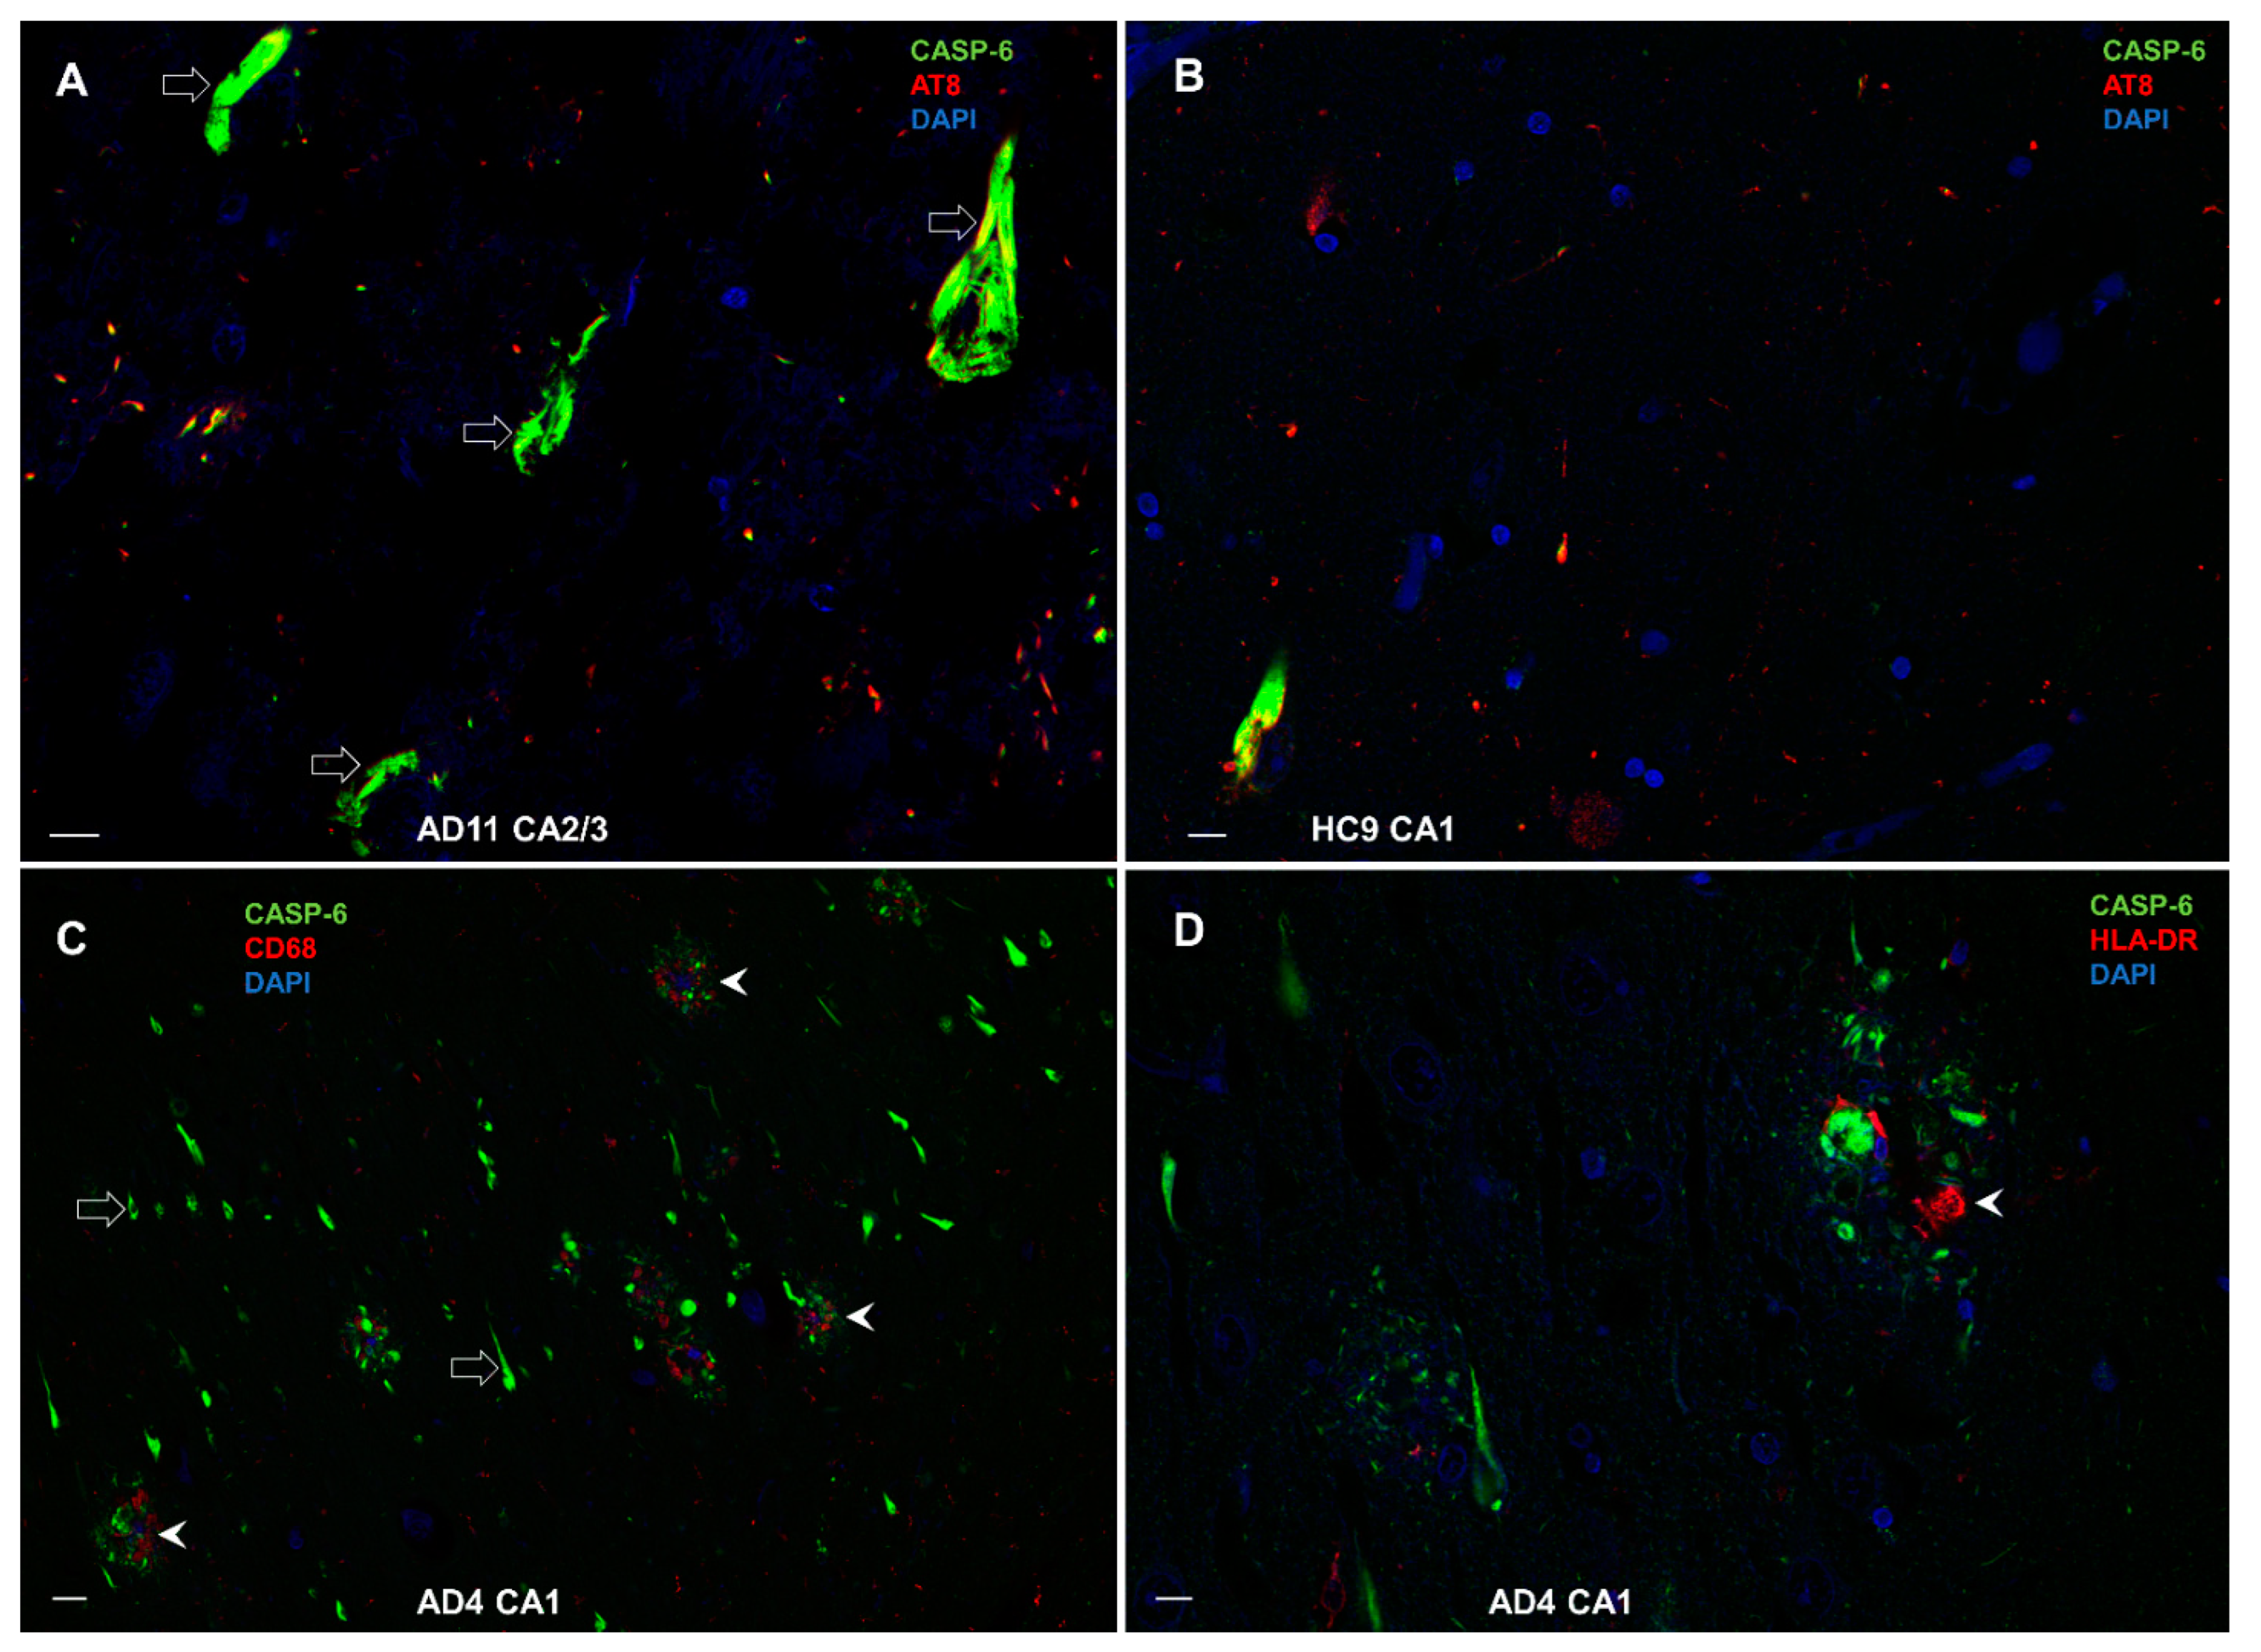
3.8.3. Colocalization of CASP-6 with AT8, CD68, and HLA-DR

We found that CASP-6 and phosphorylated tau (AT8) highly colocalize in NFT (empty arrows in Figure 13A) in the AD brain, whereas the same can be seen in the brains of HC (Figure 13B), but on rare occasions, because there the amount of NFT is significantly lower. The distribution and colocalization of CASP-6 with CD68 and HLA-DR in the AD hippocampus were mainly found close to amyloid/neuritic plaques (arrowheads in Figure 13C and Figure 13D, respectively).

4. Discussion

The best-studied and characterized inflammasome is the NLRP3 inflammasome expressed mainly in microglial cells. In contrast, the NLRP1 inflammasome is predominantly expressed in pyramidal neurons and oligodendrocytes [38]. As both neurons and microglial cells are long-lived, they are sensitive to oxidative stress and inflammatory insults. Over decades of immune surveillance and stress responses, microglial cells may become hyper-reactive. Consequently, baseline expressions of inflammatory cytokines IL-1β, TNF-α, and IL-6 increase in microglia and brain tissue with age [49]. This suggests that inflammasomes, as immune sensors of a diverse array of signals, are responsible for a global increase in neuroinflammation with age. When the Nlrp3 inflammasome is deleted, NF-kB, IL-1β, interferon, and complement pathways are significantly attenuated in old Nlrp3 knockout mice compared to wild-type aged mice, suggesting that the Nlrp3 inflammasome is an upstream target that controls age-associated neuroinflammation [50]. Microglia are sensitive to weak repeated stimuli. Their priming has been described for various inflammatory markers, including scavenger receptor CD68. Consequently, microglia may express many macrophage-associated markers, such as CD11b, CD14, CX3C chemokine receptor 1, IBA1, and others, and generate a high amount of NLRP3 inflammasomes and pro-inflammatory cytokines and chemokines, such as IL-1β, IL-6, IL-12, TNF-α, CCL2, CXCL10, IL-18, nitric oxide, and others [3,51]. Damage- or pathogen-associated molecules stimulate resting microglial cells via membrane-bound or vesicular (endosomal) pattern-recognition receptors such as toll-like receptors (TLR), and NOD-like receptors (NLR), triggering receptors expressed on myeloid cells (TREM), RIG-I-like receptors (RLR), and others. Numerous studies have established that Aβ and tau proteins may trigger microglial activation by changing the microglial epigenome, transcriptome, proteome, metabolome, and phenome resulting in a specific morphological and functional outcome [51]. Therefore, potential overactivation of the inflammasomes may represent an initial event in AD early pathogenesis. A special subtype of microglia, dark microglia, characterized by condensed cytoplasm and nucleoplasm and pronounced chromatin remodeling to increased oxidative stress, is rarely present in physiological conditions but is seen in high numbers during aging, chronic stress, lack of the CX3CR1 gene expression, and in transgenic APP/PS1 mice [52]. It is more active than normal microglia and expresses IBA1, CD11b as well as the TREM2 receptor in the presence of Aβ. To maintain control of microglial activation, neurons produce several immunomodulatory molecules that interact with microglia. These include membrane glycoprotein CD200, fractalkine ligand CX3CL1, as well as various neurotrophins and other molecules. The investigation of the NLRP1 inflammasome gains even more importance when knowing that NLRP1 gene variants are associated with AD [28], whereas its silencing improves cognitive abilities and has a protective effect on neurons in animal models of AD [30,39,40,41,42]. In this study, we focused on the NLRP1 inflammasome, which had not been thoroughly analyzed before in AD, and to further assess the possible role of the inflammasome in AD.

4.1. NLRP1 and ASC Immunoreactivity

Our results demonstrate that NLRP1 and ASC protein immunoreactivity are significantly higher in many more neurons in the AD hippocampus compared to controls, for NLRP1 especially in the CA2/3 field and for ASC especially in the subiculum. The reason for the strong NLRP1 activation in the AD brain is not known. It is possible that natural pathogen-derived effectors such as viral proteases, which can cleave human NLRP1 within a rapidly evolving region of the protein, lead to host-specific and virus-specific activation of the NLRP1 inflammasome [53]. Even in the case of eventual viral demise, the activated inflammasomes may be involved in later neurodegenerative changes. Other possibilities include direct or indirect activation of NLRP1 inflammasome due to cell stress caused by the AD pathological changes [23,30], predisposition given by certain gene polymorphisms [28], and prior activation of NLRP3 inflammasome in microglia [33]. One of the latest reports demonstrated that trazodone, an antidepressant with hypnotic efficacy in dementia, can reduce disease-related cellular pathways, including the NLRP3 inflammasome expression, and improve memory and sleep in male rTg4510 mice with a tauopathy-like phenotype [54].
Compared to ASC, our results show that NLRP1 immunostaining in the AD group is much stronger, possibly as the result of different NLRP1 activation pathways being involved. NLRP1 could activate CASP-1 with or without the recruitment of ASC [55]. Through its caspase activation and recruitment domain (CARD), NLRP1 can either bind the CASP-1 molecule directly, or in presence of ASC, exacerbate and amplify the activation of the CASP-1 [55]. As such, not every activated NLRP1 inflammasome involves ASC, explaining the observed differences in NLRP1 and ASC immunostaining. NLRP1 and ASC’s presence is correlated with their simultaneous involvement in the NLRP1 activation process. These observations are supported by studies in animal and in vitro models showing elevated NLRP1 expression in the brain or within cells with AD-like pathology [11,23,30]. Comparable findings were also reported in human AD, with the subiculum having many more NLRP1-immunoreactive neurons than controls, and NLRP1 mRNA levels in the cerebral cortex in AD being higher relative to normal brains [23]. Compared to HC, NLRP1 was also much more strongly expressed in the subiculum in AD cases of our series, but—probably due to the small sample size—did not reach statistical significance. Overall, our results indicate that the NLRP1 inflammasome is likely involved in characteristic AD pathological changes, but the precise role and effects of the inflammasome activation in the development and progression of AD are complex and further investigations are needed.

4.2. Cleaved Gasdermin and Caspase-6 Immunoreactivity

In our materials, immunostaining of the cGSDMD had the weakest signal of all markers and is comparable in AD and control brains. In addition, cGSDMD expression predominates in the CA2 field. Although the CA2 field is considered resistant to neurofibrillary degeneration in aging and AD [56,57], some cases have selective neurofibrillary degeneration in CA2 with sparing of the more vulnerable CA1 field. These atypical cases are most commonly related to 4R tauopathies, such as argyrophilic grain disease [58,59] and other less common AD tauopathies [60] or cases with concomitant Lewy pathology [61]. Therefore, cleavage of the GSDMD in the hippocampal-formation neurons might be more related to general brain aging and genetic predisposition to distinct tauopathies than to AD per se. Alternatively, CASP-1 could have a higher affinity for CASP-6 in AD brains resulting in less cleavage of GSDMD. Our results contrast with previous findings of elevated GSDMD expression in AD or AD models [30,62,63,64], but these studies did not report GSDMD cleavage in the brain tissue. Moreover, most studies of neuronal pyroptosis have been performed in vitro or in animal models. Therefore, the cGSDMD signal in neurons indicates some physiological or pathophysiological change [65] but cannot be considered sufficient to confirm neuronal pyroptosis. It could, however, reflect upregulated cytokine release, because besides pyroptosis, GSDMD pores are also involved in the release of IL-1β and IL-18 [66] as well as IL-1α [67] after inflammasome activation. Levels of pro-inflammatory cytokines above the homeostatic range may contribute to the development or worsening of AD pathological changes [68]. Macrophages in culture have membrane-repairing survival mechanisms during pyroptosis, indicating that cleavage of the GSDMD does not necessarily imply that pyroptosis will occur [69], especially considering that neurons, as long-lived and terminally differentiated cells, are going through the slower process of degenerative changes [24,65,70,71,72]. The weak and regionally constrained cGSDMD signal in the AD brain, suggests that neurons in the human brain do not undergo pyroptosis as do cells of the immune system. cGSDMD presence in our study correlates with ASC and CASP-6 immunopositivity, implying the involvement in the inflammasome activation processes in the neurons. The role of GSDMD and the relationship between cytokine releasing and pyroptosis in neurons requires further investigation in human brain tissue.
Active CASP-6 immunostaining is the strongest of all markers analyzed in this study, and it is higher in the AD group compared to HC, in line with previous studies of AD brain tissues [23,25,26,71,73,74,75]. We show that neuronal CASP-6 immunoreactivity in the hippocampal formation positively correlates with the immunostaining for NLRP1 and ASC, which is congruent with its cleavage downstream of NLRP1 inflammasome activation in neurons [23]. Similar to GSDMD, CASP-6 expression in the brain in normal conditions is low. Therefore, any upregulation implies changes in the homeostatic state [76]. We document an active CASP-6 presence in the soma of hippocampal neurons. In contrast to NLRP1, ASC, and cGSDMD, whose expression is highest in the CA2/3 region, CASP-6 immunostaining is, besides CA2/3, also high in the CA1 in the AD group. The CA1 field is known to have a higher tau pathology burden [77,78,79] so we propose that because NLRP1, ASC, and cGSDMD have lower expression in the CA1 than CASP-6, they could be more active at the beginning of the pathological process, inside neurons at the early stage of neurofibrillary changes. Further, CASP-6 would also be present in later stages of AD in neurons with mature tangles. The strong CASP-6 staining in the CA1 of the AD group is compatible with the finding that higher levels of CASP-6 activity in the CA1 in aging correlate with lower cognitive performance [80].

4.3. Relationship of Inflammasome Activation with Neuron Loss, Neurofibrillary Pathology, and Other Indices of Neurodegeneration

The CA2/3 region has the highest immunoreactivity for all markers analyzed in both AD and HC groups. Whether inflammasome activation in AD is a cause or the consequence of the pathological processes remains unclear. In an earlier study, CA2/3 region neurons showed high neuronal nitric oxide synthase (nNOS) immunoreactivity and most of the neuron somata were spared from the neurofibrillary pathology [57]. Together with the data presented here, this implies that the higher production of NO and NLRP inflammasome activation are likely associated. In this context, constitutive nitric oxide synthases (nNOS, encoded by the NOS1 gene on chromosome 12; inducible iNOS, microglial NOS, encoded by the NOS2 gene on chromosome 17; and endothelial eNOS, encoded by the NOS3 gene on chromosome 7) would contribute to the NO-mediated activation of inflammasomes. Our results also indicate that while NLRP1 inflammasome can exacerbate or cause AD-related pathological changes, the CA2/3 neurons may be more resistant to NLRP1-mediated tau pathological changes. The reason for the CA2/3 neurons resistance could be related to different microglial-neuronal and vascular interactions specifically in that region [81,82,83]. Some studies reported that NO can suppress NLRP3 inflammasome activation [84,85] and it is known that higher NLRP3 inflammasome activation can impact tau protein hyperphosphorylation, aggregation, and spreading [33,86,87]. NLRP3 in the brain is predominantly expressed in microglia and if it were suppressed in the CA2/3, those microglial cells could be switched from proinflammatory to their protective/scavenging state. Interestingly, a study on the ischemic brain has shown that the numbers of active astrocytes and microglia around damaged neurons is higher in the CA2/3 than the CA1 and proposed that this enhanced efficacy for eliminating damaged neurons has a neuroprotective effect [88]. Further, CA2/3 neurons are more receptive to the protective effects of the glial cell line-derived neurotrophic factor than CA1 neurons [81]. It will be important to further investigate the interactions between microglial (NLRP3) and neuronal (NLRP1) inflammasomes.
In the present study, no inflammasome marker correlated with the age of the subjects analyzed. Even though the age range was 59 to 91 years, age-related differences in NLRP1 inflammasome activation were not observed. Although the sample size in our study is relatively small, this contrasts with a recent study in which NLRP1 activation in mouse brains was closely associated with aging-related brain changes [89]. Similarly, it has been reported that NLRP1 activation is stronger in female APP/PS1+/− mice brains with AD-like pathology [11], whereas we observed no significant correlation between any investigated marker with sex. Hence, age and sex differences in NLRP1 inflammasome activation may differ considerably among species. It can also be concluded that, as long as elderly individuals do not suffer from AD, they appear neuropathologically quite comparable as a group [77] and significant changes related to aging cannot be revealed without the inclusion of younger cases in the regressions [90].
Our results show that the total density of NLRP1-immunoreactive neurons in the HF significantly positively correlates with the total number of NFTs, suggesting that NLRP1 inflammasome activation is likely associated with tau-related pathology. This hypothesis has been already proposed based on NLRP1 and tau cleaved by CASP-6 (TauΔCasp6) co-expression in the same neurons [23]. Still, the role of the inflammasome in the development or progression of AD has yet to be fully elucidated.

4.4. Relationship of Inflammasome Activation with Microglial Markers IBA1, HLA-DR, and CD68

A partially overlapping expression of microglial markers has been reported in both normal brain tissue and disease conditions [91,92,93,94]. Our results show positive correlations of NLRP1 inflammasome with microglial IBA1 expression in the subiculum and with microglial CD68 expression in the CA1 and subiculum in AD. The HLA-DR microglial expression is highly correlated with CASP-6 expression in the CA1, whereas CD68 microglial expression is correlated with CASP-6 expression in the CA1 and subiculum. As revealed by CD68 and HLA-DR markers, the positive correlations of microglial activation with NLRP1 and CASP-6 immunoreactivity indicate that stronger microglial activation in these regions may induce stronger NLRP1 inflammasome activation and accelerated neurofibrillary degeneration. We also show that AT8-immunoreactive phosphorylated tau proteins accumulate at nuclear pores in large pyramidal neurons of the hippocampal Ammon’s horn, thus directly impairing nuclear transport. This finding supports the hypothesis that pathological tau proteins can directly interact with nuclear pore complex components, leading to their mislocalization and consequent disruption of nuclear pore complex function [95].
The finding that other patterns of inflammasome and microglial activation expression did not reach statistical significance may be related to the fact that in AD cases many neurons and synapses are already lost, which affects expression levels and immunoreactivity. Hence, our findings strongly support neuroinflammation as one of the primary drivers of AD-related neuropathological changes, neuron and synapse loss, as well as corresponding cognitive and behavioral deficits. This interpretation is also in good agreement with the latest two-stage genome-wide association study on 111,326 clinically diagnosed AD cases and 677,663 HC, where pathway enrichment analyses confirmed and expanded on a causal involvement of amyloid precursor protein (APP), tau, and tau-binding proteins in AD pathogenesis, at the same time highlighting the key role of microglial activation and the likely involvement of microglial endocytosis, a mechanism that is also heavily involved in APP metabolism [96]. As the early, repeated, and extensively prolonged microglial proliferation observed in AD probably also endangers their transcriptional and phenotypic trajectory, it also promotes replicative senescence of these cells, characterized by increased β-galactosidase activity, telomere shortening, a senescence-associated transcriptional signature that correlate with the appearance of disease-associated microglia and senescent microglial profiles in human postmortem AD cases [97].

4.5. Limitation of the Study

The blood and cerebrospinal fluid biomarkers of HC and AD were not available for present cohort, preventing us from providing such correlates of pathology.

5. Conclusions

Our results show that NLRP1, ASC, and CASP-6 markers of NLRP1 inflammasome activation are more strongly expressed in the HF in AD brains compared to controls. The expression of different markers of NLRP1 inflammasome activation and microglial activation markers was unrelated to age and disease duration. Interestingly, all markers have the highest immunoreactivity in the CA2/3 region, whose pyramidal neurons exhibit resistance to NFT formation, suggesting that the CA2/3 neurons are more resistant to both neurofibrillary pathology and inflammasome activation-related changes than other pyramidal cells of the hippocampus and neocortex. While our results confirm some previous reports of increased NLRP1 expression in AD, they also reveal new information. First, NLRP1 is expressed in significantly more CA2/3 neurons in the AD brain compared to controls, while ASC is expressed in significantly more subicular neurons in the AD brain. CASP-6 is expressed in significantly more CA1 neurons in the AD brain than in controls. Interestingly, markers of NLRP1 inflammasome activation in the HF do not correlate with the age and the duration of AD but the total number of NLRP1-immunoreactive neurons per area of hippocampal formation tissue is positively correlated with the total number of NFTs. Moreover, and somewhat unexpectedly, the number of NFTs did not correlate with the age of the AD subject in any of the HF fields analyzed, except in the CA1, where it was negatively correlated with age, meaning that younger AD patients had more NFTs in the CA1 field than older ones. Finally, in contrast to our findings, a report on activated microglia density in the chimpanzee brain showed that microglial activation was not significantly correlated with neurofibrillary lesions composed of hyperphosphorylated tau proteins [98]. This indicates that the chimpanzee brain may be relatively well protected during normal aging and that susceptibility to inflammasome activation may render the human brain comparatively more vulnerable to neurodegenerative changes and AD. In conclusion, although the precise roles of NLRP1 inflammasome activation in the development and progression of AD and other tauopathies have yet to be fully elucidated, our findings reveal region-specific mechanisms of NLRP1 inflammasome activation in the HF and suggest that its suppression represents a valid therapeutic goal for the treatment or prevention of AD.

Author Contributions

Conceptualization, G.Š; methodology, E.Š., L.L.H., K.I., and G.Š.; formal analysis, E.Š. and G.Š.; investigation, E.Š. and G.Š.; writing—original draft preparation, E.Š. and G.Š.; writing—review and editing, E.Š., P.R.H., and G.Š.; visualization, E.Š. and G.Š.; supervision, G.Š.; funding, G.Š. and P.R.H. All authors have read and agreed to the published version of the manuscript.

Funding

This research was funded by Hrvatska zaklada za znanost (The Croatian Science Foundation), grant number IP-2019-04-3584 (“Role of blood-brain barrier, innate immunity, and tau protein oligomerization in the pathogenesis of Alzheimer’s disease”), and the Scientific Centre of Excellence for Basic, Clinical, and Translational Neuroscience CoRE-NEURO grant number KK01.1.1.01.0007 (“Experimental and clinical research of hypoxic-ischemic damage in perinatal and adult brain”) funded by the European Union through the European Regional Development Fund, and in part by the NIH grant P30 AG066514 to PRH.

Institutional Review Board Statement

The study was approved by the Central Ethics Committee of the University of Zagreb Medical School case no. 380-59-10106-18-111/126, class 641-01/18-02/01 from 20 June 2018.

Data Availability Statement

All the data reported are available on request from the corresponding author.

Acknowledgments

The authors would like to thank Chiara Cipollina from Ri.MED Foundation and Institute for Biomedical Research and Innovation, Palermo, Italy, for generously sharing her experience and advice regarding the antibodies used. We also thank Janja Kopić and Željka Krsnik for their expert help with scanning sections and preparing microphotographs, Mirjana Babić Leko for help with immunohistochemistry, and Vedran Šimić for help in preparing graphs.

Conflicts of Interest

The authors declare no conflict of interest. The funders had no role in the design of the study; in the collection, analyses, or interpretation of data; in the writing of the manuscript; or in the decision to publish the results.

Abbreviations

The following abbreviations are used in this manuscript:
4R tautau proteins with four microtubule-binding domain repeats
ADAlzheimer’s disease
amyloid β
APPamyloid precursor protein
ASCapoptosis-associated speck-like protein
CAcornu Ammonis
CARDcaspase activation and recruitment domain
CASP-1caspase-1
CASP-6caspase-6
CD68cluster of differentiation 68
CERADConsortium to Establish a Registry for Alzheimer’s Disease
cGSDMDcleaved gasdermin
DSM-IVDiagnostic and Statistical Manual of Mental Disorders, fourth edition
HChealthy controls
HFhippocampal formation
hCA3hilar part of the CA3 field
HLA-DRHuman Leukocyte Antigen–DR isotype
IBA1Ionized calcium-binding adapter molecule 1
NFTsneurofibrillary tangles
NINCDS-ADRDANational Institute of Neurological and Communicative Diseases and Stroke/Alzheimer’s Disease and Related Disorders Association
NLRsNOD-like leucine-rich repeat receptors
NLRP1nucleotide-binding domain and leucine-rich repeat-containing receptor family, pyrin domain-containing protein 1
NLRP3nucleotide-binding domain and leucine-rich repeat-containing receptor family, pyrin domain-containing protein 3
NNnumber of neurons
NODnucleotide-binding and oligomerization domain
PBSphosphate buffered saline
rPPearson’s correlation coefficient
rSSpearman’s correlation coefficient
SDstandard deviation
SUBsubiculum

References

  1. Nayak, D.; Roth, T.L.; McGavern, D.B. Microglia development and function. Annu. Rev. Immunol. 2014, 32, 367–402. [Google Scholar] [CrossRef] [PubMed] [Green Version]
  2. Webers, A.; Heneka, M.T.; Gleeson, P.A. The role of innate immune responses and neuroinflammation in amyloid accumulation and progression of Alzheimer’s disease. Immunol. Cell Biol. 2020, 98, 28–41. [Google Scholar] [CrossRef] [PubMed]
  3. Šimić, G.; Španić, E.; Langer Horvat, L.; Hof, P.R. Blood-brain barrier and innate immunity in the pathogenesis of Alzheimer’s disease. Prog. Mol. Biol. Transl. Sci. 2019, 168, 99–145. [Google Scholar] [PubMed]
  4. Bellucci, A.; Westwood, A.J.; Ingram, E.; Casamenti, F.; Goedert, M.; Spillantini, M.G. Induction of inflammatory mediators and microglial activation in mice transgenic for mutant human P301S tau protein. Am. J. Pathol. 2004, 165, 1643–1652. [Google Scholar] [CrossRef] [Green Version]
  5. Sasaki, A.; Kawarabayashi, T.; Murakami, T.; Matsubara, E.; Ikeda, M.; Hagiwara, H.; Westaway, D.; George-Hyslop, P.S.; Shoji, M.; Nakazato, Y. Microglial activation in brain lesions with tau deposits: Comparison of human tauopathies and tau transgenic mice TgTauP301L. Brain Res. 2008, 1214, 159–168. [Google Scholar] [CrossRef]
  6. Zotova, E.; Nicoll, J.A.R.; Kalaria, R.; Holmes, C.; Boche, D. Inflammation in Alzheimer’s disease: Relevance to pathogenesis and therapy. Alzheimer’s Res. Ther. 2010, 2, 1–9. [Google Scholar] [CrossRef]
  7. Maezawa, I.; Zimin, P.I.; Wulff, H.; Jin, L.W. Amyloid-β protein oligomer at low nanomolar concentrations activates microglia and induces microglial neurotoxicity. J. Biol. Chem. 2011, 286, 3693–3706. [Google Scholar] [CrossRef] [Green Version]
  8. Serrano-Pozo, A.; Mielke, M.L.; Gómez-Isla, T.; Betensky, R.A.; Growdon, J.H.; Frosch, M.P.; Hyman, B.T. Reactive glia not only associates with plaques but also parallels tangles in Alzheimer’s disease. Am. J. Pathol. 2011, 179, 1373–1384. [Google Scholar] [CrossRef]
  9. Španić, E.; Langer Horvat, L.; Hof, P.R.; Šimić, G. Role of microglial cells in Alzheimer’s Disease tau propagation. Front. Aging Neurosci. 2019, 11, 271. [Google Scholar] [CrossRef] [Green Version]
  10. Yang, Y.; Wang, H.; Kouadir, M.; Song, H.; Shi, F. Recent advances in the mechanisms of NLRP3 inflammasome activation and its inhibitors. Cell Death Dis. 2019, 10, 128. [Google Scholar] [CrossRef] [Green Version]
  11. Zhang, J.; Pei, L.; Zang, D.; Xue, Y.; Wang, X.; Chen, Y.; Li, J.; Yu, J.; Gao, Q.; Di, W.; et al. Gender differences of NLRP1 inflammasome in mouse model of Alzheimer’s disease. Front. Aging Neurosci. 2020, 12, 512097. [Google Scholar] [CrossRef] [PubMed]
  12. Jin, M.; Shiwaku, H.; Tanaka, H.; Obita, T.; Ohuchi, S.; Yoshioka, Y.; Yin, X.; Kondo, K.; Fujita, K.; Homma, H.; et al. Tau activates microglia via the PQBP1-cGAS-STING pathway to promote brain inflammation. Nat. Commun. 2021, 12, 6565. [Google Scholar] [CrossRef] [PubMed]
  13. Von Bernhardi, R. Glial cell dysregulation: A new perspective on Alzheimer’s disease. Neurotox. Res. 2007, 12, 215–232. [Google Scholar] [CrossRef]
  14. Yoshiyama, Y.; Higuchi, M.; Zhang, B.; Huang, S.M.; Iwata, N.; Saido, T.C.; Maeda, J.; Suhara, T.; Trojanowski, J.Q.; Lee, V.M.Y. Synapse loss and microglial activation precede tangles in a P301S tauopathy mouse model. Neuron 2007, 53, 337–351. [Google Scholar] [CrossRef] [Green Version]
  15. Tang, Y.; Le, W. Differential roles of M1 and M2 microglia in neurodegenerative diseases. Mol. Neurobiol. 2016, 53, 1181–1194. [Google Scholar] [CrossRef] [PubMed]
  16. Denver, P.; McClean, P.L. Distinguishing normal brain aging from the development of Alzheimer’s disease: Inflammation, insulin signaling and cognition. Neural Regen. Res. 2018, 13, 1719–1730. [Google Scholar] [CrossRef] [PubMed]
  17. Chiroma, S.M.; Baharuldin, M.T.H.; Taib, C.N.M.; Amom, Z.; Jagadeesan, S.; Moklas, M.A.M. Inflammation in Alzheimer’s disease: A friend or foe? Biomed. Res. Ther. 2018, 5, 2552–2564. [Google Scholar] [CrossRef]
  18. Albornoz, E.A.; Woodruff, T.M.; Gordon, R. Inflammasomes in CNS diseases. Exp. Suppl. 2018, 108, 41–60. [Google Scholar]
  19. Alcocer-Gómez, E.; Castejón-Vega, B.; López-Sánchez, M.; Cordero, M.D. Inflammasomes in clinical practice: A brief introduction. Exp. Suppl. 2018, 108, 1–8. [Google Scholar]
  20. Swanson, K.V.; Deng, M.; Ting, J.P.-Y. The NLRP3 inflammasome: Molecular activation and regulation to therapeutics. Nat. Rev. Immunol. 2019, 19, 477–489. [Google Scholar] [CrossRef]
  21. Liu, T.; Zhang, L.; Joo, D.; Sun, S.-C. NF-κB signaling in inflammation. Signal Transduct. Target. Ther. 2017, 2, 17023. [Google Scholar] [CrossRef] [Green Version]
  22. Guo, H.; Pe´trin, D.; Zhang, Y.; Bergeron, C.; Goodyer, C.G.; LeBlanc, A.C. Caspase-1 activation of caspase-6 in human apoptotic neurons. Cell Death Differ. 2006, 13, 285–292. [Google Scholar] [CrossRef] [PubMed] [Green Version]
  23. Kaushal, V.; Dye, R.; Pakavathkumar, P.; Foveau, B.; Flores, J.; Hyman, B.; Ghetti, B.; Koller, B.H.; LeBlanc, A.C. Neuronal NLRP1 inflammasome activation of Caspase-1 coordinately regulates inflammatory interleukin-1-beta production and axonal degeneration-associated Caspase-6 activation. Cell Death Differ. 2015, 22, 1676–1686. [Google Scholar] [CrossRef] [PubMed] [Green Version]
  24. Guo, H.; Albrecht, S.; Bourdeau, M.; Petzke, T.; Bergeron, C.; LeBlanc, A.C. Active caspase-6 and caspase-6-cleaved tau in neuropil threads, neuritic plaques, and neurofibrillary tangles of Alzheimer’s disease. Am. J. Pathol. 2004, 165, 523–531. [Google Scholar] [CrossRef]
  25. Albrecht, S.; Bourdeau, M.; Bennett, D.; Mufson, E.J.; Bhattacharjee, M.; LeBlanc, A.C. Activation of caspase-6 in aging and mild cognitive impairment. Am. J. Pathol. 2007, 170, 1200–1209. [Google Scholar] [CrossRef] [PubMed] [Green Version]
  26. Theofilas, P.; Ehrenberg, A.J.; Nguy, A.; Thackrey, J.M.; Dunlop, S.; Mejia, M.B.; Alho, T.A.; Leite, R.E.P.; Rodriguez, R.D.; Suemoto, C.K.; et al. Probing the correlation of neuronal loss, neurofibrillary tangles, and cell death markers across the Alzheimer’s disease Braak stages: A quantitative study in humans. Neurobiol. Aging 2018, 61, 1–12. [Google Scholar] [CrossRef]
  27. Halle, A.; Hornung, V.; Petzold, G.C.; Stewart, C.R.; Monks, B.G.; Reinheckel, T.; Fitzgerald, K.A.; Latz, E.; Moore, K.J.; Golenbock, D.T. The NALP3 inflammasome is involved in the innate immune response to amyloid-β. Nat. Immunol. 2008, 9, 857–865. [Google Scholar] [CrossRef] [Green Version]
  28. Pontillo, A.; Catamo, E.; Arosio, B.; Mari, D.; Crovella, S. NALP1/NLRP1 genetic variants are associated with Alzheimer’s disease. Alzheimer Dis. Assoc. Disord. 2012, 26, 277–281. [Google Scholar] [CrossRef]
  29. Heneka, M.T.; Kummer, M.P.; Stutz, A.; Delekate, A.; Schwartz, S.; Vieira-Saecker, A.; Griep, A.; Axt, D.; Remus, A.; Tzeng, T.C.; et al. NLRP3 is activated in Alzheimer’s disease and contributes to pathology in APP/PS1 mice. Nature 2013, 493, 674–678. [Google Scholar] [CrossRef]
  30. Tan, M.S.; Tan, L.; Jiang, T.; Zhu, X.C.; Wang, H.F.; Jia, C.D.; Yu, J.T. Amyloid-β induces NLRP1-dependent neuronal pyroptosis in models of Alzheimer’s disease. Cell Death Dis. 2014, 5, e1382. [Google Scholar] [CrossRef]
  31. Venegas, C.; Kumar, S.; Franklin, B.S.; Dierkes, T.; Brinkschulte, R.; Tejera, D.; Vieria-Saecker, A.; Schwartz, S.; Santarelli, F.; Kummer, M.P.; et al. Microglia-derived ASC specks crossseed amyloid-β in Alzheimer’s disease. Nature 2017, 552, 355–361. [Google Scholar] [CrossRef] [PubMed]
  32. Dansokho, C.; Heneka, M.T. Neuroinflammatory responses in Alzheimer’s disease. J. Neural. Transm. 2018, 125, 71–79. [Google Scholar] [CrossRef] [PubMed]
  33. Ising, C.; Venegas, C.; Zhang, S.; Scheiblich, H.; Schmidt, S.V.; Vieira-Saecker, A.; Schwartz, S.; Albasset, S.; McManus, R.M.; Tejera, D.; et al. NLRP3 inflammasome activation drives tau pathology. Nature 2019, 575, 669–673. [Google Scholar] [CrossRef]
  34. Yap, J.K.Y.; Pickard, B.S.; Chan, E.W.L.; Gan, S.Y. The role of neuronal NLRP1 inflammasome in Alzheimer’s disease: Bringing neurons into the neuroinflammation game. Mol. Neurobiol. 2019, 56, 7741–7753. [Google Scholar] [CrossRef] [PubMed]
  35. Severini, C.; Barbato, C.; Di Certo, M.G.; Gabanella, F.; Petrella, C.; Stadio, A.D.; de Vincentiis, M.; Polimeni, A.; Ralli, M.; Greco, A. Alzheimer’s Disease: New concepts on the role of autoimmunity and NLRP3 inflammasome in the pathogenesis of the disease. Curr. Neuropharmacol. 2021, 19, 498–512. [Google Scholar] [CrossRef] [PubMed]
  36. Shen, H.; Guan, Q.; Zhang, X.; Yuan, C.; Tan, Z.; Zhai, L.; Hao, Y.; Gu, Y.; Han, C. New mechanism of neuroinflammation in Alzheimer’s disease: The activation of NLRP3 inflammasome mediated by gut microbiota. Prog. Neuropsychopharmacol. Biol. Psychiatry 2020, 100, 109884. [Google Scholar] [CrossRef]
  37. Wang, H.; Yang, F.; Xin, R.; Cui, D.; He, J.; Zhang, S.; Sun, Y. The gut microbiota attenuate neuroinflammation in manganese exposure by inhibiting cerebral NLRP3 inflammasome. Biomed. Pharmacother. 2020, 129, 110449. [Google Scholar] [CrossRef]
  38. Kummer, J.A.; Broekhuizen, R.; Everett, H.; Agostini, L.; Kuijk, L.; Martinon, F.; van Bruggen, R.; Tschopp, J. Inflammasome components NALP 1 and 3 show distinct but separate expression profiles in human tissues suggesting a site-specific role in the inflammatory response. J. Histochem. Cytochem. 2007, 55, 443–452. [Google Scholar] [CrossRef] [Green Version]
  39. Jiang, J.; Ding, N.; Wang, K.; Li, Z. Electroacupuncture could influence the expression of IL-1 β and NLRP3 inflammasome in hippocampus of Alzheimer’s Disease animal model. Evid. Based Complement. Altern. Med. 2018, 2018, 8296824. [Google Scholar] [CrossRef] [Green Version]
  40. Chiu, Y.J.; Lin, C.H.; Lee, M.C.; Hsieh-Li, H.M.; Chen, C.M.; Wu, Y.R.; Chang, K.H.; Lee-Chen, G.J. Formulated Chinese medicine Shaoyao Gancao Tang reduces NLRP1 and NLRP3 in Alzheimer’s disease cell and mouse models for neuroprotection and cognitive improvement. Aging 2021, 13, 15620–15637. [Google Scholar] [CrossRef]
  41. Li, Q.; Wang, Q.; Guan, H.; Zhou, Y.; Liu, L. Schisandrin inhibits NLRP1 inflammasome-mediated neuronal pyroptosis in mouse models of Alzheimer’s disease. Neuropsychiatr. Dis. Treat. 2021, 17, 261–268. [Google Scholar] [CrossRef] [PubMed]
  42. Zhang, T.; Guan, B.; Tan, S.; Zhu, H.; Ren, D.; Li, R.; Xiao, L. Bushen Huoxue acupuncture inhibits NLRP1 inflammasomemediated neuronal pyroptosis in SAMP8 mouse model of Alzheimer’s disease. Neuropsychiatr. Dis. Treat. 2021, 17, 339–346. [Google Scholar] [CrossRef] [PubMed]
  43. McKhann, G.; Drachman, D.; Folstein, M.; Katzman, R.; Price, D.; Stadlan, E.M. Clinical diagnosis of Alzheimer’s disease: Report of the NINCDS-ADRDA Work Group under the auspices of Department of Health and Human Services Task Force on Alzheimer’s Disease. Neurology 1984, 34, 939–944. [Google Scholar] [CrossRef] [PubMed] [Green Version]
  44. Mirra, S.S.; Heyman, A.; McKeel, D.; Sumi, S.M.; Crain, B.J.; Brownlee, L.M.; Vogel, F.S.; Hughes, J.P.; van Belle, G.; Berg, L. The Consortium to Establish a Registry for Alzheimer’s Disease (CERAD). Part II. Standardization of the neuropathologic assessment of Alzheimer’s disease. Neurology 1991, 41, 479–486. [Google Scholar] [CrossRef]
  45. Yamamoto, T.; Hirano, A. A comparative study of modified Bielschowsky, Bodian and thioflavin S stain on Alzheimer’s neurofibrillary tangles. Neuropathol. Appl. Neurobiol. 1986, 12, 3–9. [Google Scholar] [CrossRef]
  46. Šimić, G.; Kostović, I.; Winblad, B.; Bogdanović, N. Volume and number of neurons of the human hippocampal formation in normal aging and Alzheimer’s disease. J. Comp. Neurol. 1997, 379, 482–494. [Google Scholar] [CrossRef]
  47. West, M.J.; Gundersen, H.J. Unbiased stereological estimation of the number of neurons in the human hippocampus. J. Comp. Neurol. 1990, 296, 1–22. [Google Scholar] [CrossRef]
  48. Šimić, G.; Gnjidić, M.; Kostović, I. Cytoskeletal changes as an alternative view on pathogenesis of Alzheimer’s disease. Period. Biol. 1998, 100, 165–173. [Google Scholar]
  49. Hickman, S.E.; Kingery, N.D.; Ohsumi, T.K.; Borowsky, M.L.; Wang, L.-C.; Means, T.K.; El Khoury, J. The microglial sensome revealed by direct RNA sequencing. Nat. Neurosci. 2013, 16, 1896–1905. [Google Scholar] [CrossRef] [Green Version]
  50. Youm, Y.-H.; Grant, R.W.; McCabe, L.R.; Albarado, D.C.; Nguyen, K.Y.; Ravussin, A.; Pistell, P.; Newman, S.; Carter, R.; Laque, A.; et al. Canonical Nlrp3 inflammatome links systemic low-grade inflammation to functional decline in aging. Cell Metab. 2013, 18, 519–532. [Google Scholar] [CrossRef] [Green Version]
  51. Paolicelli, R.; Sierra, A.; Stevens, B.; Tremblay, M.-E.; Aguzzi, A.; Ajami, B.; Amit, I.; Audinat, E.; Bechmann, I.; Bennett, M.; et al. Defining microglial states and nomenclature: A roadmap to 2030. Cell 2022. [Google Scholar] [CrossRef]
  52. Bisht, K.; Sharma, K.P.; Lecours, C.; Sánchez, M.G.; El Hajj, H.; Milior, G.; Olmos-Alonso, A.; Gómez-Nicola, D.; Luheshi, G.; Vallières, L.; et al. Dark microglia: A new phenotype predominantly associated with pathological states. Glia 2016, 64, 826–839. [Google Scholar] [CrossRef] [PubMed] [Green Version]
  53. Tsu, B.V.; Beierschmitt, C.; Ryan, A.P.; Agarwal, R.; Mitchell, P.S.; Daugherty, M.D. Diverse viral proteases activate the NLRP1 inflammasome. Elife 2021, 10, 1–76. [Google Scholar] [CrossRef] [PubMed]
  54. De Oliveira, P.; Cella, C.; Locker, N.; Ravindran, K.K.G.; Mendis, A.; Wafford, K.; Gilmour, G.; Dijk, D.-J.; Winsky-Sommerer, R. Improved sleep, memory, and cellular pathological features of tauopathy, including the NLRP3 inflammasome, after chronic administration of trazodone in rTg450 mice. Neurobiol. Dis. 2022, 42, 3494–3509. [Google Scholar]
  55. Faustin, B.; Lartigue, L.; Bruey, J.M.; Luciano, F.; Sergienko, E.; Bailly-Maitre, B.; Volkmann, N.; Hanein, D.; Rouiller, I.; Reed, C.J. Reconstituted NALP1 inflammasome reveals two-step mechanism of caspase-1 activation. Mol. Cell 2007, 25, 713–724. [Google Scholar] [CrossRef]
  56. Šimić, G.; Lucassen, P.J.; Krsnik, Ž.; Krušlin, B.; Kostović, I.; Winblad, B.; Bogdanović, N. nNOS expression in reactive astrocytes correlates with increased cell death related DNA damage in the hippocampus and entorhinal cortex in Alzheimer’s disease. Exp. Neurol. 2000, 165, 12–26. [Google Scholar] [CrossRef] [Green Version]
  57. Frisoni, G.B.; Ganzola, R.; Canu, E.; Rüb, U.; Pizzini, F.B.; Alessandrini, F.; Zoccatelli, G.; Beltramelo, A.; Caltagirone, C.; Thompson, P.M. Mapping local hippocampal changes in Alzheimer’s disease and normal ageing with MRI at 3 Tesla. Brain 2008, 131, 3266–3276. [Google Scholar] [CrossRef] [Green Version]
  58. Ishizawa, T.; Ko, L.; Cookson, N.; Davies, P.; Espinoza, M.; Dickson, D.W. Selective neurofibrillary degeneration of the hippocampal CA2 sector is associated with four-repeat tauopathies. J. Neuropathol. Exp. Neurol. 2002, 61, 1040–1047. [Google Scholar] [CrossRef] [Green Version]
  59. Šimić, G. Pathological tau proteins in argyrophilic grain disease. Lancet Neurol. 2002, 1, 276. [Google Scholar] [CrossRef]
  60. Vogel, J.W.; Young, A.L.; Oxtoby, N.P.; Smith, R.; Ossenkoppele, R.; Strandberg, O.T.; La Joie, R.; Aksman, L.M.; Grothe, M.J.; Iturria-Medina, Y.; et al. Four distinct trajectories of tau deposition identified in Alzheimer’s disease. Nat. Med. 2021, 27, 871–881. [Google Scholar] [CrossRef]
  61. Liu, A.K.L.; Chau, T.W.; Lim, E.J.; Ahmed, I.; Chang, R.C.-C.; Kalaitzakis, M.E.; Graeber, M.B.; Gentleman, S.M.; Pearce, R.K.B. Hippocampal CA2 Lewy pathology is associated with cholinergic degeneration in Parkinson’s disease with cognitive decline. Acta Neuropathol. Commun. 2019, 7, 61. [Google Scholar] [CrossRef] [PubMed] [Green Version]
  62. Ma, L.Z.; Tan, L.; Bi, Y.L.; Shen, X.N.; Xu, W.; Ma, Y.H.; Li, H.Q.; Dong, Q.; Yu, J.T. Dynamic changes of CSF sTREM2 in preclinical Alzheimer’s disease: The CABLE study. Mol. Neurodegener. 2020, 15, 25. [Google Scholar] [CrossRef] [PubMed] [Green Version]
  63. Zhai, L.; Shen, H.; Sheng, Y.; Guan, Q. ADMSC Exo-MicroRNA-22 improve neurological function and neuroinflammation in mice with Alzheimer’s disease. J. Cell Mol. Med. 2021, 25, 7513–7523. [Google Scholar] [CrossRef] [PubMed]
  64. Jia, J.; Zhang, X.; Xu, G.; Zeng, X.; Li, L. Thioredoxin-1 inhibits amyloid-β25–35-induced activation of NLRP1/caspase-1/GSDMD pyroptotic pathway in PC12 cells. Mol. Biol. Rep. 2022, 49, 3445–3452. [Google Scholar] [CrossRef]
  65. McKenzie, B.A.; Dixit, V.M.; Power, C. Fiery cell death: Pyroptosis in the central nervous system. Trends Neurosci. 2020, 43, 55–73. [Google Scholar] [CrossRef]
  66. Chan, A.H.; Schroeder, K. Inflammasome signaling and regulation of interleukin-1 family cytokines. J. Exp. Med. 2020, 217, 1–10. [Google Scholar] [CrossRef] [Green Version]
  67. Tsuchiya, K.; Hosojima, S.; Hara, H.; Kushiyama, H.; Mahib, M.R.; Kinoshita, T.; Suda, T. Gasdermin D mediates the maturation and release of IL-1α downstream of inflammasomes. Cell Rep. 2021, 34, 108887. [Google Scholar] [CrossRef]
  68. Ghosh, S.; Wu, M.D.; Shaftel, S.S.; Kyrkanides, S.; LaFerla, F.M.; Olschowka, J.A.; O’Banion, M.K. Sustained interleukin-1β overexpression exacerbates tau pathology despite reduced amyloid burden in an Alzheimer’s mouse model. J. Neurosci. 2013, 33, 5053. [Google Scholar] [CrossRef]
  69. Rühl, S.; Shkarina, K.; Demarco, B.; Heilig, R.; Santos, J.C.; Broz, P. ESCRT-dependent membrane repair negatively regulates pyroptosis downstream of GSDMD activation. Science 2018, 362, 956–960. [Google Scholar] [CrossRef] [Green Version]
  70. Zhang, Y.; Goodyer, C.; LeBlanc, A. Selective and protracted apoptosis in human primary neurons microinjected with active caspase-3, -6, -7, and -8. J. Neurosci. 2000, 20, 8384–8389. [Google Scholar] [CrossRef]
  71. Raina, A.K.; Hochman, A.; Zhu, X.; Rottkamp, C.A.; Nunomura, A.; Siedlak, S.L.; Boux, H.; Castellani, R.J.; Perry, G.; Smith, M.A. Abortive apoptosis in Alzheimer’s disease. Acta Neuropathol. 2001, 101, 305–310. [Google Scholar] [CrossRef] [PubMed]
  72. Klaiman, G.; Petzke, T.L.; Hammond, J.; LeBlanc, A.C. Targets of caspase-6 activity in human neurons and Alzheimer’s disease. Mol. Cell Proteom. 2008, 7, 1541–1555. [Google Scholar] [CrossRef] [PubMed] [Green Version]
  73. LeBlanc, A.; Liu, H.; Goodyer, C.; Bergeron, C.; Hammond, J. Caspase-6 role in apoptosis of human neurons, amyloidogenesis, and Alzheimer’s disease. J. Biol. Chem. 1999, 274, 23426–23436. [Google Scholar] [CrossRef] [PubMed] [Green Version]
  74. Ramcharitar, J.M.; Afonso, V.; Albrecht, S.A.; Bennett, D.; LeBlanc, A.C. Caspase-6 activity predicts lower episodic memory ability in aged individuals. Neurobiol. Aging 2013, 34, 1815–1824. [Google Scholar] [CrossRef] [Green Version]
  75. Noël, A.; Foveau, B.; LeBlanc, A.C. Caspase-6-cleaved tau fails to induce tau hyperphosphorylation and aggregation, neurodegeneration, glial inflammation, and cognitive deficits. Cell Death Dis. 2021, 12, 227. [Google Scholar] [CrossRef]
  76. Godefroy, N.; Foveau, B.; Albrecht, S.; Goodyer, C.G.; LeBlanc, A.C. Expression and activation of Caspase-6 in human fetal and adult tissues. PLoS ONE 2013, 8, e79313. [Google Scholar] [CrossRef] [Green Version]
  77. Hof, P.R.; Bussière, T.; Gold, G.; Kövari, E.; Giannakopoulos, P.; Bouras, C.; Perl, D.P.; Morrison, J.H. Stereological evidence for persistence of viable neurons in layer II of the entorhinal cortex and the CA1 field in Alzheimer’s disease. J. Neuropathol. Exp. Neurol. 2003, 62, 55–67. [Google Scholar] [CrossRef] [Green Version]
  78. Zhang, L.; Jiang, Y.; Zhu, J.; Liang, H.; He, X.; Qian, J.; Lin, H.; Tao, Y.; Zhu, K. Quantitative assessment of hippocampal tau pathology in AD and PART. J. Mol. Neurosci. 2020, 70, 1808–1811. [Google Scholar] [CrossRef]
  79. Cherry, J.D.; Esnault, C.D.; Baucom, Z.H.; Tripodis, Y.; Huber, B.R.; Alvarez, V.E.; Stein, T.D.; Dickson, D.W.; McKee, A.C. Tau isoforms are differentially expressed across the hippocampus in chronic traumatic encephalopathy and Alzheimer’s disease. Acta Neuropathol. Commun. 2021, 9, 86. [Google Scholar] [CrossRef]
  80. Leblanc, A.C.; Ramcharitar, J.; Afonso, V.; Hamel, E.; Bennett, D.A.; Pakavathkumar, P.; Albrecht, S. Caspase-6 activity in the CA1 region of the hippocampus induces age-dependent memory impairment. Cell Death Differ. 2014, 21, 696–706. [Google Scholar] [CrossRef] [Green Version]
  81. Boscia, F.; Esposito, C.L.; Di Crisci, A.; de Franciscis, V.; Annunziato, L.; Cerchia, L. GDNF selectively induces microglial activation and neuronal survival in CA1/CA3 hippocampal regions exposed to NMDA insult through Ret/ERK signalling. PLoS ONE 2009, 4, e6486. [Google Scholar] [CrossRef] [PubMed]
  82. Rayamajhi, M.; Miao, E.A. Just say NO to NLRP3. Nat. Immunol. 2013, 14, 12–14. [Google Scholar] [CrossRef] [PubMed]
  83. Jiang, M.; Wang, H.; Liu, Z.; Lin, L.; Wang, L.; Xie, M.; Li, D.; Zhang, J.; Zhang, R. Endoplasmic reticulum stress-dependent activation of iNOS/NO-NF-κB signaling and NLRP3 inflammasome contributes to endothelial inflammation and apoptosis associated with microgravity. FASEB J. 2020, 34, 10835–10849. [Google Scholar] [CrossRef]
  84. Mao, K.; Chen, S.; Chen, M.; Ma, Y.; Wang, Y.; Huang, B.; He, Z.; Zeng, Y.; Hu, Y.; Sun, S.; et al. Nitric oxide suppresses NLRP3 inflammasome activation and protects against LPS-induced septic shock. Cell Res. 2013, 23, 201–212. [Google Scholar] [CrossRef] [Green Version]
  85. Mishra, B.B.; Rathinam, V.A.K.; Martens, G.W.; Martinot, A.J.; Kornfeld, H.; Fitzgerald, K.A.; Sassetti, C.M. Nitric oxide controls tuberculosis immunopathology by inhibiting NLRP3 inflammasome-dependent IL-1β processing. Nat. Immunol. 2013, 14, 52–60. [Google Scholar] [CrossRef] [PubMed] [Green Version]
  86. Šimić, G.; Babić Leko, M.; Wray, S.; Harrington, C.; Delalle, I.; Jovanov-Milošević, N.; Bažadona, D.; Buée, L.; de Silva, R.; Di Giovanni, G.; et al. Tau protein hyperphosphorylation and aggregation in Alzheimer’s disease and other tauopathies, and possible neuroprotective strategies. Biomolecules 2016, 6, 6. [Google Scholar] [CrossRef] [Green Version]
  87. Stancu, I.C.; Cremers, N.; Vanrusselt, H.; Couturier, J.; Vanoosthuyse, A.; Kessels, S.; Lodder, C.; Brone, B.; Huaux, F.; Octave, J.N.; et al. Aggregated tau activates NLRP3–ASC inflammasome exacerbating exogenously seeded and non-exogenously seeded tau pathology in vivo. Acta Neuropathol. 2019, 137, 599–617. [Google Scholar] [CrossRef] [Green Version]
  88. Poitelon, Y.; Johnson, L.; Liddelow, S.A.; Giovannini, M.G.; Lana, D.; Ugolini, F. An Overview on the differential interplay among neurons-astrocytes-microglia in CA1 and CA3 hippocampus in hypoxia/ischemia. Front. Cell Neurosci. 2020, 14, 585833. [Google Scholar]
  89. Sun, D.; Gao, G.; Zhong, B.; Zhang, H.; Ding, S.; Sun, Z.; Zhang, Y.; Li, W. NLRP1 inflammasome involves in learning and memory impairments and neuronal damages during aging process in mice. Behav. Brain Funct. 2021, 17, 11. [Google Scholar] [CrossRef]
  90. Šimić, G.; Bexheti, S.; Kelović, Z.; Kos, M.; Grbić, K.; Hof, P.R.; Kostović, I. Hemispheric asymmetry, modular variability and age-related changes in the human entorhinal cortex. Neuroscience 2005, 130, 911–925. [Google Scholar] [CrossRef]
  91. Bachstetter, A.D.; Van Eldik, L.J.; Schmitt, F.A.; Neltner, J.H.; Ighodaro, E.T.; Webster, S.J.; Patel, E.; Abner, E.L.; Kryscio, R.; Nelson, P.T. Disease-related microglia heterogeneity in the hippocampus of Alzheimer’s disease, dementia with Lewy bodies, and hippocampal sclerosis of aging. Acta Neuropathol. Commun. 2015, 3, 32. [Google Scholar] [CrossRef] [Green Version]
  92. Minett, T.; Classey, J.; Matthews, F.E.; Fahrenhold, M.; Taga, M.; Brayne, C.; Ince, P.G.; Nicoll, J.A.R.; Boche, D.; MRC CFAS. Microglial immunophenotype in dementia with Alzheimer’s pathology. J. Neuroinflammation 2016, 13, 135. [Google Scholar] [CrossRef] [PubMed] [Green Version]
  93. Hendrickx, D.A.E.; van Eden, C.G.; Schuurman, K.G.; Hamann, J.; Huitinga, I. Staining of HLA-DR, Iba1 and CD68 in human microglia reveals partially overlapping expression depending on cellular morphology and pathology. J. Neuroimmunol. 2017, 309, 12–22. [Google Scholar] [CrossRef] [PubMed]
  94. Taipa, R.; Brochado, P.; Robinson, A.; Reis, I.; Costa, P.; Mann, D.M.; Pires, M.M.; Sousa, N. Patterns of microglial cell activation in Alzheimer’s disease and frontotemporal lobar degeneration. Neurodegener. Dis. 2017, 17, 145–154. [Google Scholar] [CrossRef] [PubMed]
  95. Eftekharzadeh, B.; Daigle, J.G.; Kapinos, L.E.; Coyne, A.; Schiantarelli, J.; Carlomagno, Y.; Cook, C.; Miller, S.J.; Dujardin, S.; Amaral, A.S.; et al. Tau protein disrupts nucleoplasmic transport in Alzheimer’s disease. Neuron 2019, 99, 925–940. [Google Scholar] [CrossRef] [PubMed] [Green Version]
  96. Bellenguez, C.; Küçükali, F.; Jansen, I.E.; Kleineidam, L.; Moreno-Grau, S.; Amin, N.; Naj, A.C.; Campos-Martin, R.; Grenier-Boley, B.; Andrade, V.; et al. New insights into the genetic etiology of Alzheimer’s disease and related dementias. Nat. Genet. 2022, 54, 412–436. [Google Scholar] [CrossRef]
  97. Hu, Y.; Fryatt, G.L.; Ghorbani, M.; Obst, J.; Menassa, D.A.; Martin-Estebane, M.; Muntslag, T.A.O.; Olmos-Alonso, A.; Guerrero-Carrasco, M.; Thomas, D.; et al. Replicative senescence dictates the emergence of disease-associated microglia and contributes to Aβ pathology. Cell Rep. 2021, 35, 109228. [Google Scholar] [CrossRef]
  98. Edler, M.K.; Sherwood, C.C.; Meindl, R.S.; Munger, E.L.; Hopkins, W.D.; Ely, J.J.; Erwin, J.M.; Perl, D.P.; Mufson, E.J.; Hof, P.R.; et al. Microglia changes associated to Alzheimer’s disease pathology in aged chimpanzees. J. Comp. Neurol. 2018, 526, 2921–2930. [Google Scholar] [CrossRef]
Figure 1. The regional density of immunoreactive neurons for NLRP1 (A), ASC (B), cGSDMD (C), and CASP-6 (D). (A) Compared to HC, a significantly higher quantity of NLRP1-labeled cells was found in the CA2/3 field in the AD group (p = 0.02). Although individual comparisons of hCA3, CA1, and SUB were not significant (p = 0.88, p = 0.11, and p = 0.07, respectively), when the hippocampal formation (HF) was viewed as a whole, the difference in the quantity of NLRP1-labeled cells was statistically significant (p = 0.03). (B) Compared to HC, a significantly higher quantity of ASC-labeled cells was found in the SUB in the AD group (p = 0.04). Other individual comparisons of ASC-labeled cells in the hCA3, CA2/3, and CA1 fields were not significant (p = 0.18, p = 0.13, and p = 0.99, respectively) as was the hippocampal formation (HF) viewed as a whole (p = 0.07). (C) Regarding cGSDMD, in the AD group neither the hCA3, CA2/3, CA1, and subiculum were significantly different from HC (p = 0.6, p = 0.54, p = 0.79, p = 0.72, respectively) nor was the hippocampal formation (HF) viewed as a whole (p = 0.15). (D) Regarding CASP-6 labeling, a significantly higher quantity of labeled cells was found in the CA1 and subiculum in the AD group compared to HC (p = 0.0005 and 0.02, respectively). Comparisons of hCA3 and CA2/3 were not significant (p = 0.13 and p = 0.41, respectively). When the hippocampal formation (HF) is viewed as a whole, the difference was highly significant (p = 0.0008). * = p < 0.05, *** = p < 0.001.
Cells 11 02223 g001
Figure 2. (A) Correlation between NLRP1 and ASC immunoreactivity. (B) Correlation between NLRP1 and CASP-6. (C) Correlation between cGSDMD and CASP-6. Dotted lines represent the 95% confidence interval. (D) The total number of NLRP1-immunoreactive neurons per area of hippocampal formation tissue significantly positively correlated with the total number of NFTs.
Cells 11 02223 g002
Figure 3. (A) Age-related neuronal loss in the CA1 field of HC and AD cases. The average annual difference is 90.5 thousand neurons. (B) The age-related number of NFTs negatively correlates with the age of AD subjects in the CA1 field of hippocampal formation. This means that younger AD patients had more neurofibrillary tangles than the older ones. Dotted lines represent the 95% confidence interval.
Cells 11 02223 g003
Figure 4. Semiquantitative assessment of IBA1/HLA-DR/CD68 immunoreactive microglial cells per randomly selected section in healthy control (HC) and Alzheimer’s disease (AD) subjects across the hippocampus. Microglial markers were analyzed for IBA1 and HLA-DR according to the following scale: 0—immunoreactivity is not present; 1—several immunoreactive cells are present, all cells are ramified microglia; 2—moderate number of immunoreactive cells, mostly ramified, few activated cells; 3—many diffusely distributed immunoreactive cells, mostly activated; and 4—many large clusters of activated microglial cells; marker CD68 was analyzed according to the following scale: 0—immunoreactivity is not present; 1—several immunoreactive cells are present; 2—moderate number of immunoreactive cells; 3—many diffusely distributed immunoreactive cells; and 4—many large clusters of immunoreactive microglial cells. CD68 expression is significantly higher in the AD group compared to HC (T = −7.22, d.f. = 18, with pooled estimate of variance p < 0.001). Data are represented as means ± SD. *** = p < 0.001.
Cells 11 02223 g004
Figure 5. Expression of IBA1 marker in ramified microglia (arrows) in the CA1 in AD (case AD5). Scale bar 50 µm.
Cells 11 02223 g005
Figure 6. HLA-DR immunohistochemical staining of microglia (arrows) in AD. Hilar part of the CA3 (A), CA2/3 (B), and subiculum (C). The higher magnifications in A and B allow for the recognition of different morphologies of microglial cells, while panel C offers a broader view of their regional distribution. Scale bars 100 µm.
Cells 11 02223 g006aCells 11 02223 g006b
Figure 7. CD68 immunoreactivity of microglia. (A) Typical punctiform staining of CD68-labeled activated microglial cells (arrows) in a healthy control in the subiculum. (B) Clusters of CD68-expressing microglial cells (arrows) in the CA1 field in AD. Scale bars: A = 50 µm, B = 250 µm.
Cells 11 02223 g007
Figure 8. Immunostaining of NLRP1 in the CA2/3 field of the hippocampal formation in a control (A) and AD (B). See Figure 1 for quantitative data. Scale bar (same for A and B) = 100 µm.
Cells 11 02223 g008
Figure 9. Immunostaining of ASC in the subiculum in control (A, case HC5) and AD brain (B, case AD2). The dashed line is a provisional border between the CA1 field and subiculum. The difference in the number of NLRP1-immunoreactive neurons between the HC and AD groups in the subiculum was statistically significant (see Figure 2). Scale bar (same for A and B) = 500 µm.
Cells 11 02223 g009
Figure 10. Immunostaining of the CASP-6 in the subiculum of the hippocampal formation in the HC (case HC9, subfigure A) and the AD brain (case AD2, subfigure B). The difference in the number of CASP-6-immunoreactive neurons between the HC and AD groups in the CA1 field was statistically significant (see Figure 4). Scale bars 250 µm.
Cells 11 02223 g010
Figure 11. Colocalization of NLRP1 with ASC, phosphorylated tau (AT8), CD68, and HLA-DR in Alzheimer’s disease (AC) and healthy control hippocampus (D). Open arrows in A show neurons in which NLRP1 inflammasome colocalizes with ASC protein. Full arrow in A shows presence of ASC proteins in a neuron in absence of NLRP1 inflammasome. Arrowheads in A show larger and brighter ASC signals that probably correspond to aggregates of self-oligomerized ASC protein, which are sometimes in the extracellular spaces of AD brains in association with NLRP1 (double arrowheads in A). AD brains generally show much higher expression of NLRP1 inflammasome (A,B) and HLA-DR-immunoreactive microglial cells (C) than healthy control brains (D). Scale bars = 10 μm.
Cells 11 02223 g011
Figure 12. (A). ASC protein colocalization with tau protein phosphorylated at Ser202 and Thr205 residues (AT8 epitope). Accumulation of AT8-immunoreactive tau proteins was observed at nuclear pores of large pyramidal neurons in the Ammon’s horn (B,C). Scale bars = 10 μm.
Cells 11 02223 g012
Figure 13. Colocalization of CASP-6 with phosphorylated tau (AT8), CD68, and HLA-DR. (A) CASP-6 and phosphorylated tau (AT8) in NFTs (empty arrows) in AD. (B) Colocalization is rare in HC, where NFTs are few. (C) CASP-6 and CD68 near amyloid/neuritic plaques in AD hippocampus (arrowheads). (D) The distribution and colocalization of CASP-6 and HLA-DR in AD are also prevalent in amyloid/neuritic plaques (arrowhead). Scale bars in A, B, and D = 10 μm, in C = 50 μm.
Cells 11 02223 g013
Table 1. Demographic data of control and AD subjects.
CaseHC
AgeGenderCause of Death
HC159MCar accident
HC262FCar accident
HC368MCar accident
HC471FMyocardial infarction
HC575MCar accident
HC677FMyocardial infarction
HC781FMyocardial infarction
HC884FPulmonary embolism
HC985FCardiovascular failure
CaseAD
AgeGenderDuration of the Disease (years)Cause of DeathNINCDS-ADRDA Diagnosis
AD173F4BronchopneumoniaDefinitive AD
AD273M7BronchopneumoniaDefinitive AD
AD377M3.5BronchopneumoniaDefinitive AD
AD480F5BronchopneumoniaDefinitive AD
AD580F6Myocardial infarctionDefinitive AD
AD681M3BronchopneumoniaDefinitive AD
AD783F5.5Cardiovascular failureProbable AD
AD884F3.5Cardiovascular failureDefinitive AD
AD984F3.5Cardiovascular failureDefinitive AD
AD1088F4.5CarcinomaProbable AD
AD1191F4BronchopneumoniaProbable AD
Table 2. Results of NLRP1 (N), ASC (A), cGSDMD (G), and CASP-6 (C) immunostaining assessment. Numbers represent the total number of all immunoreactive neurons in a given hippocampal subdivision in a randomly selected section of the hippocampus.
CasehCA3
Counts
AreaCA2/3
Counts
AreaCA1
Counts
AreaSUB
Counts
AreaTotal CountsΣ
Area
NAGCmm2NAGCmm2NAGCmm2NAGCmm2NAGCmm2
HC14120125981232601344911314008484210000014017809717,852
HC28692321087837001230161735110,702635345514,8851651624023733,424
HC3161932977383824471111,277305050917,2996732225512,8251511251518449,139
HC45238101339531881392475230215910043510,14927912124410,0656783984016726,468
HC5549581987362183200185340682911310925223022,22357155435523,67840755956172360,092
HC6351712742014520991803281831413,00165173487010,4861732287210029,490
HC7614917434486741593070159644131112212,50696160415391212205999918828,108
HC8164141334453214987813881911914206647209601515,423874052612626,903
HC9738371354126736053916692601614,360344202414,23924318775837,926
AD15810915114624773129511022162283914124644124991314661311833769348620,980
AD26027848903897127124588011801043610141468028430036129965957573815244019,416
AD3712326334018968145412619163267011,0554460131011,4191632969015429,111
AD48874234412,18920011385026711802721717269179119017015,6266473333343537,754
AD53854102373511521313625157179100382077029981701113010,0833674559538526,034
AD68415621398899148121739258810014079557113214294078374644333719724,894
AD73822744604881141278606927206582152267956257146897724050173312745222,797
AD845672274873815178172933861053829439829667291221069213682128075227,342
AD9445112936221988443519954819162756168674141807741772268551919,527
AD10201712224356187842761420166542421521,83210945424565013822006754336,890
AD113214023637476113172867256287525256547321170232762644813615719,862
Table 3. Densities of immunoreactive neurons for the four different markers per mm2 of hippocampal formation tissue.
CaseNLRP1
(Cells/mm2)
ASC
(Cells/mm2)
GSDMD
(Cells/mm2)
CASP-6
(Cells/mm2)
HC10.7841.0000.0000.543
HC20.4940.4800.1200.709
HC30.3070.2500.3070.171
HC42.5621.5000.1510.631
HC50.6770.9300.9341.203
HC60.5870.7700.2440.339
HC70.7832.1300.3520.669
HC80.3231.5100.0970.468
HC90.6410.4900.0190.153
AD10.8721.7920.4432.316
AD22.9613.8010.7832.266
AD30.5601.0170.3090.529
AD41.7140.8820.0871.152
AD51.4101.7480.3651.479
AD61.8641.7400.1490.791
AD72.1983.2150.5571.983
AD81.3460.7750.2932.750
AD90.3941.1570.4352.658
AD101.0360.5420.1821.472
AD111.3292.4220.1810.790
Table 4. The total number of neurons (NN) and neurofibrillary tangles (NFTs) in hippocampal formation domains in HC and AD subjects.
CasehCA3CA2/3CA1SUBΣ
NN
(106)
NFTs
(106)
NN
(106)
NFTs
(106)
NN
(106)
NFTs
(106)
NN
(106)
NFTs
(106)
NFTs
(106)
HC10.8401.207.1802.6100
HC21.2901.4108.4104.3400
HC31.5701.9402.620200
HC41.2702.905.3501.4700
HC51.402.4808.2804.850.050.05
HC60.8301.6802.4301.790.030.03
HC70.8701.6103.4202.2900
HC81.3501.4507.890.014.8900
HC91.2902.1602.2601.5900
AD110.080.980.224.933.450.930.714.45
AD21.630.081.450.515.484.023.470.545.14
AD30.570.131.64050.811.420.251.19
AD40.930.161.820.1110.91.952.780.432.66
AD50.300.920.184.383.152.40.523.85
AD61.80.30.780.24.592.883.161.194.57
AD70.370103.091.991.250.132.13
AD81.670.071.390.117.652.423.810.553.15
AD90.170.081.2602.061.421.010.31.8
AD100.2300.840.193.271.881.790.682.74
AD110.530.080.960.371.140.550.840.271.27
Bold numbers represent totals from the individual subdivisions.
Table 5. Results of the semiquantitative scale assessment of microglial markers IBA1 (I), HLA-DR (H), and CD68 (C).
CasehCA3
Counts
CA2/3
Counts
CA1
Counts
SUB
Counts
Total Counts
per Sample
IHCIHCIHCIHCIHC
HC13332320221226109
HC23223232313211197
HC3201202201101705
HC4201201202302906
HC5222122021021386
HC6222132222222798
HC7012102101023238
HC8302202201212917
HC9203102202202709
AD10030220140130412
AD221431332431411515
AD30132031240233513
AD421330n.a.23434410811
AD5333233334333111213
AD622430333422310714
AD702130324344491011
AD804413314404421515
AD90243033242038414
AD1030232333332412712
AD1133232233223311119
Bold numbers represent totals from the individual subdivisions.
Publisher’s Note: MDPI stays neutral with regard to jurisdictional claims in published maps and institutional affiliations.

