
Extracellular Vesicles Derived from Endothelial Progenitor Cells Protect Human Glomerular Endothelial Cells and Podocytes from Complement- and Cytokine-Mediated Injury

 , , , and
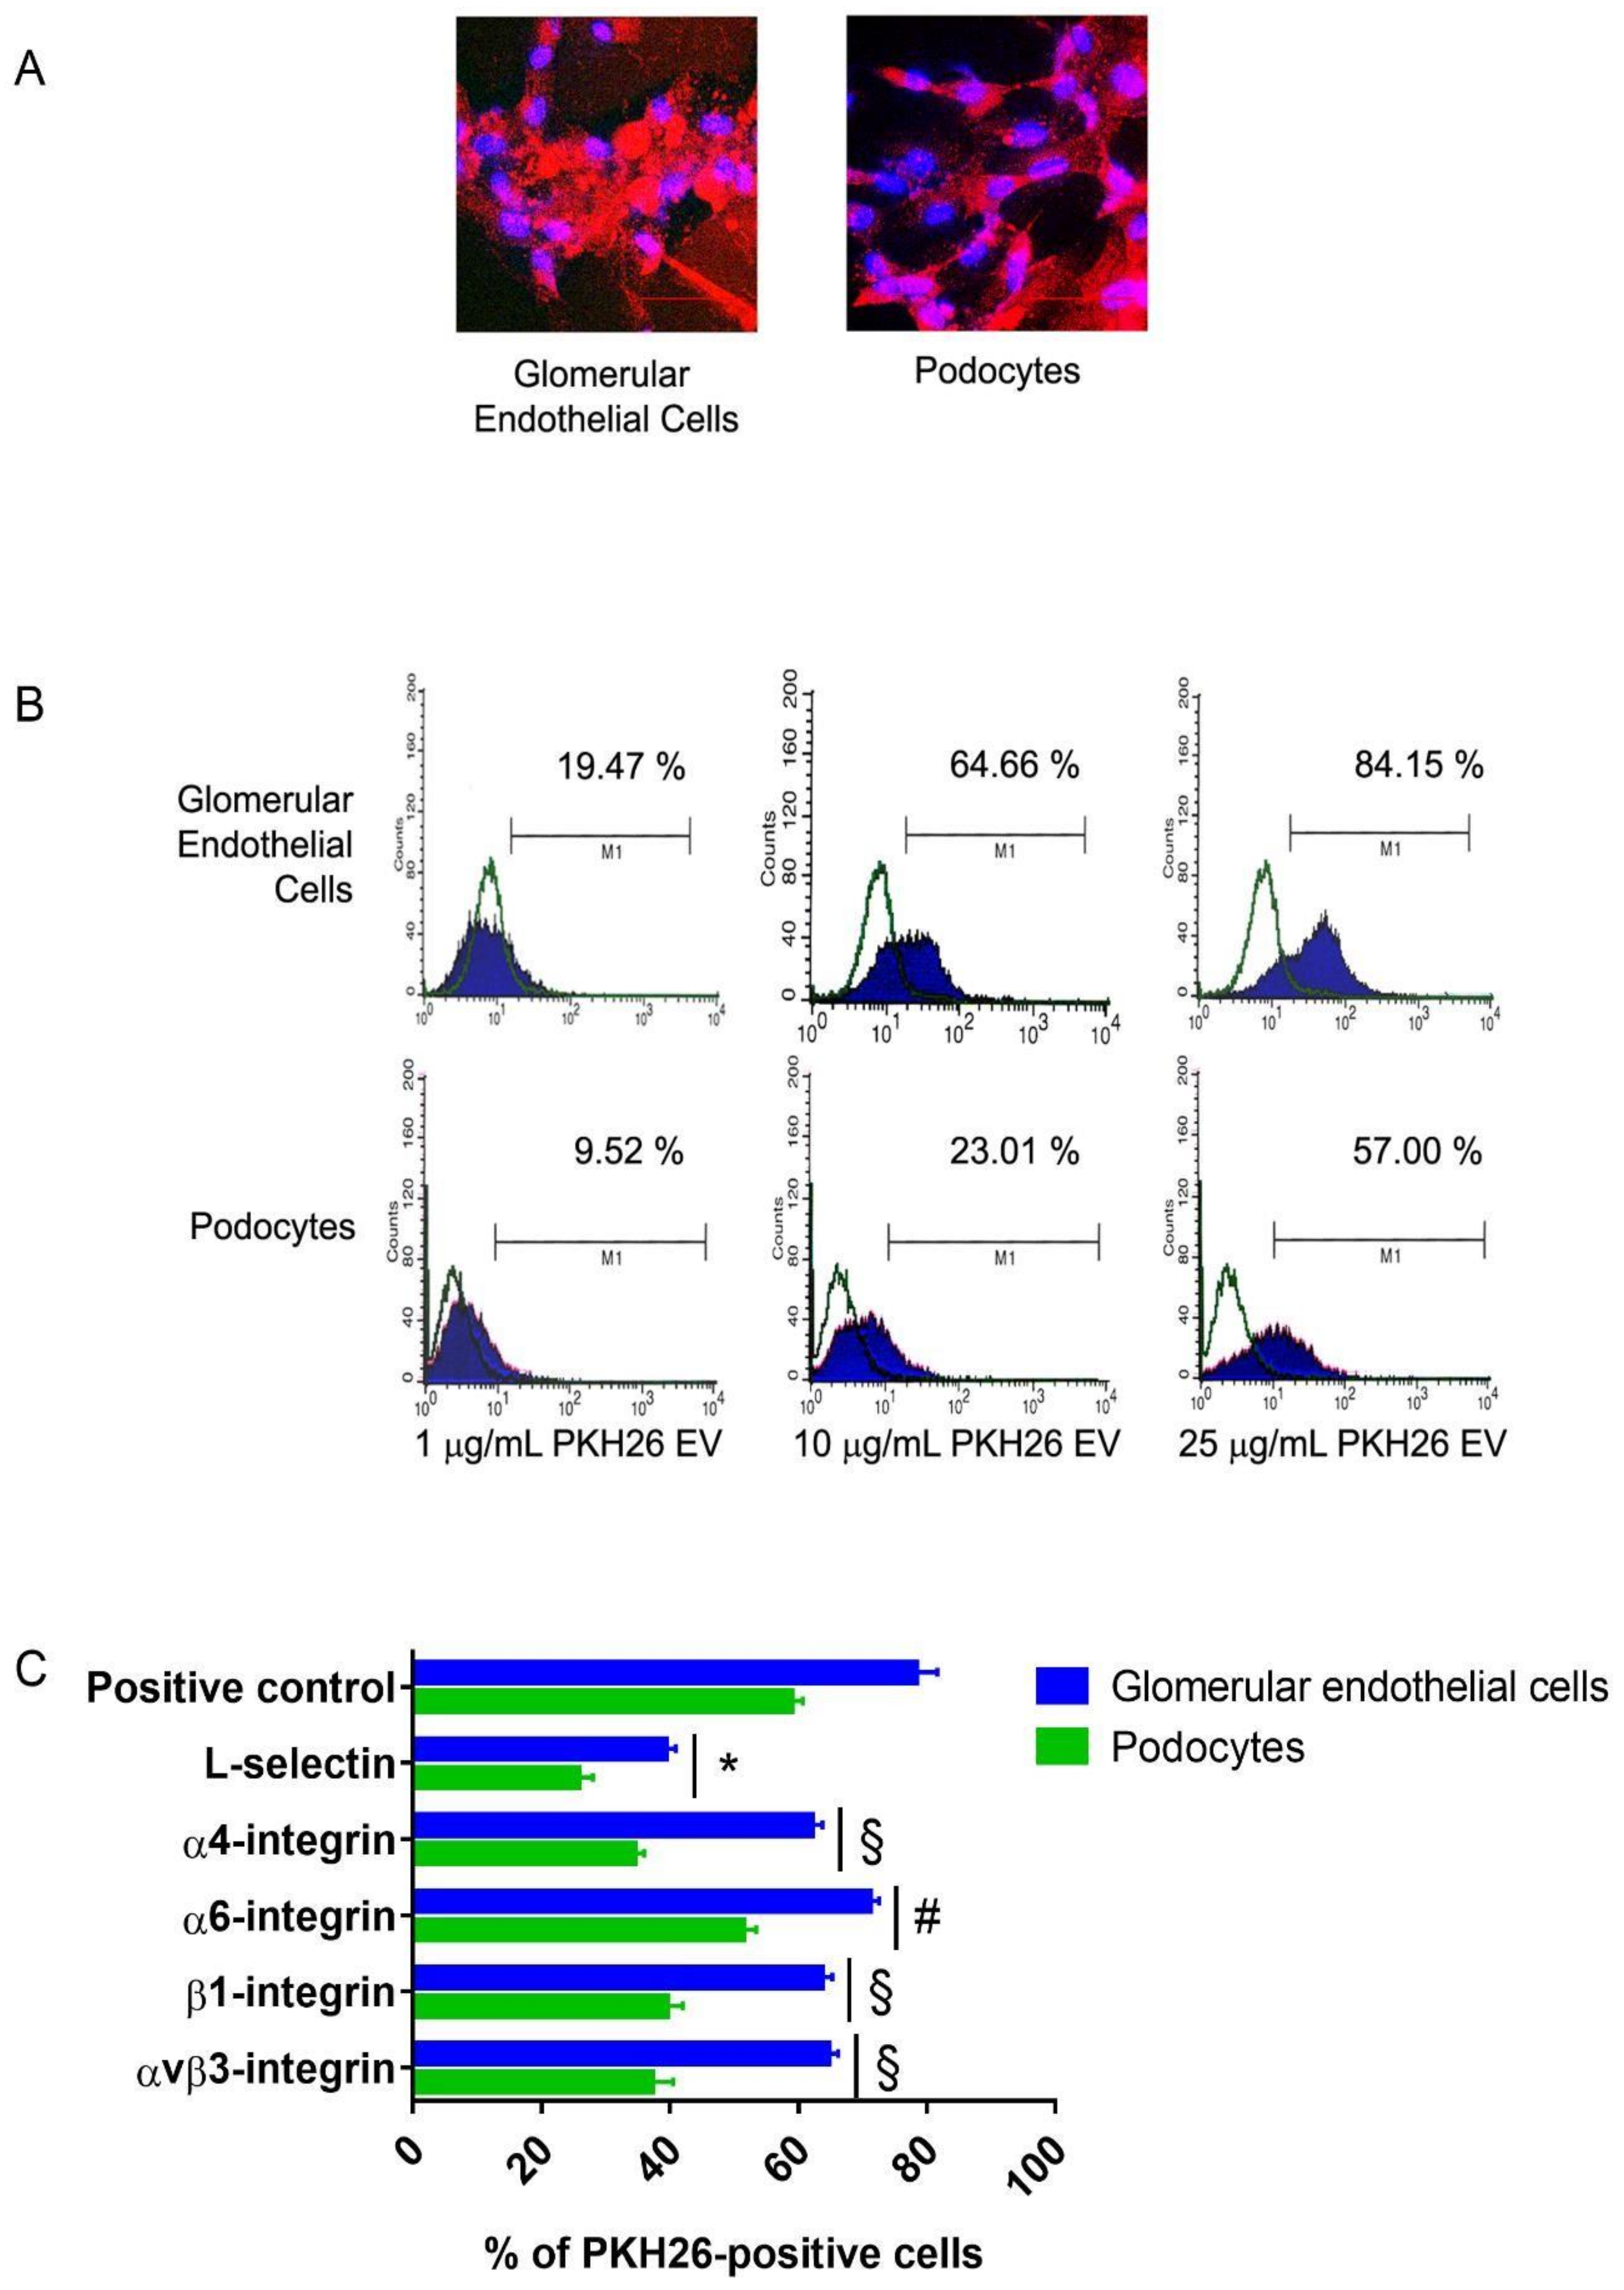
Abstract
:1. Introduction
2. Materials and Methods
2.1. Isolation and Characterization of Human EPCs
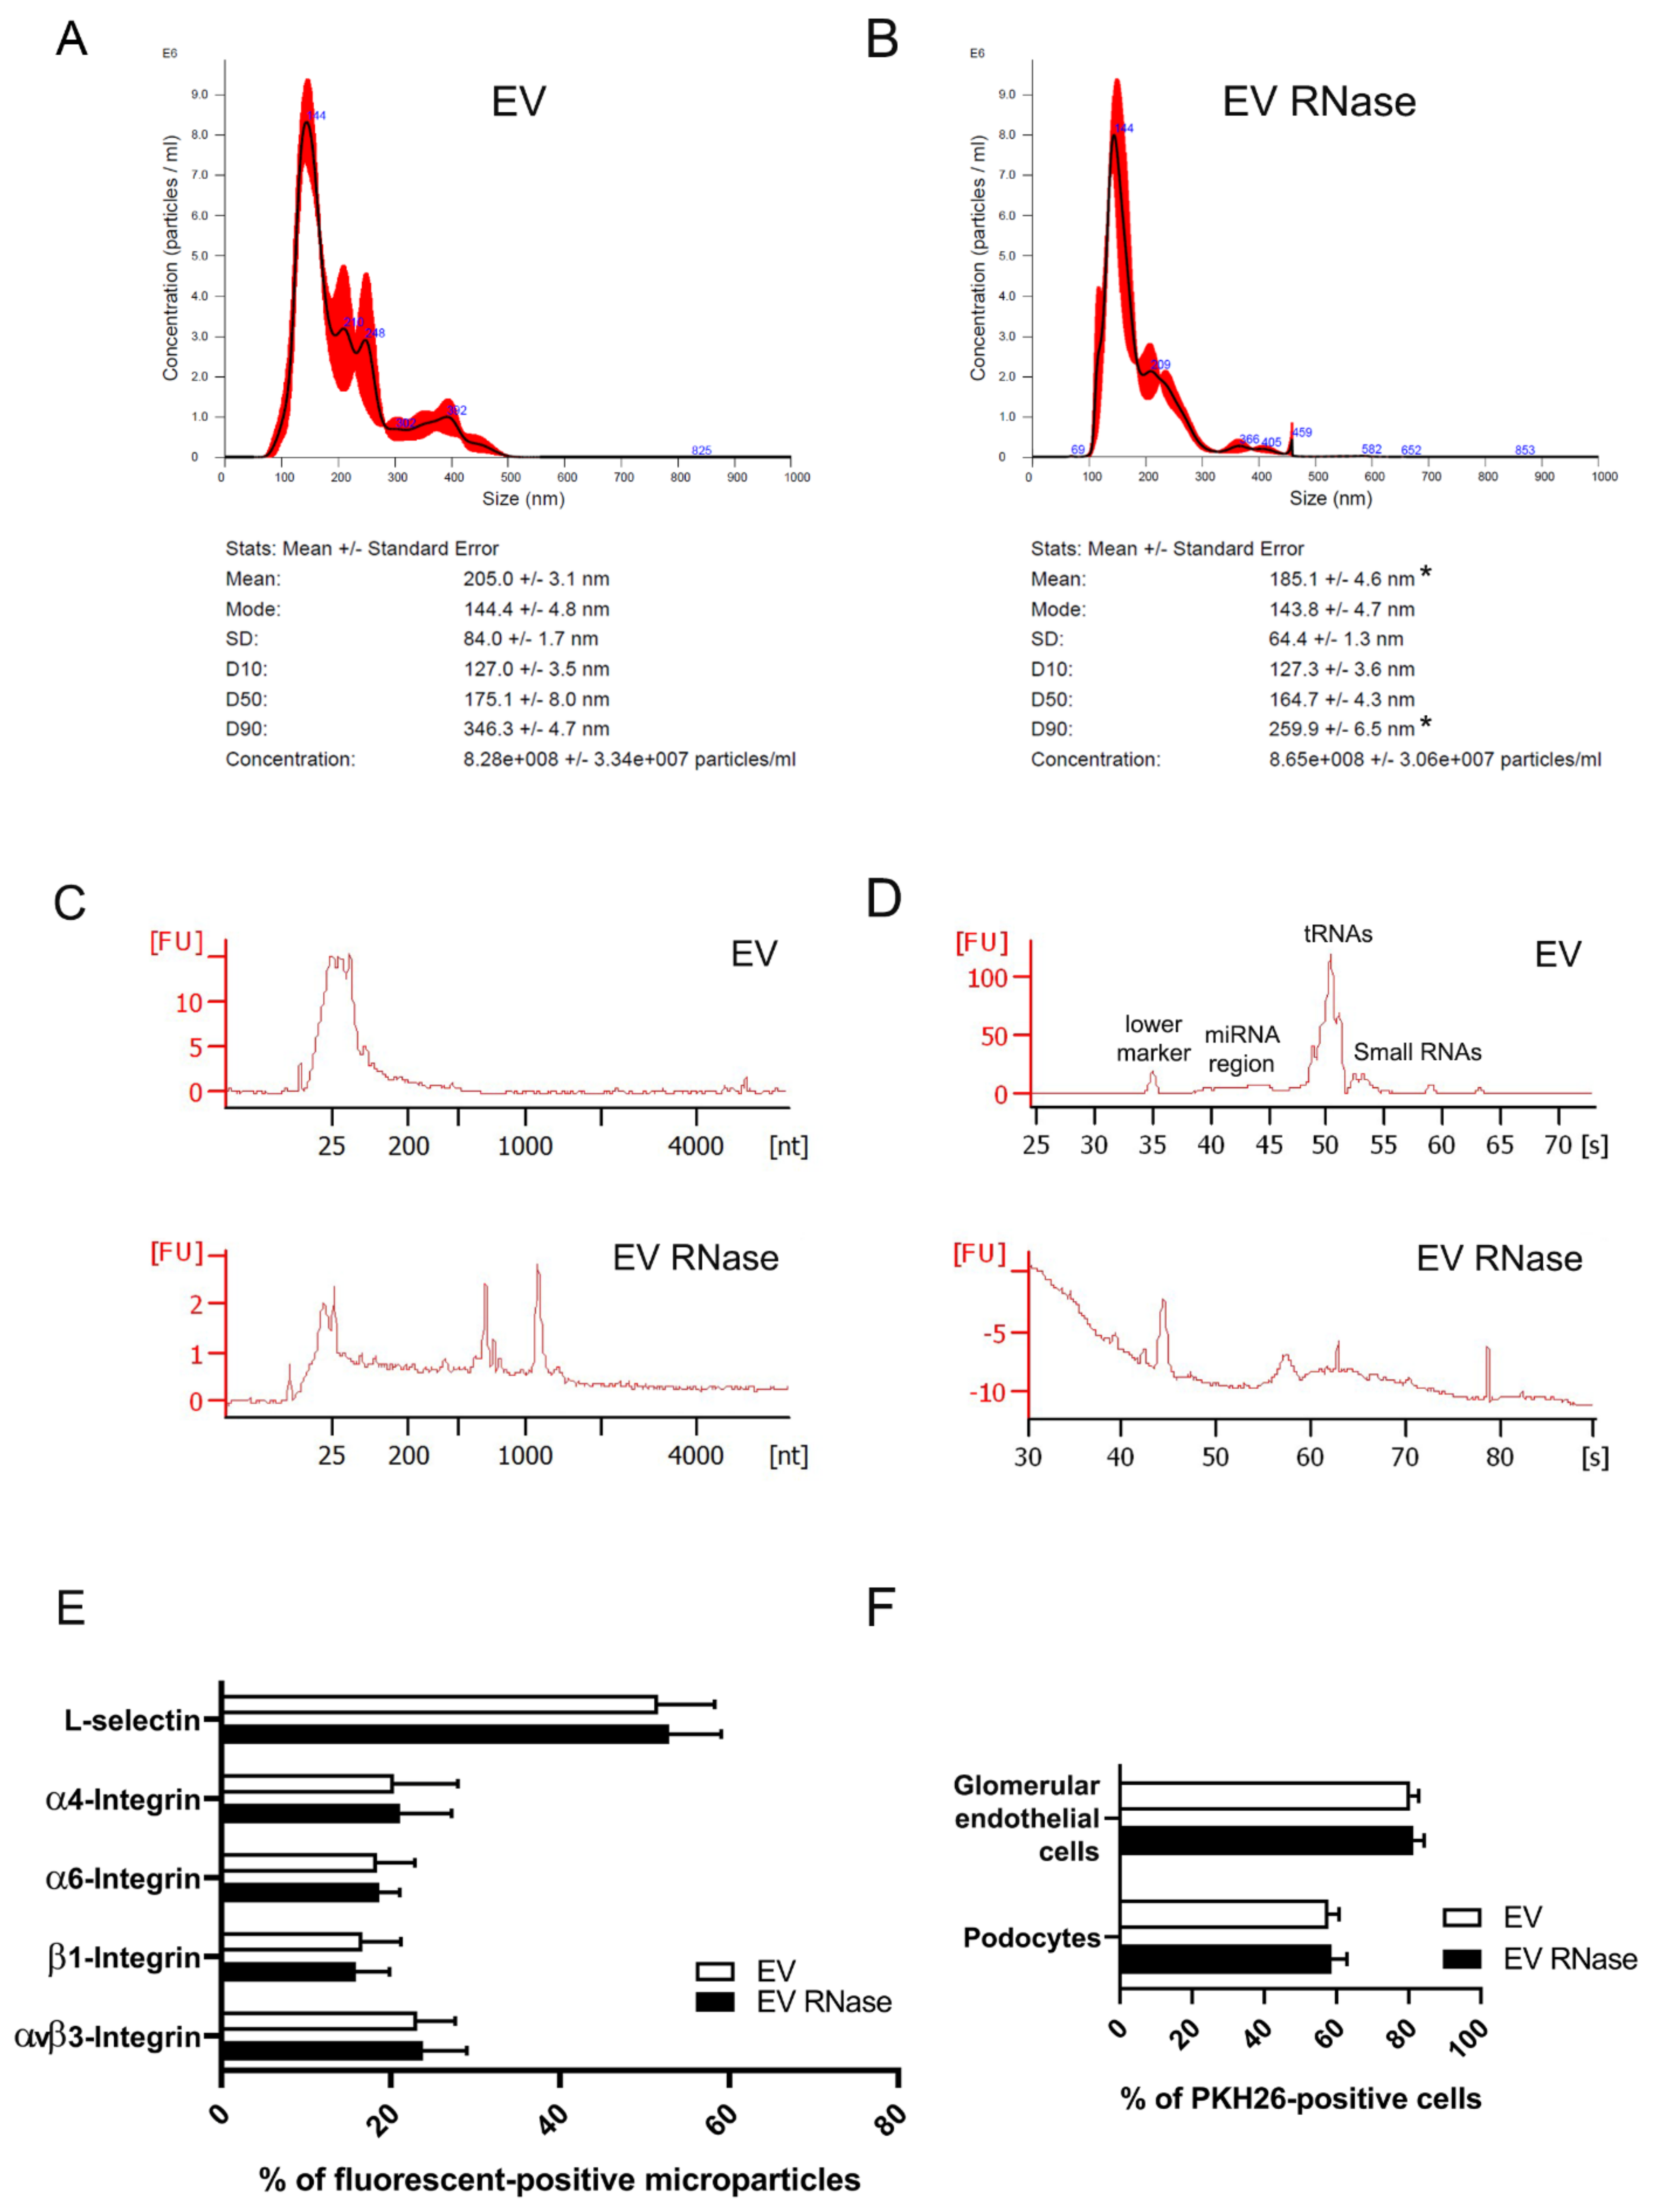
2.2. Isolation and Characterization of Human EPC-Derived EVs
2.2.1. Nanoparticle Tracking Analysis
2.2.2. RNA Extraction and Analysis
2.2.3. Guava FACS Analysis
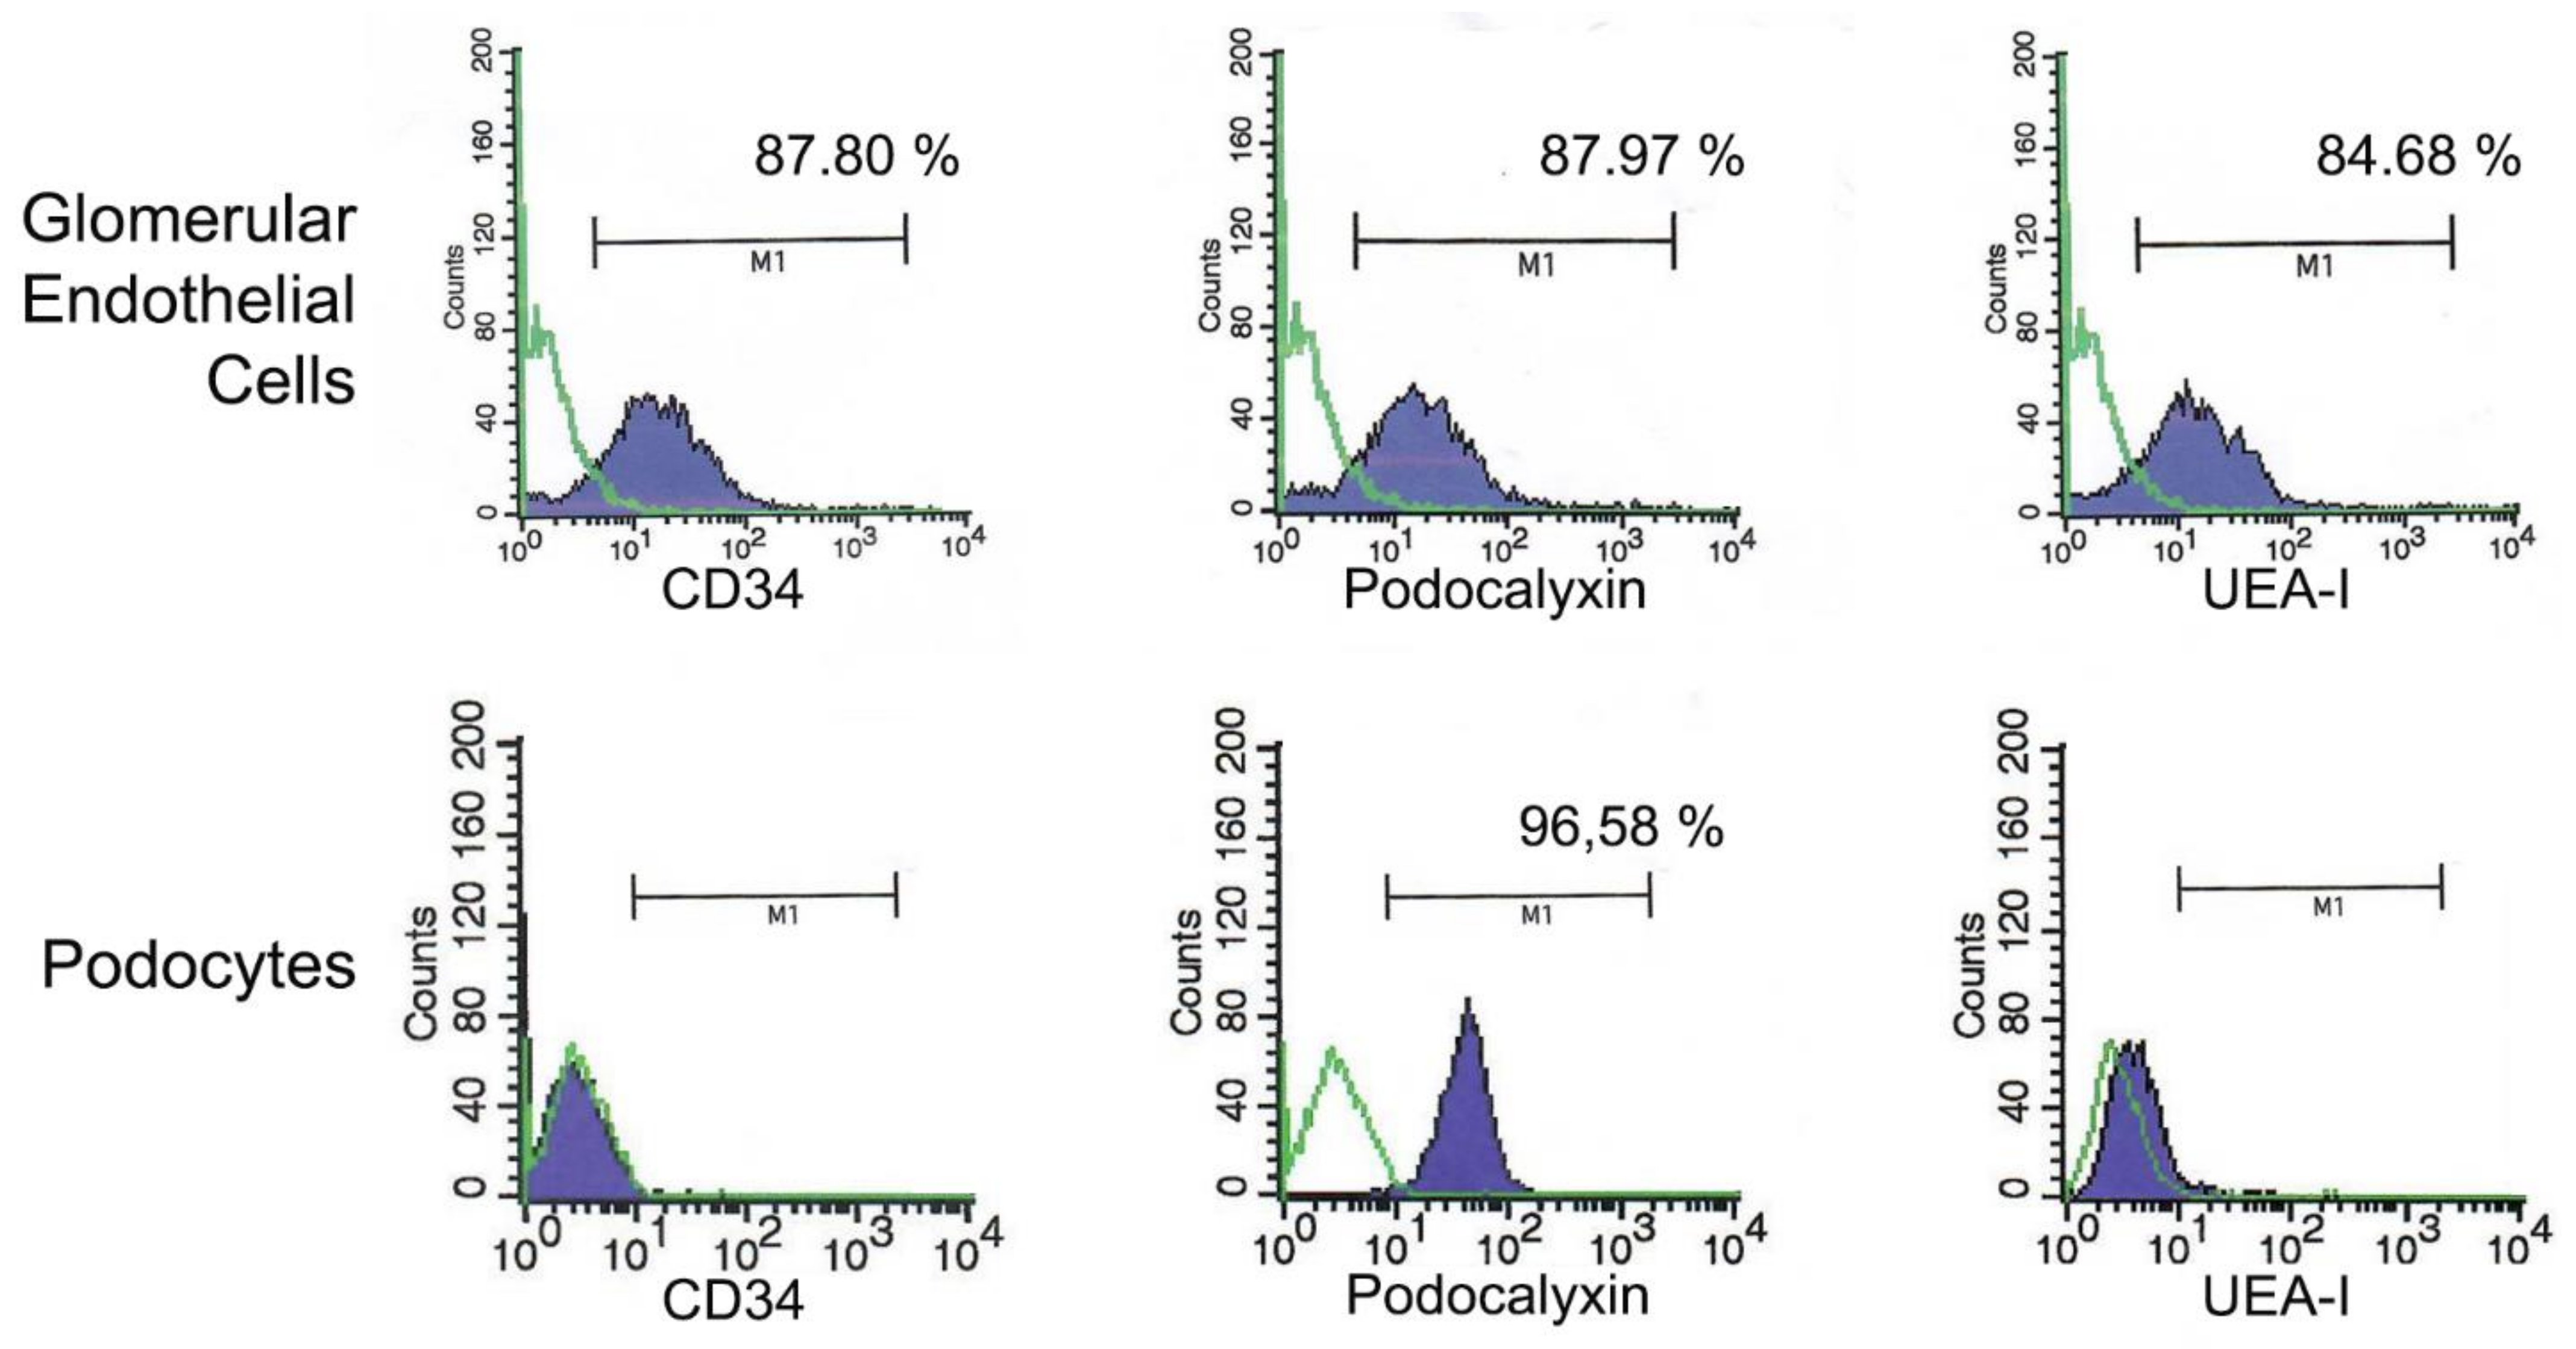
2.3. Isolation and Characterization of Human Renal Glomerular Cells
2.4. Internalization of EPC-Derived EVs in GECs and Podocytes
2.5. In Vitro Studies on Human GECs and Podocytes
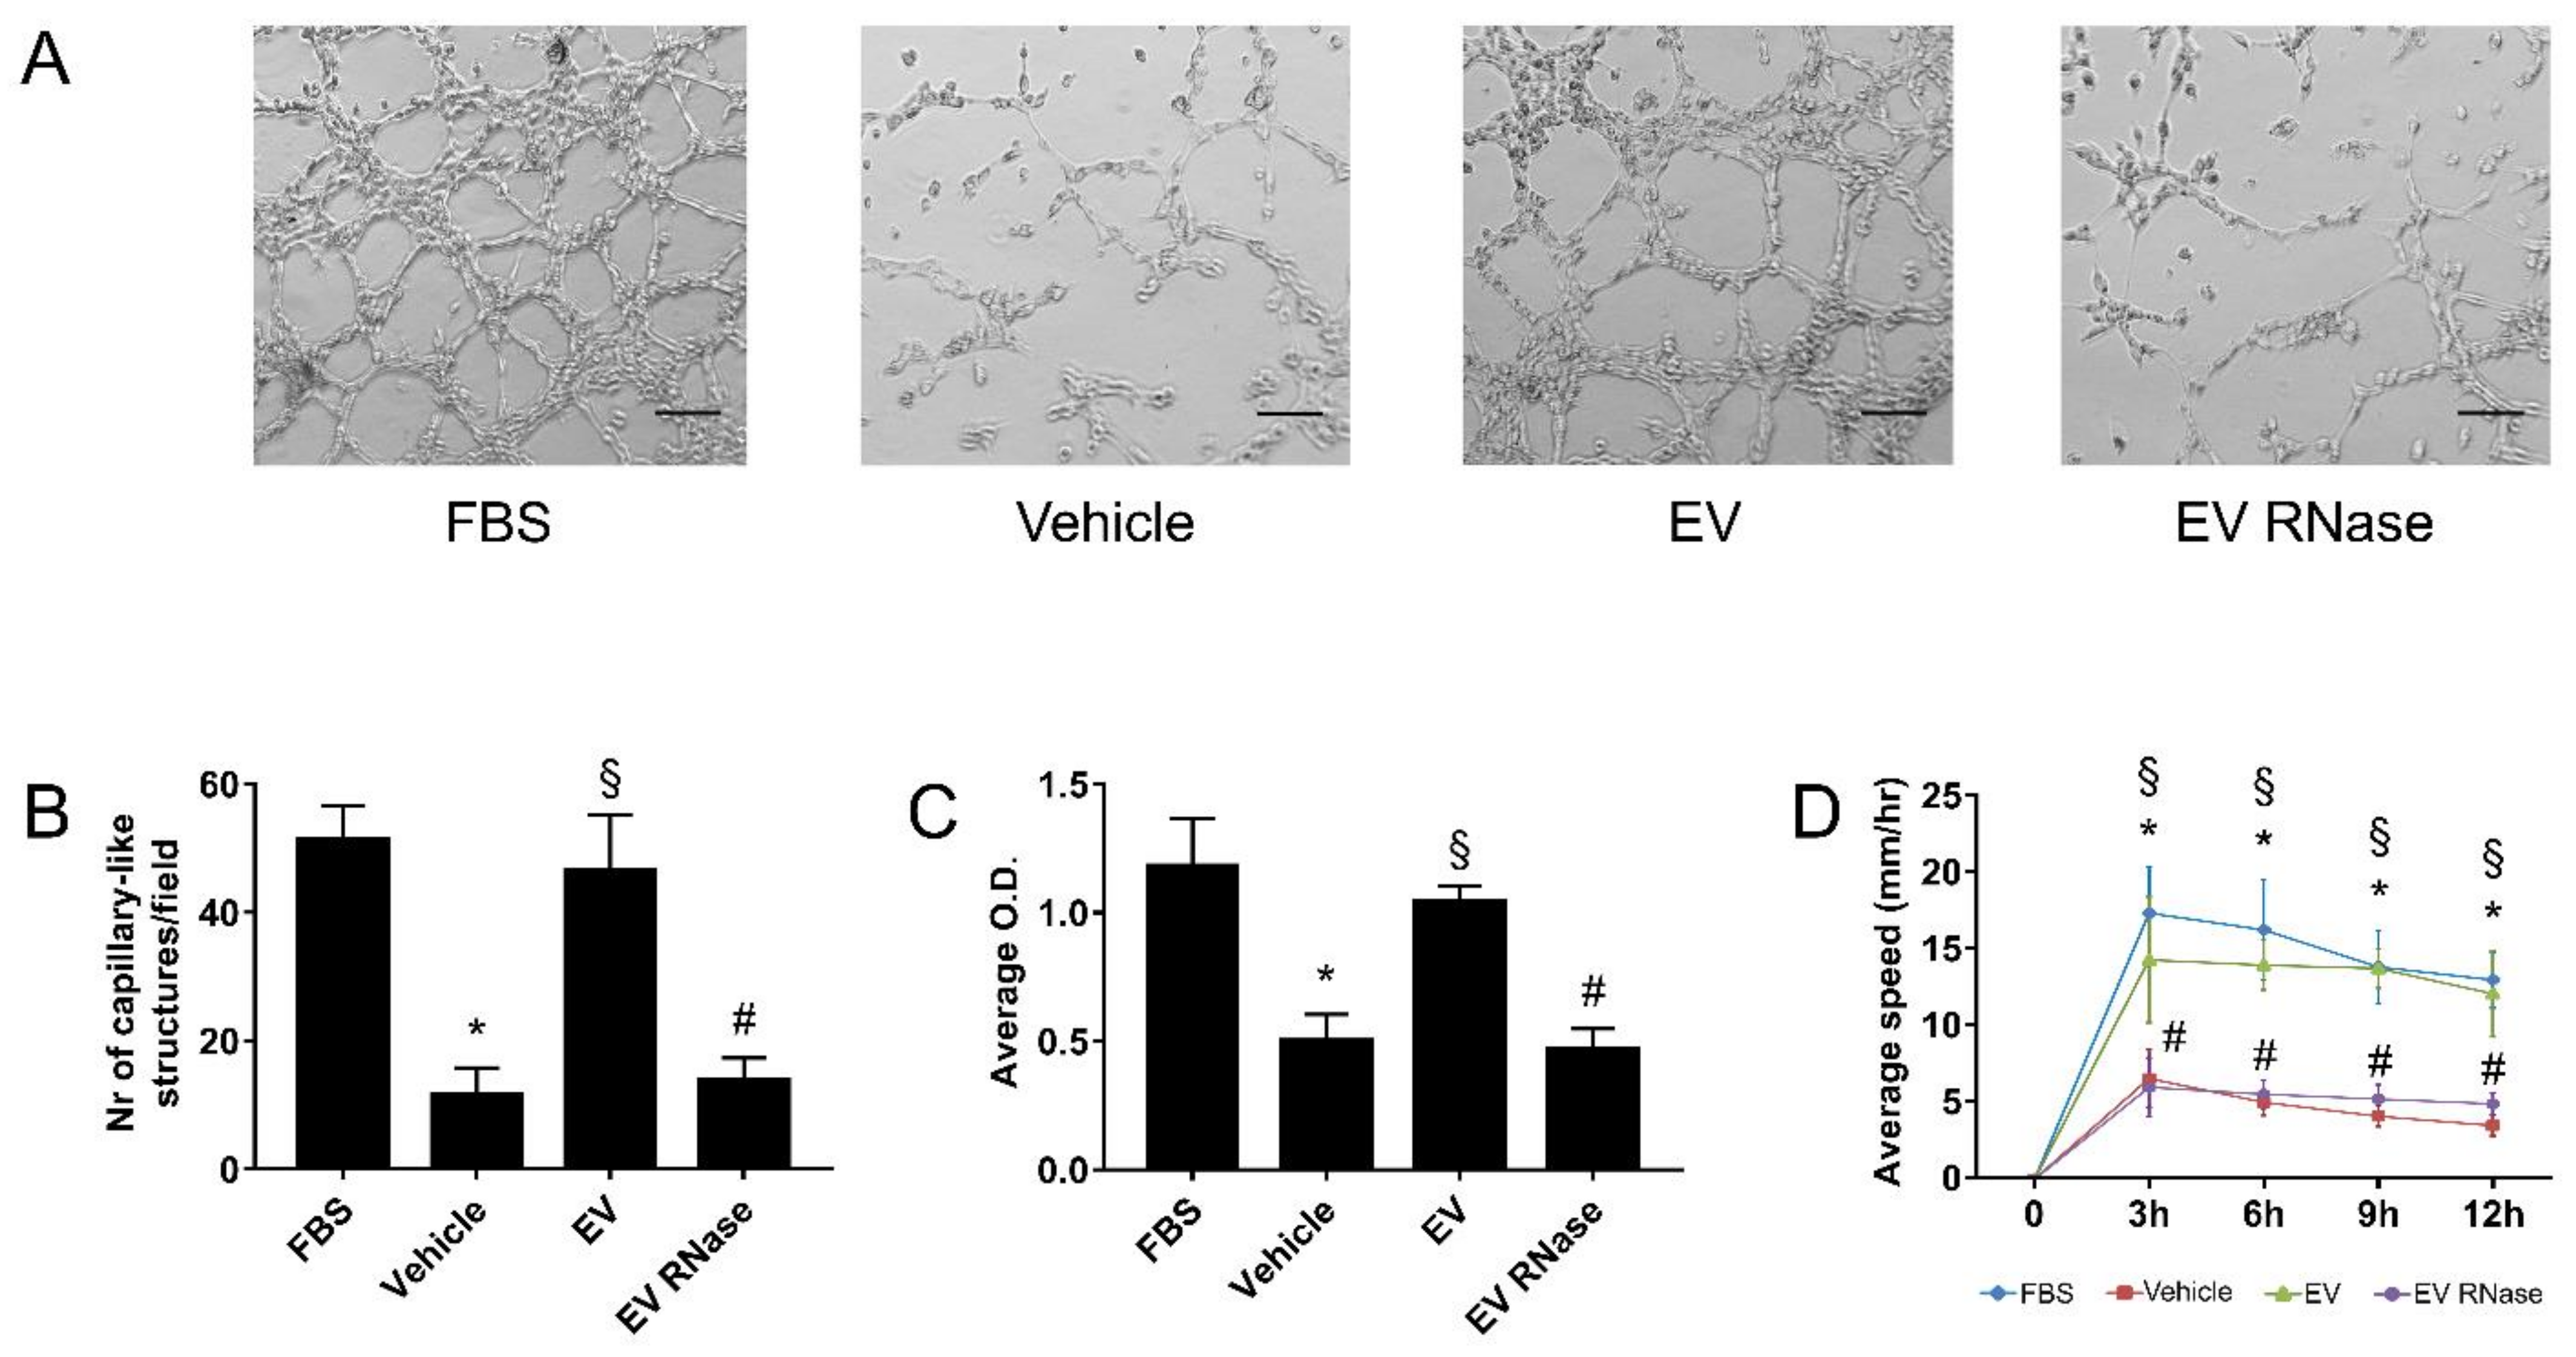
2.5.1. Angiogenesis
2.5.2. Proliferation
2.5.3. Migration
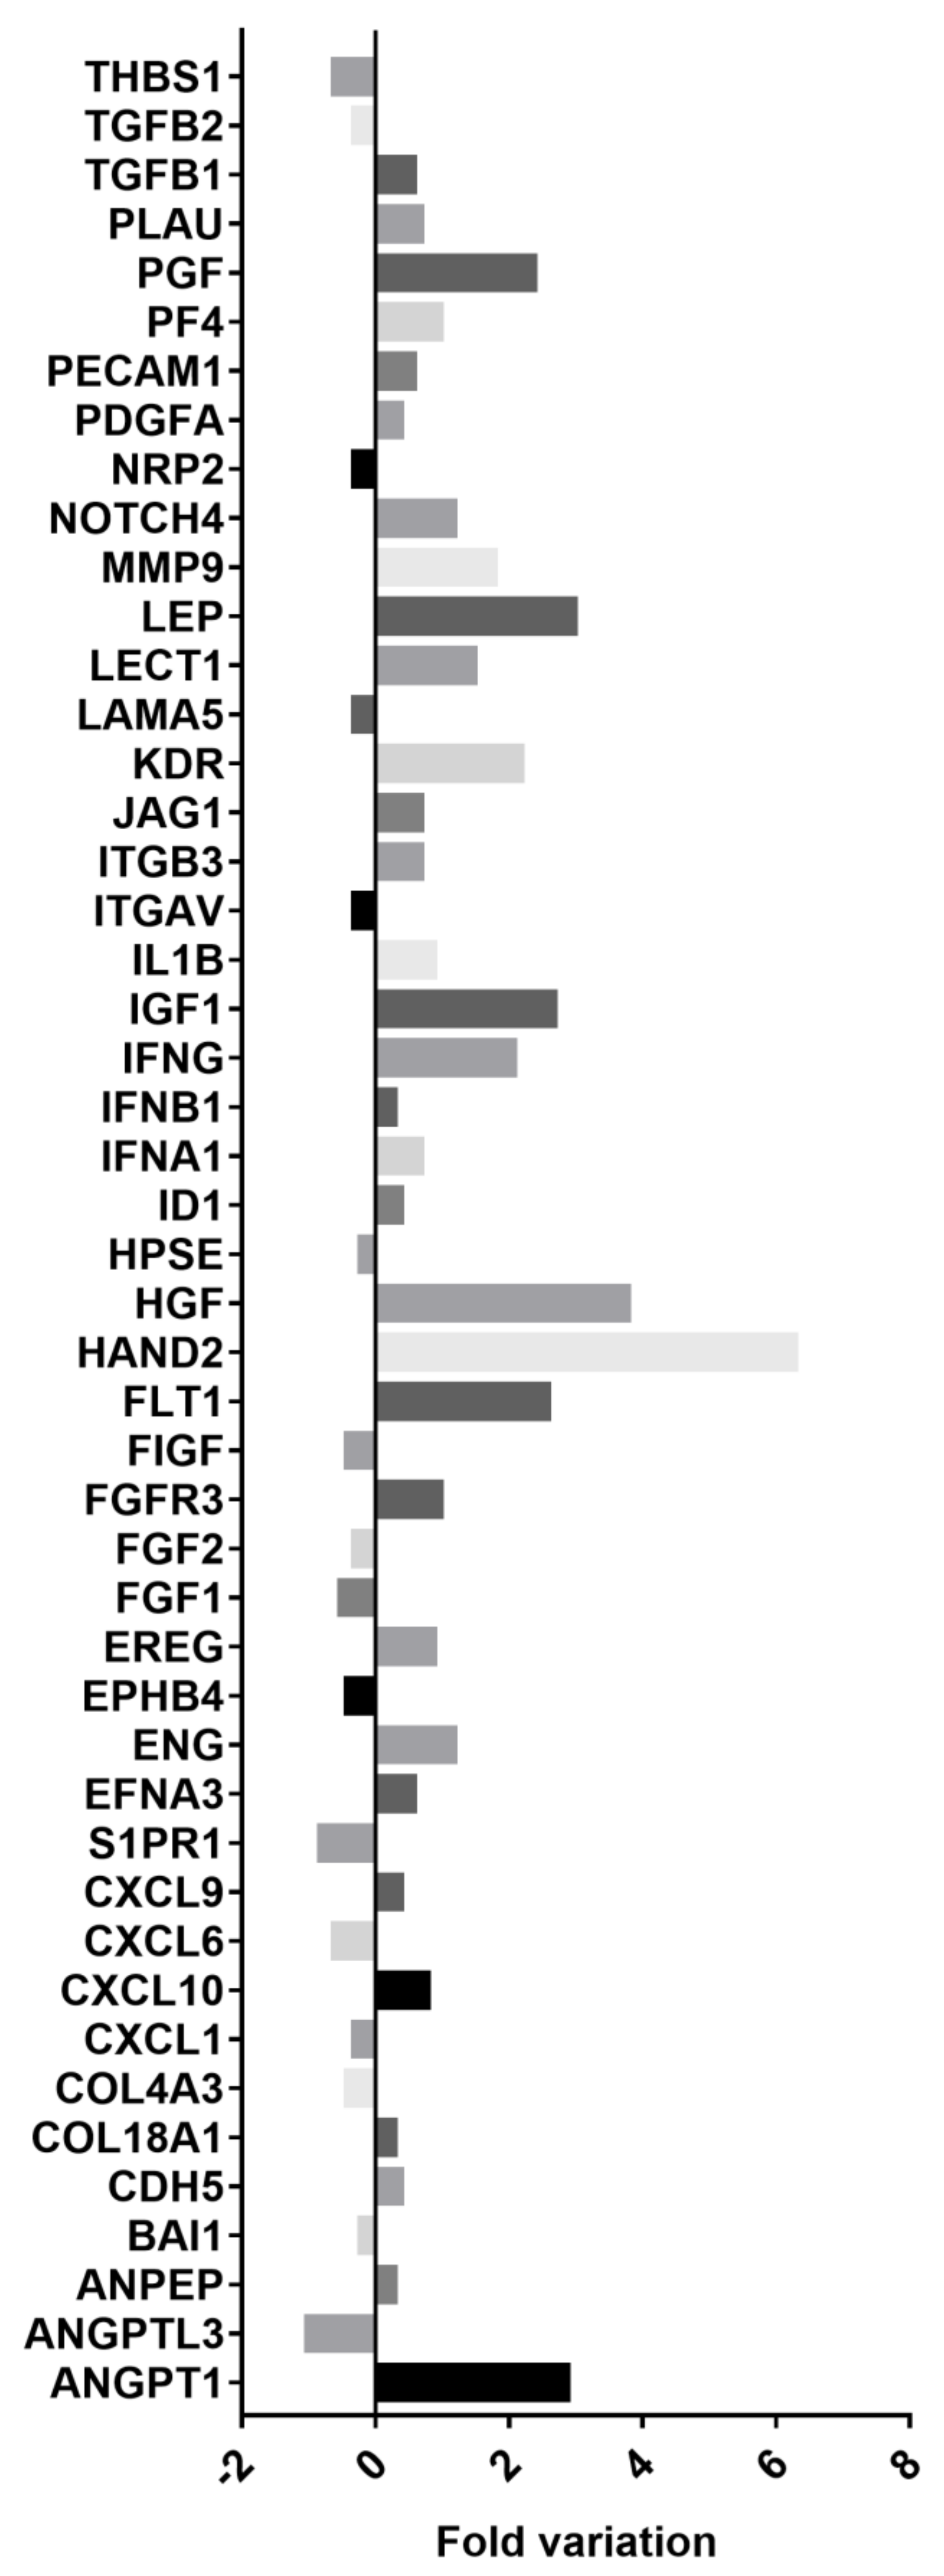
2.5.4. Gene Array Analysis
2.5.5. Prediction of miRNAs- Target Genes Interaction
2.5.6. ELISA
2.5.7. Immunofluorescence Studies
2.5.8. PMN and PBMC Adhesion
2.5.9. FACS Analysis
2.5.10. Cytotoxicity Assay
2.5.11. Apoptosis
2.5.12. Reactive Oxygen Species (ROS) Detection Assay
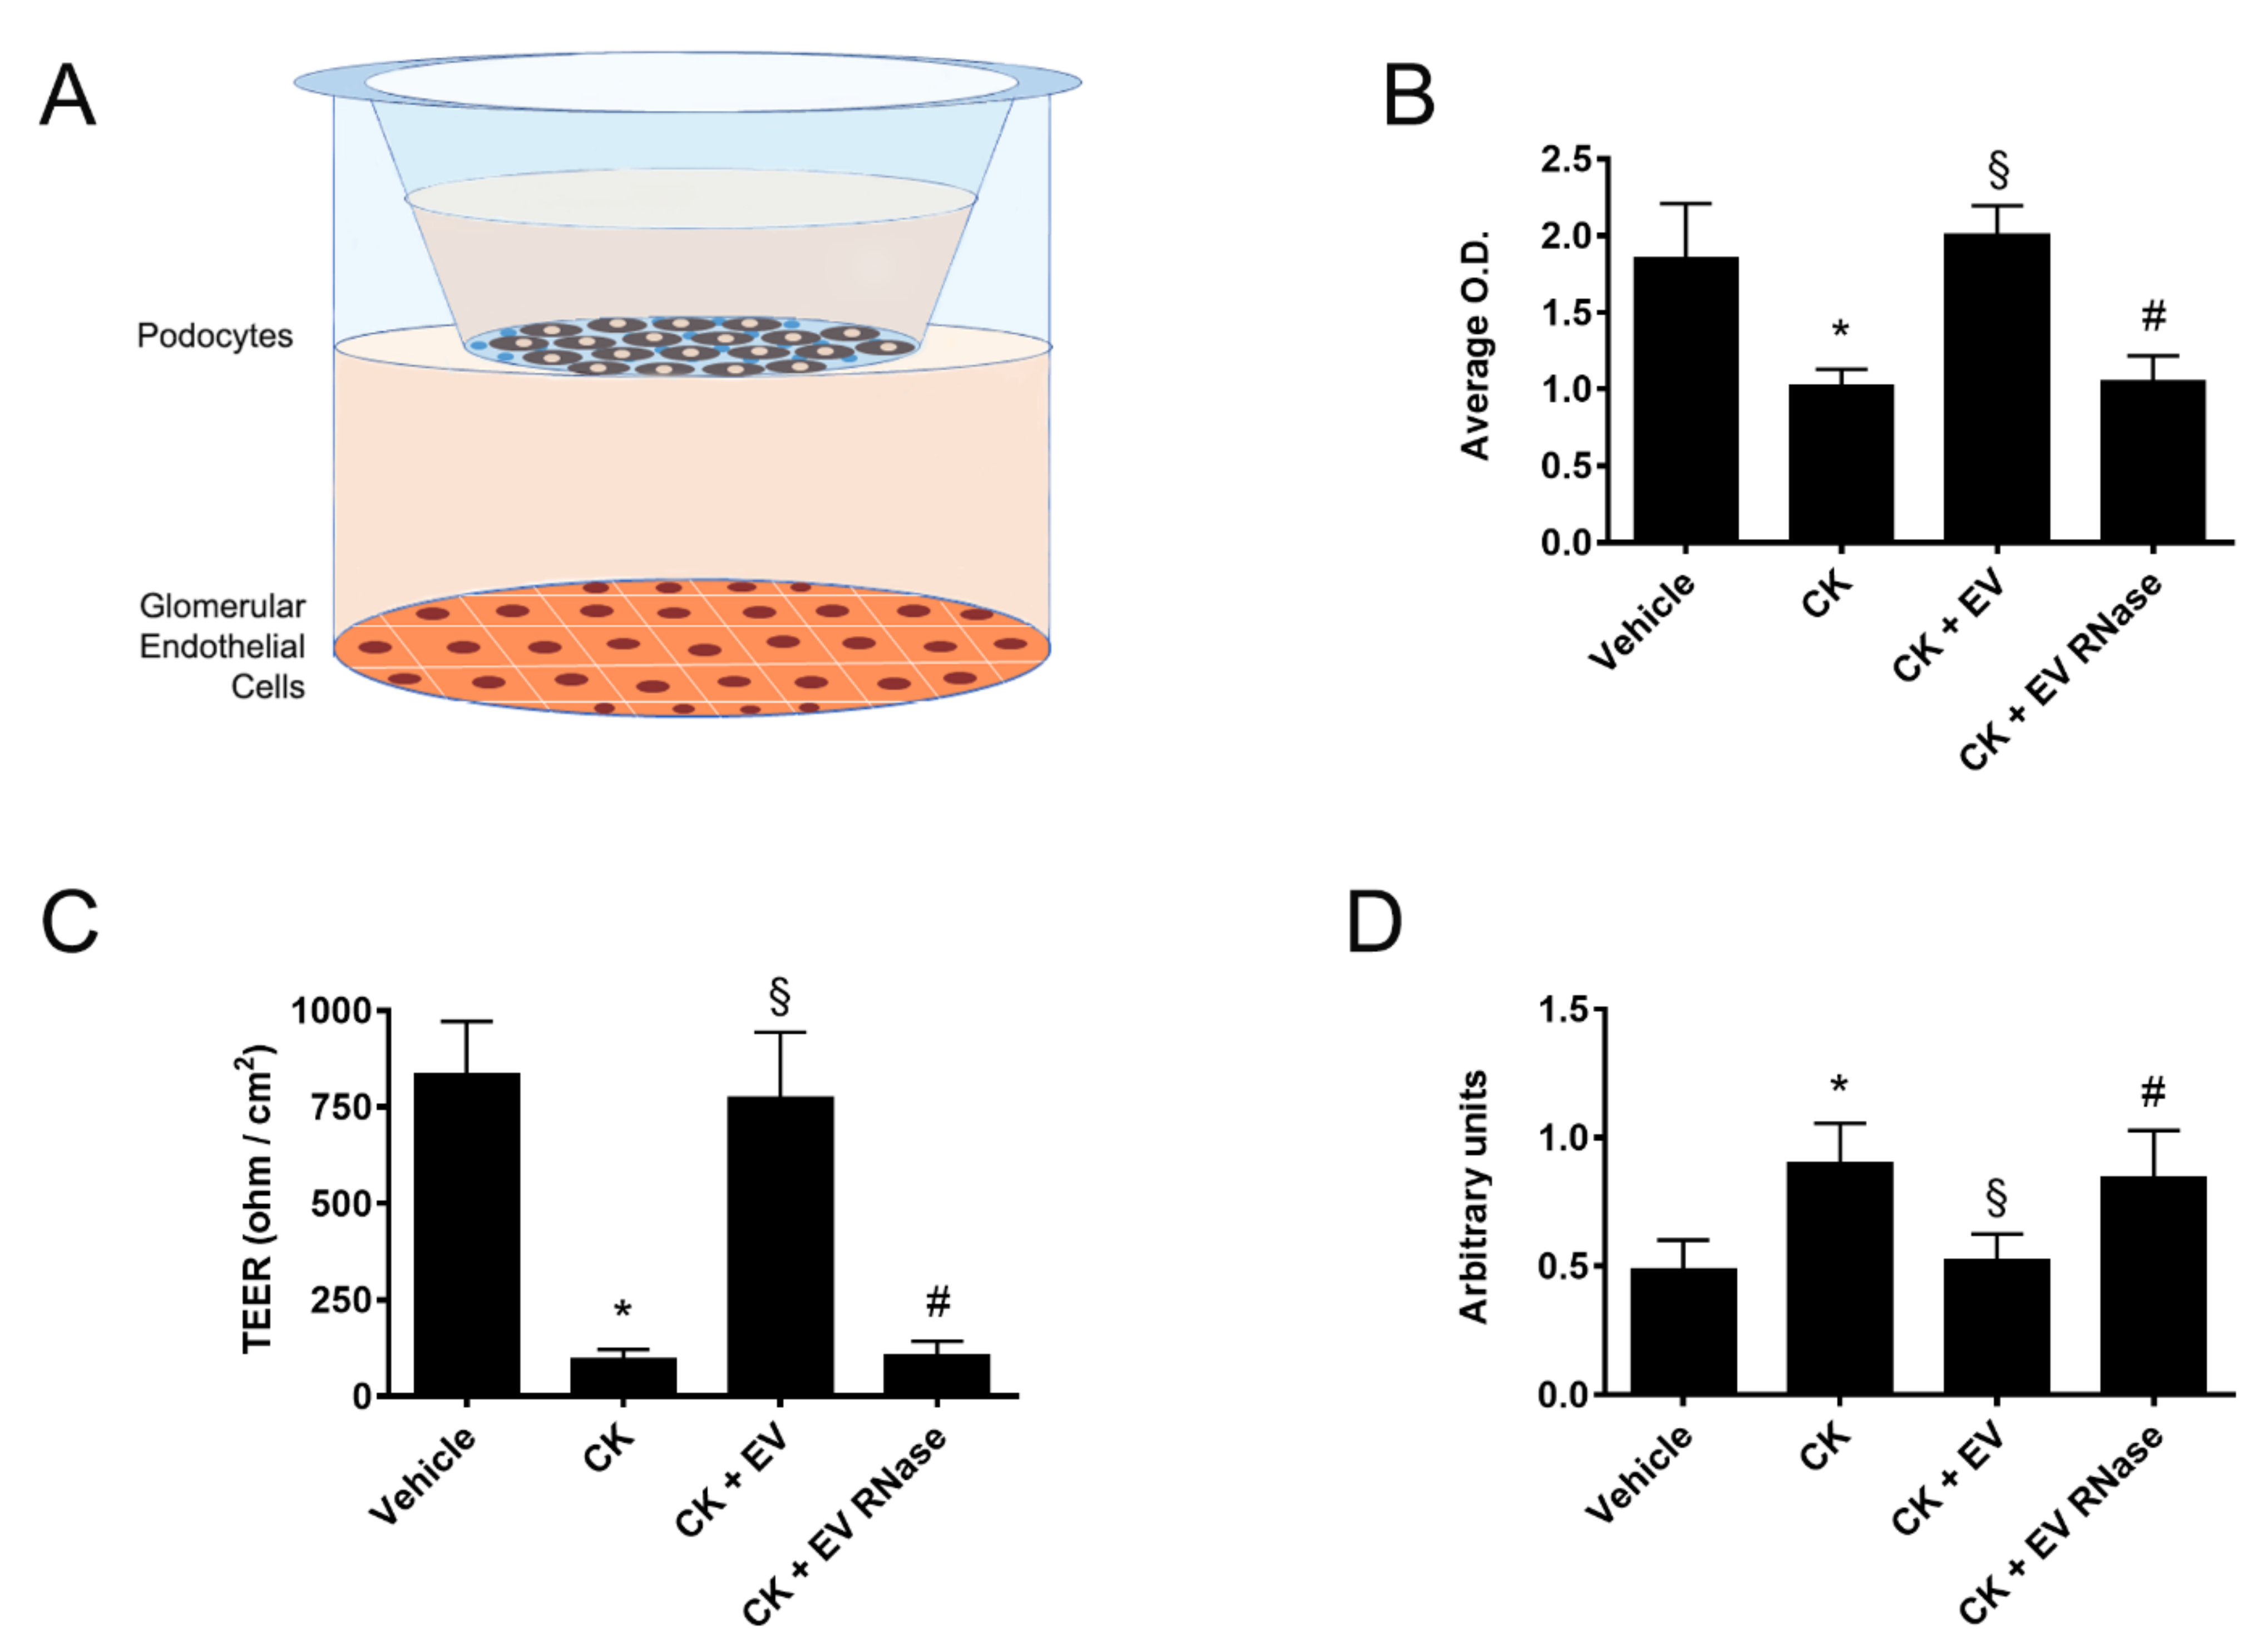
2.5.13. Co-Culture of GECs and Podocytes
2.6. Statistical Analysis
3. Results
3.1. Internalization of EPC-Derived EVs in Human Glomerular Cells
3.2. Effects of RNase Pre-Treatment of EPC-Derived EVs on Internalization in GECs and Podocytes
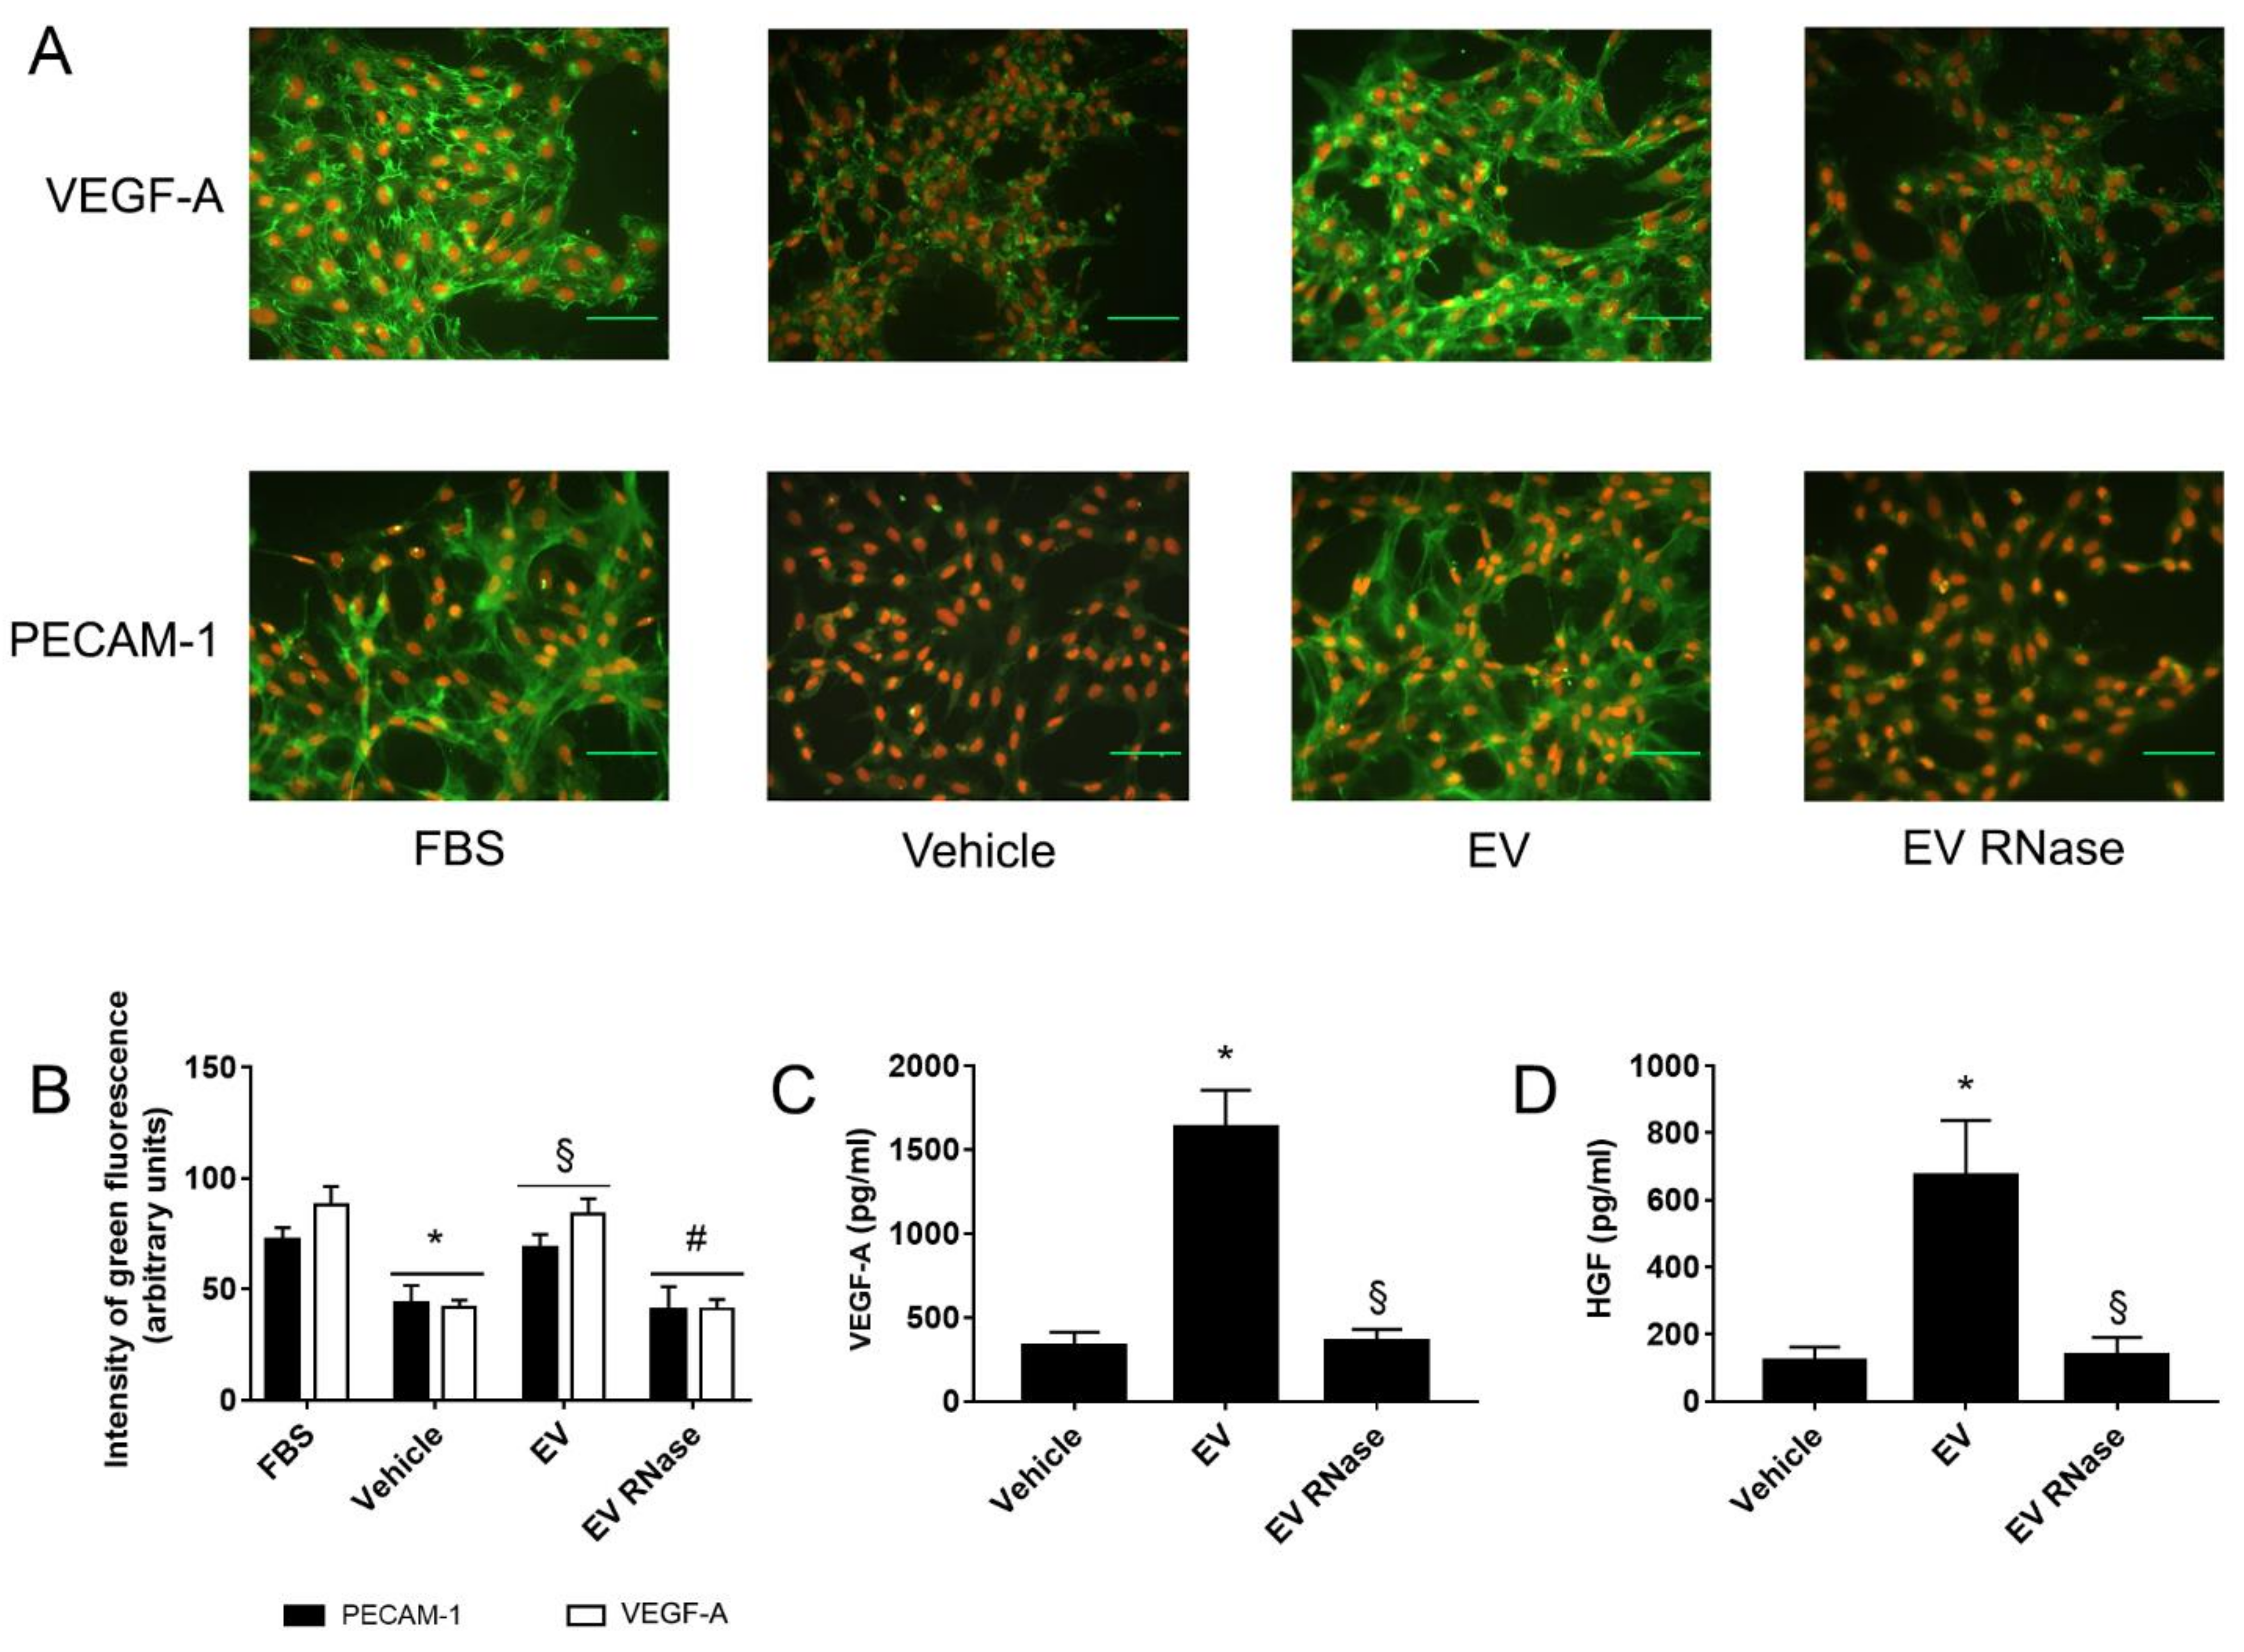
3.3. EPC-Derived EVs Triggered GEC Angiogenesis
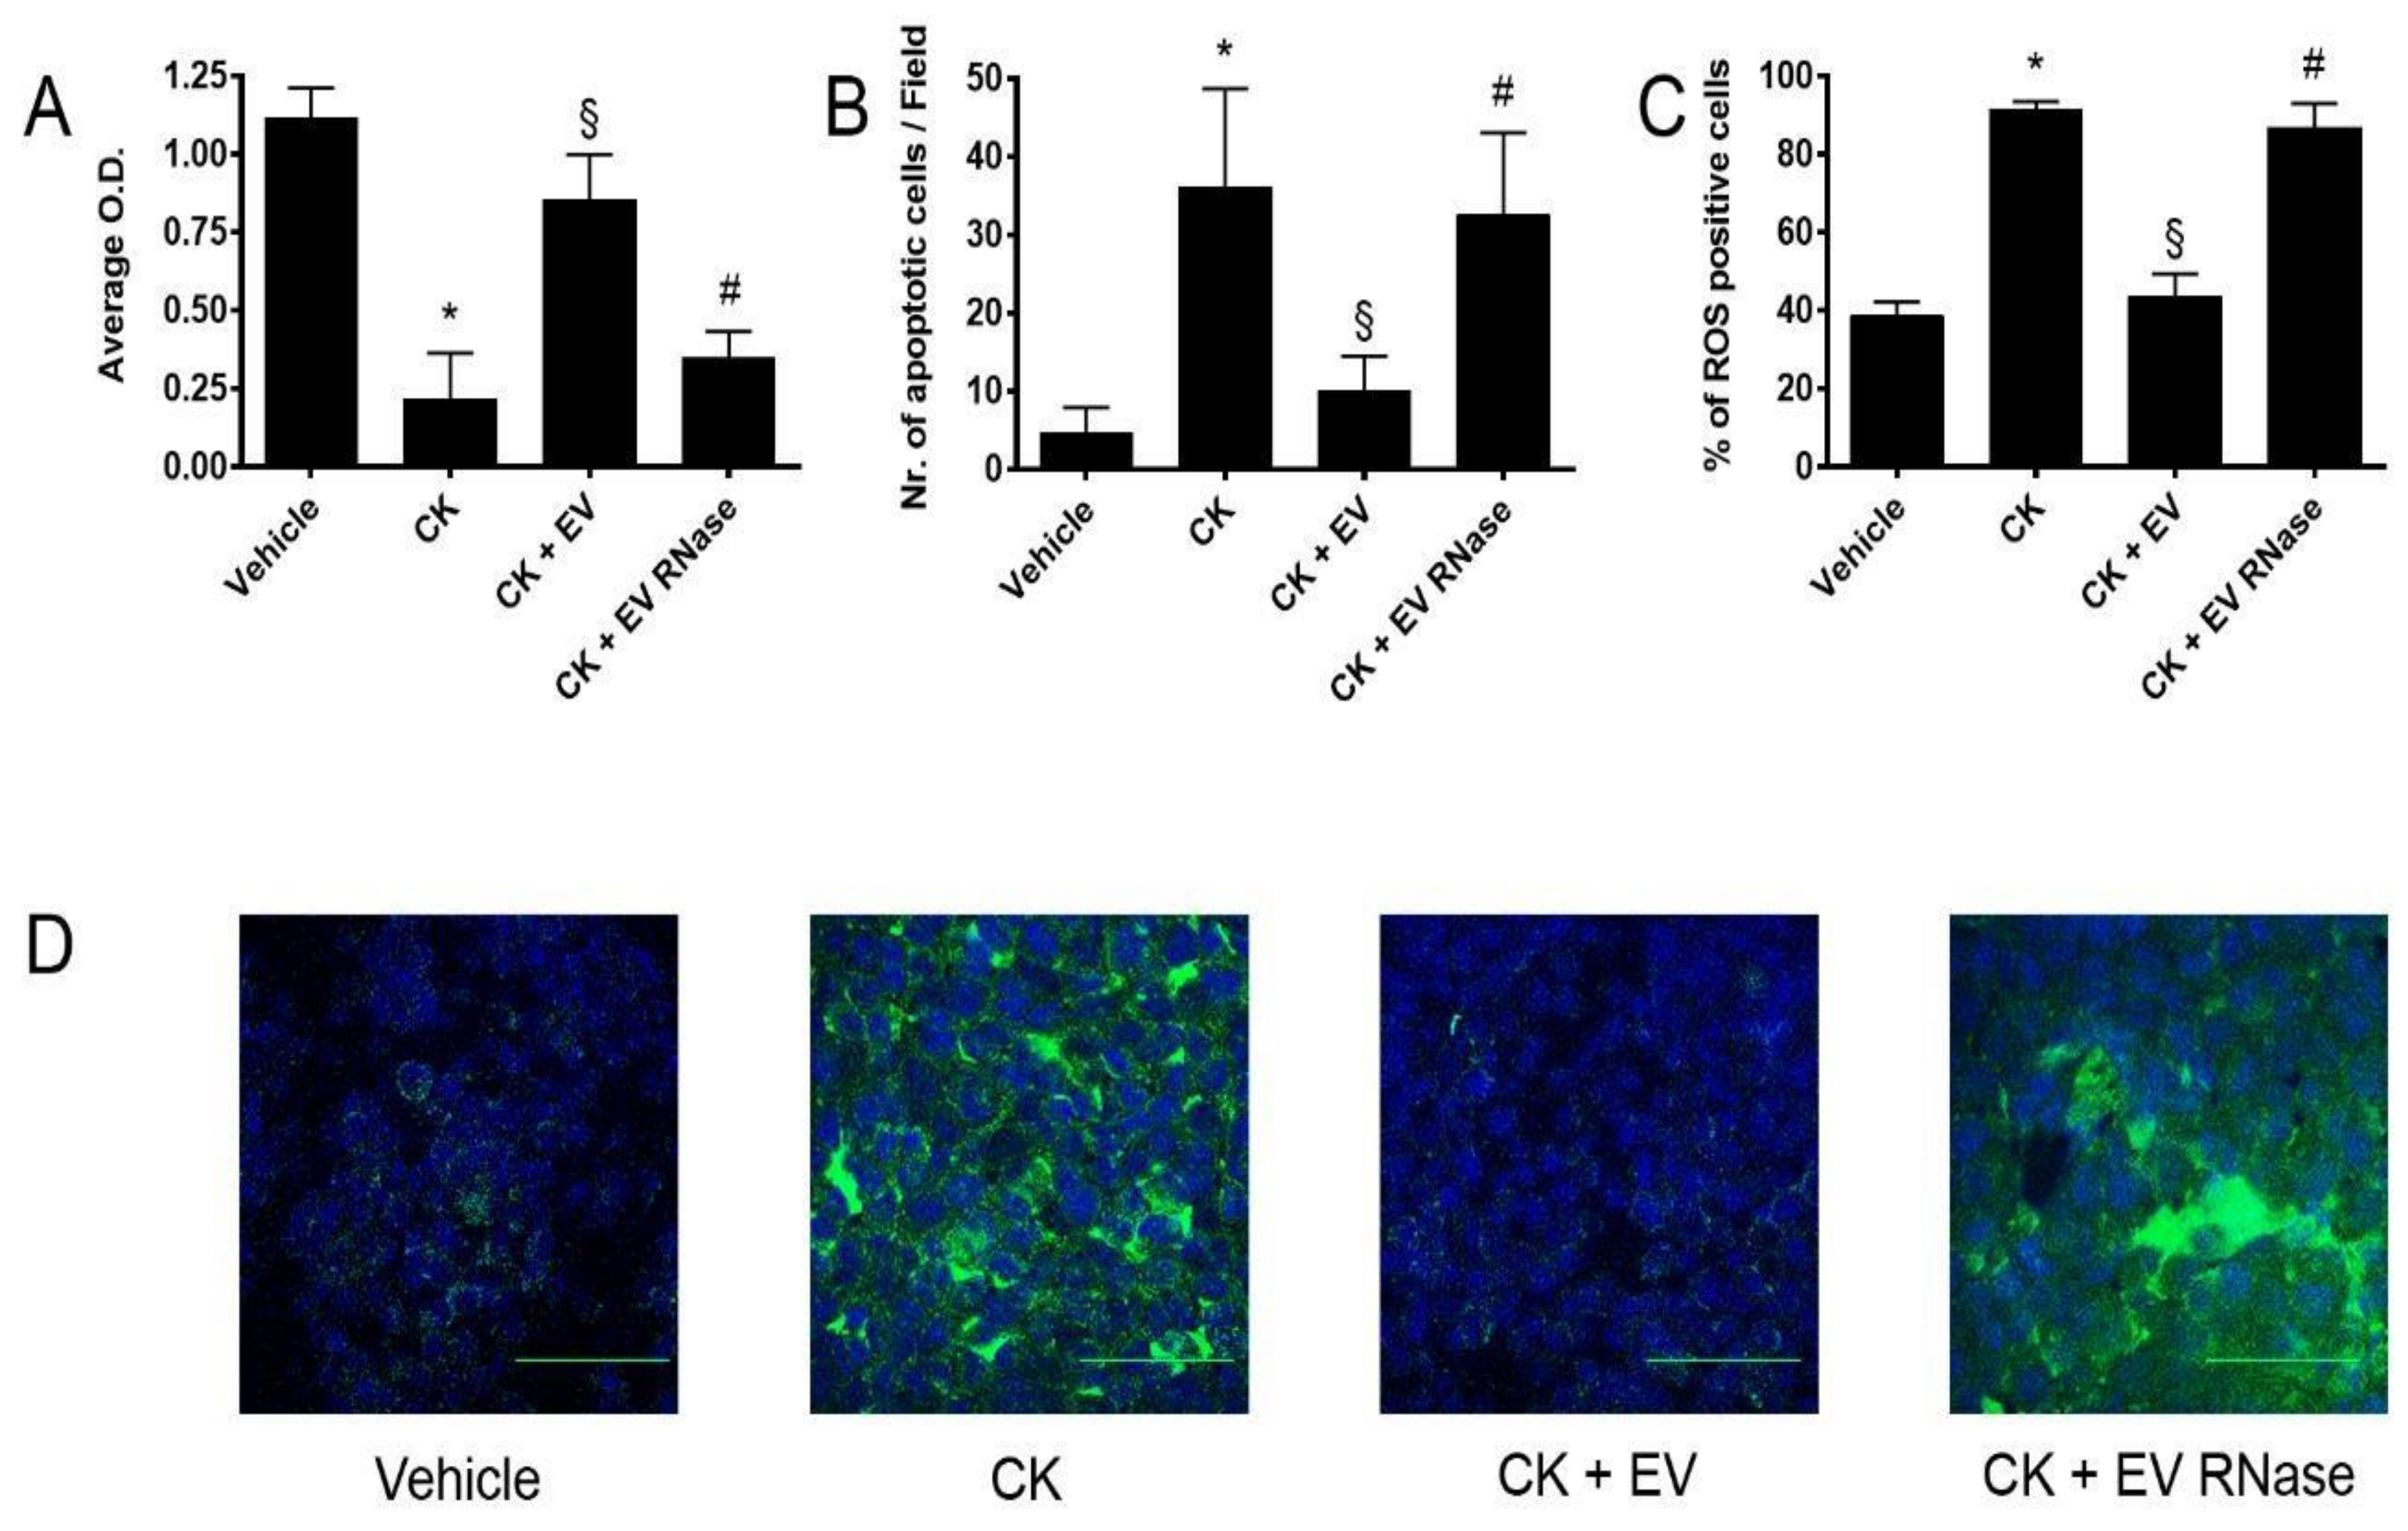
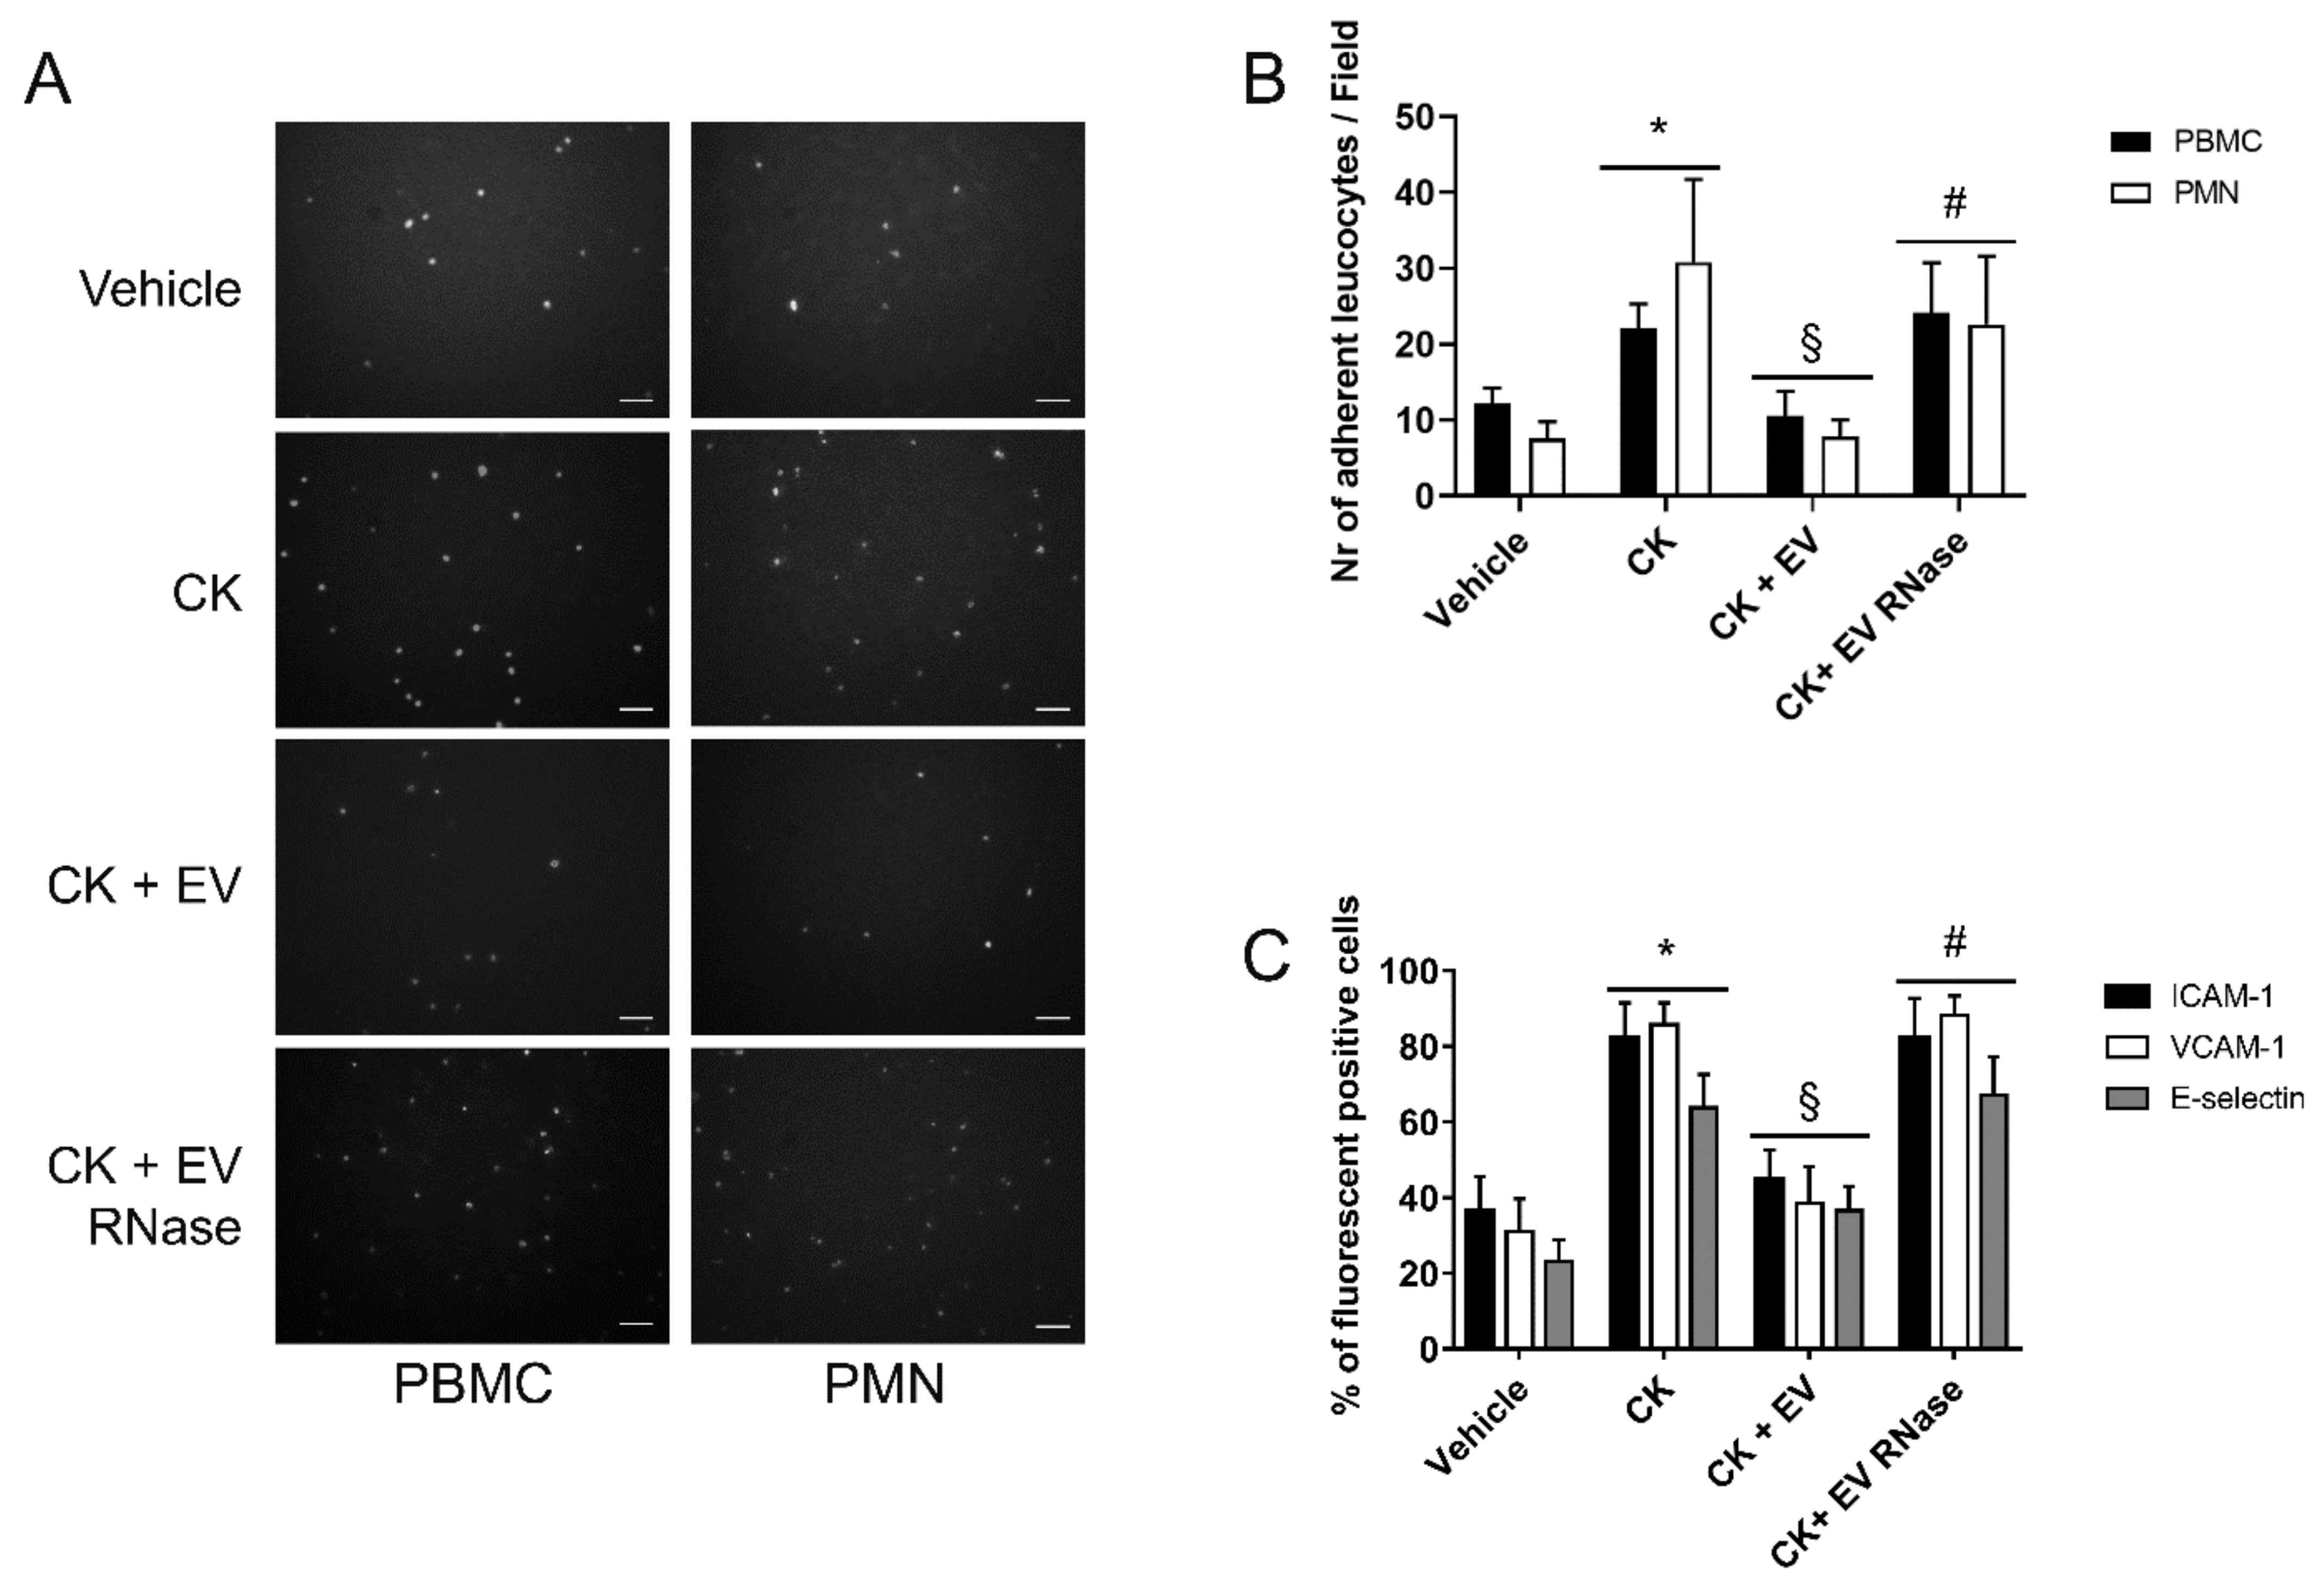
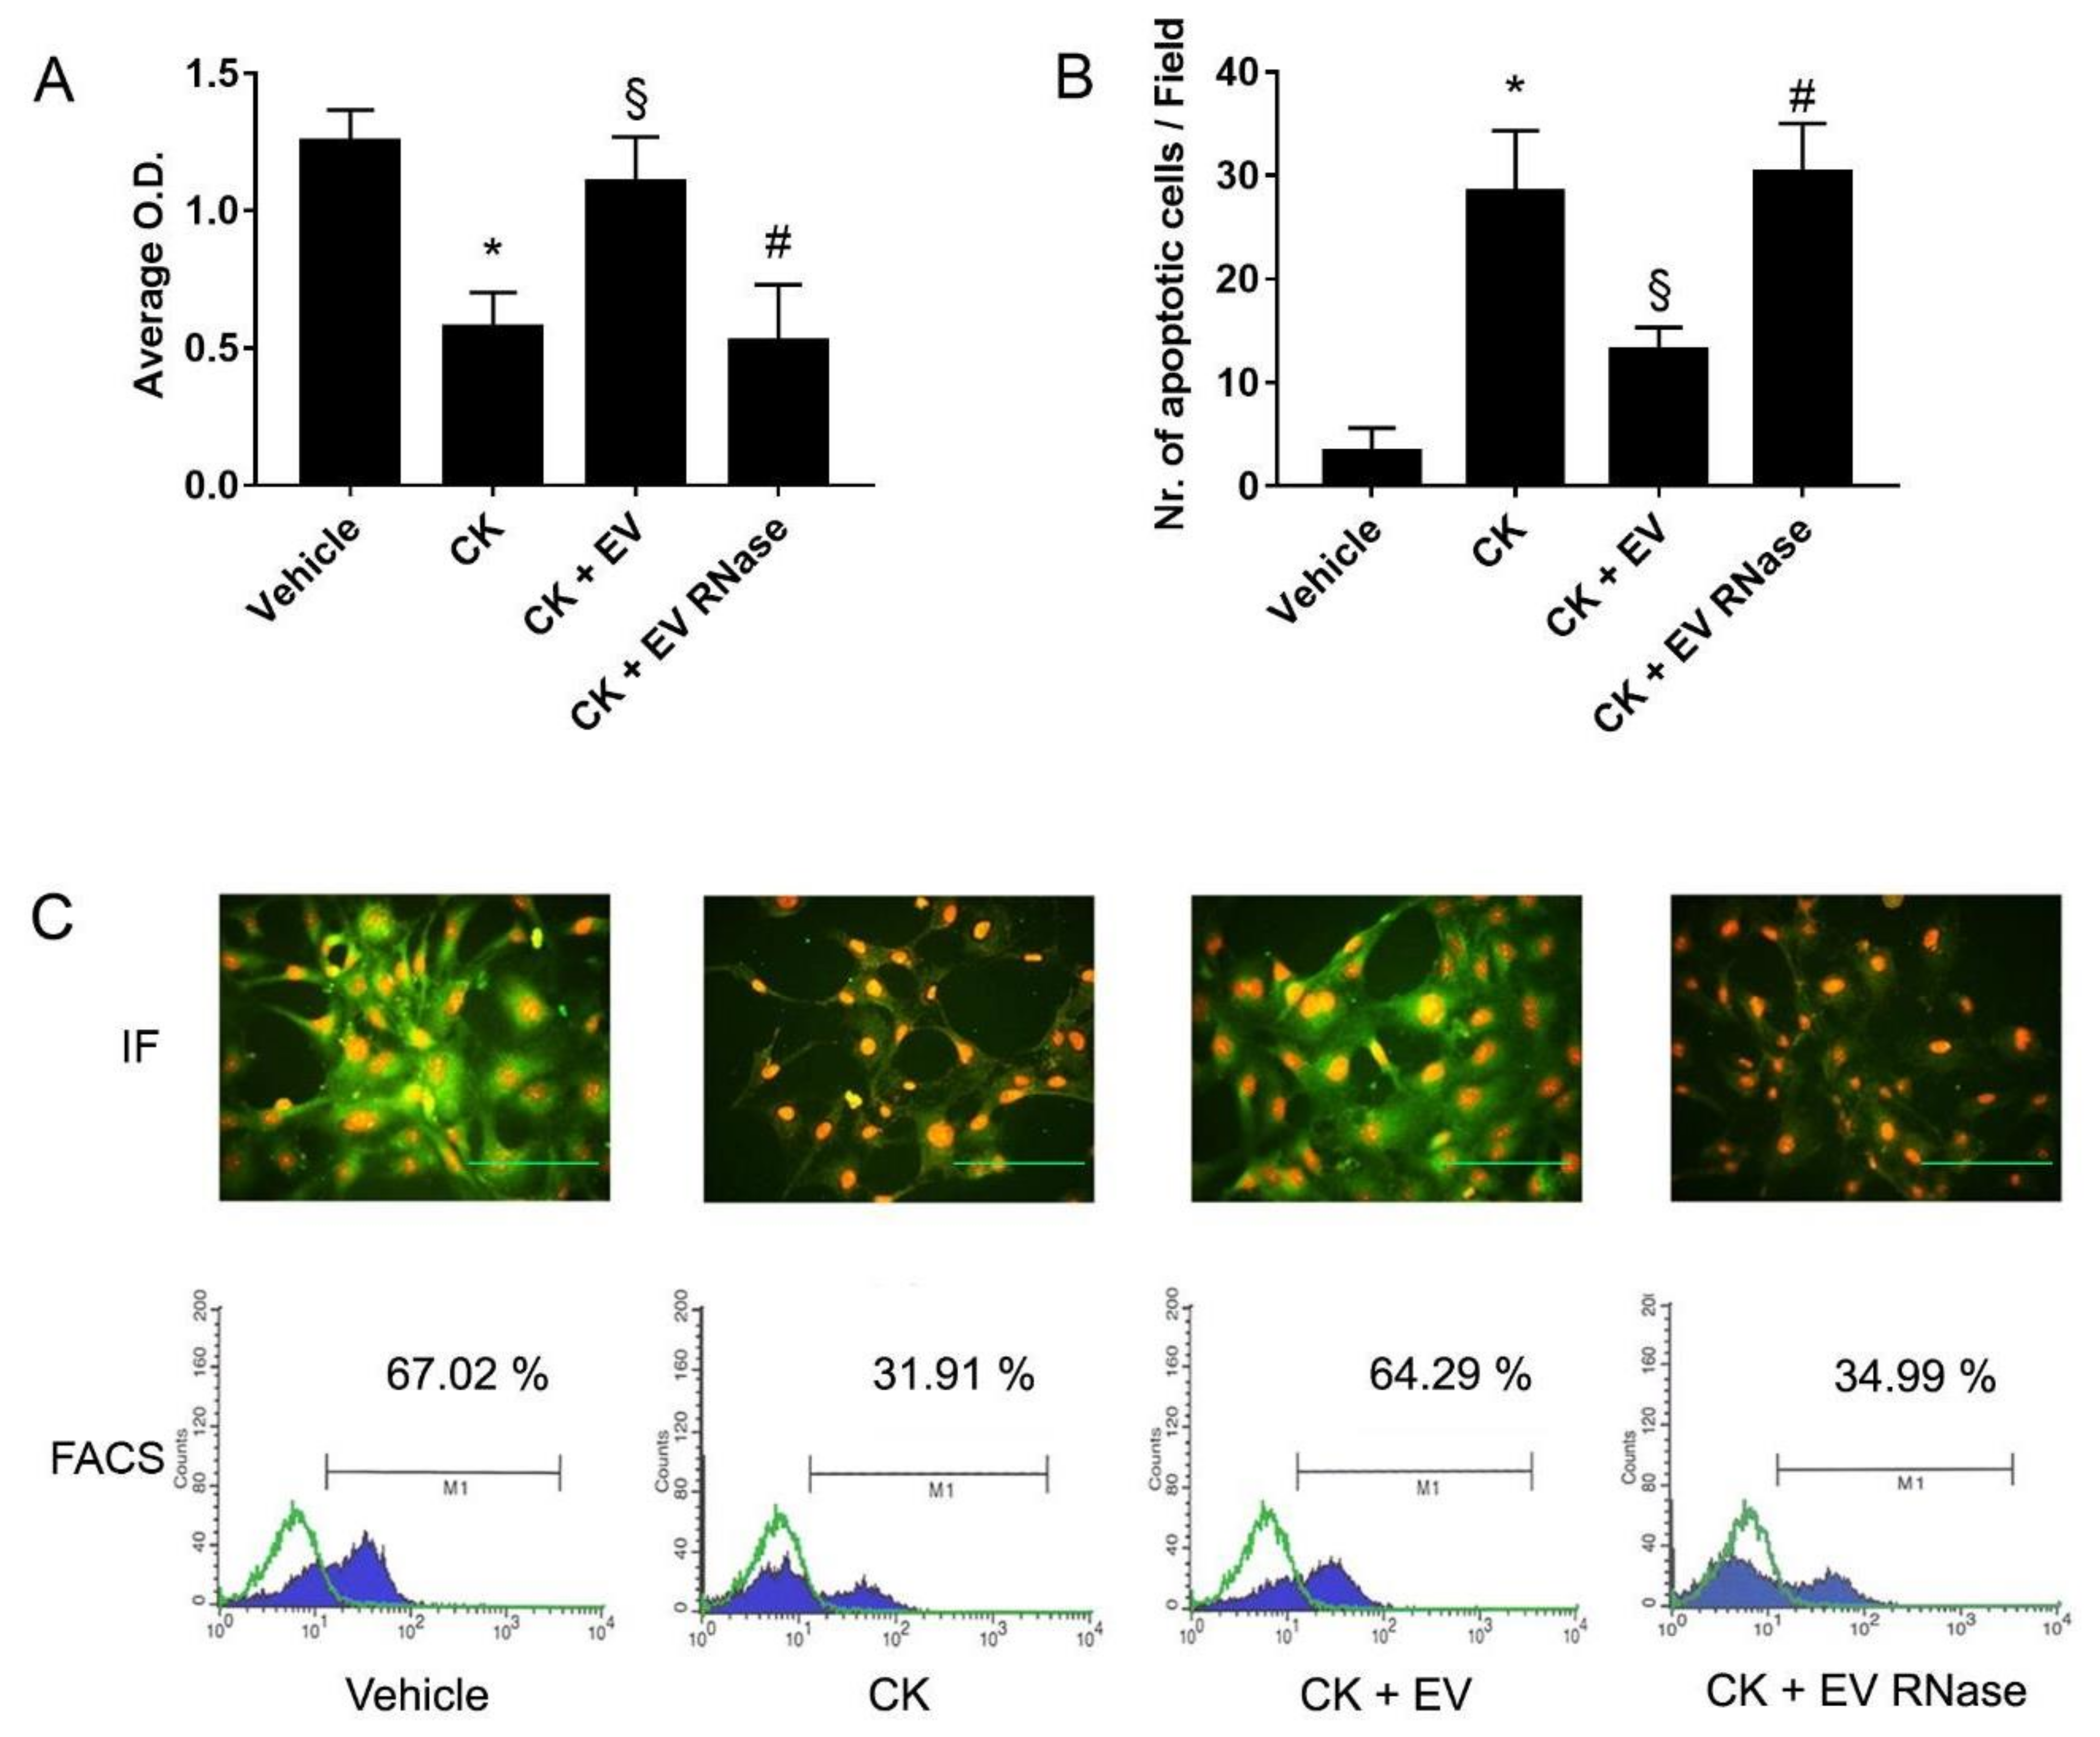
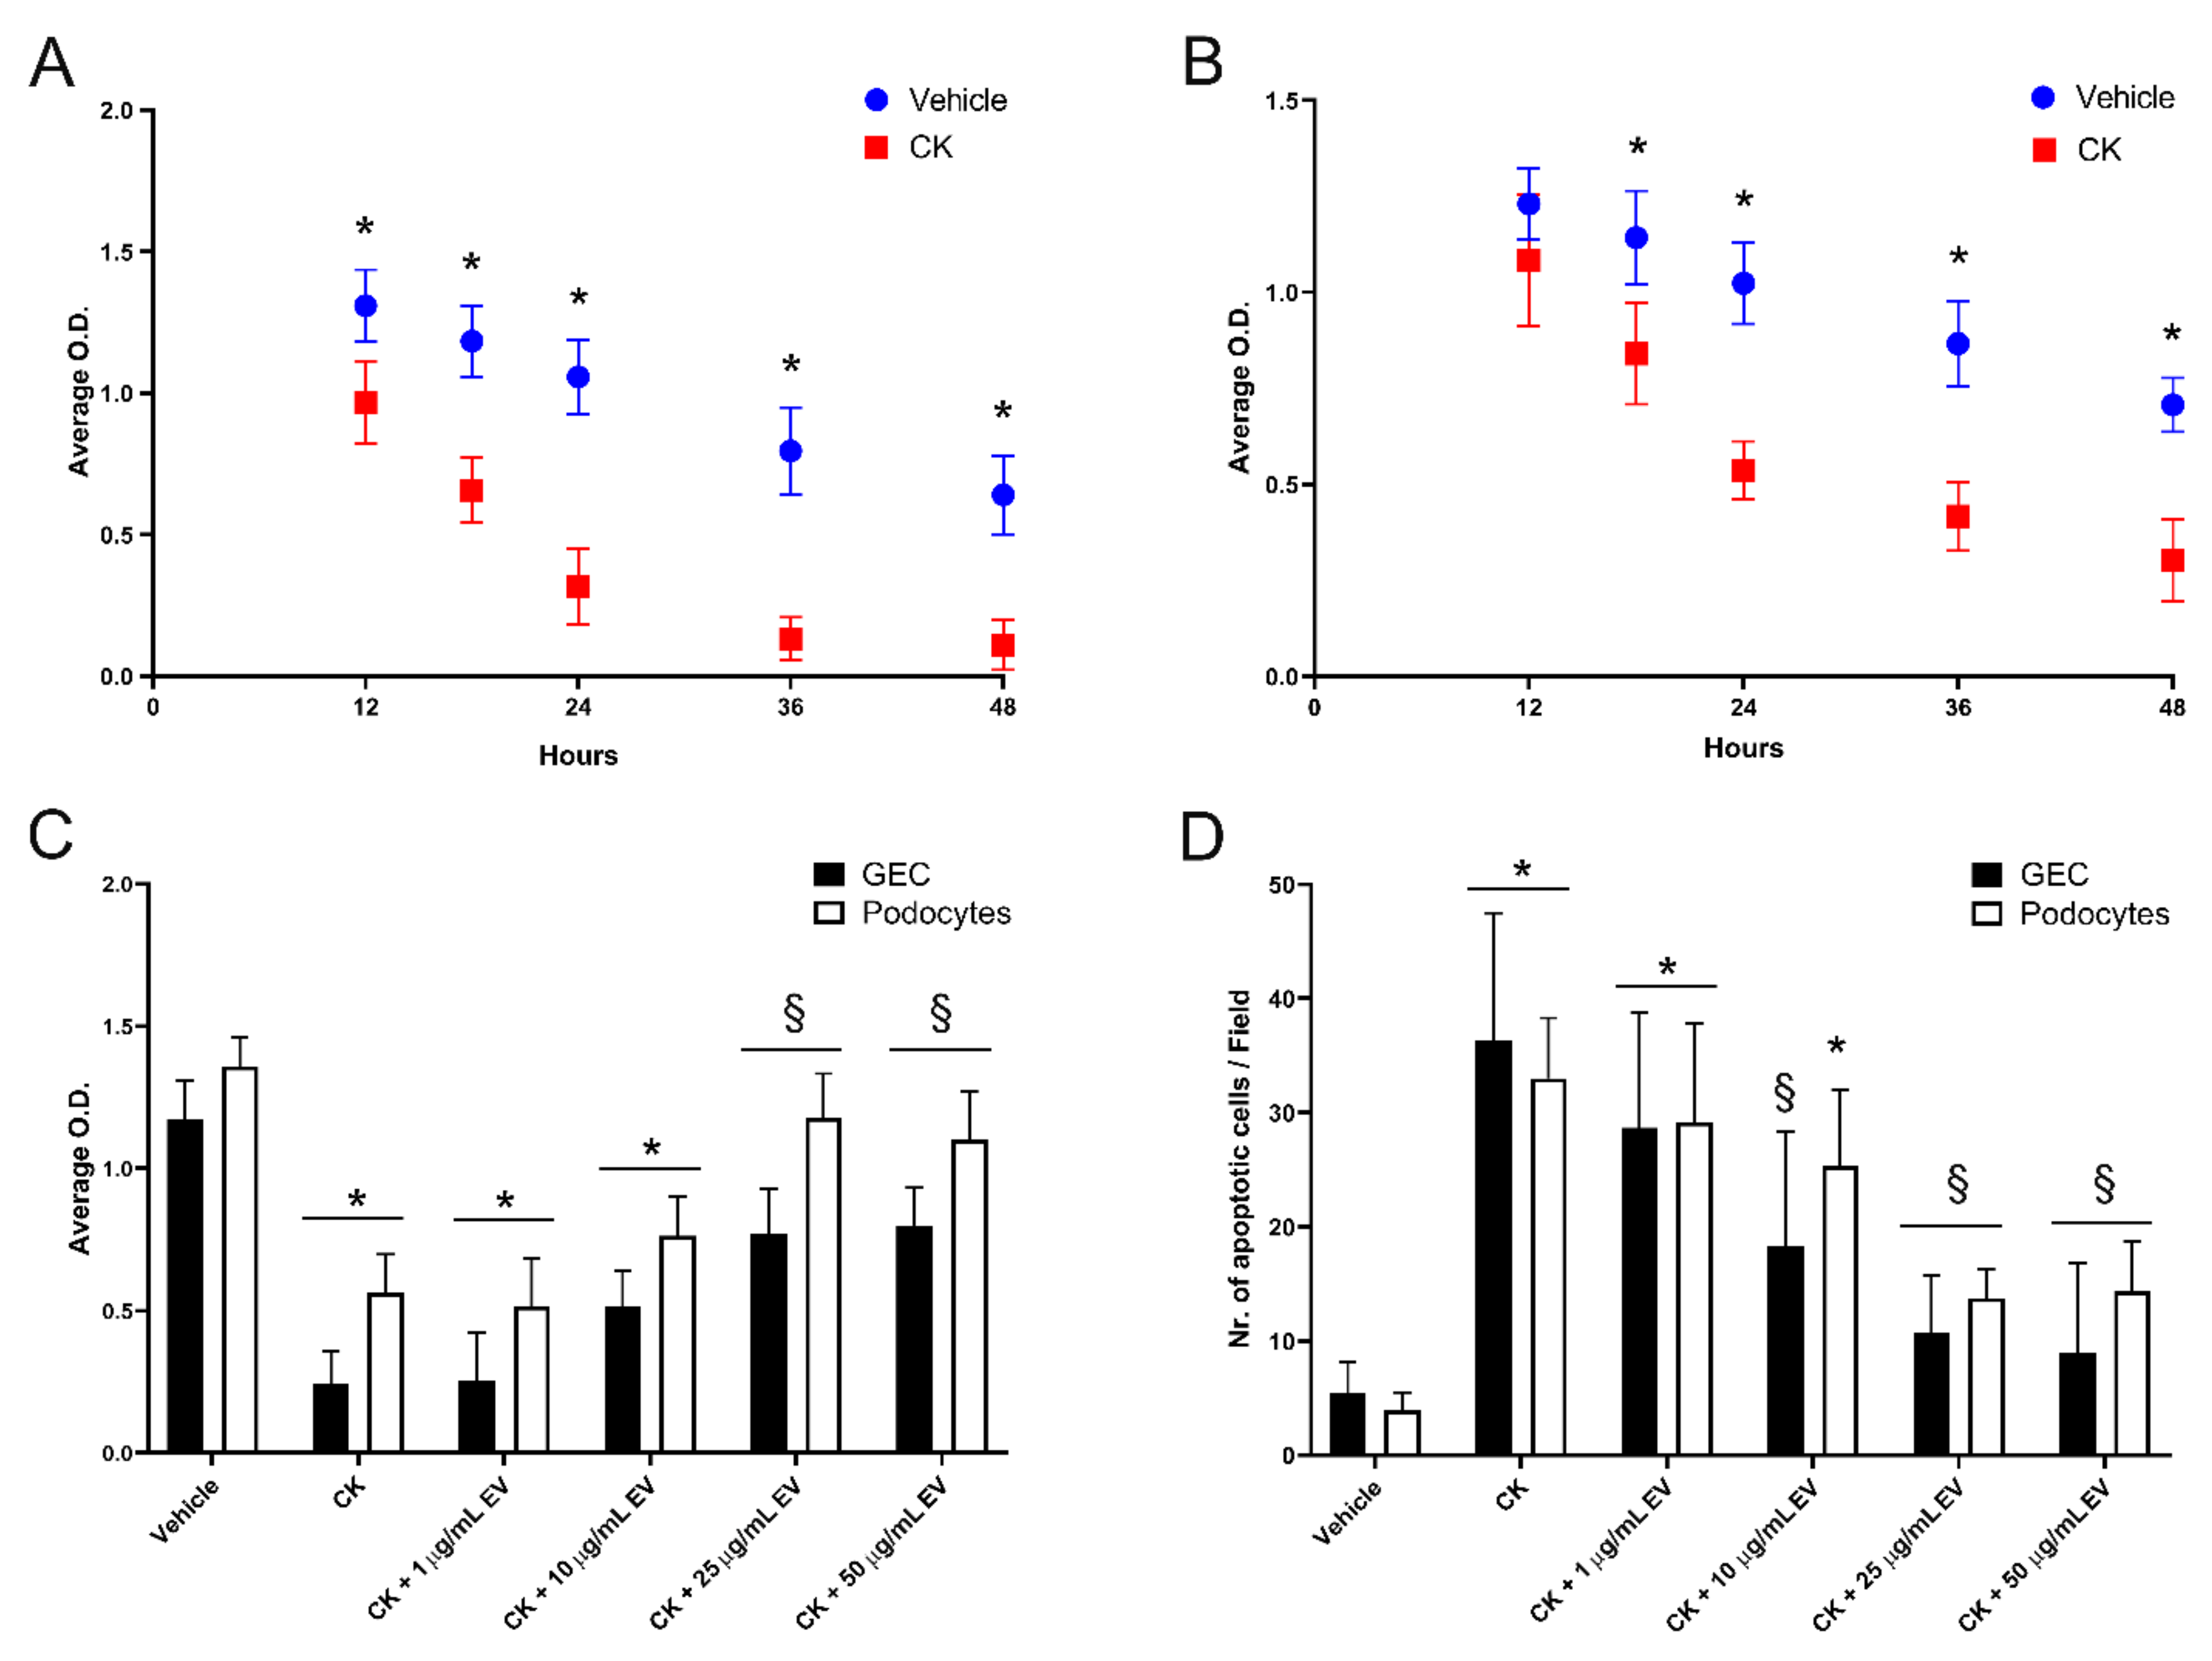
3.4. EPC-Derived EVs Protect GECs and Podocytes from Complement- and Cytokine-Mediated Injury
3.5. Protective Role of EPC-Derived EVs in a GEC-Podocyte Co-Culture Model Mimicking GFB
4. Discussion
5. Conclusions
Author Contributions
Funding
Institutional Review Board Statement
Informed Consent Statement
Data Availability Statement
Acknowledgments
Conflicts of Interest
Abbreviations
| ANOVA | analysis of variance CK, cytokines |
| DMEM | Dulbecco’s modified Eagle medium |
| EBM | endothelial cell growth basal medium |
| EDTA | ethylenediaminetetraacetic acid |
| EPC | endothelial progenitor cells |
| EV | extracellular vesicle |
| FBS | fetal bovine serum |
| GEC | glomerular endothelial cells |
| GBM | glomerular basement membrane |
| GFB | glomerular filtration barrier |
| HGF | hepatocyte growth factor |
| ICAM-1 | intercellular adhesion molecule 1 |
| IL-6 | interleukin-6 |
| lncRNA | long non-coding RNA |
| miRNA | microRNA |
| PBMC | peripheral blood mononuclear cells |
| PECAM-1 | platelet endothelial cell adhesion molecule-1 |
| PMNs | polymorphonuclear neutrophils |
| qRT-PCR | quantitative real-time PCR |
| RECA-1 | endothelial cell antigen, rat |
| ROS | reactive oxygen species |
| TEER | transepithelial electrical resistance |
| TNF-α | tumor necrosis factor-α |
| TUNEL | Terminal deoxynucleotidyl transferase dUTP nick end labeling |
| UEA-1 | Ulex Europaeus Agglutinin-1 |
| VCAM-1 | vascular cell adhesion molecule 1 |
| VEGF | vascular endothelial growth factor |
| VEGFR-2 | vascular endothelial growth factor receptor-2 |
| XTT | 2,3-Bis-(2-Methoxy-4-Nitro-5-Sulfophenyl)-2H-Tetrazolium-5-Carboxanilide. |
Appendix A. Materials and Methods
Appendix A.1. FACS Analysis
Appendix A.2. Quantitative RT-PCR
Appendix A.3. Cytotoxicity Assay
Appendix A.4. Apoptosis
Appendix B. Results
Appendix B.1. Human Glomerular Cells Express L-Selectin Ligands In Vitro

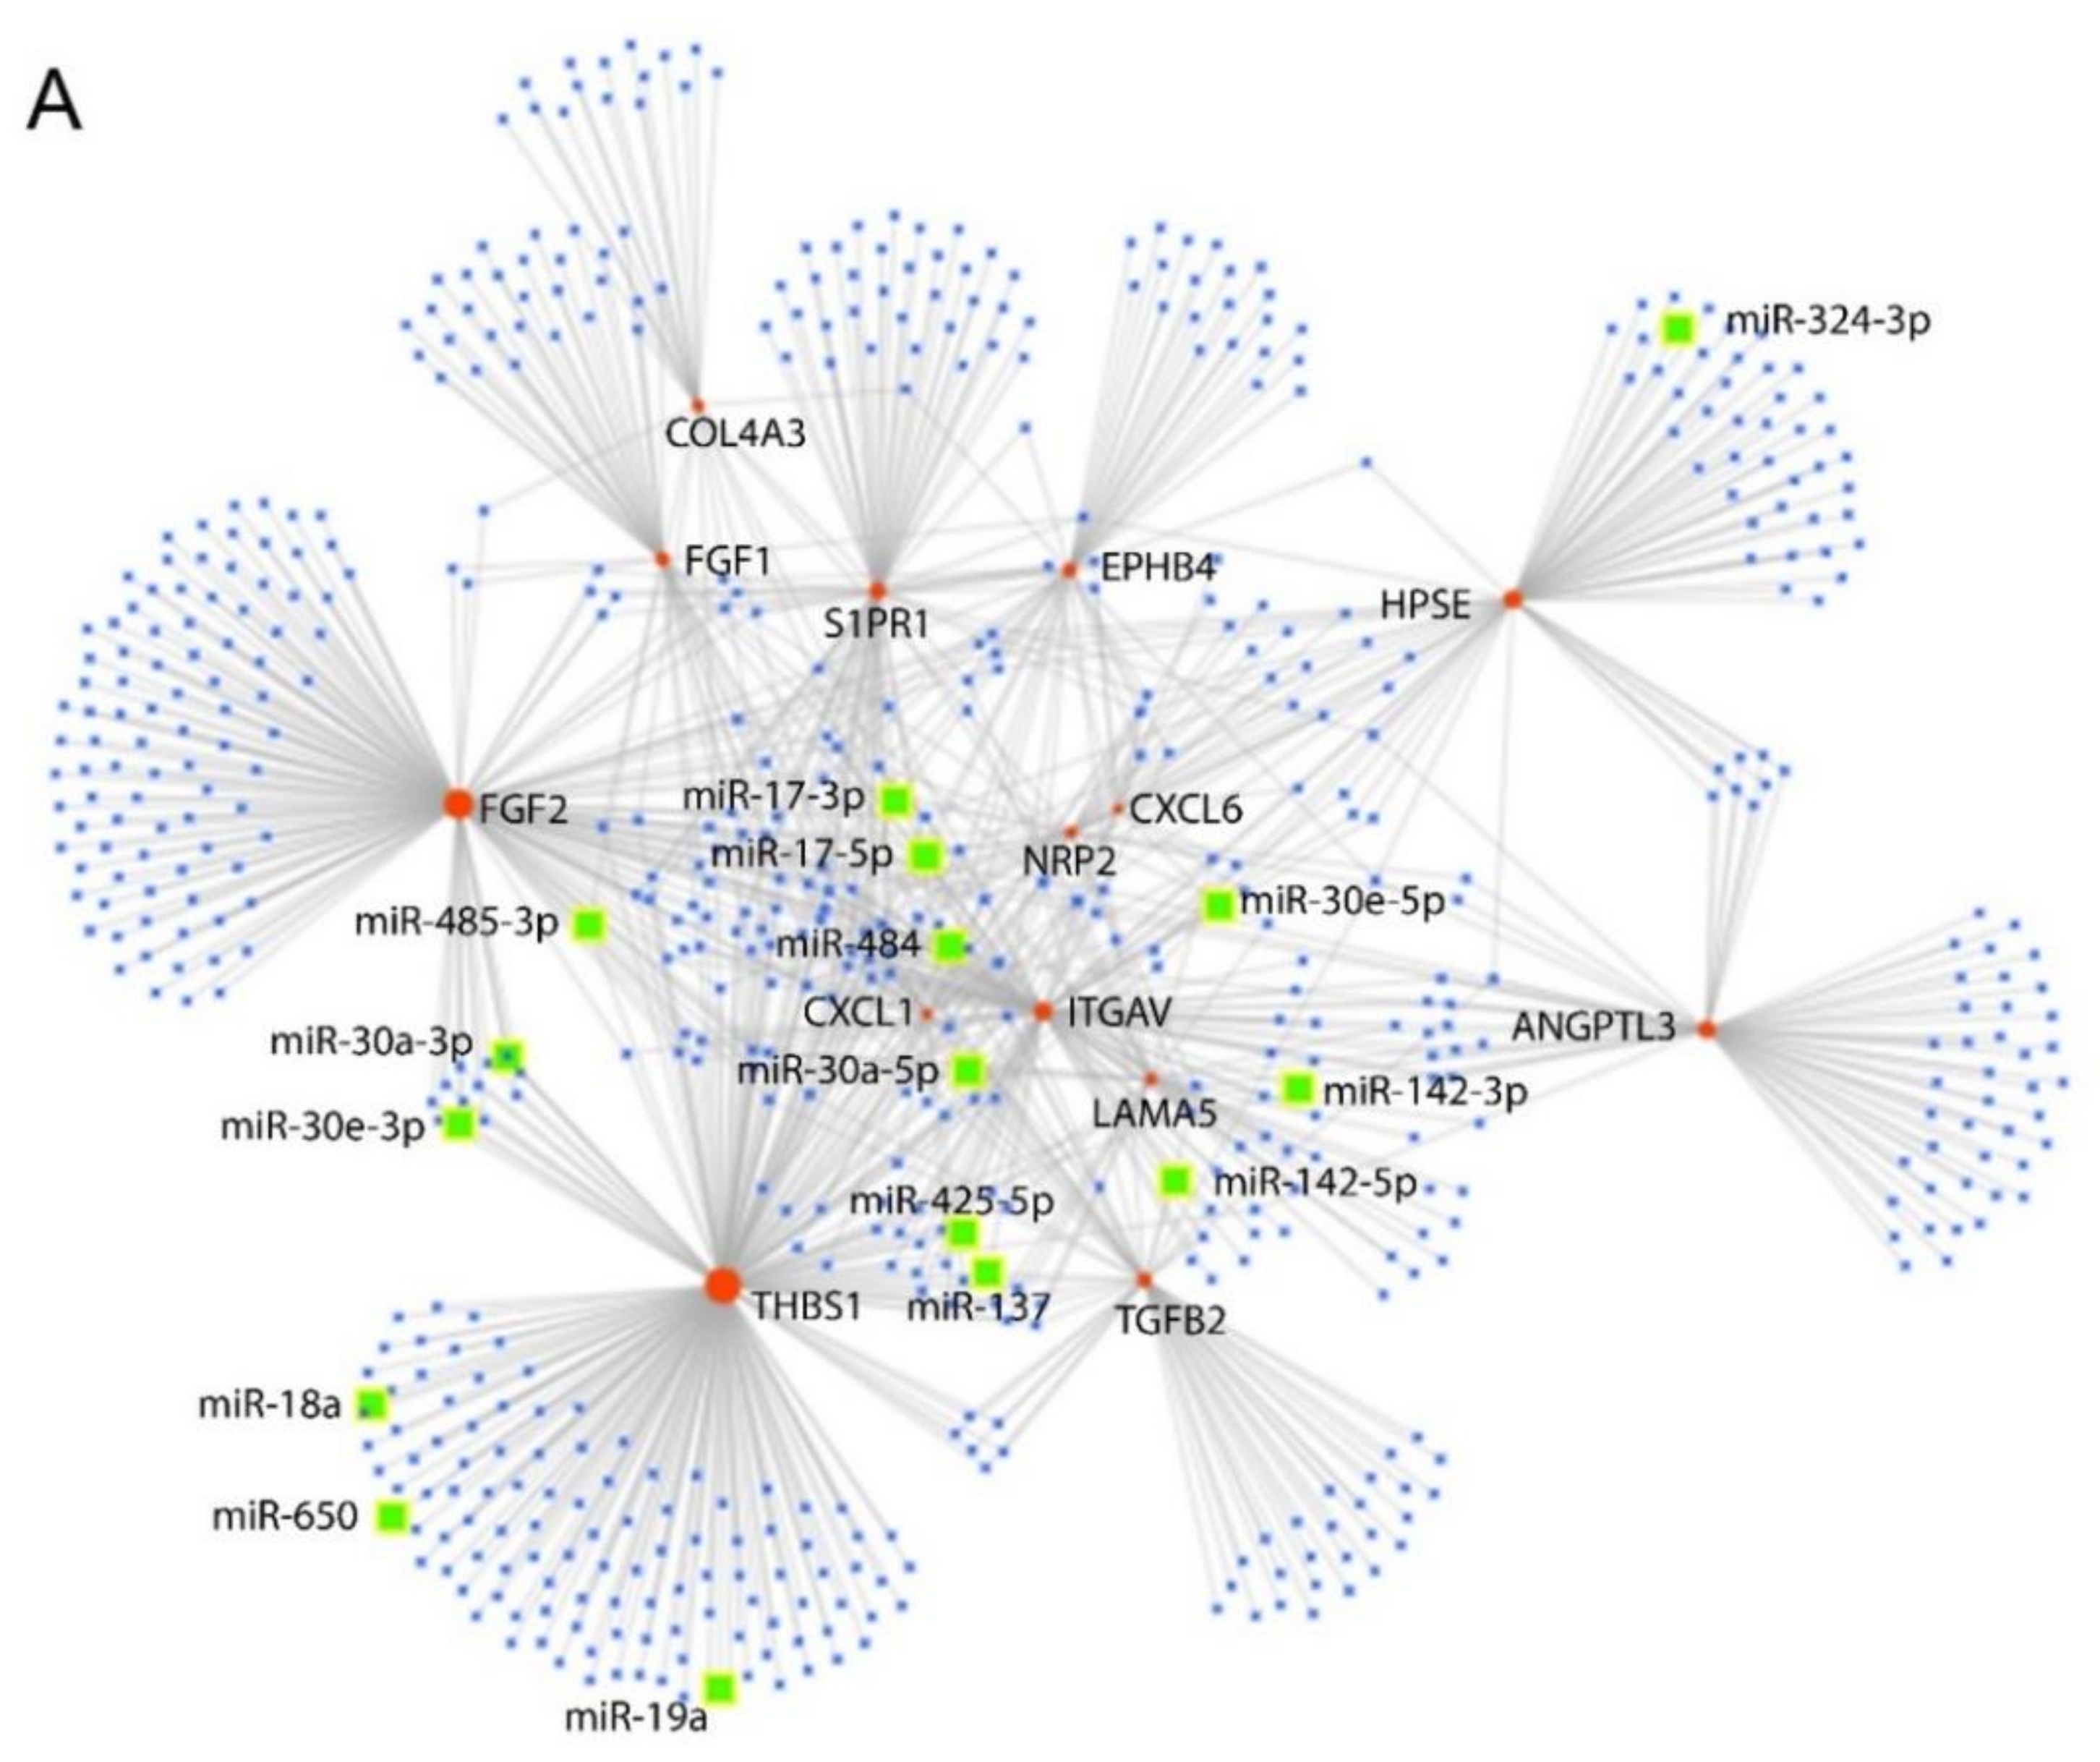
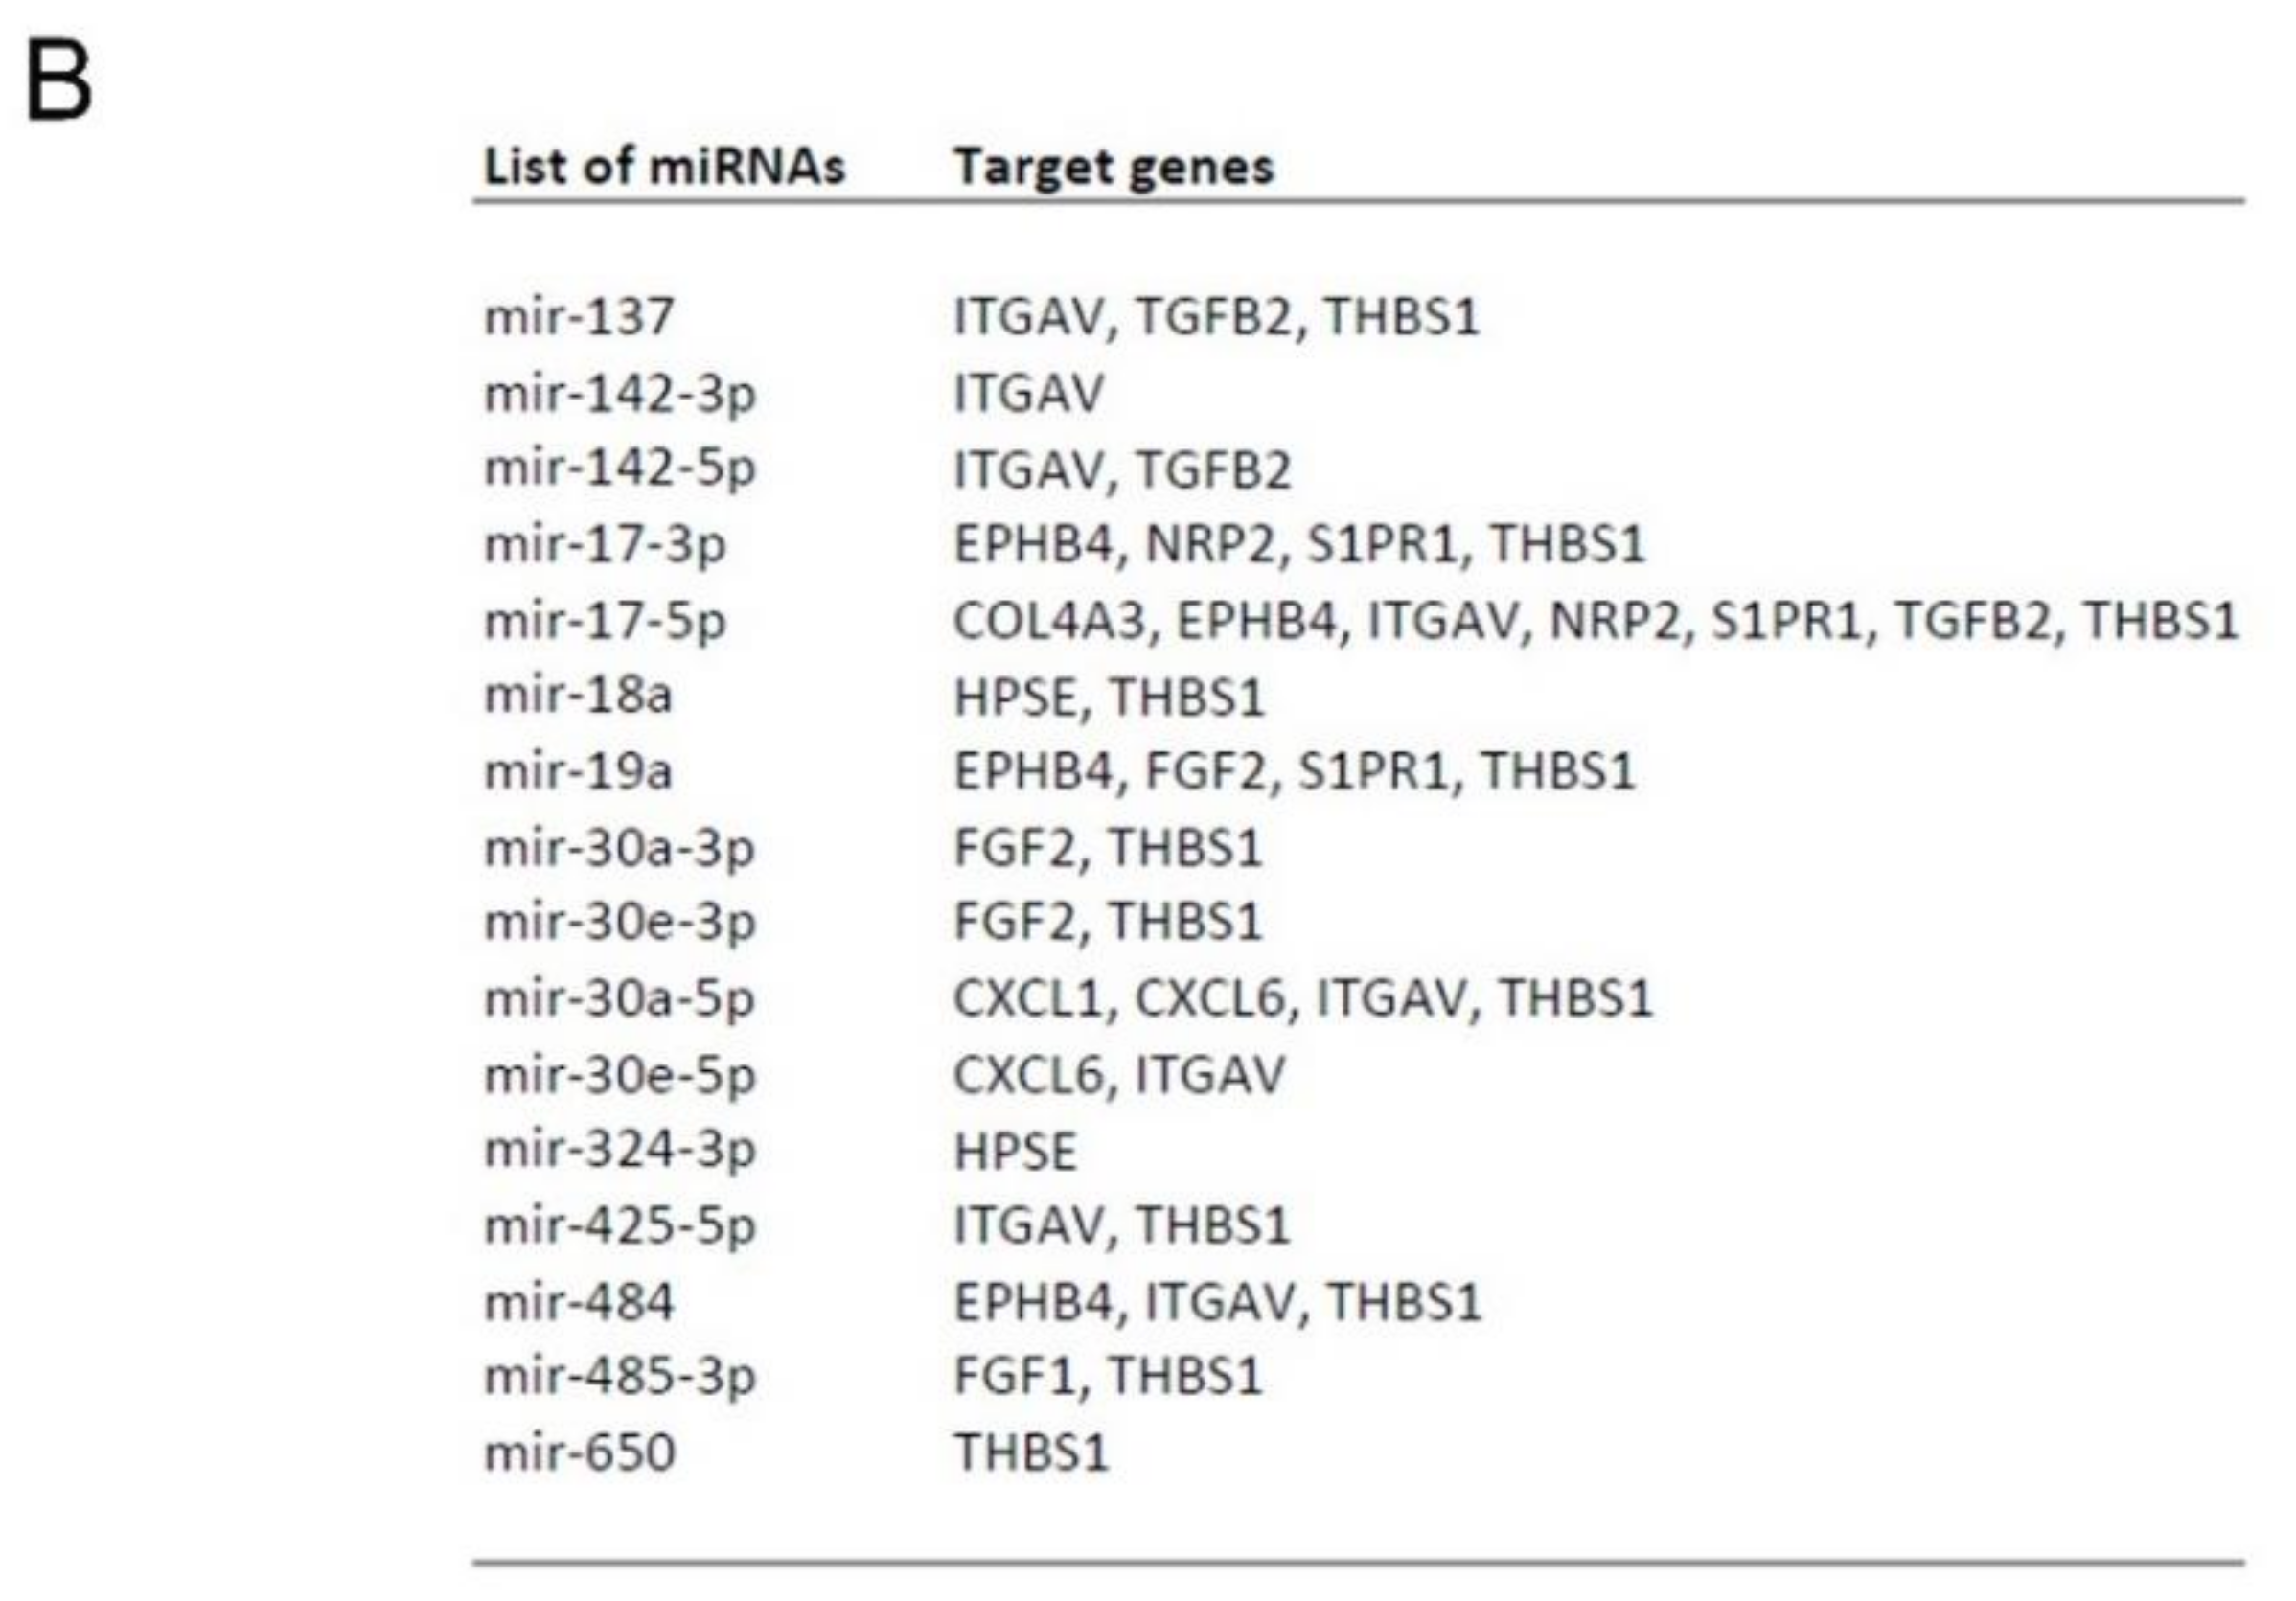
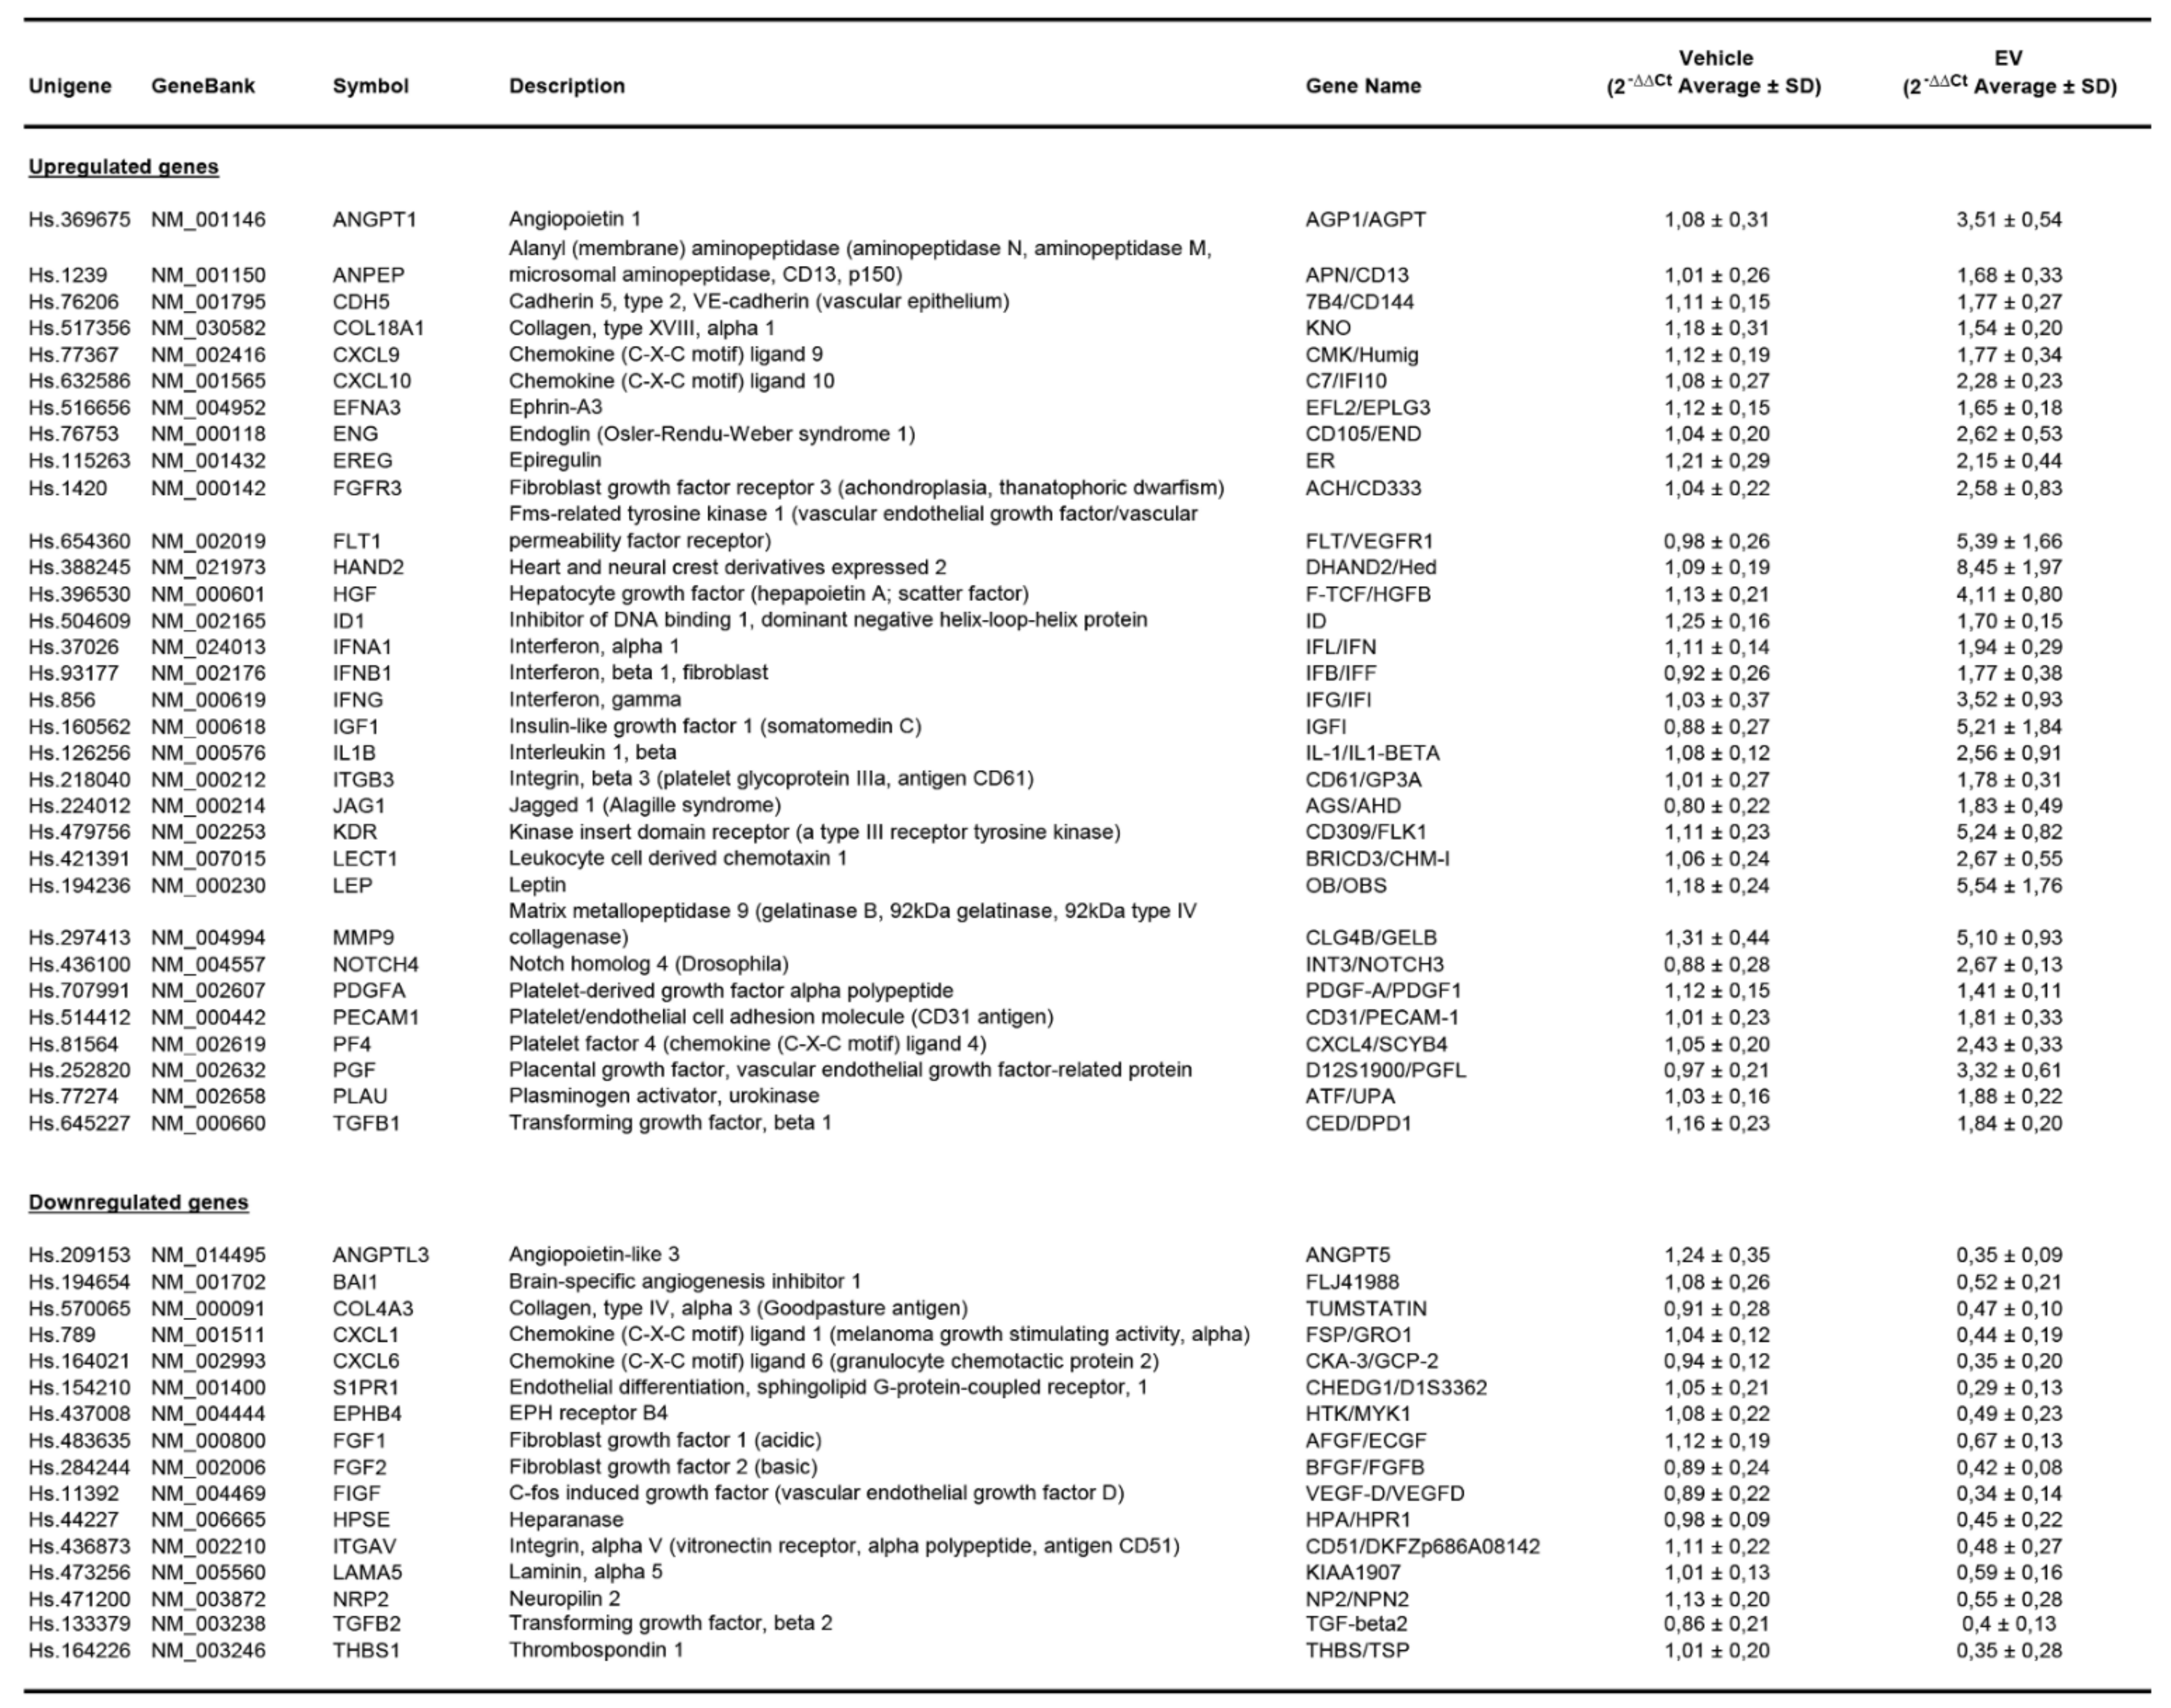
Appendix B.2. EPC-Derived EVs Trigger Angiogenesis by Modulating Gene Expression in Human Glomerular Endothelial Cells

Appendix B.3. Time- and Dose-Dependent Functional Assays on Glomerular Endothelial Cells and Podocytes In Vitro

References
- Fissell, W.H.; Miner, J.H. What is the glomerular ultrafiltration barrier? J. Am. Soc. Nephrol. 2018, 29, 2262–2264. [Google Scholar] [CrossRef] [PubMed] [Green Version]
- Schlöndorff, D.; Wyatt, C.M.; Campbell, K.N. Revisiting the determinants of the glomerular filtration barrier: What goes round must come round. Kidney Int. 2017, 92, 533–536. [Google Scholar] [CrossRef]
- Pollak, M.R.; Quaggin, S.E.; Hoenig, M.P.; Dworkin, L.D. The glomerulus: The sphere of influence. Clin. J. Am. Soc. Nephrol. 2014, 9, 1461–1469. [Google Scholar] [CrossRef] [PubMed] [Green Version]
- Garg, P. A review of podocyte biology. Am. J. Nephrol. 2018, 47, 3–13. [Google Scholar] [CrossRef] [PubMed]
- Lennon, R.; Hosawi, S. Glomerular cell crosstalk. Curr. Opin. Nephrol. Hypertens. 2016, 25, 187–193. [Google Scholar] [CrossRef]
- Dimke, H.; Maezawa, Y.; Quaggin, S.E. Crosstalk in glomerular injury and repair. Curr. Opin. Nephrol. Hypertens. 2015, 24, 231–238. [Google Scholar] [CrossRef] [Green Version]
- Xu, J.; Liu, X.; Jiang, Y.; Chu, L.; Hao, H.; Liua, Z.; Verfaillie, C.; Zweier, J.; Gupta, K.; Liu, Z. MAPK/ERK signalling mediates VEGF-induced bone marrow stem cell differentiation into endothelial cell. J. Cell. Mol. Med. 2008, 12, 2395–2406. [Google Scholar] [CrossRef] [Green Version]
- Bertuccio, C.; Veron, D.; Aggarwal, P.K.; Holzman, L.; Tufro, A. Vascular endothelial growth factor receptor 2 direct interaction with nephrin links VEGF-A signals to actin in kidney podocytes. J. Biol. Chem. 2011, 286, 39933–39944. [Google Scholar] [CrossRef] [PubMed] [Green Version]
- Dai, C.; Saleem, M.A.; Holzman, L.B.; Mathieson, P.; Liu, Y. Hepatocyte growth factor signaling ameliorates podocyte injury and proteinuria. Kidney Int. 2010, 77, 962–973. [Google Scholar] [CrossRef] [Green Version]
- Li, Y.; Sun, L.; Xu, H.; Fang, Z.; Yao, W.; Guo, W.; Rao, J.; Zha, X. Angiopoietin-like Protein 3 modulates barrier properties of human glomerular endothelial cells through a possible signaling pathway involving phosphatidylinositol-3 Kinase/Protein Kinase B and Integrin AlphaVbeta3. Acta Biochim. Biophys. Sin. 2008, 40, 459–465. [Google Scholar] [CrossRef] [Green Version]
- Del Porto, F.; Mariotti, A.; Ilardi, M.; Messina, F.R.; Afeltra, A.; Amoroso, A. Kidney vasculogenesis and angiogenesis: Role of vascular endothelial growth factor. Eur. Rev. Med. Pharmacol. Sci. 1999, 3, 149–153. [Google Scholar] [PubMed]
- Chadban, S.J.; Atkins, R.C. Glomerulonephritis. Lancet 2005, 365, 1797–1806. [Google Scholar] [CrossRef]
- Mathern, D.R.; Heeger, P.S. Molecules great and small: The complement system. Clin. J. Am. Soc. Nephrol. 2015, 10, 1636–1650. [Google Scholar] [CrossRef] [PubMed] [Green Version]
- Ji, M.; Lu, Y.; Zhao, C.; Gao, W.; He, F.; Zhang, J.; Zhao, D.; Qiu, W.; Wang, Y. C5a Induces the Synthesis of IL-6 and TNF-α in rat glomerular mesangial cells through MAPK signaling pathways. PLoS ONE 2016, 11, e0161867. [Google Scholar] [CrossRef] [Green Version]
- Tipping, P.G.; Holdsworth, S.R. Cytokines in Glomerulonephritis. Semin. Nephrol. 2007, 27, 275–285. [Google Scholar] [CrossRef] [PubMed]
- Izawa-Ishizawa, Y.; Ishizawa, K.; Sakurada, T.; Imanishi, M.; Miyamoto, L.; Fujii, S.; Taira, H.; Kihira, Y.; Ikeda, Y.; Hamano, S.; et al. Angiotensin II receptor blocker improves tumor necrosis factor-α-induced cytotoxicity via antioxidative effect in human glomerular endothelial cells. Pharmacology 2012, 90, 324–331. [Google Scholar] [CrossRef]
- Ernandez, T.; Mayadas, T.N. Immunoregulatory Role of TNFalpha in inflammatory kidney diseases. Kidney Int. 2009, 76, 262–276. [Google Scholar] [CrossRef] [PubMed] [Green Version]
- Pirotzky, E.; Delattre, R.M.; Hellegouarch, A.; Lonchampt, M.O.; Aarden, L.; Braquet, P.; Galanaud, P. Interleukin-6 production by tumor necrosis factor and lipopolysaccharide-stimulated rat renal cells. Clin. Immunol. Immunopathol. 1990, 56, 271–279. [Google Scholar] [CrossRef]
- Sverrisson, K.; Axelsson, J.; Rippe, A.; Asgeirsson, D.; Rippe, B. Acute Reactive Oxygen Species (ROS)Dependent Effects of IL-1β, TNF-α, and IL-6 on the Glomerular Filtration Barrier (GFB) in vivo. Am. J. Physiol. Renal Physiol. 2015, 309, F800–F806. [Google Scholar] [CrossRef] [Green Version]
- Vielhauer, V.; Mayadas, T.N. Functions of TNF and its receptors in renal disease: Distinct roles in inflammatory tissue injury and immune regulation. Semin. Nephrol. 2007, 27, 286–308. [Google Scholar] [CrossRef]
- Murakami, S.; Morioka, T.; Nakagawa, Y.; Suzuki, Y.; Arakawa, M.; Oite, T. Expression of adhesion molecules by cultured human glomerular endothelial cells in response to cytokines: Comparison to human umbilical vein and dermal microvascular endothelial cells. Microvasc. Res. 2001, 62, 383–391. [Google Scholar] [CrossRef] [PubMed]
- Pedigo, C.E.; Ducasa, G.M.; Leclercq, F.; Sloan, A.; Mitrofanova, A.; Hashmi, T.; Molina-David, J.; Ge, M.; Lassenius, M.I.; Forsblom, C.; et al. Local TNF Causes NFATc1-dependent cholesterol-mediated podocyte injury. J. Clin. Investig. 2016, 126, 3336–3350. [Google Scholar] [CrossRef] [Green Version]
- Takano, Y.; Yamauchi, K.; Hayakawa, K.; Hiramatsu, N.; Kasai, A.; Okamura, M.; Yokouchi, M.; Shitamura, A.; Yao, J.; Kitamura, M. Transcriptional suppression of nephrin in podocytes by macrophages: Roles of inflammatory cytokines and involvement of the PI3K/Akt Pathway. FEBS Lett. 2007, 581, 421–426. [Google Scholar] [CrossRef] [PubMed] [Green Version]
- Su, H.; Lei, C.-T.; Zhang, C. Interleukin-6 signaling pathway and its role in kidney disease: An update. Front. Immunol. 2017, 8. [Google Scholar] [CrossRef] [Green Version]
- Kunter, U.; Rong, S.; Djuric, Z.; Boor, P.; Müller-Newen, G.; Yu, D.; Floege, J. Transplanted mesenchymal stem cells accelerate glomerular healing in experimental glomerulonephritis. J. Am. Soc. Nephrol. 2006, 17, 2202–2212. [Google Scholar] [CrossRef] [Green Version]
- Rampino, T.; Gregorini, M.; Bedino, G.; Piotti, G.; Gabanti, E.; Ibatici, A.; Sessarego, N.; Piacenza, C.; Balenzano, C.T.; Esposito, P.; et al. Mesenchymal stromal cells improve renal injury in anti-thy 1 nephritis by modulating inflammatory cytokines and scatter factors. Clin. Sci. 2011, 120, 25–36. [Google Scholar] [CrossRef] [Green Version]
- Asahara, T.; Murohara, T.; Sullivan, A.; Silver, M.; van der Zee, R.; Li, T.; Witzenbichler, B.; Schatteman, G.; Isner, J.M. Isolation of putative progenitor endothelial cells for angiogenesis. Science 1997, 275, 964–967. [Google Scholar] [CrossRef] [PubMed]
- Biancone, L.; Cantaluppi, V.; Duò, D.; Deregibus, M.C.; Torre, C.; Camussi, G. Role of L-Selectin in the vascular homing of peripheral blood-derived endothelial progenitor cells. J. Immunol. 2004, 173, 5268–5274. [Google Scholar] [CrossRef] [PubMed] [Green Version]
- Carmen, U.; Christopher, H.; Alexandra, A.; Elisabeth, D.; Andreas, M.A.; Stefanie, D. Relevance of monocytic features for neovascularization capacity of circulating endothelial progenitor cells. Circulation 2003, 108, 2511–2516. [Google Scholar] [CrossRef] [Green Version]
- Nielsen, J.S.; McNagny, K.M. The role of podocalyxin in health and disease. J. Am. Soc. Nephrol. 2009, 20, 1669–1676. [Google Scholar] [CrossRef] [PubMed] [Green Version]
- Guo, W.; Feng, J.-M.; Yao, L.; Sun, L.; Zhu, G.-Q. Transplantation of endothelial progenitor cells in treating rats with iga nephropathy. BMC Nephrol. 2014, 15, 110. [Google Scholar] [CrossRef] [PubMed] [Green Version]
- Uchimura, H.; Marumo, T.; Takase, O.; Kawachi, H.; Shimizu, F.; Hayashi, M.; Saruta, T.; Hishikawa, K.; Fujita, T. Intrarenal injection of bone marrow-derived angiogenic cells reduces endothelial injury and mesangial cell activation in experimental glomerulonephritis. J. Am. Soc. Nephrol. 2005, 16, 997–1004. [Google Scholar] [CrossRef] [PubMed]
- Yang, Z.; von Ballmoos, M.W.; Faessler, D.; Voelzmann, J.; Ortmann, J.; Diehm, N.; Kalka-Moll, W.; Baumgartner, I.; Di Santo, S.; Kalka, C. Paracrine factors secreted by endothelial progenitor cells prevent oxidative stress-induced apoptosis of mature endothelial cells. Atherosclerosis 2010, 211, 103–109. [Google Scholar] [CrossRef] [PubMed]
- Deregibus, M.C.; Cantaluppi, V.; Calogero, R.; Lo Iacono, M.; Tetta, C.; Biancone, L.; Bruno, S.; Bussolati, B.; Camussi, G. Endothelial progenitor cell derived microvesicles activate an angiogenic program in endothelial cells by a horizontal transfer of MRNA. Blood 2007, 110, 2440–2448. [Google Scholar] [CrossRef] [PubMed] [Green Version]
- Ratajczak, J.; Wysoczynski, M.; Hayek, F.; Janowska-Wieczorek, A.; Ratajczak, M.Z. Membrane-derived microvesicles: Important and underappreciated mediators of cell-to-cell communication. Leukemia 2006, 20, 1487–1495. [Google Scholar] [CrossRef]
- Van Niel, G.; D’Angelo, G.; Raposo, G. Shedding light on the cell biology of extracellular vesicles. Nat. Rev. Mol. Cell Biol. 2018, 19, 213–228. [Google Scholar] [CrossRef] [PubMed]
- Cantaluppi, V.; Gatti, S.; Medica, D.; Figliolini, F.; Bruno, S.; Deregibus, M.C.; Sordi, A.; Biancone, L.; Tetta, C.; Camussi, G. Microvesicles derived from endothelial progenitor cells protect the kidney from ischemiareperfusion injury by MicroRNA-dependent reprogramming of resident renal cells. Kidney Int. 2012, 82, 412–427. [Google Scholar] [CrossRef] [PubMed] [Green Version]
- Cantaluppi, V.; Medica, D.; Mannari, C.; Stiaccini, G.; Figliolini, F.; Dellepiane, S.; Quercia, A.D.; Migliori, M.; Panichi, V.; Giovannini, L.; et al. Endothelial progenitor cell-derived extracellular vesicles protect from complement-mediated mesangial injury in experimental Anti-Thy1.1 Glomerulonephritis. Nephrol. Dial. Transplant. 2015, 30, 410–422. [Google Scholar] [CrossRef] [PubMed] [Green Version]
- Conaldi, P.G.; Bottelli, A.; Baj, A.; Serra, C.; Fiore, L.; Federico, G.; Bussolati, B.; Camussi, G. Human immunodeficiency virus-1 tat induces hyperproliferation and dysregulation of renal glomerular epithelial cells. Am. J. Pathol. 2002, 161, 53–61. [Google Scholar] [CrossRef] [Green Version]
- Collino, F.; Bussolati, B.; Gerbaudo, E.; Marozio, L.; Pelissetto, S.; Benedetto, C.; Camussi, G. Preeclamptic Sera Induce Nephrin Shedding from Podocytes through Endothelin-1 release by endothelial glomerular cells. Am. J. Physiol. Renal Physiol. 2008, 294, F1185–F1194. [Google Scholar] [CrossRef] [Green Version]
- Biancone, L.; Cantaluppi, V.; Segoloni, G.; Boccellino, M.; Del Sorbo, L.; Conaldi, P.G.; Tjoelker, L.W.; Maruyama, S.; Cantu, E.; Stern, D.; et al. Role of platelet-activating factor in functional alterations induced by xenoreactive antibodies in porcine endothelial cells. Transplantation 2000, 70, 1198–1205. [Google Scholar] [CrossRef]
- Fan, Y.; Siklenka, K.; Arora, S.K.; Ribeiro, P.; Kimmins, S.; Xia, J. MiRNet—Dissecting MiRNA-target interactions and functional associations through network-based visual analysis. Nucleic Acids Res 2016, 44, W135–W141. [Google Scholar] [CrossRef]
- Migliori, M.; Cantaluppi, V.; Mannari, C.; Bertelli, A.A.E.; Medica, D.; Quercia, A.D.; Navarro, V.; Scatena, A.; Giovannini, L.; Biancone, L.; et al. Caffeic acid, a phenol found in white wine, modulates endothelial nitric oxide production and protects from oxidative stress-associated endothelial cell injury. PLoS ONE 2015, 10, e0117530. [Google Scholar] [CrossRef] [PubMed]
- Baud, L.; Ardaillou, R. Tumor necrosis factor in renal injury. Miner. Electrolyte Metab. 1995, 21, 336–341. [Google Scholar]
- Adhya, Z.; El Anbari, M.; Anwar, S.; Mortimer, A.; Marr, N.; Karim, M.Y. Soluble TNF-R1, VEGF and other cytokines as markers of disease activity in systemic lupus erythematosus and lupus nephritis. Lupus 2019, 28, 713–721. [Google Scholar] [CrossRef]
- Khan, S.B.; Cook, H.T.; Bhangal, G.; Smith, J.; Tam, F.W.K.; Pusey, C.D. Antibody blockade of TNF-alpha reduces inflammation and scarring in experimental crescentic glomerulonephritis. Kidney Int. 2005, 67, 1812–1820. [Google Scholar] [CrossRef] [Green Version]
- Durlacher-Betzer, K.; Hassan, A.; Levi, R.; Axelrod, J.; Silver, J.; Naveh-Many, T. Interleukin-6 Contributes to the Increase in Fibroblast Growth Factor 23 expression in acute and chronic kidney disease. Kidney Int. 2018, 94, 315–325. [Google Scholar] [CrossRef]
- Yiu, W.H.; Li, R.X.; Wong, D.W.L.; Wu, H.J.; Chan, K.W.; Chan, L.Y.Y.; Leung, J.C.K.; Lai, K.N.; Sacks, S.H.; Zhou, W.; et al. Complement C5a inhibition moderates lipid metabolism and reduces tubulointerstitial fibrosis in diabetic nephropathy. Nephrol. Dial Transpl. 2018, 33, 1323–1332. [Google Scholar] [CrossRef]
- Martin, I.V.; Bohner, A.; Boor, P.; Shagdarsuren, E.; Raffetseder, U.; Lammert, F.; Floege, J.; Ostendorf, T.; Weber, S.N. Complement C5a Receptors C5L2 and C5aR in renal fibrosis. Am. J. Physiol. Renal Physiol. 2018, 314, F35–F46. [Google Scholar] [CrossRef] [PubMed]
- Lee, L.K.; Meyer, T.W.; Pollock, A.S.; Lovett, D.H. Endothelial cell injury initiates glomerular sclerosis in the rat remnant kidney. J. Clin. Investig. 1995, 96, 953–964. [Google Scholar] [CrossRef] [PubMed]
- Nakatsue, T.; Koike, H.; Han, G.D.; Suzuki, K.; Miyauchi, N.; Yuan, H.; Salant, D.J.; Gejyo, F.; Shimizu, F.; Kawachi, H. Nephrin and podocin dissociate at the onset of proteinuria in experimental membranous nephropathy. Kidney Int. 2005, 67, 2239–2253. [Google Scholar] [CrossRef] [PubMed] [Green Version]
- Riazifar, M.; Pone, E.J.; Lötvall, J.; Zhao, W. Stem Cell Extracellular Vesicles: Extended Messages of Regeneration. Annu. Rev. Pharmacol. Toxicol. 2017, 57, 125–154. [Google Scholar] [CrossRef] [PubMed] [Green Version]
- Rafii, S.; Lyden, D. Therapeutic stem and progenitor cell transplantation for organ vascularization and regeneration. Nat. Med. 2003, 9, 702–712. [Google Scholar] [CrossRef]
- Zampetaki, A.; Kirton, J.P.; Xu, Q. Vascular repair by endothelial progenitor cells. Cardiovasc. Res. 2008, 78, 413–421. [Google Scholar] [CrossRef] [PubMed] [Green Version]
- Cantaluppi, V.; Biancone, L.; Figliolini, F.; Beltramo, S.; Medica, D.; Deregibus, M.C.; Galimi, F.; Romagnoli, R.; Salizzoni, M.; Tetta, C.; et al. Microvesicles derived from endothelial progenitor cells enhance neoangiogenesis of human pancreatic islets. Cell Transpl. 2012, 21, 1305–1320. [Google Scholar] [CrossRef]
- Van Roeyen, C.R.; Boor, P.; Borkham-Kamphorst, E.; Rong, S.; Kunter, U.; Martin, I.V.; Kaitovic, A.; Fleckenstein, S.; Perbal, B.; Trautwein, C.; et al. A novel, dual role of CCN3 in experimental glomerulonephritis: Pro-angiogenic and antimesangioproliferative effects. Am. J. Pathol. 2012, 180, 1979–1990. [Google Scholar] [CrossRef] [PubMed]
- Sawai, K.; Mori, K.; Mukoyama, M.; Sugawara, A.; Suganami, T.; Koshikawa, M.; Yahata, K.; Makino, H.; Nagae, T.; Fujinaga, Y.; et al. Angiogenic protein Cyr61 is expressed by podocytes in anti-Thy-1 glomerulonephritis. J. Am. Soc. Nephrol. 2003, 14, 1154–1163. [Google Scholar] [CrossRef] [Green Version]
- Wang, L.; Law, H. Immune Complexes Impaired Glomerular Endothelial Cell Functions in Lupus Nephritis. International journal of molecular sciences. Int. J. Mol. Sci. 2019, 20, 5281. [Google Scholar] [CrossRef] [Green Version]
- Zhai, Y.; Long, X.; Gao, J.; Yao, X.; Wang, X.; Zhao, Z. Elevated Endostatin Expression Is Regulated by the pIgA Immune Complex and Associated with Disease Severity of IgA Nephropathy. Kidney Blood Press Res. 2021, 46, 31–40. [Google Scholar] [CrossRef]
- Masuda, Y.; Shimizu, A.; Mori, T.; Ishiwata, T.; Kitamura, H.; Ohashi, R.; Ishizaki, M.; Asano, G.; Sugisaki, Y.; Yamanaka, N. Vascular endothelial growth factor enhances glomerular capillary repair and accelerates resolution of experimentally induced glomerulonephritis. Am. J. Pathol. 2001, 159, 599–608. [Google Scholar] [CrossRef] [Green Version]
- Ostendorf, T.; Van Roeyen, C.; Westenfeld, R.; Gawlik, A.; Kitahara, M.; De Heer, E.; Kerjaschki, D.; Floege, J.; Ketteler, M. Inducible nitric oxide synthase-derived nitric oxide promotes glomerular angiogenesis via upregulation of vascular endothelial growth factor receptors. J. Am. Soc. Nephrol. 2004, 15, 2307–2319. [Google Scholar] [CrossRef] [Green Version]
- Satchell, S.C.; Mathieson, P.W. Angiopoietins: Microvascular modulators with potential roles in glomerular pathophysiology. J. Nephrol. 2003, 16, 168–178. [Google Scholar]
- Daniel, C.; Amann, K.; Hohenstein, B.; Bornstein, P.; Hugo, C. Thrombospondin 2 functions as an endogenous regulator of angiogenesis and inflammation in experimental glomerulonephritis in mice. J. Am. Soc. Nephrol. 2007, 18, 788–798. [Google Scholar] [CrossRef]
- Hlushchuk, R.; Styp-Rekowska, B.; Dzambazi, J.; Wnuk, M.; Huynh-Do, U.; Makanya, A.; Djonov, V. Endoglin inhibition leads to intussusceptive angiogenesis via activation of factors related to COUP-TFII signaling pathway. PLoS ONE 2007, 12, e0182813. [Google Scholar] [CrossRef] [PubMed] [Green Version]
- Rookmaaker, M.B.; Smits, A.M.; Tolboom, H.; Van ’t Wout, K.; Martens, A.C.; Goldschmeding, R.; Joles, J.A.; Van Zonneveld, A.J.; Gröne, H.J.; Rabelink, T.J.; et al. Bone-marrow-derived cells contribute to glomerular endothelial repair in experimental glomerulonephritis. Am. J. Pathol. 2003, 163, 553–562. [Google Scholar] [CrossRef] [Green Version]
- Ren, S.; Babelova, A.; Moreth, K.; Xin, C.; Eberhardt, W.; Doller, A.; Pavenstädt, H.; Schaefer, L.; Pfeilschifter, J.; Huwiler, A. Transforming Growth Factor-Beta2 Upregulates Sphingosine Kinase-1 activity, which in turn attenuates the fibrotic Response to TGF-Beta2 by Impeding CTGF Expression. Kidney Int. 2009, 76, 857–867. [Google Scholar] [CrossRef] [PubMed] [Green Version]
- Barnes, J.L.; Woodruff, K.A.; Levine, S.P.; Abboud, H.E. Inhibition of mesangial cell proliferation by platelet factor 4. J. Am. Soc. Nephrol. 1996, 7, 991–998. [Google Scholar] [CrossRef]
- Wiedemann, E.; Jellinghaus, S.; Ende, G.; Augstein, A.; Sczech, R.; Wielockx, B.; Weinert, S.; Strasser, R.H.; Poitz, D.M. Regulation of endothelial migration and proliferation by Ephrin-A1. Cell. Signal. 2017, 29, 84–95. [Google Scholar] [CrossRef] [Green Version]
- Yu, Y.; Liang, Y.; Yin, C.; Liu, X.; Su, Y.; Zhang, L.; Wang, H. Inhibitor of DNA-Binding 1 promotes endothelial progenitor cell proliferation and migration by suppressing E2-2 through the Helix-Loop-Helix Domain. Int. J. Mol. Med. 2016, 38, 1549–1557. [Google Scholar] [CrossRef] [Green Version]
- Ishige-Wada, M.; Kwon, S.-M.; Eguchi, M.; Hozumi, K.; Iwaguro, H.; Matsumoto, T.; Fukuda, N.; Mugishima, H.; Masuda, H.; Asahara, T. Jagged-1 signaling in the bone marrow microenvironment promotes endothelial progenitor cell expansion and commitment of CD133+ Human Cord Blood Cells for Postnatal Vasculogenesis. PLoS ONE 2016, 11, e0166660. [Google Scholar] [CrossRef]
- Tamura, M.; Amano, T.; Shiroishi, T. The Hand2 gene dosage effect in developmental defects and human congenital disorders. Curr. Top. Dev. Biol. 2014, 110, 129–152. [Google Scholar] [CrossRef] [PubMed]
- Doublier, S.; Salvidio, G.; Lupia, E.; Ruotsalainen, V.; Verzola, D.; Deferrari, G.; Camussi, G. Nephrin expression is reduced in human diabetic nephropathy: Evidence for a distinct role for glycated albumin and angiotensin II. Diabetes 2003, 52, 1023–1030. [Google Scholar] [CrossRef] [PubMed] [Green Version]


Publisher’s Note: MDPI stays neutral with regard to jurisdictional claims in published maps and institutional affiliations. |
© 2021 by the authors. Licensee MDPI, Basel, Switzerland. This article is an open access article distributed under the terms and conditions of the Creative Commons Attribution (CC BY) license (https://creativecommons.org/licenses/by/4.0/).
Share and Cite
Medica, D.; Franzin, R.; Stasi, A.; Castellano, G.; Migliori, M.; Panichi, V.; Figliolini, F.; Gesualdo, L.; Camussi, G.; Cantaluppi, V. Extracellular Vesicles Derived from Endothelial Progenitor Cells Protect Human Glomerular Endothelial Cells and Podocytes from Complement- and Cytokine-Mediated Injury. Cells 2021, 10, 1675. https://doi.org/10.3390/cells10071675
Medica D, Franzin R, Stasi A, Castellano G, Migliori M, Panichi V, Figliolini F, Gesualdo L, Camussi G, Cantaluppi V. Extracellular Vesicles Derived from Endothelial Progenitor Cells Protect Human Glomerular Endothelial Cells and Podocytes from Complement- and Cytokine-Mediated Injury. Cells. 2021; 10(7):1675. https://doi.org/10.3390/cells10071675
Chicago/Turabian StyleMedica, Davide, Rossana Franzin, Alessandra Stasi, Giuseppe Castellano, Massimiliano Migliori, Vincenzo Panichi, Federico Figliolini, Loreto Gesualdo, Giovanni Camussi, and Vincenzo Cantaluppi. 2021. "Extracellular Vesicles Derived from Endothelial Progenitor Cells Protect Human Glomerular Endothelial Cells and Podocytes from Complement- and Cytokine-Mediated Injury" Cells 10, no. 7: 1675. https://doi.org/10.3390/cells10071675