
Unexpected Implication of SRP and AGO2 in Parkinson’s Disease: Involvement in Alpha-Synuclein Biogenesis

 , and
, and 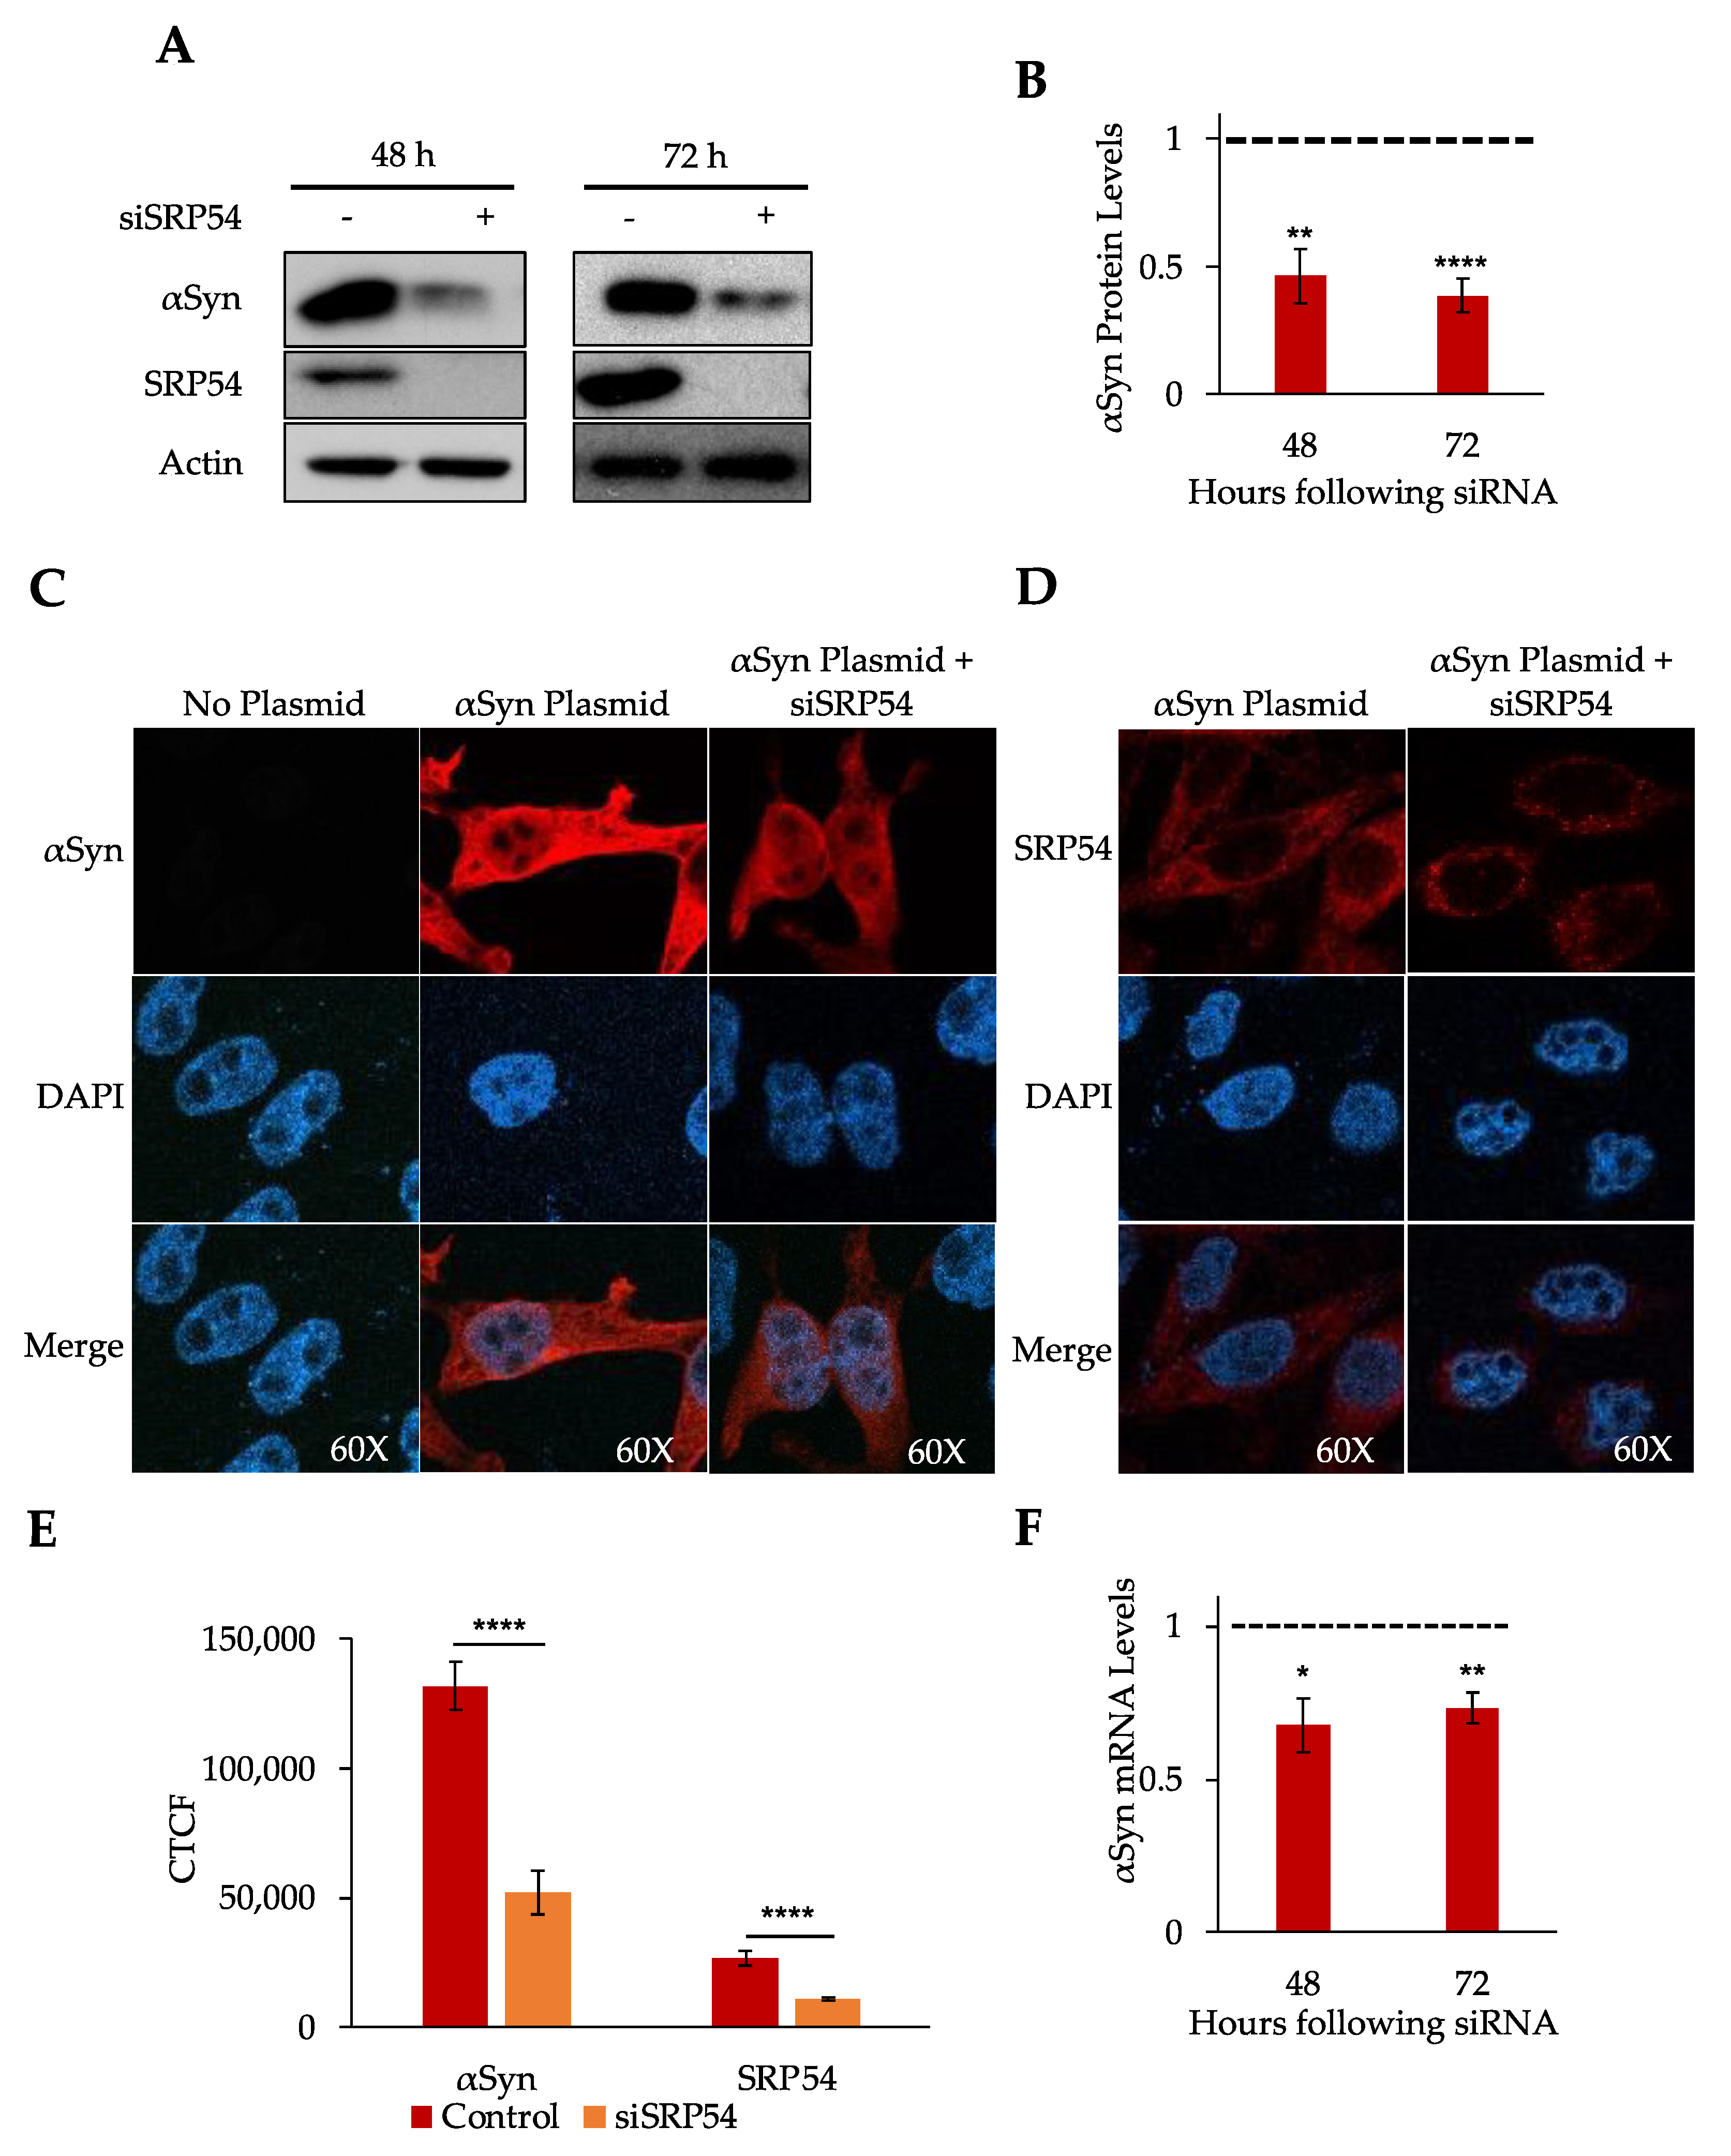
Abstract
:1. Introduction
2. Materials and Methods
2.1. Cell Culture, αSyn Expressing Plasmid and Transfections
2.2. Actinomycin D Treatment Experiments
2.3. Western Blotting
2.4. Microscopy
2.5. RNA Purification, cDNAs, Real-Time Quantitative PCR (RT-qPCR)
2.6. Human Substantia Nigra Collection and Analysis
2.7. Statistical Analysis
3. Results
3.1. αSyn Expression in Cultured Human Cells
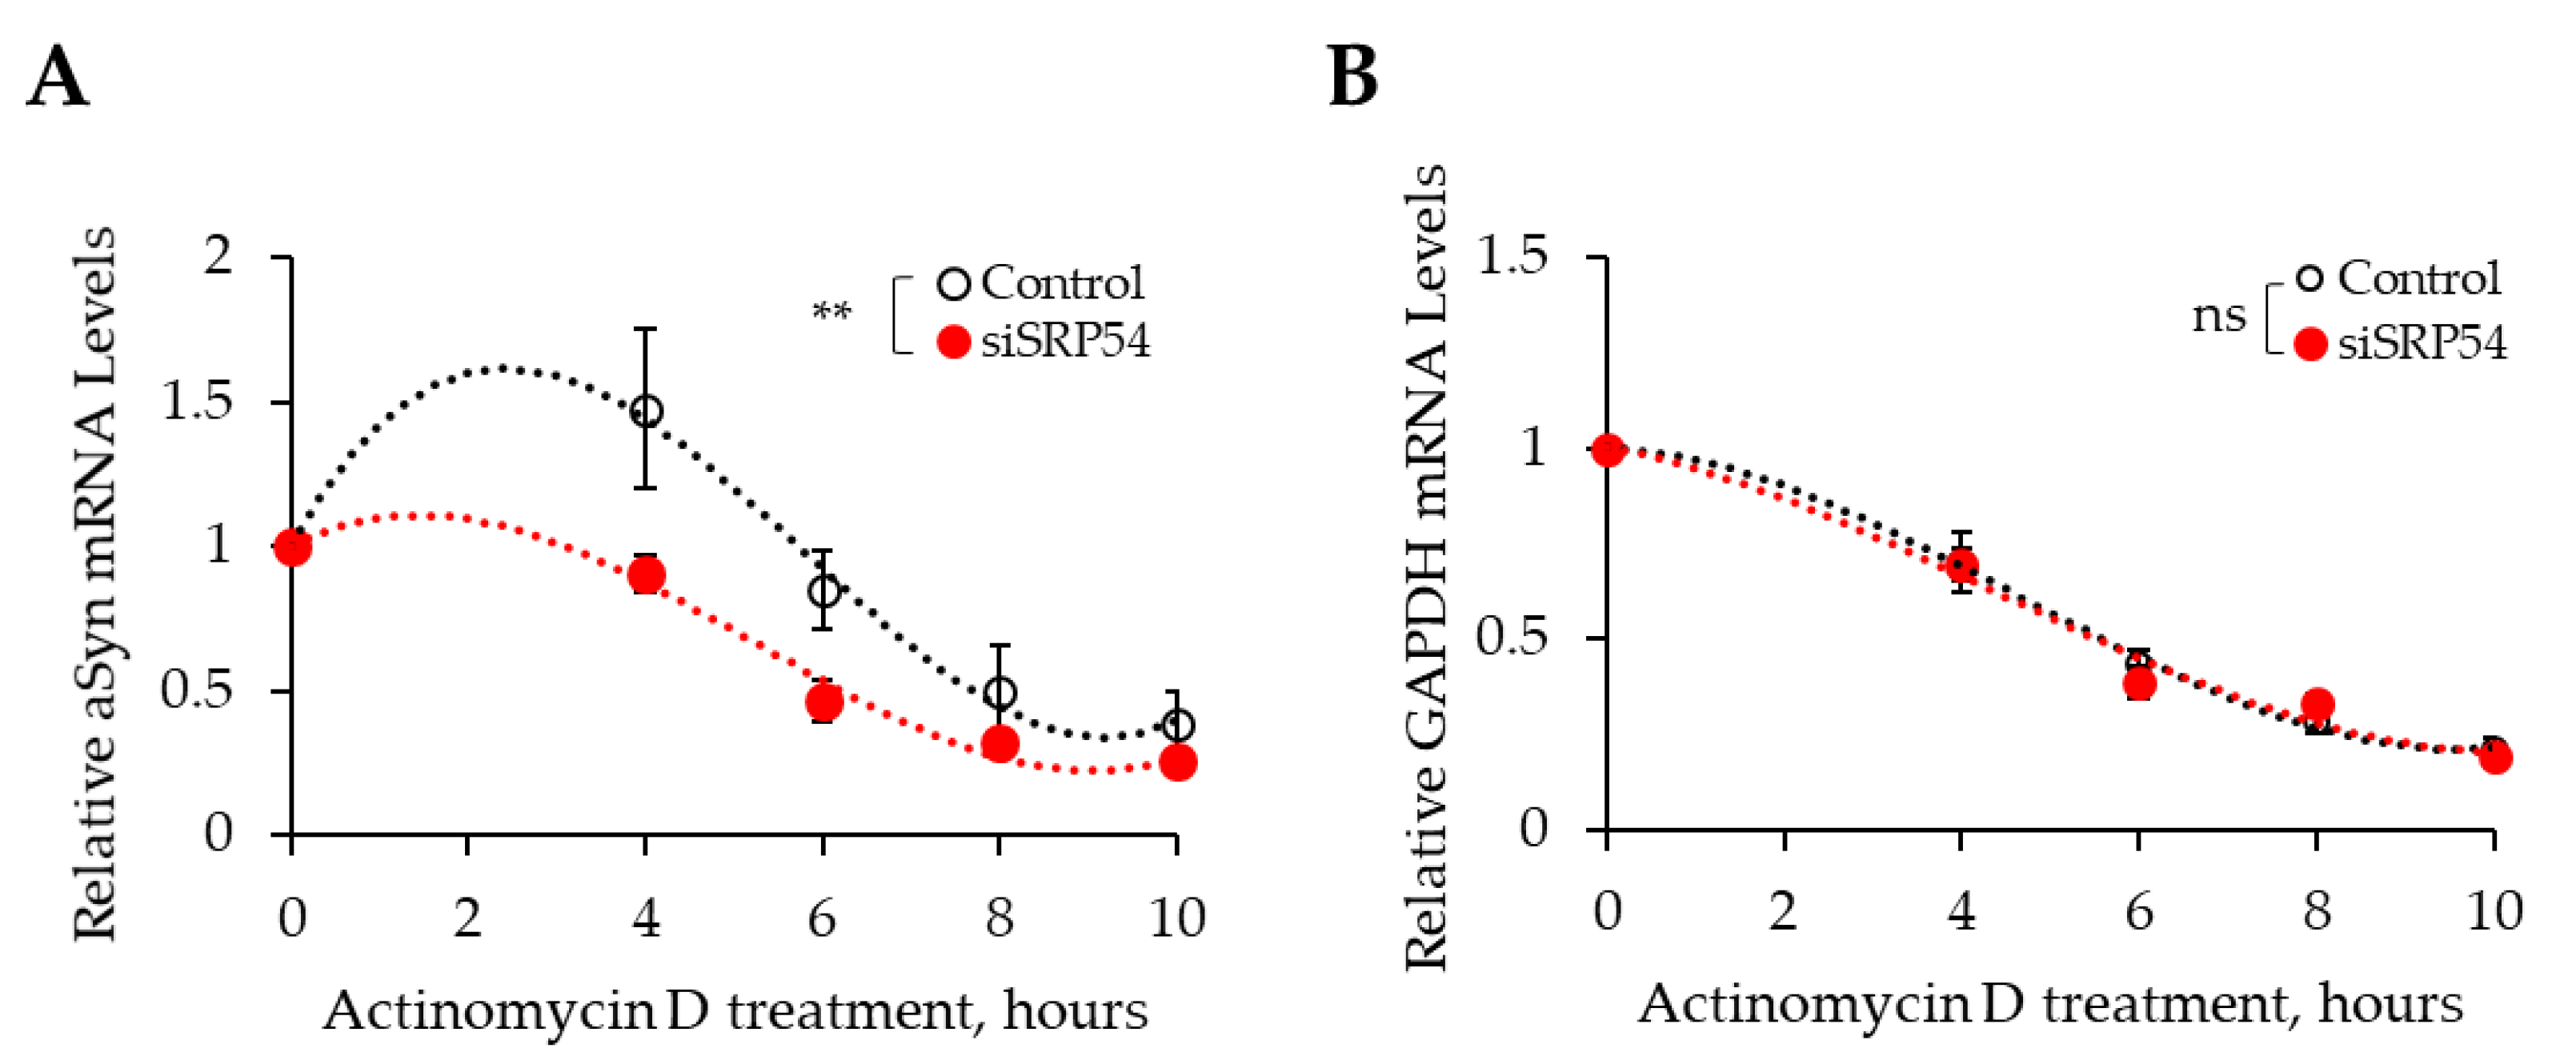
3.2. Depletion of SRP54 Affects αSyn Expression
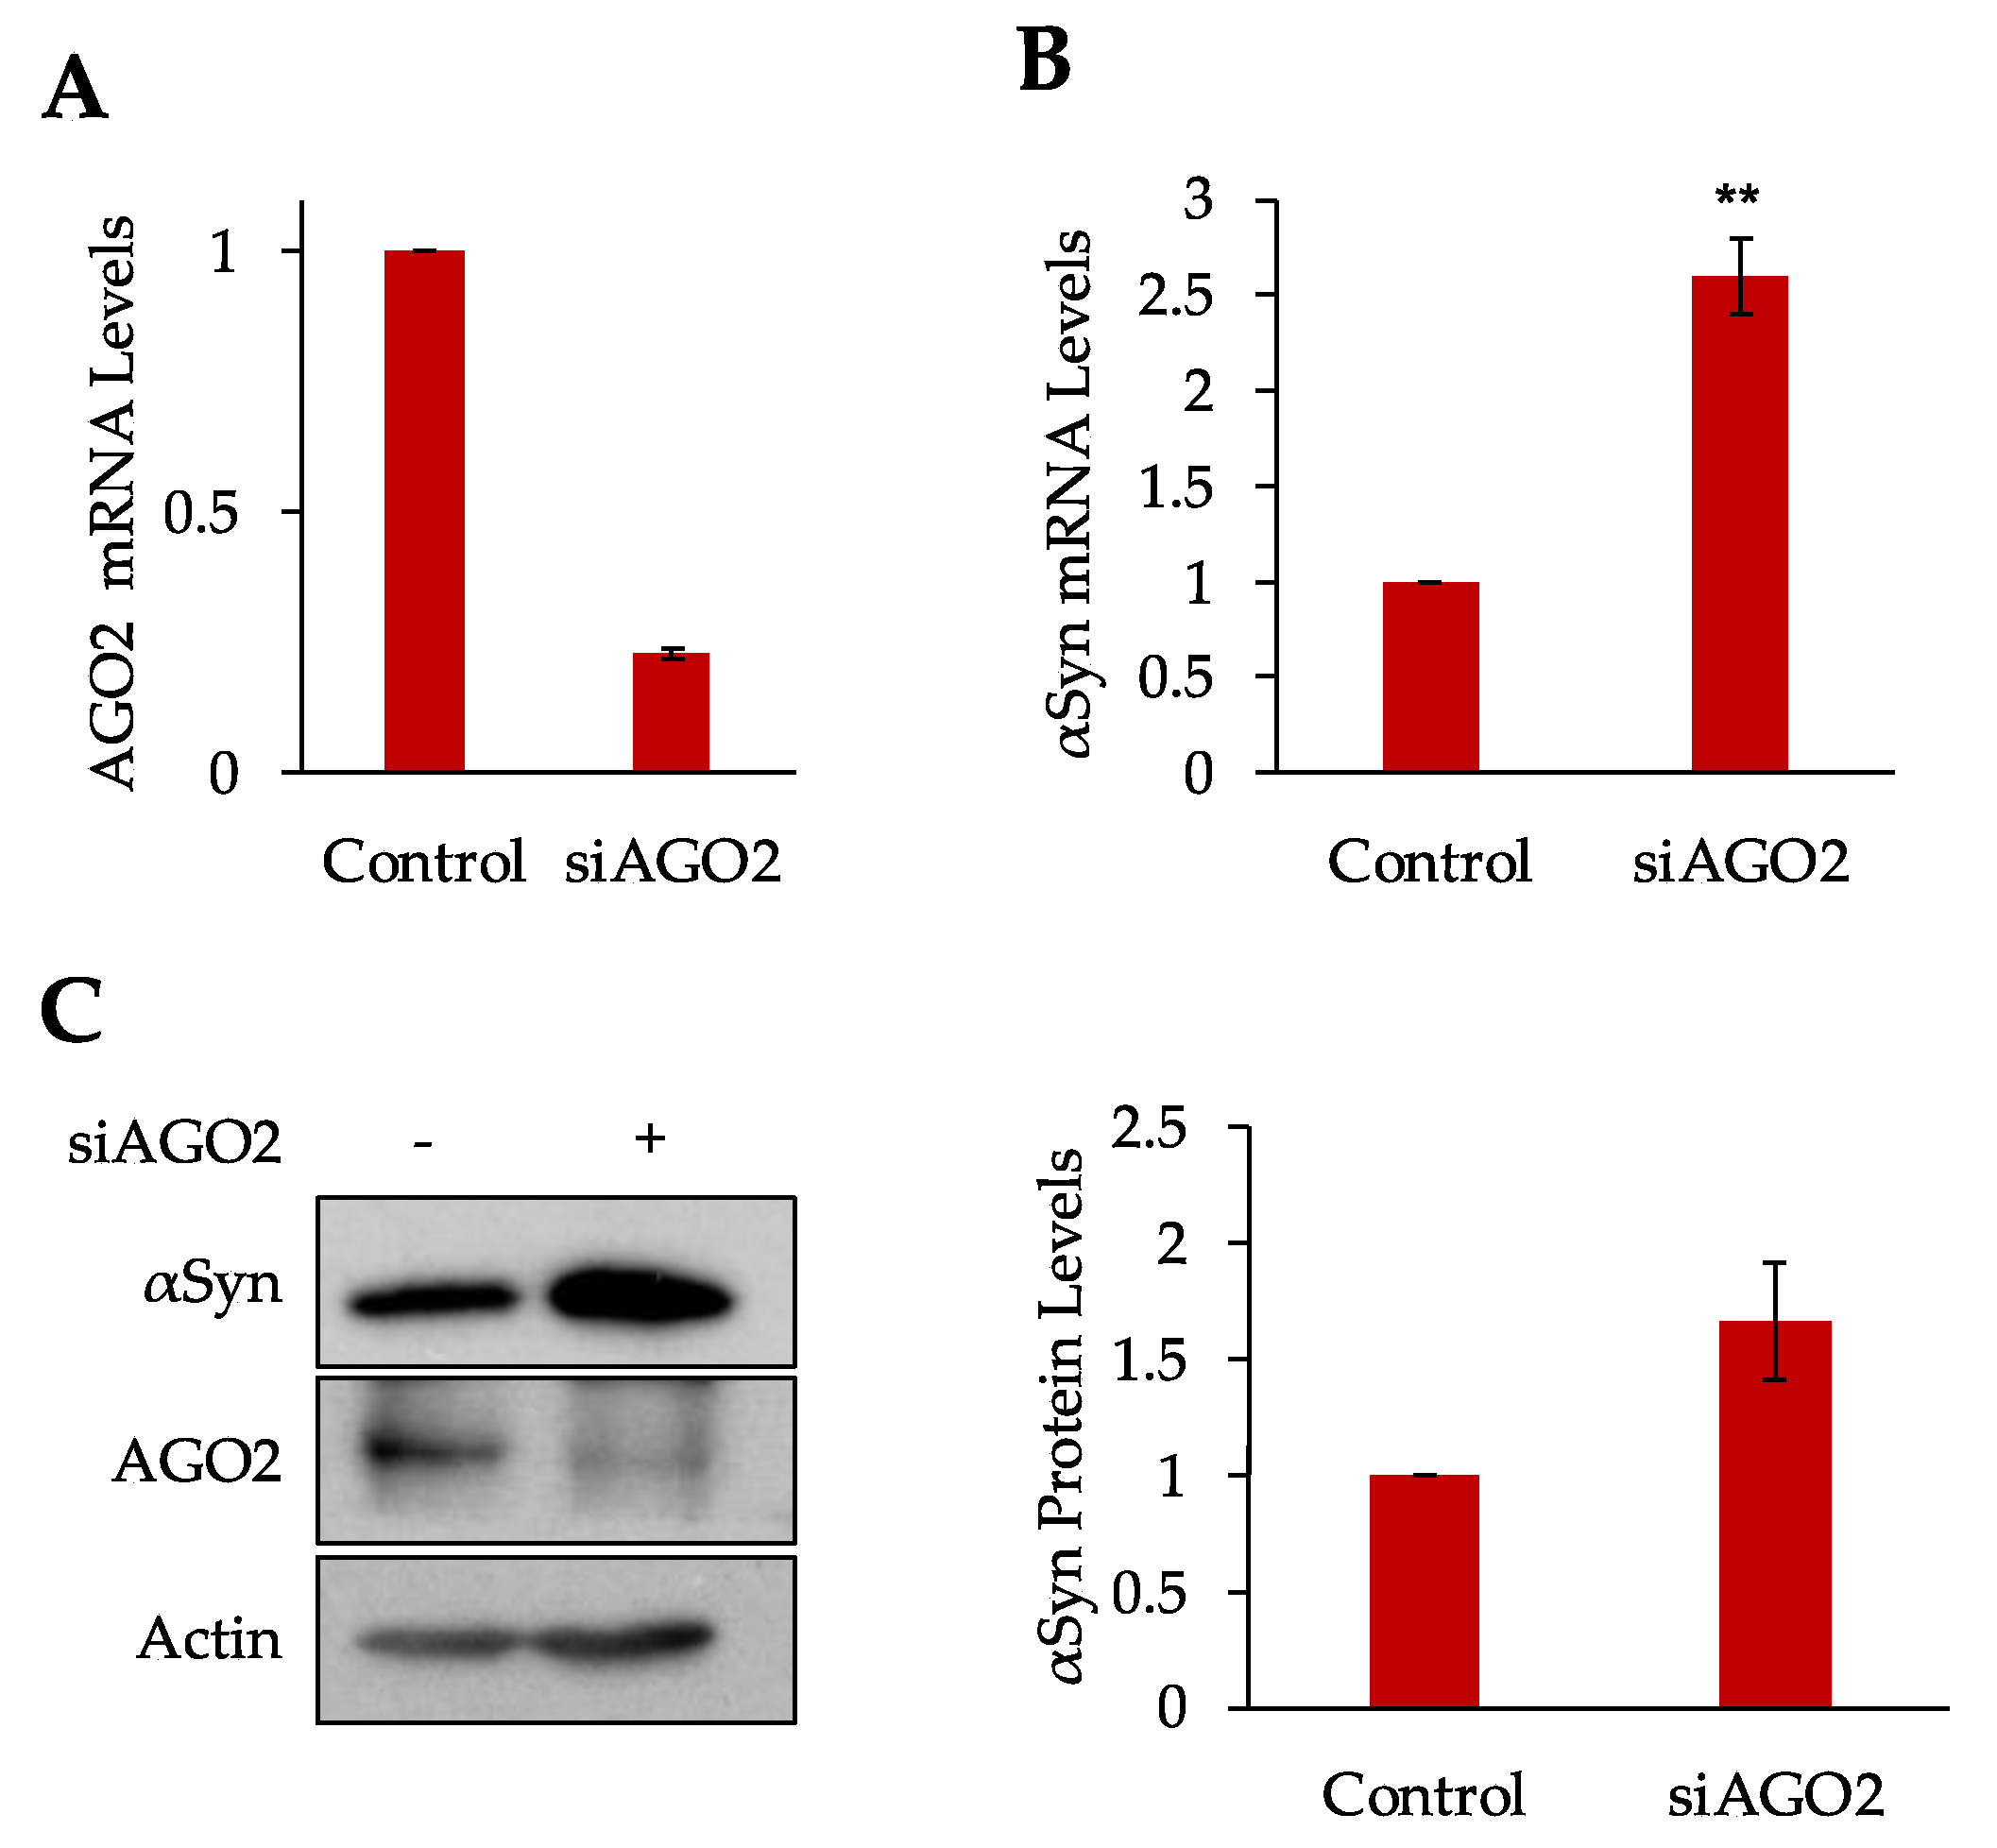
3.3. Argonaute 2 Regulates αSyn Expression
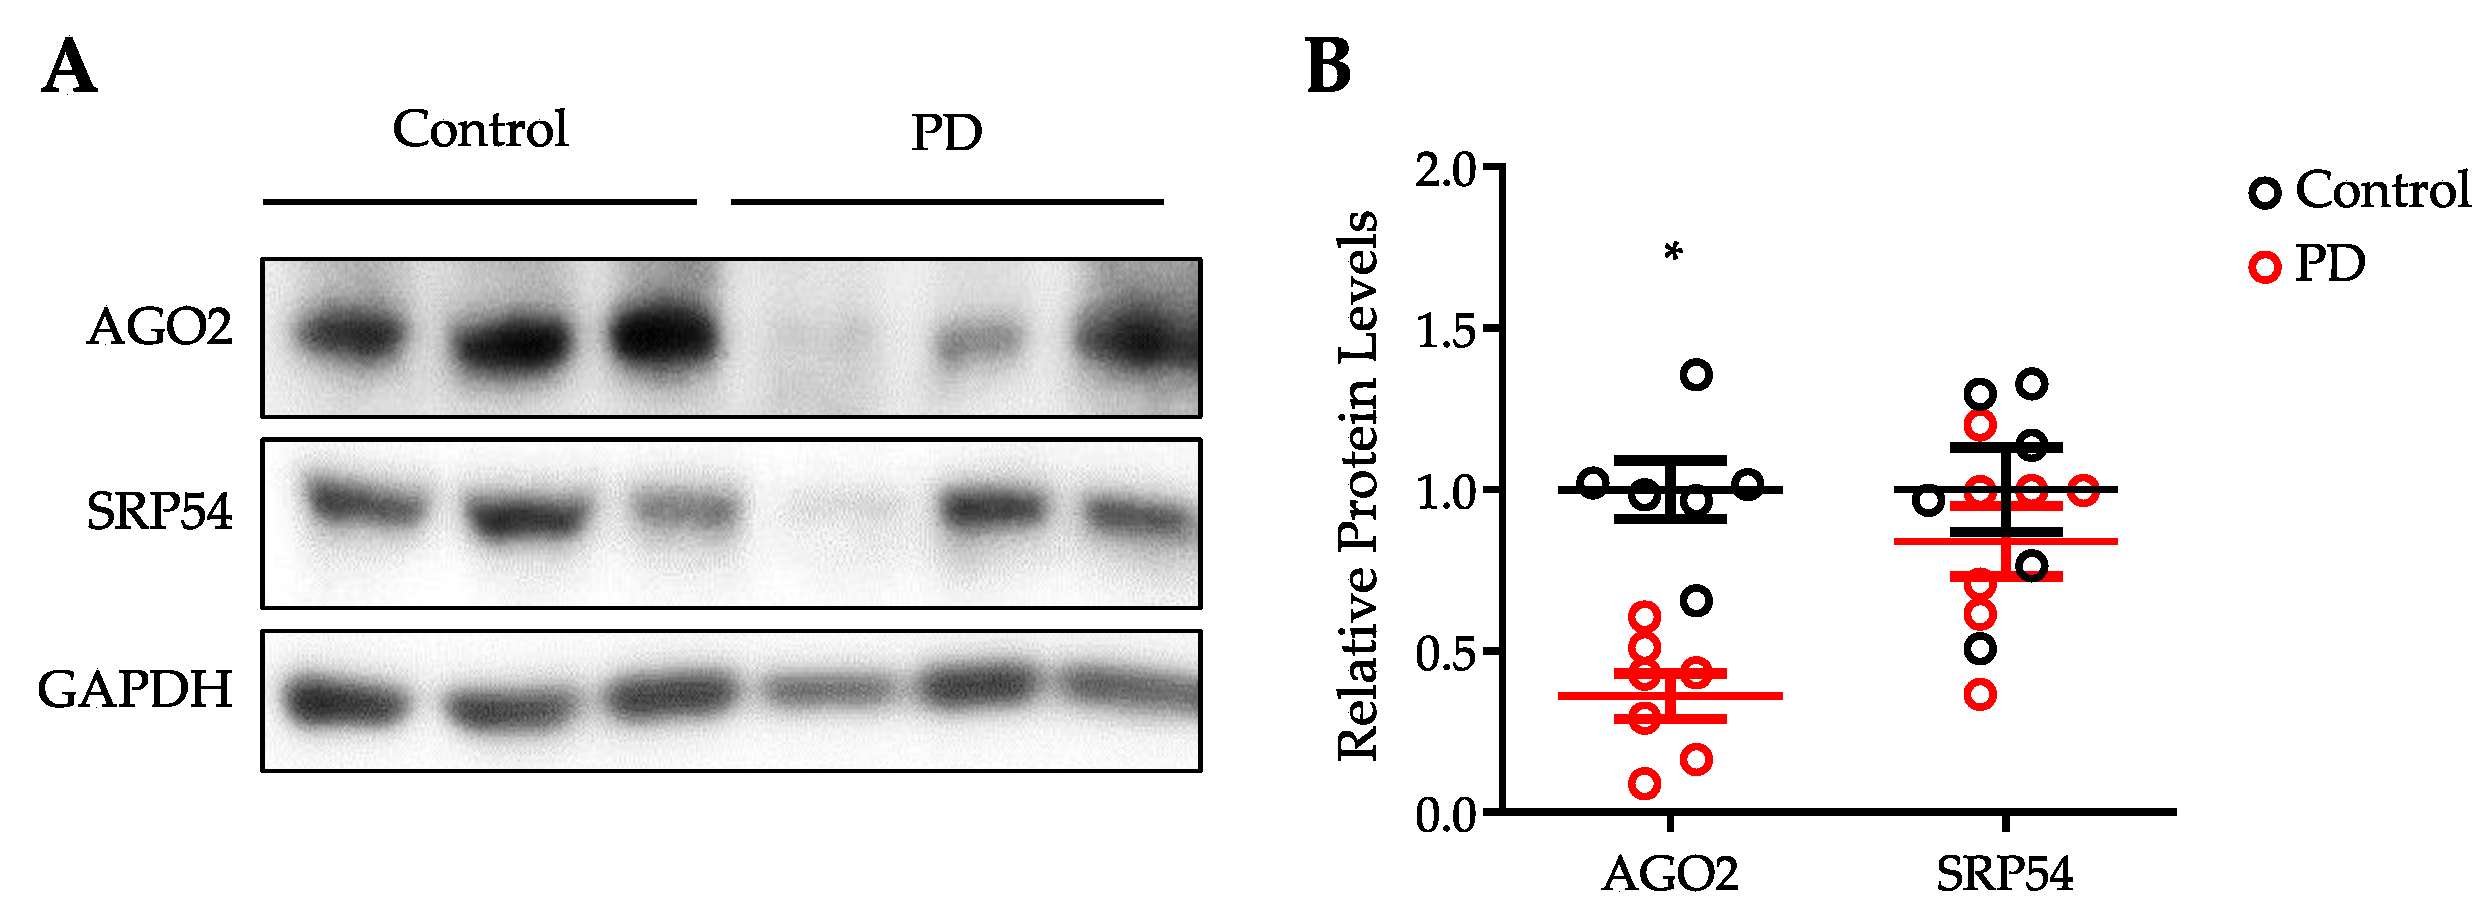
3.4. Expression of AGO2 Is Reduced in the Substantia Nigra of PD Patients
4. Discussion
Supplementary Materials
Author Contributions
Funding
Institutional Review Board Statement
Informed Consent Statement
Data Availability Statement
Acknowledgments
Conflicts of Interest
References
- Marti, M.J.; Tolosa, E.; Campdelacreu, J. Clinical overview of the synucleinopathies. Mov. Disord. 2003, 18 (Suppl. 6), S21–S27. [Google Scholar] [CrossRef]
- Meissner, W.G.; Frasier, M.; Gasser, T.; Goetz, C.G.; Lozano, A.; Piccini, P.; Obeso, J.A.; Rascol, O.; Schapira, A.; Voon, V.; et al. Priorities in Parkinson’s disease research. Nat. Rev. Drug Discov. 2011, 10, 377–393. [Google Scholar] [CrossRef] [PubMed]
- Ritchie, H. Causes of Death. 2018. Available online: https://ourworldindata.org/causes-of-death (accessed on 1 August 2021).
- Henderson, M.X.; Trojanowski, J.Q.; Lee, V.M. alpha-Synuclein pathology in Parkinson′s disease and related alpha-synucleinopathies. Neurosci. Lett. 2019, 709, 134316. [Google Scholar] [CrossRef]
- Imbriani, P.; Sciamanna, G.; Santoro, M.; Schirinzi, T.; Pisani, A. Promising rodent models in Parkinson’s disease. Parkinsonism Relat. Disord. 2018, 46 (Suppl. 1), S10–S14. [Google Scholar] [CrossRef]
- Iljina, M.; Garcia, G.A.; Horrocks, M.H.; Tosatto, L.; Choi, M.L.; Ganzinger, K.A.; Abramov, A.Y.; Gandhi, S.; Wood, N.W.; Cremades, N.; et al. Kinetic model of the aggregation of alpha-synuclein provides insights into prion-like spreading. Proc. Natl. Acad. Sci. USA 2016, 113, E1206–E1215. [Google Scholar] [CrossRef] [Green Version]
- Hernandez, S.M.; Tikhonova, E.B.; Karamyshev, A.L. Protein-Protein Interactions in Alpha-Synuclein Biogenesis: New Potential Targets in Parkinson’s Disease. Front. Aging Neurosci. 2020, 12, 72. [Google Scholar] [CrossRef] [PubMed]
- Kriegenburg, F.; Ellgaard, L.; Hartmann-Petersen, R. Molecular chaperones in targeting misfolded proteins for ubiquitin-dependent degradation. FEBS J. 2012, 279, 532–542. [Google Scholar] [CrossRef]
- Burmann, B.M.; Gerez, J.A.; Matecko-Burmann, I.; Campioni, S.; Kumari, P.; Ghosh, D.; Mazur, A.; Aspholm, E.E.; Sulskis, D.; Wawrzyniuk, M.; et al. Regulation of alpha-synuclein by chaperones in mammalian cells. Nature 2020, 577, 127–132. [Google Scholar] [CrossRef]
- Karamyshev, A.L.; Patrick, A.E.; Karamysheva, Z.N.; Griesemer, D.S.; Hudson, H.; Tjon-Kon-Sang, S.; Nilsson, I.; Otto, H.; Liu, Q.; Rospert, S.; et al. Inefficient SRP interaction with a nascent chain triggers a mRNA quality control pathway. Cell 2014, 156, 146–157. [Google Scholar] [CrossRef] [Green Version]
- Karamyshev, A.L.; Karamysheva, Z.N. Lost in Translation: Ribosome-Associated mRNA and Protein Quality Controls. Front. Genet. 2018, 9, 431. [Google Scholar] [CrossRef] [PubMed] [Green Version]
- Pinarbasi, E.S.; Karamyshev, A.L.; Tikhonova, E.B.; Wu, I.H.; Hudson, H.; Thomas, P.J. Pathogenic Signal Sequence Mutations in Progranulin Disrupt SRP Interactions Required for mRNA Stability. Cell Rep. 2018, 23, 2844–2851. [Google Scholar] [CrossRef] [PubMed]
- Karamysheva, Z.N.; Tikhonova, E.B.; Karamyshev, A.L. Granulin in Frontotemporal Lobar Degeneration: Molecular Mechanisms of the Disease. Front. Neurosci. 2019, 13, 395. [Google Scholar] [CrossRef] [Green Version]
- Tikhonova, E.B.; Karamysheva, Z.N.; von Heijne, G.; Karamyshev, A.L. Silencing of Aberrant Secretory Protein Expression by Disease-Associated Mutations. J. Mol. Biol. 2019, 431, 2567–2580. [Google Scholar] [CrossRef]
- Karamyshev, A.L.; Tikhonova, E.B.; Karamysheva, Z.N. Translational Control of Secretory Proteins in Health and Disease. Int. J. Mol. Sci. 2020, 21, 2538. [Google Scholar] [CrossRef] [PubMed] [Green Version]
- Akopian, D.; Shen, K.; Zhang, X.; Shan, S.O. Signal recognition particle: An essential protein-targeting machine. Annu. Rev. Biochem. 2013, 82, 693–721. [Google Scholar] [CrossRef] [PubMed] [Green Version]
- Kellogg, M.K.; Miller, S.C.; Tikhonova, E.B.; Karamyshev, A.L. SRPassing Co-translational Targeting: The Role of the Signal Recognition Particle in Protein Targeting and mRNA Protection. Int. J. Mol. Sci. 2021, 22, 6284. [Google Scholar] [CrossRef]
- Chu, Y.; Yue, X.; Younger, S.T.; Janowski, B.A.; Corey, D.R. Involvement of argonaute proteins in gene silencing and activation by RNAs complementary to a non-coding transcript at the progesterone receptor promoter. Nucleic Acids Res. 2010, 38, 7736–7748. [Google Scholar] [CrossRef]
- Karamysheva, Z.N.; Tikhonova, E.B.; Grozdanov, P.N.; Huffman, J.C.; Baca, K.R.; Karamyshev, A.; Denison, R.B.; MacDonald, C.C.; Zhang, K.; Karamyshev, A.L. Polysome Profiling in Leishmania, Human Cells and Mouse Testis. J. Vis. Exp. 2018, 134, 57600. [Google Scholar] [CrossRef]
- Lee, B.R.; Kamitani, T. Improved immunodetection of endogenous alpha-synuclein. PLoS ONE 2011, 6, e23939. [Google Scholar] [CrossRef] [Green Version]
- Schmittgen, T.D.; Livak, K.J. Analyzing real-time PCR data by the comparative C(T) method. Nat. Protoc. 2008, 3, 1101–1108. [Google Scholar] [CrossRef]
- Nilsson, I.; Lara, P.; Hessa, T.; Johnson, A.E.; von Heijne, G.; Karamyshev, A.L. The code for directing proteins for translocation across ER membrane: SRP cotranslationally recognizes specific features of a signal sequence. J. Mol. Biol. 2015, 427, 1191–1201. [Google Scholar] [CrossRef] [PubMed] [Green Version]
- Costa, E.A.; Subramanian, K.; Nunnari, J.; Weissman, J.S. Defining the physiological role of SRP in protein-targeting efficiency and specificity. Science 2018, 359, 689–692. [Google Scholar] [CrossRef] [Green Version]
- Koba, M.; Konopa, J. Actinomycin D and its mechanisms of action. Postepy Hig. Med. Dosw. 2005, 59, 290–298. [Google Scholar]
- Li, X.; Wang, X.; Cheng, Z.; Zhu, Q. AGO2 and its partners: A silencing complex, a chromatin modulator, and new features. Crit. Rev. Biochem. Mol. Biol. 2020, 55, 33–53. [Google Scholar] [CrossRef]
- Dickson, D.W. Neuropathology of Parkinson disease. Parkinsonism Relat. Disord. 2018, 46 (Suppl. 1), S30–S33. [Google Scholar] [CrossRef] [PubMed]
- Lunati, A.; Lesage, S.; Brice, A. The genetic landscape of Parkinson’s disease. Rev. Neurol. 2018, 174, 628–643. [Google Scholar] [CrossRef]
- Neystat, M.; Lynch, T.; Przedborski, S.; Kholodilov, N.; Rzhetskaya, M.; Burke, R.E. Alpha-synuclein expression in substantia nigra and cortex in Parkinson′s disease. Mov. Disord. 1999, 14, 417–422. [Google Scholar] [CrossRef]
- Rockenstein, E.; Hansen, L.A.; Mallory, M.; Trojanowski, J.Q.; Galasko, D.; Masliah, E. Altered expression of the synuclein family mRNA in Lewy body and Alzheimer’s disease. Brain Res. 2001, 914, 48–56. [Google Scholar] [CrossRef]
- Grundemann, J.; Schlaudraff, F.; Haeckel, O.; Liss, B. Elevated alpha-synuclein mRNA levels in individual UV-laser-microdissected dopaminergic substantia nigra neurons in idiopathic Parkinson′s disease. Nucleic Acids Res. 2008, 36, e38. [Google Scholar] [CrossRef] [Green Version]
- Quinn, J.G.; Coulson, D.T.; Brockbank, S.; Beyer, N.; Ravid, R.; Hellemans, J.; Irvine, G.B.; Johnston, J.A. Alpha-Synuclein mRNA and soluble alpha-synuclein protein levels in post-mortem brain from patients with Parkinson′s disease, dementia with Lewy bodies, and Alzheimer′s disease. Brain Res. 2012, 1459, 71–80. [Google Scholar] [CrossRef]
- Okun, M.M.; Eskridge, E.M.; Shields, D. Truncations of a secretory protein define minimum lengths required for binding to signal recognition particle and translocation across the endoplasmic reticulum membrane. J. Biol. Chem. 1990, 265, 7478–7484. [Google Scholar] [CrossRef]
- Walter, P.; Blobel, G. Translocation of proteins across the endoplasmic reticulum III. Signal recognition protein (SRP) causes signal sequence-dependent and site-specific arrest of chain elongation that is released by microsomal membranes. J. Cell Biol. 1981, 91, 557–561. [Google Scholar] [CrossRef] [PubMed]
- Krieg, U.C.; Walter, P.; Johnson, A.E. Photocrosslinking of the signal sequence of nascent preprolactin to the 54-kilodalton polypeptide of the signal recognition particle. Proc. Natl. Acad. Sci. USA 1986, 83, 8604–8608. [Google Scholar] [CrossRef] [PubMed] [Green Version]
- Sun, S.; Li, X.; Mariappan, M. Signal Sequences Encode Information for Protein Folding in the Endoplasmic Reticulum. bioRxiv 2020. [Google Scholar] [CrossRef]
- Lesage, S.; Anheim, M.; Letournel, F.; Bousset, L.; Honore, A.; Rozas, N.; Pieri, L.; Madiona, K.; Durr, A.; Melki, R.; et al. G51D alpha-synuclein mutation causes a novel parkinsonian-pyramidal syndrome. Ann. Neurol. 2013, 73, 459–471. [Google Scholar] [CrossRef]
- Fares, M.B.; Ait-Bouziad, N.; Dikiy, I.; Mbefo, M.K.; Jovicic, A.; Kiely, A.; Holton, J.L.; Lee, S.J.; Gitler, A.D.; Eliezer, D.; et al. The novel Parkinson’s disease linked mutation G51D attenuates in vitro aggregation and membrane binding of alpha-synuclein, and enhances its secretion and nuclear localization in cells. Hum. Mol. Genet. 2014, 23, 4491–4509. [Google Scholar] [CrossRef]
- Ren, G.; Wang, X.; Hao, S.; Hu, H.; Wang, C.C. Translocation of alpha-synuclein expressed in Escherichia coli. J. Bacteriol. 2007, 189, 2777–2786. [Google Scholar] [CrossRef] [Green Version]
- Zhou, Y.; Gu, G.; Goodlett, D.R.; Zhang, T.; Pan, C.; Montine, T.J.; Montine, K.S.; Aebersold, R.H.; Zhang, J. Analysis of alpha-synuclein-associated proteins by quantitative proteomics. J. Biol. Chem. 2004, 279, 39155–39164. [Google Scholar] [CrossRef] [PubMed] [Green Version]
- Lessel, D.; Zeitler, D.M.; Reijnders, M.R.F.; Kazantsev, A.; Hassani Nia, F.; Bartholomaus, A.; Martens, V.; Bruckmann, A.; Graus, V.; McConkie-Rosell, A.; et al. Germline AGO2 mutations impair RNA interference and human neurological development. Nat. Commun. 2020, 11, 5797. [Google Scholar] [CrossRef]


Publisher’s Note: MDPI stays neutral with regard to jurisdictional claims in published maps and institutional affiliations. |
© 2021 by the authors. Licensee MDPI, Basel, Switzerland. This article is an open access article distributed under the terms and conditions of the Creative Commons Attribution (CC BY) license (https://creativecommons.org/licenses/by/4.0/).
Share and Cite
Hernandez, S.M.; Tikhonova, E.B.; Baca, K.R.; Zhao, F.; Zhu, X.; Karamyshev, A.L. Unexpected Implication of SRP and AGO2 in Parkinson’s Disease: Involvement in Alpha-Synuclein Biogenesis. Cells 2021, 10, 2792. https://doi.org/10.3390/cells10102792
Hernandez SM, Tikhonova EB, Baca KR, Zhao F, Zhu X, Karamyshev AL. Unexpected Implication of SRP and AGO2 in Parkinson’s Disease: Involvement in Alpha-Synuclein Biogenesis. Cells. 2021; 10(10):2792. https://doi.org/10.3390/cells10102792
Chicago/Turabian StyleHernandez, Sarah M., Elena B. Tikhonova, Kristen R. Baca, Fanpeng Zhao, Xiongwei Zhu, and Andrey L. Karamyshev. 2021. "Unexpected Implication of SRP and AGO2 in Parkinson’s Disease: Involvement in Alpha-Synuclein Biogenesis" Cells 10, no. 10: 2792. https://doi.org/10.3390/cells10102792