Article

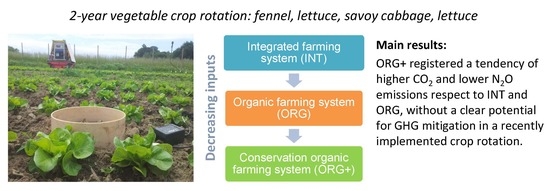
Greenhouse Gas Emissions from Soil Cultivated with Vegetables in Crop Rotation under Integrated, Organic and Organic Conservation Management in a Mediterranean Environment

1
Institute of Life Sciences, Scuola Superiore Sant'Anna, Via Santa Cecilia, 3, 56127 Pisa, Italy
2
Department of Agriculture, Food and Environment, University of Pisa, Via del Borghetto, 80, 56124, Pisa, Italy
*
Author to whom correspondence should be addressed.
These authors contributed equally.
Agronomy 2019, 9(8), 446; https://doi.org/10.3390/agronomy9080446
Submission received: 2 July 2019 / Revised: 6 August 2019 / Accepted: 11 August 2019 / Published: 13 August 2019
(This article belongs to the Special Issue Smart Management of Conservative, Organic and Integrated Agriculture)

Abstract

:
A combination of organic and conservation approaches have not been widely tested, neither considering agronomic implications nor the impacts on the environment. Focussing on the effect of agricultural practices on greenhouse gas (GHG) emissions from soil, the hypothesis of this research is that the organic conservation system (ORG+) may reduce emissions of N2O, CH4 and CO2 from soil, compared to an integrated farming system (INT) and an organic (ORG) system in a two-year irrigated vegetable crop rotation set up in 2014, in a Mediterranean environment. The crop rotation included: Savoy cabbage (Brassica oleracea var. sabauda L. cv. Famosa), spring lettuce (Lactuca sativa L. cv. Justine), fennel (Foeniculum vulgare Mill. cv. Montebianco) and summer lettuce (L. sativa cv. Ballerina). Fluxes from soil of N2O, CH4 and CO2 were measured from October 2014 to July 2016 with the flow-through non-steady state chamber technique using a mobile instrument equipped with high precision analysers. Both cumulative and daily N2O emissions were mainly lower in ORG+ than in INT and ORG. All the cropping systems acted as a sink of CH4, with no significant differences among treatments. The ORG and ORG+ systems accounted for higher cumulative and daily CO2 emissions than INT, maybe due to the stimulating effect on soil respiration of organic material (fertilizers/plant biomass) supplied in ORG and ORG+. Overall, the integration of conservation and organic agriculture showed a tendency for higher CO2 emissions and lower N2O emissions than the other treatments, without any clear results on its potential for mitigating GHG emissions from soil.

Graphical Abstract

1. Introduction

In the last years, different concepts of sustainable agriculture have been proposed to increase food production while minimizing environmental impacts and maintaining economic sustainability.
Among them integrated farming (INT) has been promoted as a compromise between the reduction of the negative impacts of agricultural production on the environment and the economic sustainability of farms, and it has been described as a “third way” between conventional and organic agriculture [1,2].
Beside INT, other more challenging agricultural models has been proposed, such as the one proposing the integration between conservation agriculture and organic agriculture [3,4].
Conservation agriculture has been identified as: (i) A strategy for climate change adaptation, because it may increase soil organic matter improving resilience to extreme events, and (ii) for greenhouse gas (GHG) emissions mitigation thanks to the potentially improved carbon sequestration [5,6,7]. However, weed control remains one of the major issues under conservative tillage, thus the use of synthetic herbicides is required [8].
Organic farming is one of the main forms of agriculture that aims to balance the demands of food safety with environmental sustainability. Although the adoption of conservative tillage is also recommended in organic farming [9], several practices normally adopted in organic systems, and above all in vegetable production, imply frequent soil disturbance. Indeed, weed control is usually carried out through mechanical operations, including also ploughing whenever necessary against perennial weeds. Likewise, the application of organic fertilizers, manures and even green manures normally consists of at least shallow tillage operations. Thus, conservation tillage in organic agriculture poses some limitations in controlling weeds without herbicides, as well as in nutrient supply for reduced mineralization rate [3]. Still, it could provide positive effects on the environment.
At present, the effects of combined organic conservation systems have not been widely tested either from an agronomic or environmental point of view [10]. There is a lack of studies testing the effect of organic conservation agriculture on the emissions of carbon dioxide (CO2), nitrous oxide (N2O) and methane (CH4) and the capability to mitigate GHG emissions compared to conventional systems.
In contrast, the effect of conservation tillage practices on GHG emissions from soil has been largely investigated, though with uncertain results. Indeed, some studies reported that conservative tillage increases N2O and CH4 emissions with respect to conventional tillage, while other studies reported lower GHG emissions in conservative than conventional tillage [11,12,13].
Concerning organic agriculture, soil N2O emissions may be affected by the use of organic fertilizers. According to a recent meta-analysis, the use of organic fertilizers can significantly reduce N2O emissions (23% reduction) in Mediterranean conditions with respect to the use of synthetic fertilizers [14].
Both conservation and organic agriculture are characterized by the use of cover crops, due to their well-known benefits for nutrient supply, organic carbon input and for the reduction of soil erosion and nitrate leaching risks [15], but their effect in terms of soil GHG mitigation was investigated only recently [16,17]. The inclusion of cover crops in crop rotations may mitigate soil GHG emissions thanks to an increase in carbon sequestration, a reduction of mineral fertilizers and a decrease in the N losses thanks to the uptake of nitrate by catch crops both in crop and intercrop periods. However, organic agriculture normally adopts the incorporation of soil of the cover crops as green manures that can provoke N2O emissions peaks in the short term after tillage, especially in cases of N-rich cover crops (i.e., legumes) [18,19]. In contrast, conservation agriculture uses cover crops as living mulch, and so far, only one study investigated the effect of this practice on soil GHG emissions, reporting that living mulch can be a source of N2O emissions [20].
The effect of organic conservation systems on the potential of soil to uptake CH4 is not widely reported and data have been collected only in temperate areas. Six et al. [21] summarized these data and reported a greater CH4 uptake under conservation agriculture than under conventional agriculture, that was attributed to the higher pore continuity and the presence of ecological niches for methanotrophic bacteria in conservation agriculture [22]. Indeed, some authors observed lower CH4 uptake both in organic and in conservation agriculture than in conventional agriculture, since several conventional agricultural practices (e.g., mineral nitrogen fertilization, inversion tillage) have an adverse impact on the activity of CH4 oxidizing bacteria [22,23]. Consequently, a system integrating organic and conservation agriculture entails the combination of many of the above reported agricultural practices that can affect soil GHG emissions in different way. The hypothesis of this research is that an organic conservation system (ORG+) may reduce soil emissions of N2O, CH4 and CO2 compared to integrated farming (INT) and organic (ORG) systems, and to that aim, soil GHG fluxes were measured in a recently implemented two-year irrigated vegetable crop rotation in the Mediterranean.

2. Materials and Methods

2.1. Experimental Site Characterization

A two-year field experiment was conducted in the Pisa coastal plain (43° 40' N Lat; 10° 19' E Long; 1 m above mean sea level and 0% slope), at the “Enrico Avanzi” Centre for Agro-Environmental Research of the University of Pisa (Tuscany, Italy) on an irrigated vegetable crop rotation.
The climate there is typical of the north-Mediterranean area, characterized by a long-term average annual rainfall of 907 mm and a mean annual temperature of 15 °C (1986–2013).
The soil is a loamy sand originated from alluvial sediments and classified as a Typic Xerofluvent based on the USDA soil taxonomy [24]. At the beginning of the field experiment the soil was analysed at two depths (0–10 cm and 10–30 cm) to determine: Soil texture (international pipette method), pH (H2O, 1:2.5), soil organic matter content (Walkley-Black method), total N content (Kjeldhal method), available P (Olsen method), exchangeable K (BaCl2 method), conductivity (conductivity meter), C:N and bulk density (soil core method) (Table 1).
The soil water table range from 70 cm during winter to 120 cm in summer.

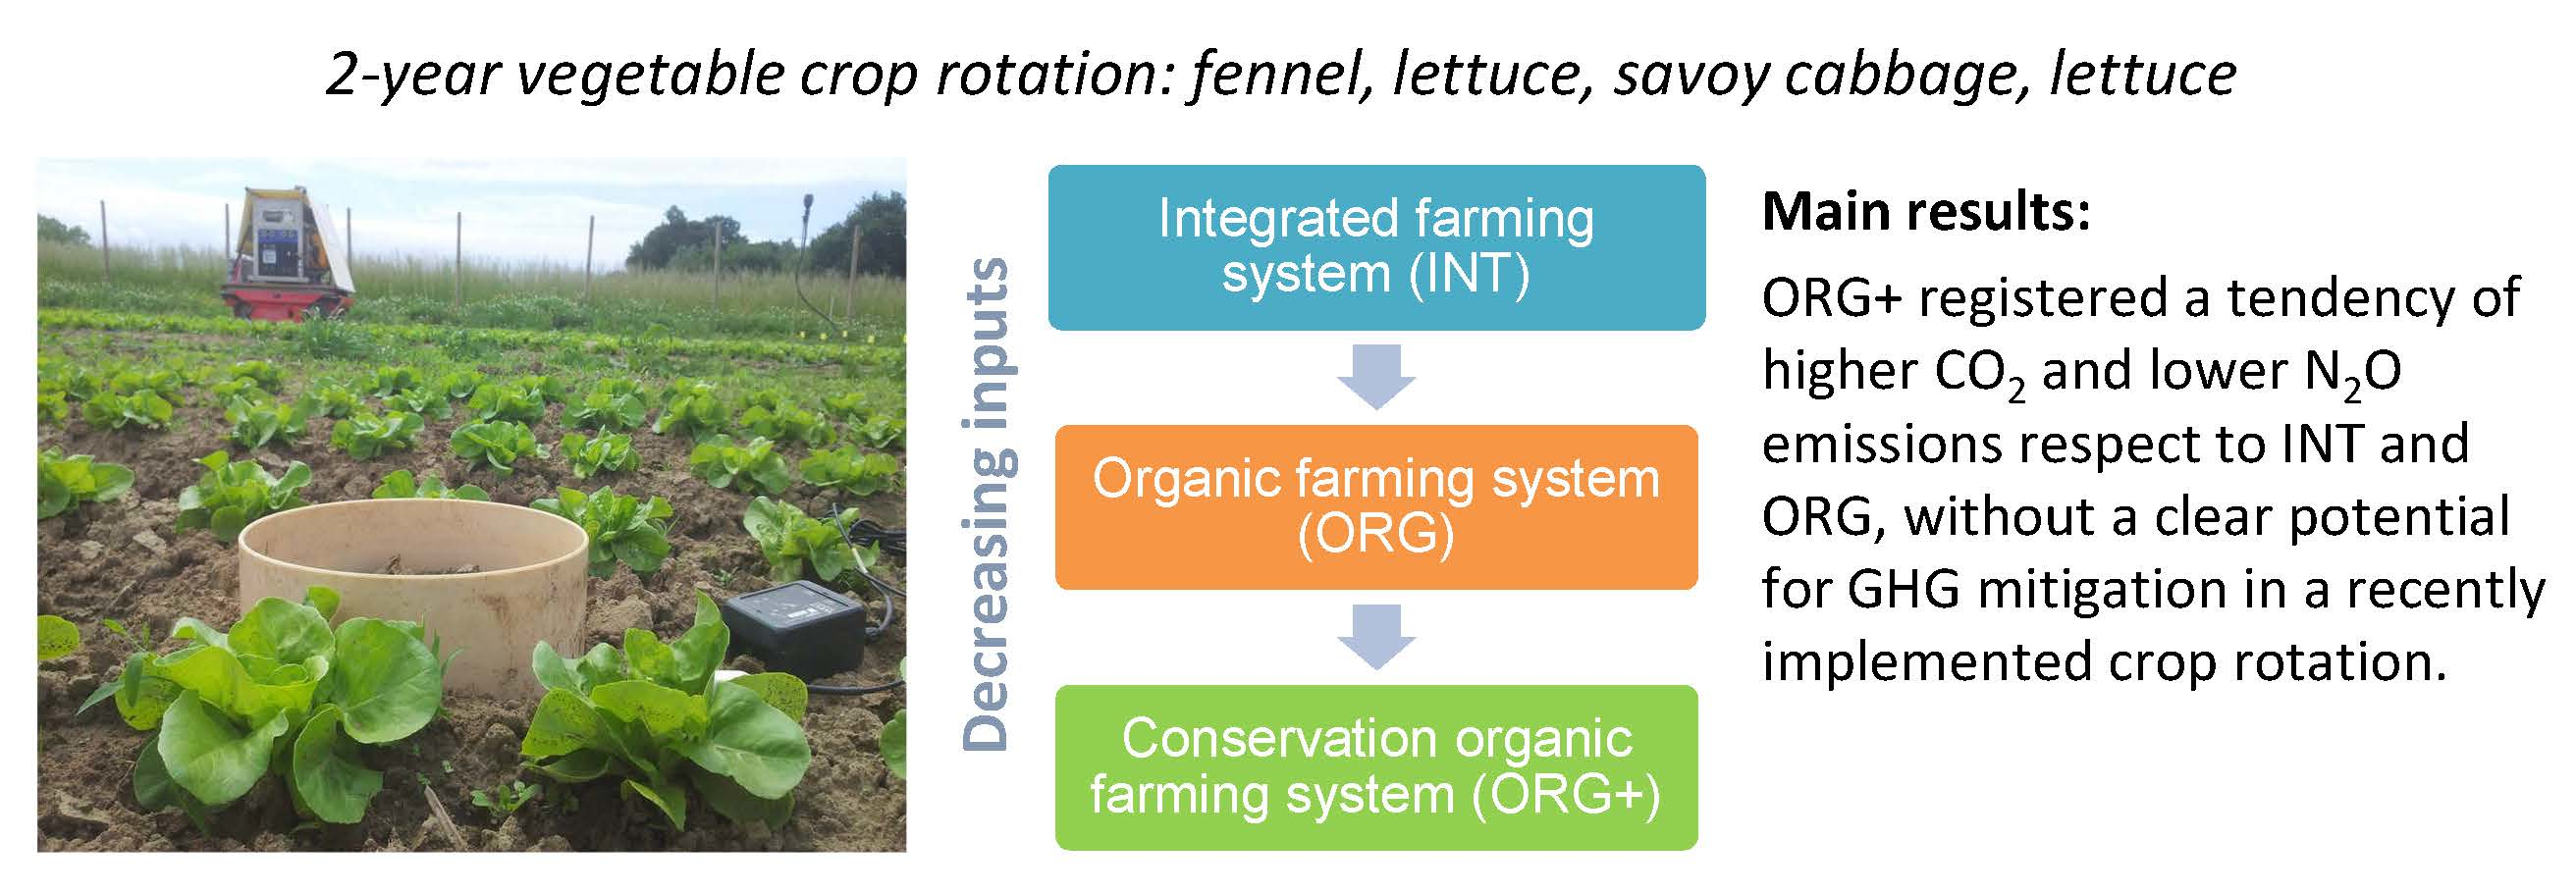
2.2. Experimental Design and Management of the Cropping Systems

The field trial was set up in July 2014. The crops included in the rotation were: Savoy cabbage (Brassica oleracea var. sabauda L. cv. Famosa), spring lettuce (Lactuca sativa L. cv. Justine), fennel (Foeniculum vulgare Mill. Cv. Montebianco) and summer lettuce (Lactuca sativa L. cv. Ballerina) (Figure 1).
The two-year vegetable crop rotation was cultivated under three different management systems: integrated farming with conventional tillage practices, chemical pesticide uses and mineral fertilization (INT); organic farming with conventional tillage practices, organic fertilizers, green manure and physical (mechanical with roller crimper and thermal with flaming) weed control (ORG); organic farming combined with conservation practices including no-tillage, organic fertilizers and cultural weed control (ORG+).
The crop rotation was replicated in space and time. The spatial replicates were two adjacent fields: field 1 (F1), in which the rotation started with fennel, and field 2 (F2), in which the rotation started with cabbage. In each field, the three systems were completely randomized with three replicates constituted by an elementary plot of 3 m width × 21 m length.
The ORG system included a spring green manure mixture incorporated into the soil before transplanting of summer lettuce, composed of field peas (Pisum sativum L.) and faba beans (Vicia faba subsp. minor L.), and a summer green manure mixture—chopped and incorporated into the soil before fennel transplanting—composed of red cowpeas (Vigna unguiculata L. Walp), buckwheat (Fagopyrum esculentum L.), millet (Panicum miliaceum L.) and foxtail millet (Setaria italica L.). The ORG+ system included a red clover (Trifolium pratense L.) directly seeded and established as a living mulch for both summer lettuce and cabbage, and a summer dead mulch, terminated as dead mulch by roller crimper and flaming before the transplanting of fennel, composed of the same plants used in the spring green manure mixture of the ORG system.
Sprinkler irrigation was applied to all treatments during summer season (May–September). Irrigation was supplied daily in the ten days after transplant, and afterwards every 3 days until harvest. No irrigation was provided after significant rain events.
Potassium and phosphate fertilizers were provided just before transplanting (Table 2).
Total nitrogen fertilization of the three cropping systems for the two years was equal to 302.5 kg N ha−1 in INT from mineral fertilizers, 155.6 kg N ha−1 in ORG from organic fertilizers and 56 kg N ha−1 in ORG+ (organic fertilizers) (Table 2 and Table 3).
The level of fertilization and application splits applied in the INT system were in compliance with the maximum amount of fertilizers stated by the integrated pest management (IPM) production disciplinary of Tuscan Regional Government . The fertilization strategy adopted in the ORG and ORG+ systems differed according to their respective references. The ORG system reproduced the standard organic management of field vegetables practiced by growers in the area. The level of fertilization was set as a trade-off between the target of achieving viable yields and keeping production costs under the threshold for profitability. The ORG+ was set as an agro-ecological system aimed at maximising the use of internal natural resources and the provision of agroecosystem services from cover crops (i.e., dead mulch and living mulch), whilst minimising negative impacts on the environment (e.g., by reducing soil tillage and external input application). That is why for ORG+ the level of fertilization was conceived as the minimum amount required by the crops, differentiated according to specific crop needs, to start growing after transplanting, while the remaining amount of nutrients has been assumed to be available from soil or cover crops. Detailed information about agricultural operations, fertilizations and weed management are reported in Table 2 and Table 3.

2.3. Monitoring of Soil N2O, CH4 and CO2 Flux

Fluxes of N2O, CH4 and CO2 were measured from October 2014 to July 2016 by the flow-through non-steady state chamber technique [25], using a mobile instrument developed by West Systems Srl (Florence, Italy) within the LIFE+ “Improved flux Prototypes for N2O emission reduction from Agriculture” (IPNOA) project (www.ipnoa.eu). The instrument is a light tracked vehicle that operates by remote control, equipped with a N2O, carbon monoxide and water vapour detector that uses off-axis integrated cavity output spectroscopy (ICOS) and an ultraportable greenhouse gas analyser (UGGA) to measure CO2, CH4 and water vapour, both provided by Los Gatos Research (LGR) Inc. (Mountain View, CA, USA). Output gas concentrations are given with a scan rate of 1 s. Measured data were recorded using a smartphone connected via Bluetooth®. The technical details of the instrument and its validation were reported in Bosco et al. [26] and Laville et al. [27,28], respectively. Two PVC collars (15 cm height, 30 cm ⌀) were inserted in each plot permanently at a soil depth of 5 cm and removed for short time only at the occurrence of tillage operations. The collars were mounted within plant rows and all the plants within the collars were removed by cutting the sprouts when necessary. To perform the flux measurement, a movable steel chamber (10 cm height, 30 cm ⌀) was connected to the detector through a tube (20 m long, 4 mm ⌀).
The chamber was equipped with an internal fan to guarantee the homogeneity of the gas concentration and a rubber seal to avoid air leaks. The deployment time of the chamber was 2–3 min.
The monitoring of soil GHG fluxes started on 10 October 2014 since the instrument was reserved for another field campaign. For the same reason the GHG monitoring campaign was interrupted from 18 December 2015 to 3 March 2016. Thus, for the calculation of cumulative GHG emissions and for the statistical analysis of the average daily fluxes the dataset was divided in two monitoring periods:
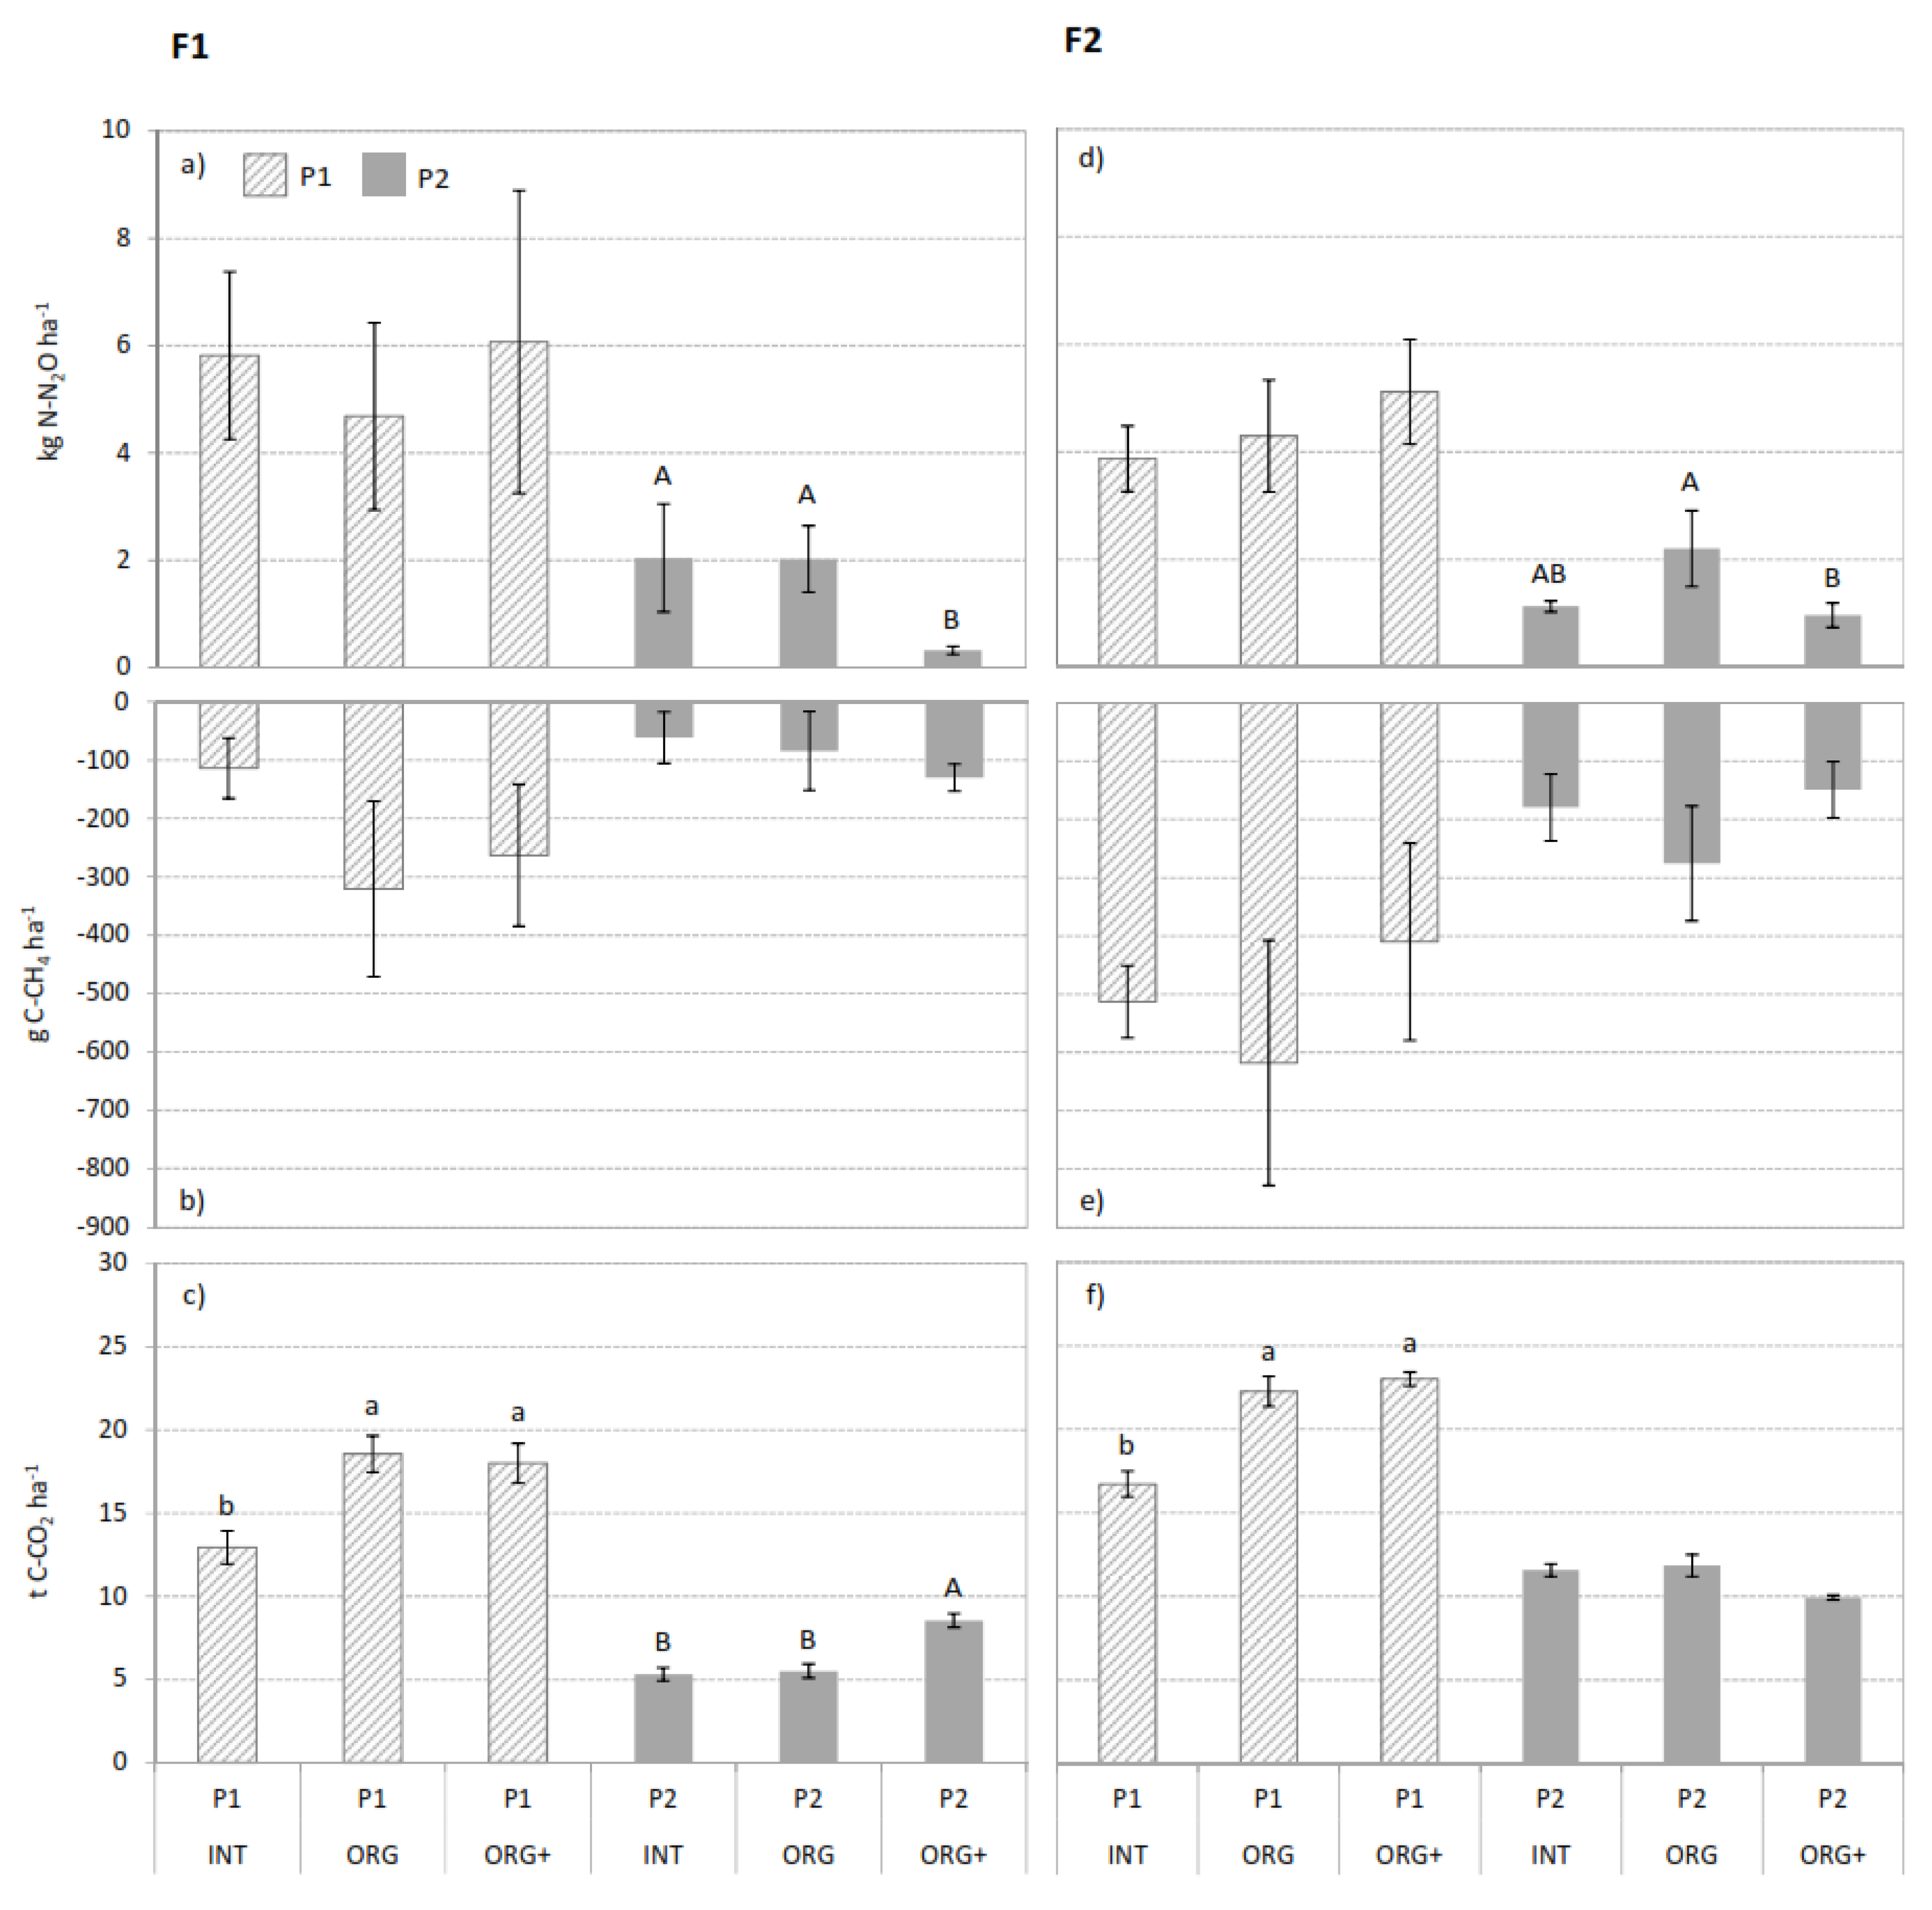
  • Period 1 (P1): going from 16 January 2015, the first day after the last harvest of the winter crops (fennel in F1), until 18 December 2015;
  • Period 2 (P2): going from 3 March 2016 until the end of the monitoring campaign, 24 June 2016 in F1 and 14 July 2016 in F2.

2.4. Auxiliary Measurements

Daily air temperature, atmospheric pressure and rainfall were recorded from the closest weather station (less than 500 m).
Soil temperature and volumetric water content were measured close to each collar simultaneously with the measurement of GHG fluxes from soil, using a dielectric probe (Decagon Devices GS3) inserted into the soil at a depth of 5 cm and linked to the instrument via Bluetooth® connection. Soil water content values were used to calculate the soil water filled pore space (WFPS) according to Equations (1) and (2).
Total   porosity   ( % ) = 1 bulk   density 2.65   × 100
  WFPS   ( % ) = volumetric   water   content total   porosity   × 100
In Equation (1), bulk density was measured using the soil core method and particle density was considered equal to 2.65 g cm−3.
Soil samples were collected from the 0–20 cm soil layer for the determination of nitrate content (N–NO3) in each plot. Three soil cores per plot were mixed to constitute one sample. The samples were stored at 4 °C before their analysis. Before the analysis, each soil sample was dried at 40 °C until constant weight and then it was sieved at 2 mm. A 10 g subsample of soil was extracted using deionised water in 1:2.5 ratio and then it was shacked for 120 min. N–NO3 concentrations were determined using ionic chromatograph. Soil N–NO3 content was calculated based on N sample concentration considering soil dry weight.

2.5. Data Elaboration and Statistical Analysis

Data elaboration and statistical analysis were performed with R software [29], considering α = 0.05 as the passable level of significance.
N2O, CH4 and CO2 measurements were checked for outliers among replicates in each sampling day, through the Grubbs test. After outlier removal, N2O data were log transformed, as residuals deviated strongly from normal distribution. To enable this log-transformation, given the presence of negative values for daily N2O fluxes, N2O fluxes were translated before transformation as: ( N 2 O   f l u x + 0.1 ) m i n   ( N 2 O   f l u x ) , where m i n   ( N 2 O   f l u x ) was the minimum value in the dataset.
One-way ANOVA was used to analyse the effect of the factor “system” in each sampling date and separately for the two fields on: GHG daily fluxes, soil temperature, soil WFPS and soil nitrate concentration along the overall monitoring campaign.
The effect of the systems on average daily fluxes was analysed in the two periods (P1 and P2) and for the two fields separately, through linear mixed effect models, one for each gas, using the R “lme4” package [30]. The two fields were analysed separately because each phase of the crop rotation did not occur simultaneously in the two fields, since the first crops in summer 2014 were fennel in F1 and cabbage in F2.
The system was considered as a fixed factor of the linear mixed effect models, with the replicate as a random effect. When the system had a significant effect on the studied variable, Tukey's HSD post hoc test (α= 0.05) was used to reveal the differences between the levels of the factor system.
The relationships among soil temperatures WFPS, N2O, CH4 and CO2 were analysed through the Spearman’s correlation using the data collected across the overall field campaign and pooling the data of the two fields. Furthermore, the relationship between N2O daily flux and soil nitrate concentration was evaluated through the Spearman’s correlation, considering the monitoring days in which the soil samples were collected. The relationship between CO2 emissions and soil temperature was evaluated to be exponential by plotting the data. Consequently, the analysis of covariance (ANCOVA) was used to compare the relationships between the logarithm of CO2 flux and the soil temperature in the three levels of the factor “system”.
Cumulative emissions of N2O, CH4 and CO2, for both P1 and P2 were calculated by linear interpolation between two close sampling dates and the numerical integration of the function over time, assuming that fluxes changed linearly among sampling days. The effects of the system on the cumulative emissions were analysed through linear mixed effect models, which were built for each gas in the same way as for the daily fluxes.
The overall GHG budget (CO2 equivalents) was calculated multiplying the cumulative value of each gas per period and field by the corresponding global warming potential (GWP) of AR5 [31]. The CO2 equivalents (CO2-eq) were calculated (i) separately for the non-CO2 gases, as the sum of cumulative emissions of N2O and CH4, and (ii) as the net GHG emissions, also considering CO2 emissions.

3. Results

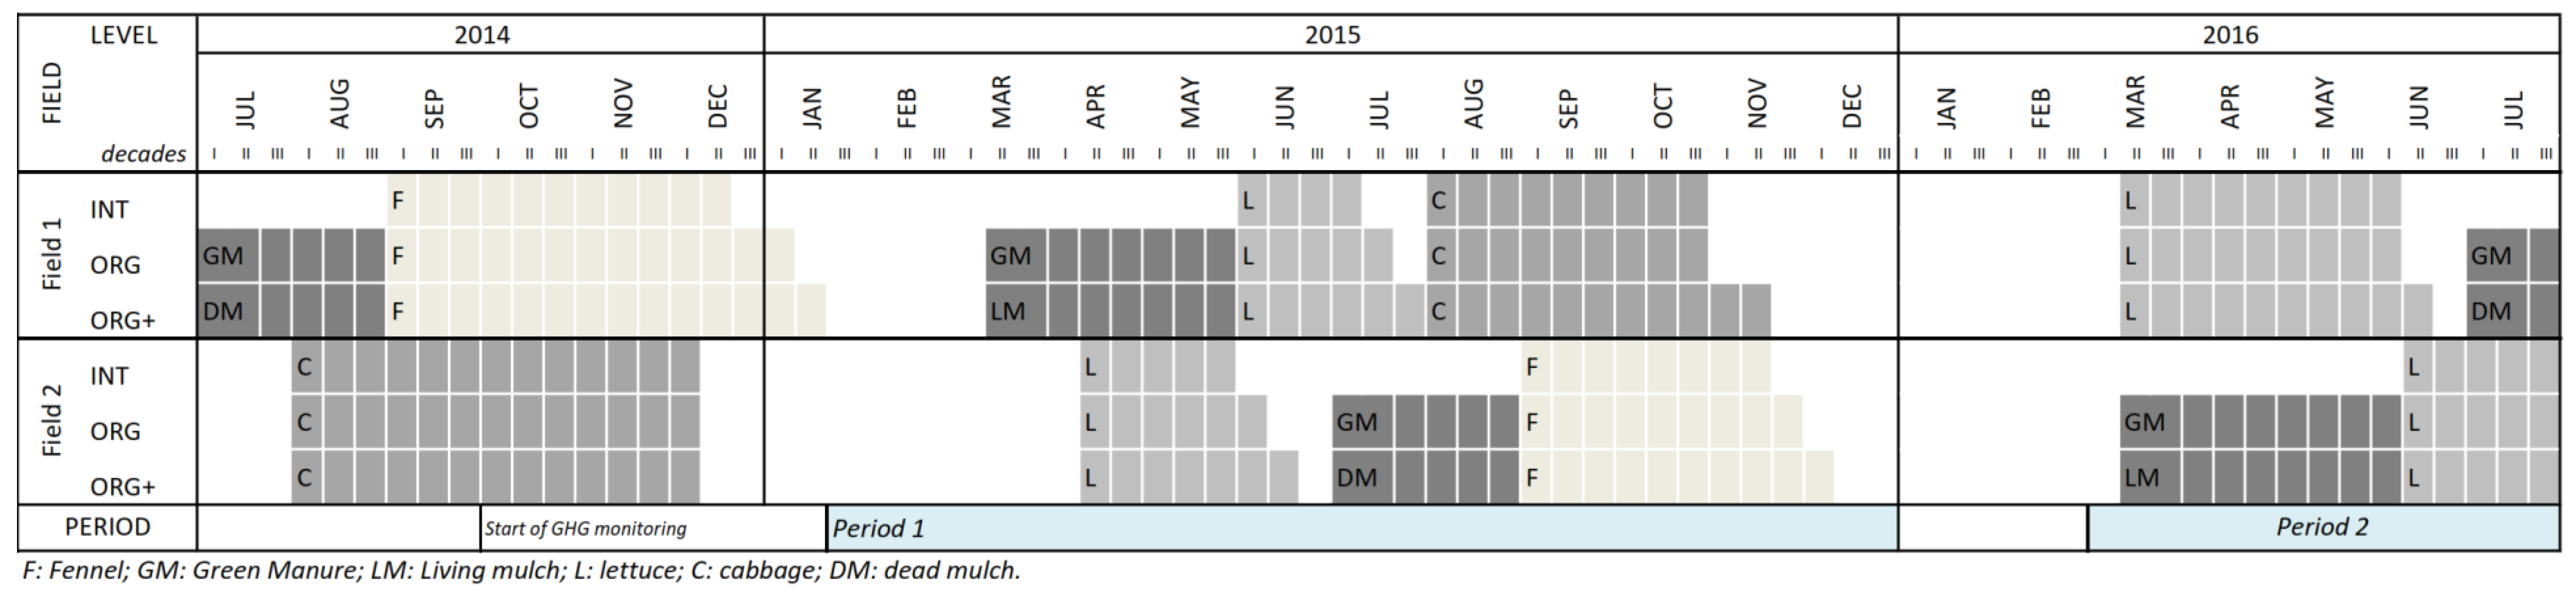
3.1. Meteorological Conditions

During the GHG emissions monitoring periods, monthly average temperatures higher than 20 °C were recorded in summer 2015 (average of June, July and August 24 °C) and summer 2016 (average of June and July 22 °C) (Figure 2).
The monthly average temperature was lower than 10 °C in January–February 2015 and January 2016 (8 °C). The rainiest month was November 2014 (290 mm), while the driest month was July 2015 (3 mm). Along the whole monitoring period, the rainiest periods were August 2015 (232 mm), October 2015 (254 mm), the period between January and February 2016 (372 mm) and in June 2016 (138 mm).

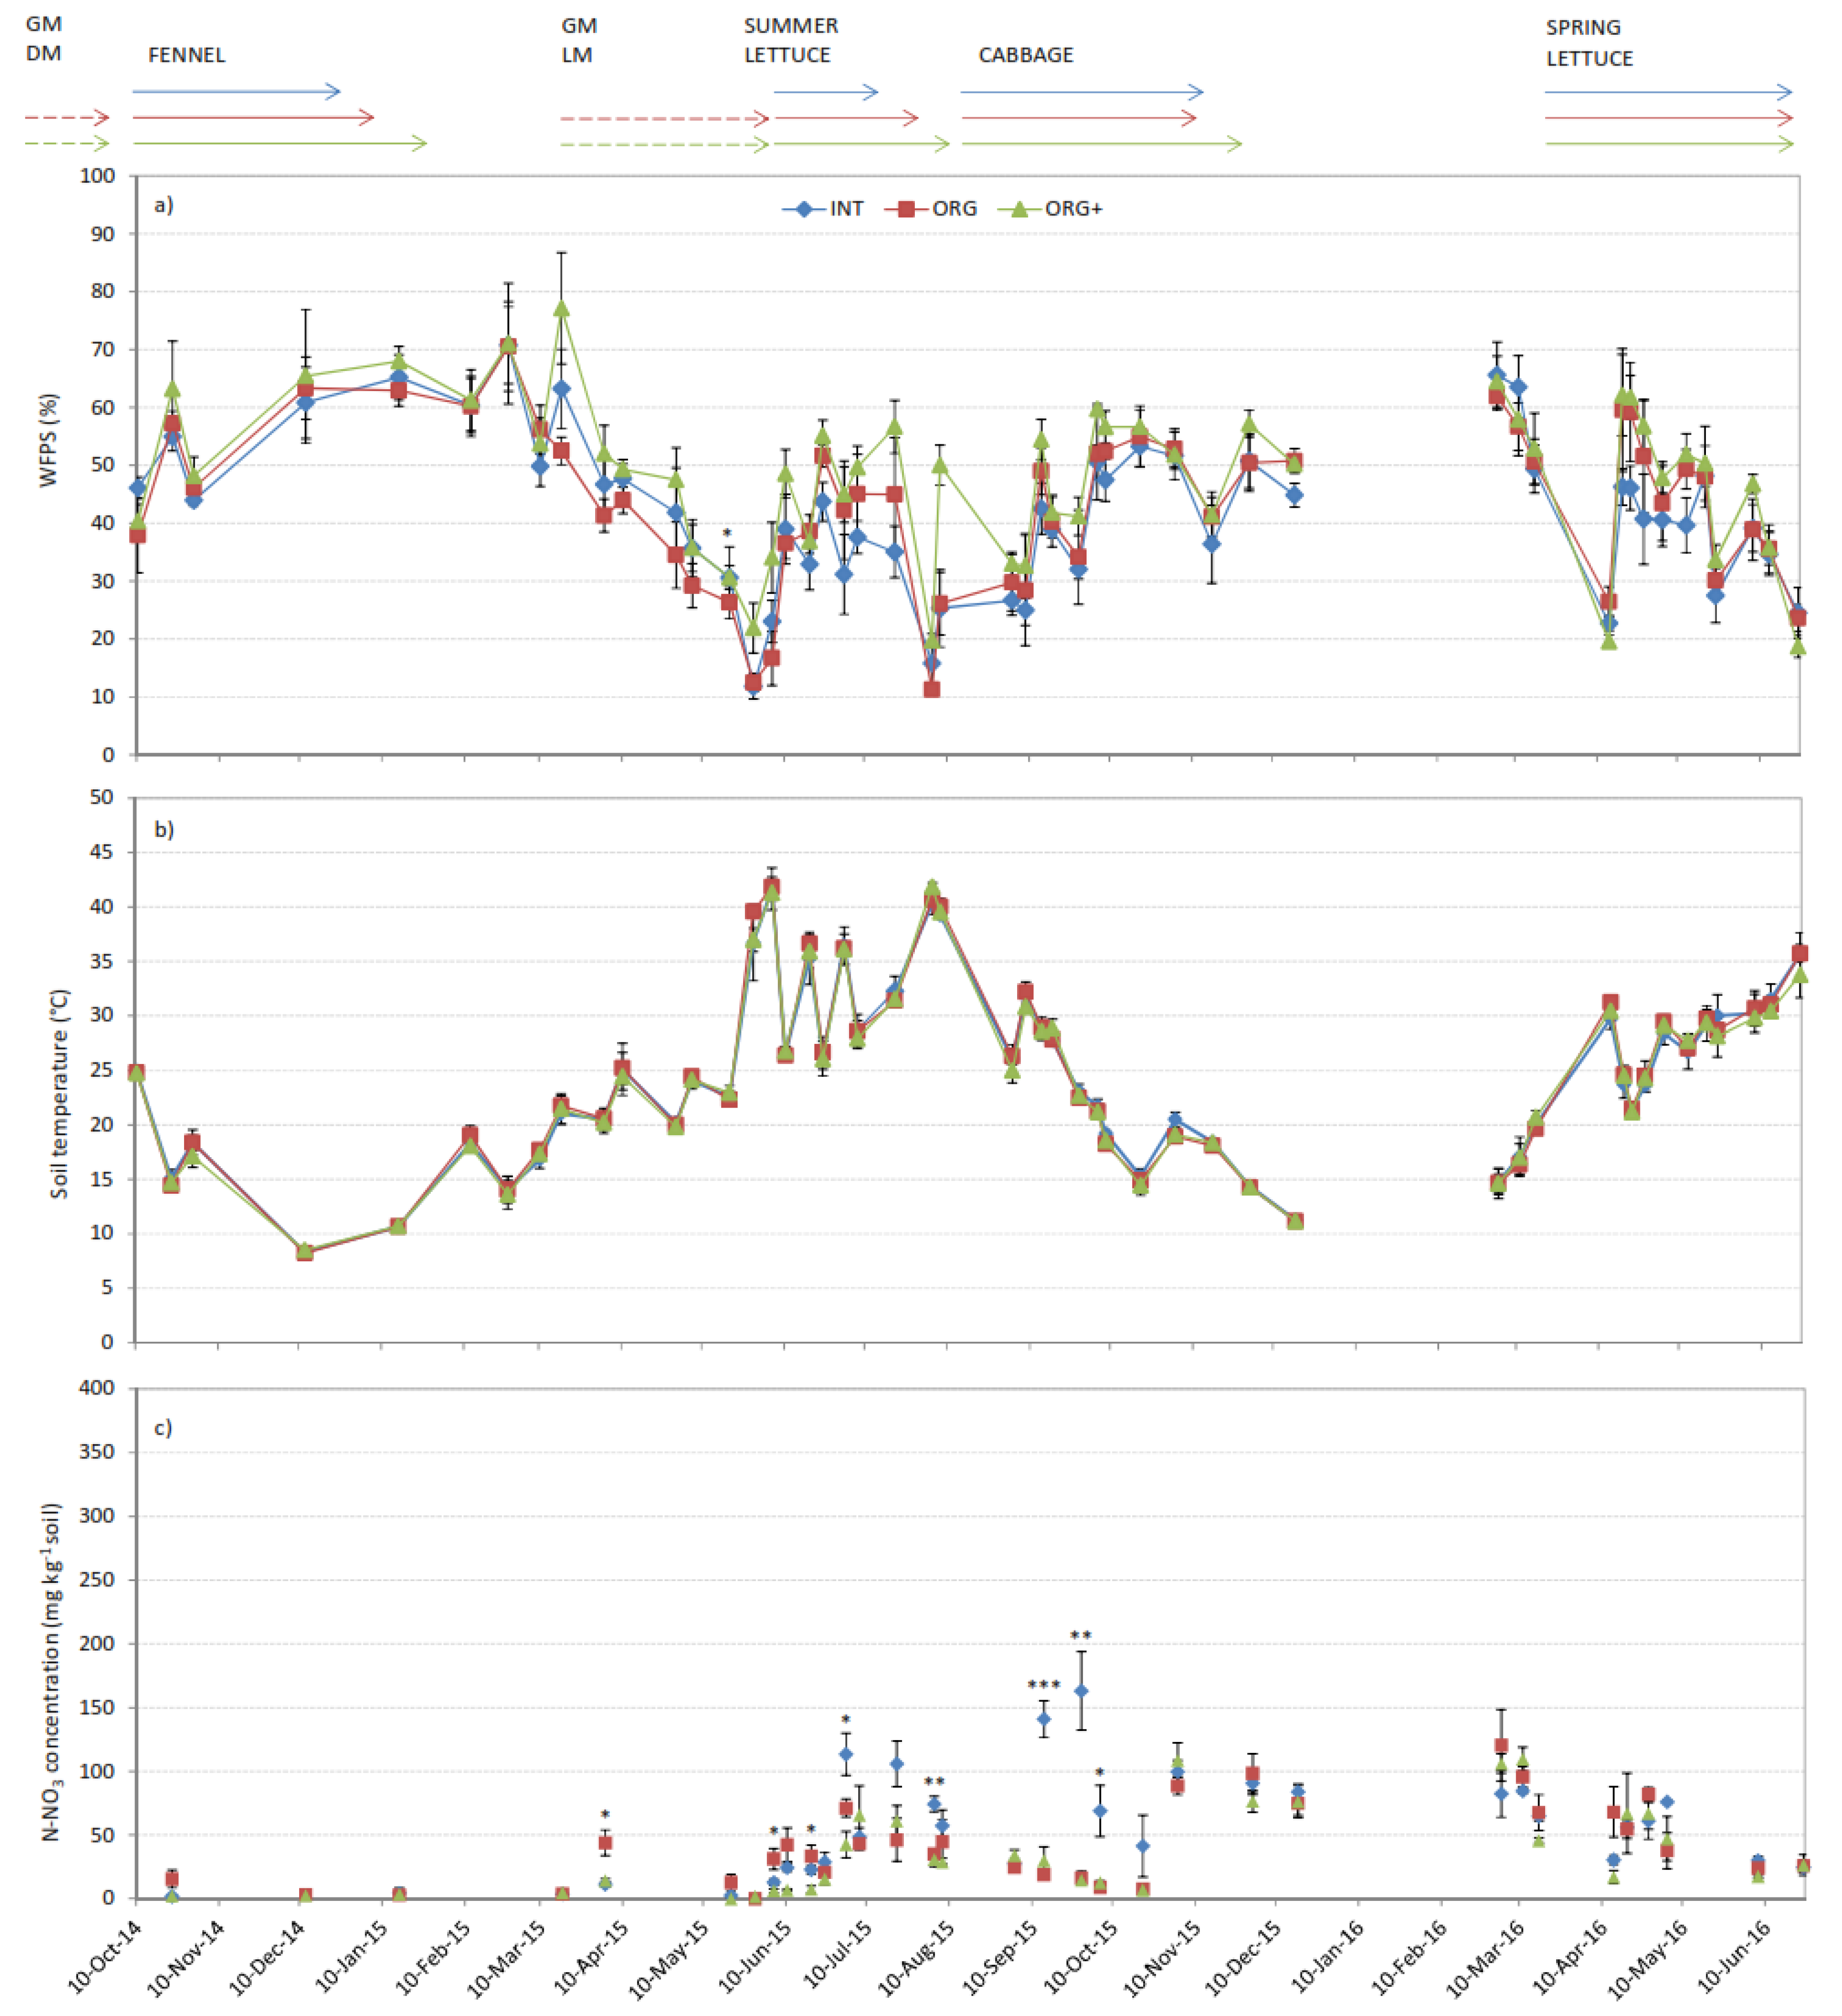
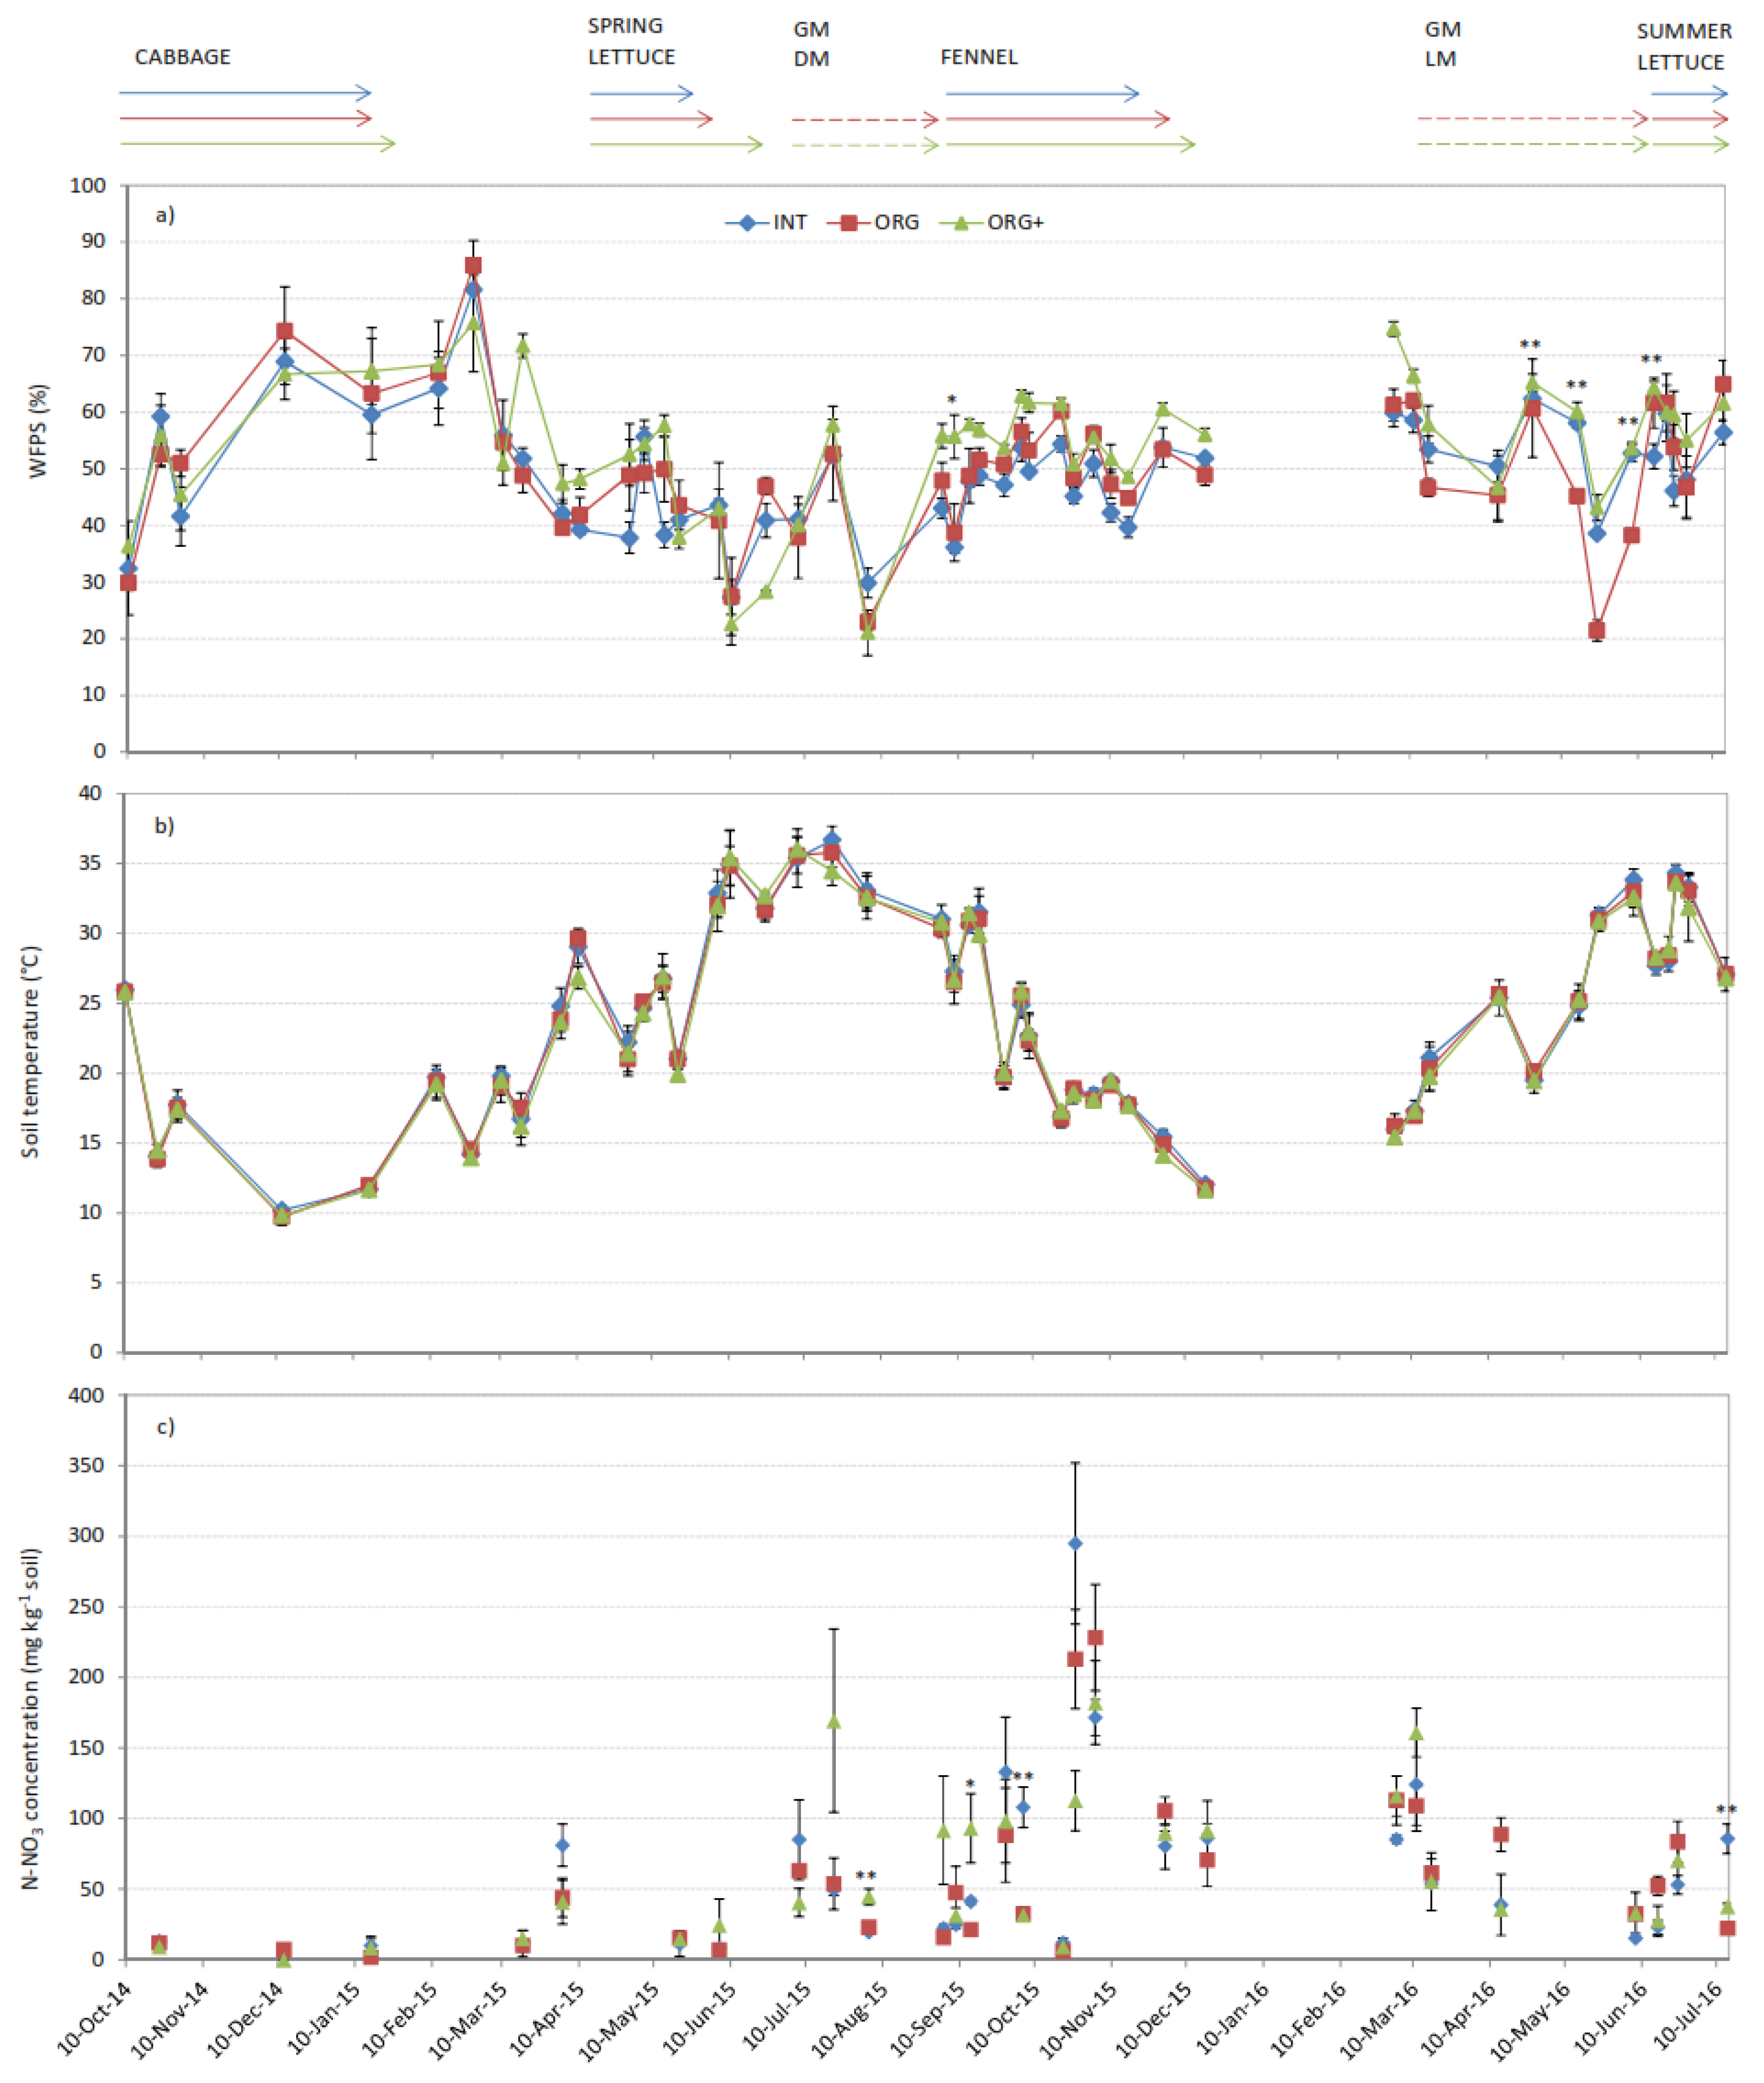
3.2. Soil Water Content, Temperature and Nitrate Dynamic

Water filled pore space (WFPS) values did not differ significantly among INT, ORG and ORG+ systems, in either in F1 or F2, with exceptions of (i) 20 May 2015 in F1, where ORG+ and INT had higher WFPS than ORG, and (ii) the period between May and June 2016 in F2, where ORG+ showed significantly higher WFPS values (Figure 3a and Figure 4a).
The highest WFPS values were registered in both fields in winter, with maximum values in February 2015 (71% in F1 and 81% in F2) and minimum values in May 2015 (12% in F1 and 23% in F2). Indeed, average WFPS values were high in summer period due to irrigation (36% in F1 and to 46% in F2).
Soil temperature was not different among treatments in both fields. The lowest soil temperature (9 °C) was recorded in December 2014 and the highest soil temperature (39 °C) in June and August 2015 (Figure 3b and Figure 4b).
Soil nitrate concentration showed values ranging from 0 to 163 mg kg−1 in F1 and up to 295 mg kg−1 in F2. Nitrate concentration was higher than 60 mg N–NO3 kg−1 in 17 sampling dates out of 33 in F1 and in 17 sampling dates out of 28 in F2. In F1, nitrate concentrations were significantly higher in INT than the other treatments in five dates from July 2015 to October 2015 (average 112 mg N–NO3kg−1); and in ORG in three dates in April 2015 and in June 2015, with summer lettuce (average 36.2 mg N–NO3kg−1). In F2, nitrate concentration was higher in cabbage INT on one date in October 2015 (107.8 mg N–NO3N kg−1) and on one date in July 2016 (average 85.4 mg N–NO3 kg−1). It was higher in ORG+ during August and September 2015; in this case after organic nitrogen fertilization for cabbage (93.1 mg N–NO3 kg−1) (Figure 3c and Figure 4c).

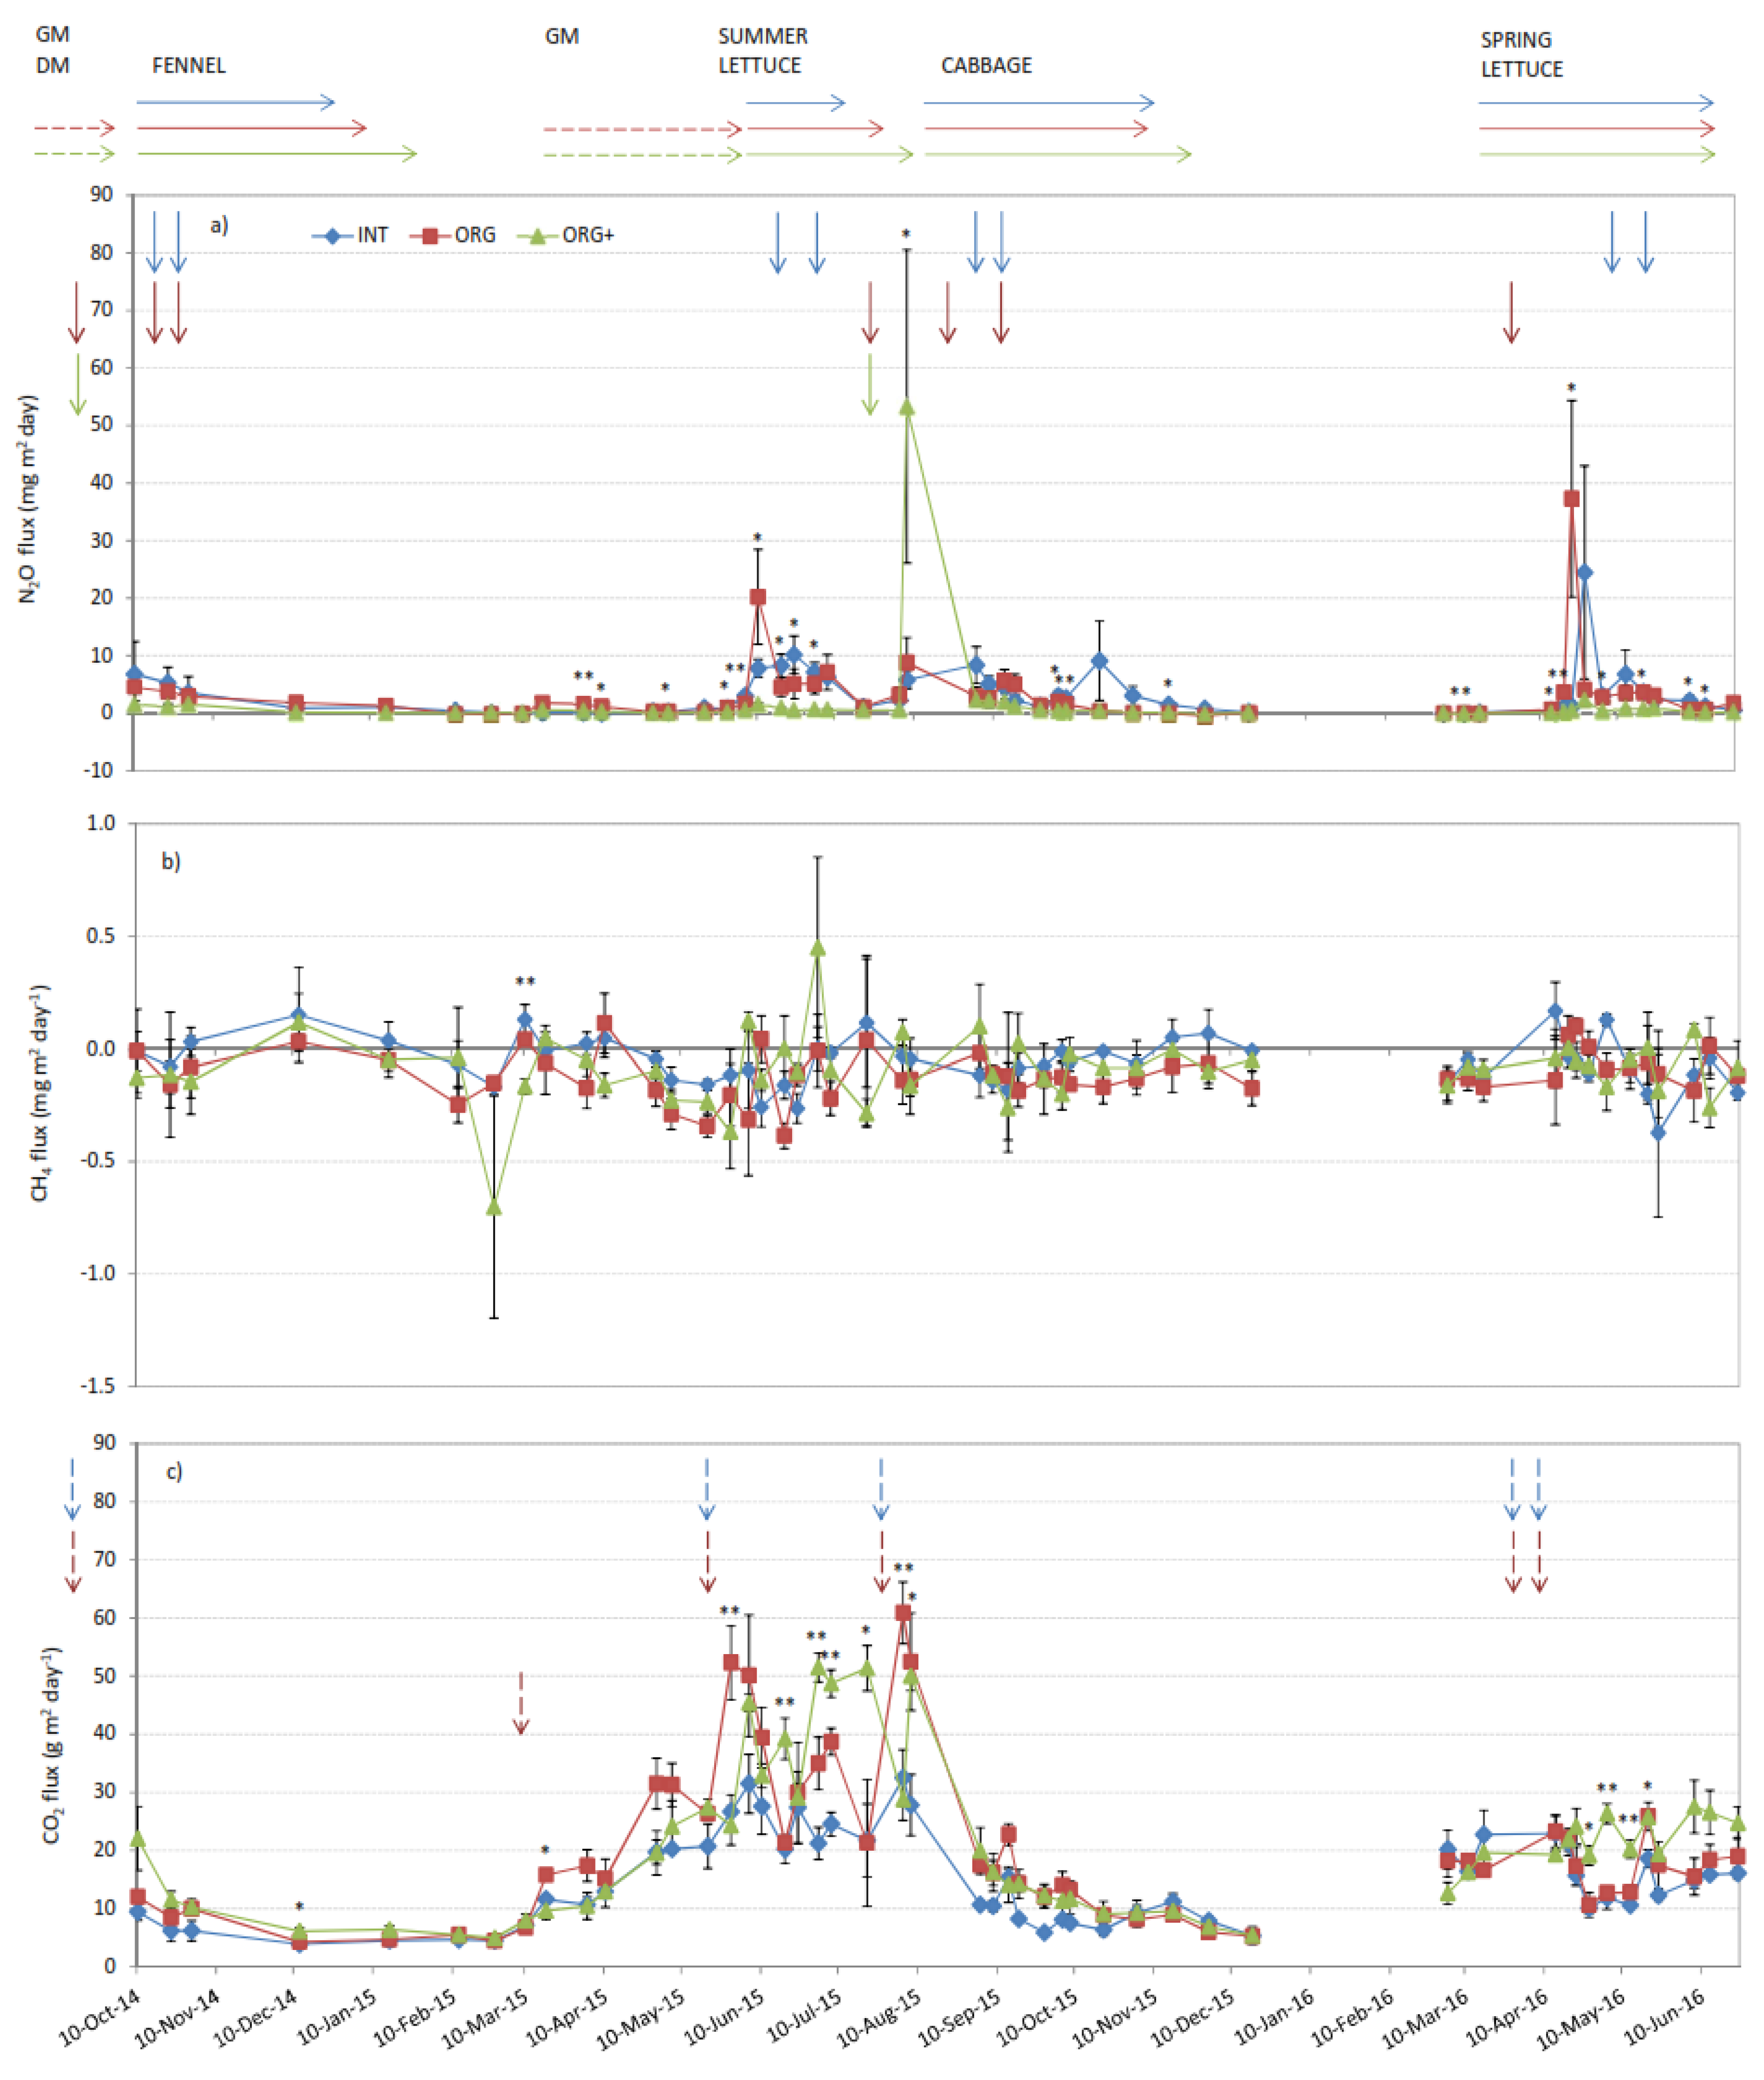
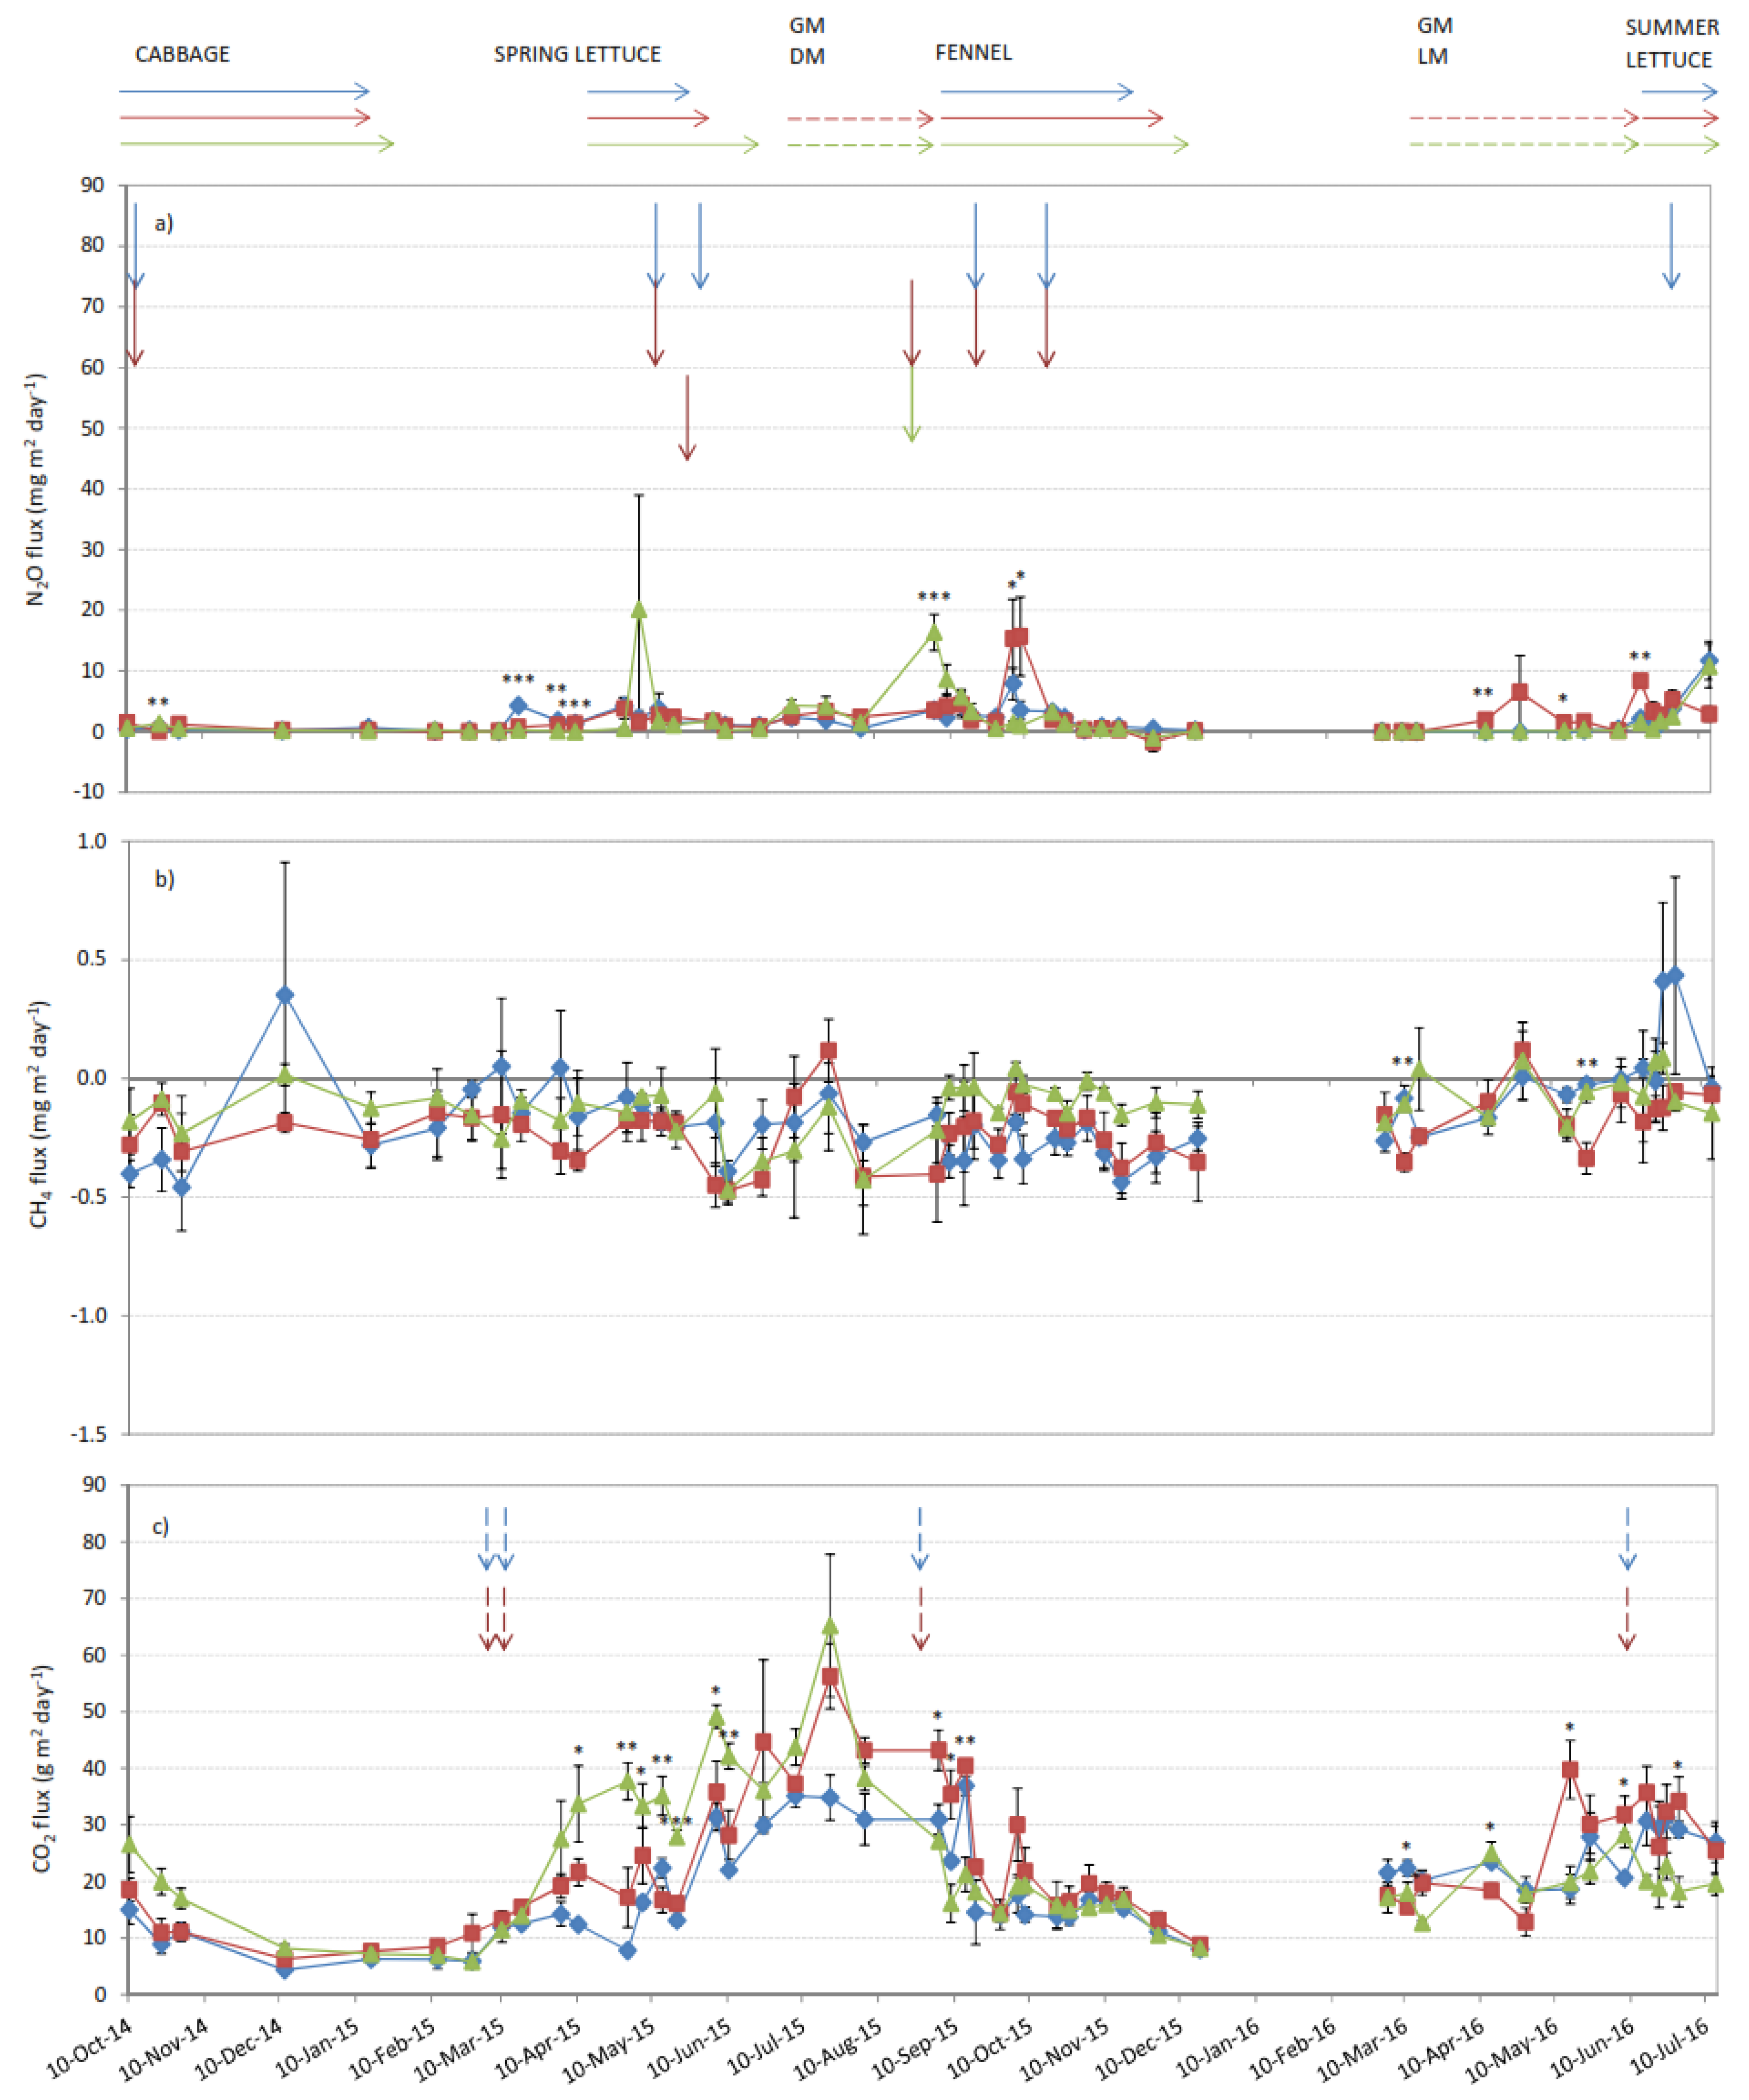
3.3. Daily Flux of N2O, CH4 and CO2

Pattern of N2O, CH4 and CO2 fluxes throughout the study period are show in Figure 5a, b, c for F1 and Figure 6a, b, c for F2, while the ANOVA results are reported in Table 4.

3.3.1. Trend of Daily N2O Flux in the Three Cropping Systems

Measured N2O daily flux ranged from −0.4 to 53.3 mg N2O m−2 day−1 in F1 and from −1.7 to 20.2 mg N2O m−2 day−1 in F2 (Figure 5a and Figure 6a). Notably, high N2O fluxes were observed in F1 in June 2015 in ORG system after green manure incorporation into the soil (20.2 mg N2O m−2 day−1), in August 2015 (53.3 mg N2O m−2 day−1) in the ORG+ system just after organic fertilization on cabbage, and in April 2016 in the ORG system (37.3 mg N2O m−2 day−1) after tillage and organic nitrogen fertilization for spring lettuce.
In F2, N2O peaks were halved compared to F1 and the highest were registered after the organic nitrogen fertilization of fennel in September 2015 on ORG+ (16.4 mg N2O m−2 day−1), in October 2015 on ORG (on average 15.5 mg N2O m−2 day−1) and after green manure incorporation into soil in June 2016 in ORG (8.3 mg N2O m−2 day−1).
In P1 (Jan 2015-Dec 2015), average daily N2O flux (Table 4) in F1 was significantly lower in ORG+ (2.21 ± 1.18 mg N2O m−2 day−1), while no differences were observed between INT and ORG (on average 2.85 ± 0.32 mg N2O m−2 day−1). In F2, no differences were detected among the three cropping systems (on average 2.36 ± 0.29 mg N2O m−2 day−1).
During P2 (Jan 2016–Jul 2016), in F1 the effect of the cropping systems on the average daily N2O flux was the same as that in P1, with INT equal to ORG, and the highest values were recorded (on average 3.89 ± 1.15 mg N2O m−2 day−1) and ORG+ with the lowest value (0.47 ± 0.12 mg N2O m−2 day−1). In F2 N2O daily flux was significantly higher in ORG (2.63 ± 0.59 mg N2O m−2 day−1) than in ORG+ (1.39 ± 0.52 mg N2O m−2 day−1).

3.3.2. Trend of Daily CH4 Flux in the Three Cropping Systems

Measured CH4 daily flux ranged from –0.7 to 0.45 mg CH4 m−2 day−1 in F1 and from −0.47 to 0.43 mg CH4 m−2 day−1 in F2 (Figure 5b and Figure 6b). In F1, CH4 fluxes were positive (<0.2 mg CH4 m−2 day−1) in 12, 9 and 11 sampling days out of 50 in INT, ORG and ORG+, respectively. In F2, CH4 fluxes were positive (<0.5 mg CH4 m−2 day−1) in seven, two and six sampling days out of 48 in INT, ORG and ORG+, respectively. In particular, in F2, CH4 fluxes were significantly lower in ORG than in INT and ORG+ in two sampling dates in March 2016 and in May 2016; during which CH4 fluxes in ORG were equal to −0.35 ± 0.04 mg CH4 m−2 day−1 and −0.34 ± 0.07 mg CH4 m−2 day−1, respectively. In F1 the average daily CH4 flux (Table 4) was slightly negative, with no significant differences (p > 0.05) among the cropping systems in both periods (on average P1: −0.10 ±0.22 mg CH4 m−2 day−1; P2: −0.08 ± 0.02 mg CH4 m−2 day−1). In F2, significantly lower flux was recorded in P1 in ORG (−0.23 ± 0.02 mg CH4 m−2 day−1) compared to INT and ORG+ (−0.18 ± 0.01 mg CH4 m−2 day−1), while in P2 ORG and ORG+ showed similar values equal to –0.10 ± 0.02 mg CH4 m−2 day−1, significantly lower than INT (−0.001 ± 0.05 mg CH4 m−2 day−1).

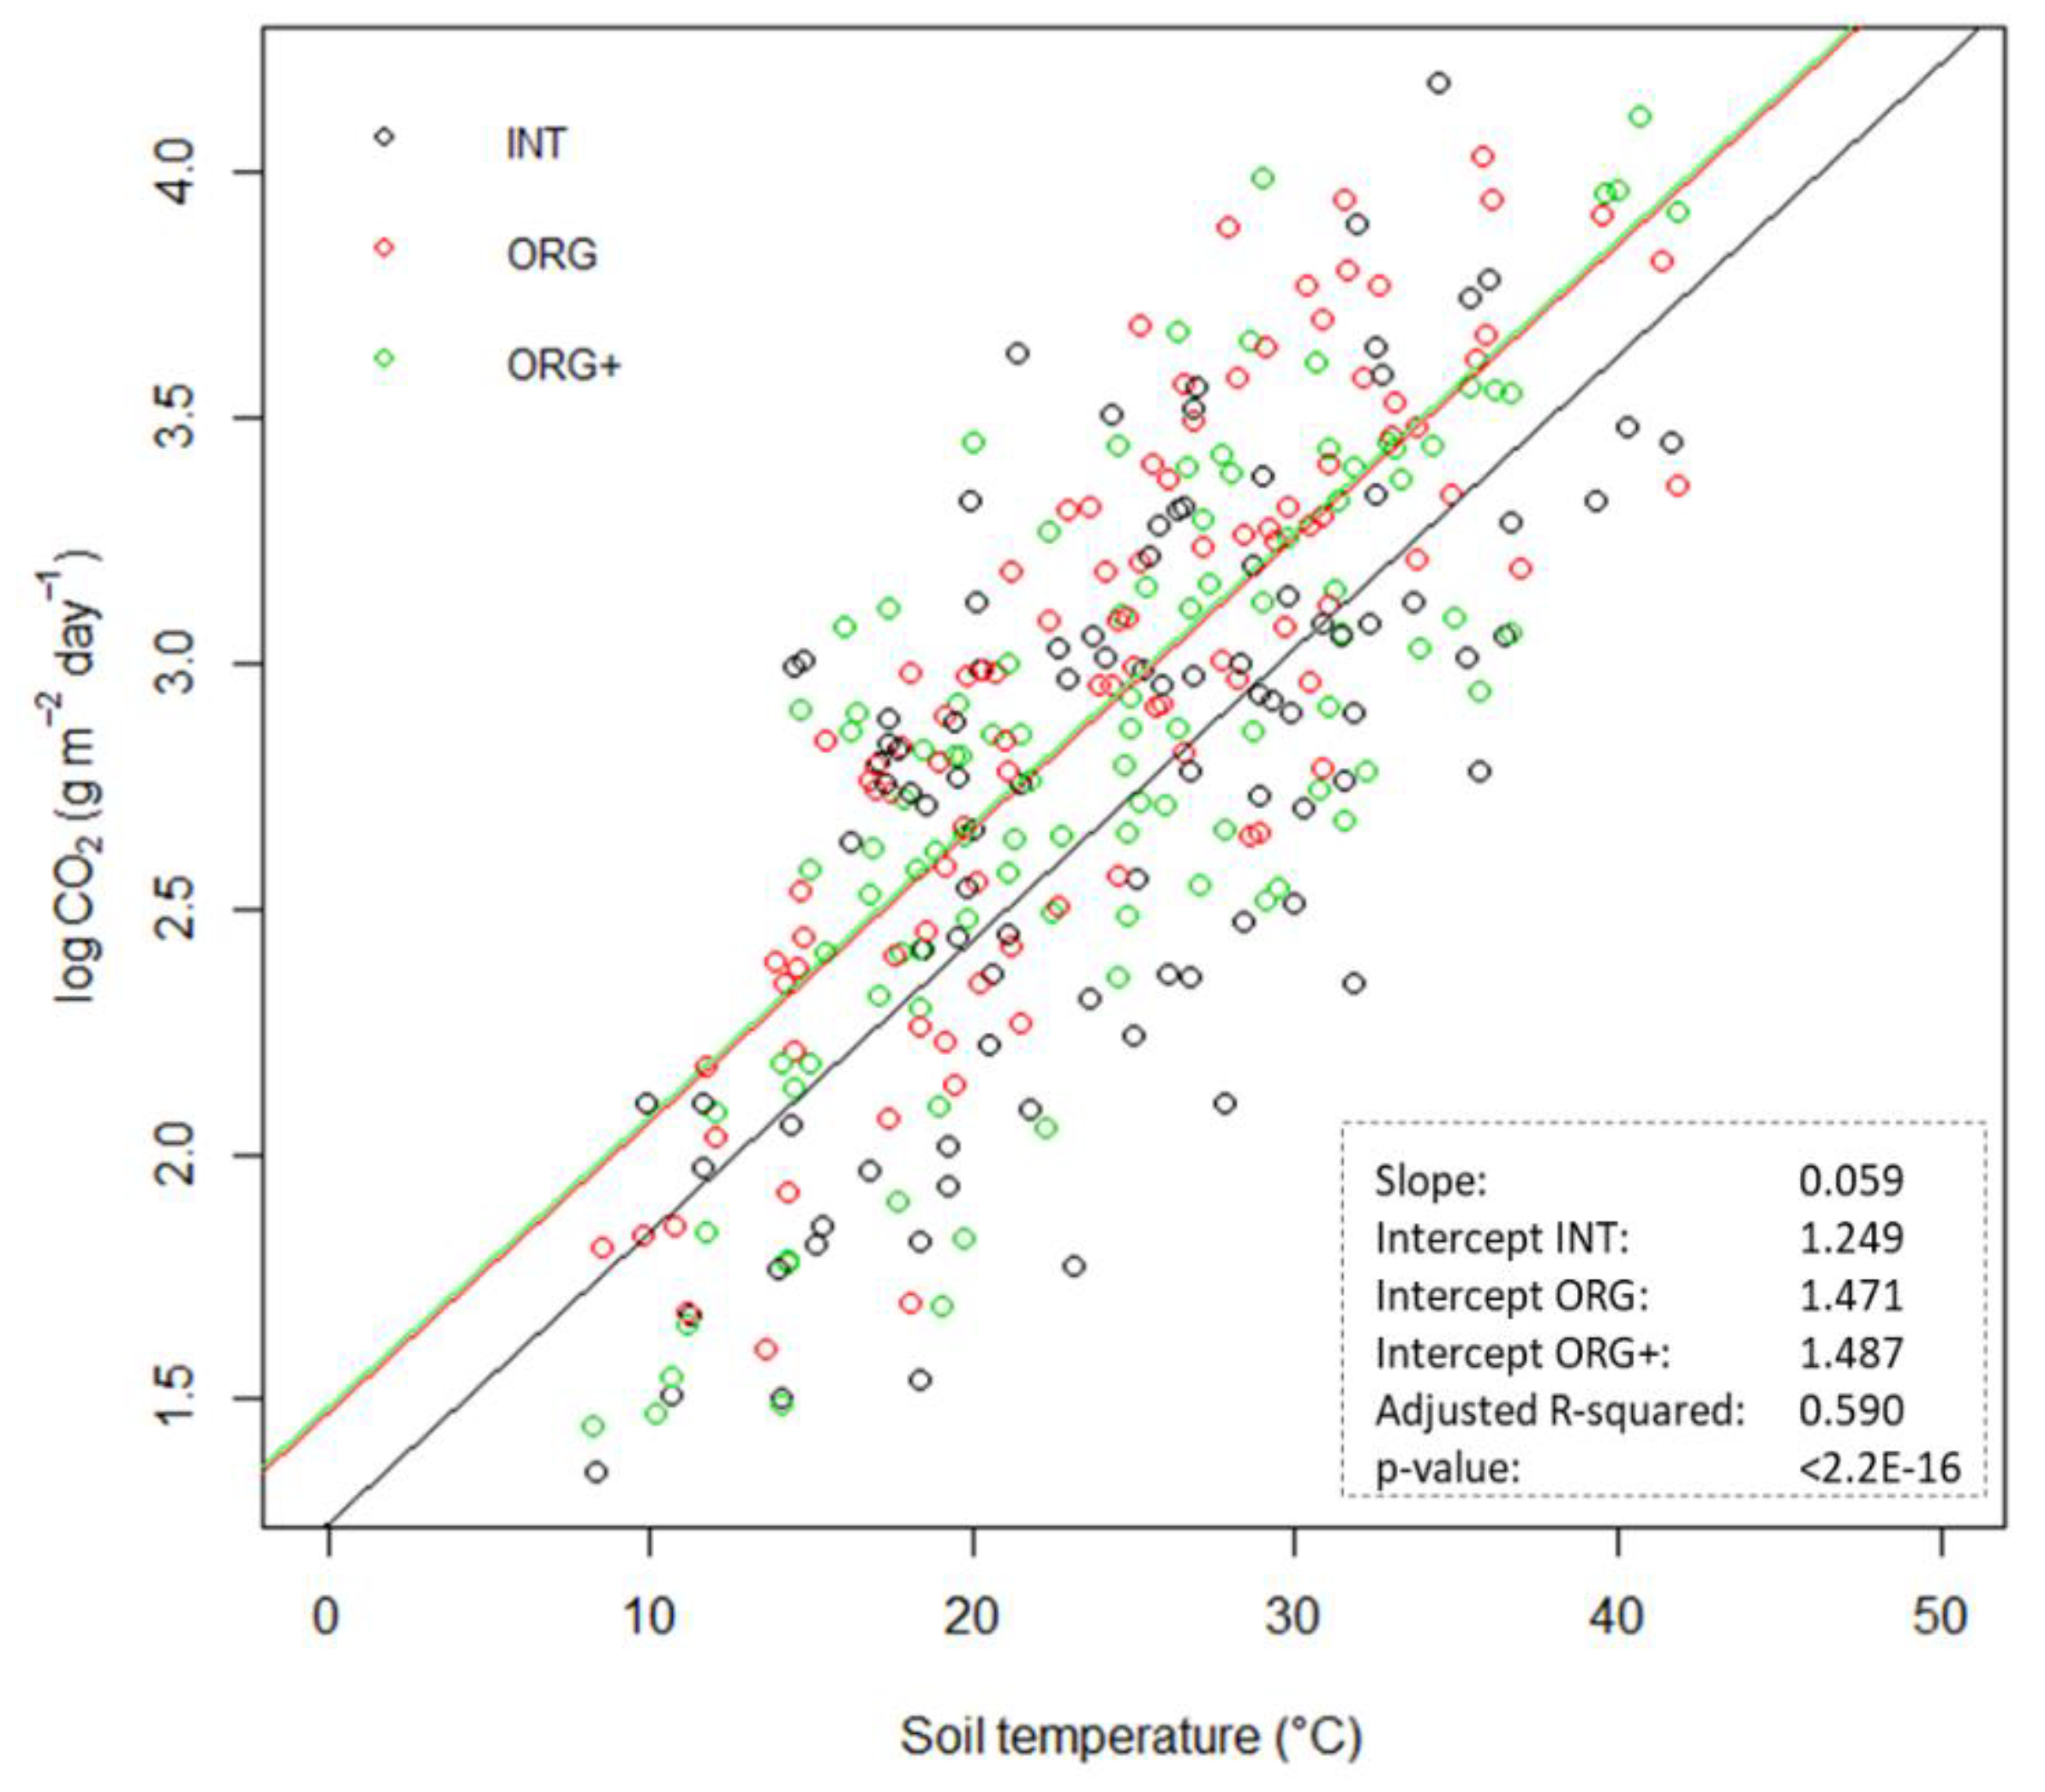
3.3.3. Trend of Daily CO2 Flux in the Three Cropping Systems

Measured CO2 daily flux ranged from 3.9 to 60.9 g CO2 m−2 day−1 in F1 and from 4.4 to 65.2 g CO2 m−2 day−1 in F2 (Figure 5c and Figure 6c). Daily pattern of CO2 flux varied according to that of soil temperatures. Indeed, higher values of CO2 flux were recorded from May 2015 to September 2015. Higher CO2 flux was observed in ORG+ than in the other systems during summer 2015 in both fields. In F1, significantly higher emissions were observed in ORG+ with respect to the other treatments in eight dates out of 50, while CO2 flux was higher in ORG than in the other systems in five dates out of 50. In F2, CO2 flux was significantly higher in nine dates out of 48 in ORG+ and in six dates out of 48 in ORG. Higher CO2 fluxes in ORG systems were observed in March 2015 after tillage for green manure sowing, and in summer 2015, some days after main tillage operations for summer lettuce, and cabbage in F1, and for fennel in F2. Otherwise, CO2 flux was significantly higher in INT than in the other treatments in only two dates in March 2016 in F2.
In both fields, daily average CO2 flux (Table 4) in P1 was higher in ORG and ORG+ (on average, F1: 21.51 ± 1.16 g CO2 m−2 day−1; F2: 23.88 ± 1.05 g CO2 m−2 day−1) than in INT (F1: 15.11 ± 0.98 g CO2 m−2 day−1, F2: 18.08 ± 1.00 g CO2 m−2 day−1) In P2 higher CO2 flux was higher in ORG+ in F1 compared to INT, while the opposite was recorded in F2, where INT and ORG (on average 25.40 ± 1.31 g CO2 m−2 day−1) recorded higher values than ORG+ (19.97 ± 0.79 g CO2 m−2 day−1).

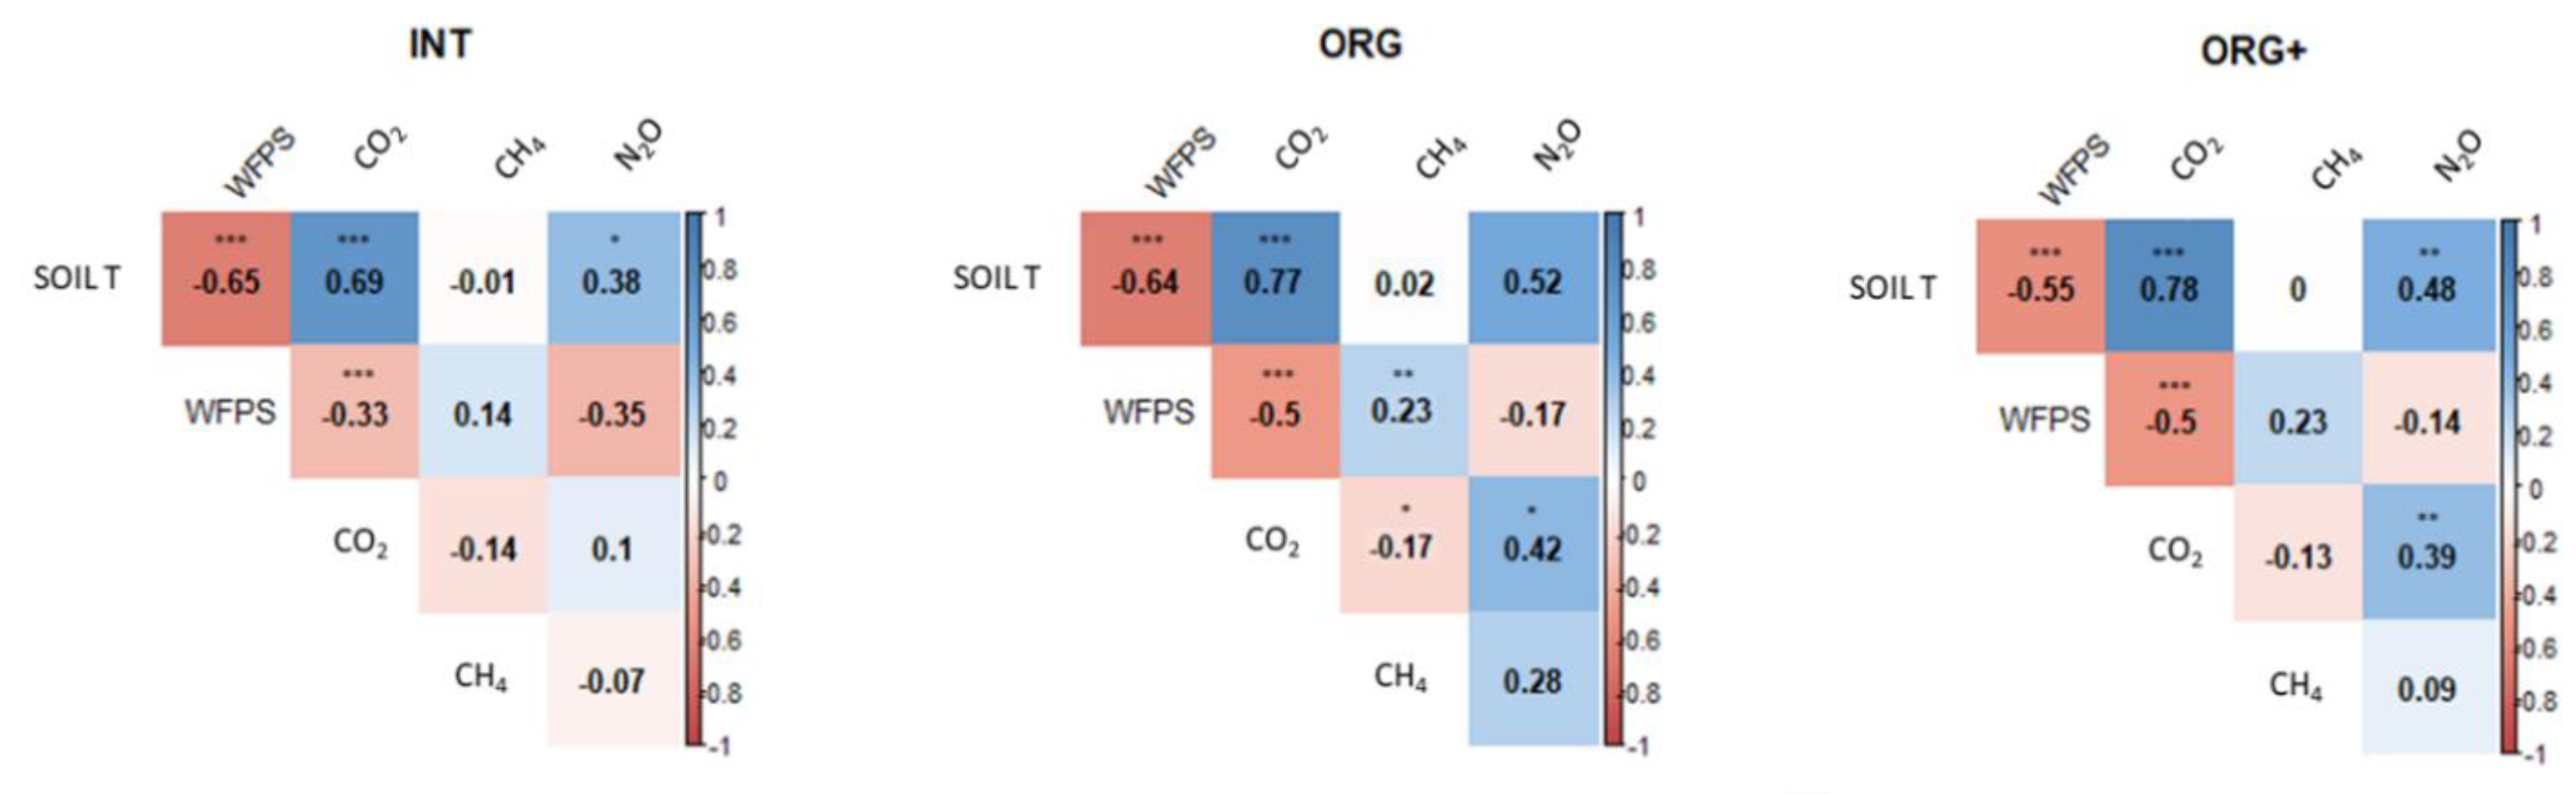
3.4. Relationship among the Soil Variables and GHG Fluxes

The correlation between daily N2O flux and soil N–NO3 concentration-computed using a subset of the dataset, including only the monitoring days in which the soil samples were collected-turned out to be non-significant for all the three cropping systems (data not shown).
Considering the whole dataset, soil temperature and WFPS correlated negatively in all the three cropping systems, with a correlation coefficient (rs) between −0.55 (ORG+) and −0.65 (INT) (Figure 7).
Flux of N2O correlated positively with soil temperature in INT (rs: 0.38) and ORG+ (rs: 0.48); and with CO2 flux in ORG (rs: 0.42) and ORG+ (rs: 0.39).
Flux of CO2 correlated positively with soil temperature with rs equal to 0.69 in INT, 0.77 in ORG and 0.78 in ORG+; and negatively with WFPS with rs between −0.33 (INT) and −0.5 (ORG and ORG+). Flux of CH4 correlated positively with WFPS only in ORG (rs: 0.23) and negatively with CO2 flux in the same treatment (rs: −0.17).
Fluxes of N2O higher than 20 mg m−2 day−1 were recorded with WFPS values between 38% and 70% (Figure S1a). When WFPS was lower than 38% N2O fluxes ranged between −0.04 mg m−2 day−1 and 17.44 mg m−2 day−1, while when WFPS values were higher than 70%, N2O fluxes ranged between −0.07 mg m−2 day−1 and 3.35 mg m−2 day−1.
The ANOVA describing the relationship between the logarithm of CO2 flux and the soil temperature highlighted that the slope of the linear regression was not different according to the treatments (0.059), while the intercept of the regression was significantly lower in INT (1.249) than in ORG (1.471) and ORG+ (1.487) (Figure 8).

3.5. Cumulative Soil Emissions during the Two Periods

In P1 cumulative N2O emissions showed no significant differences among the cropping systems both in F1 (average 5.5 ± 1.1 kg N–N2O ha−1) and in F2 (average 4.4 ± 0.5 kg N–N2O ha−1) (Figure 9a).
In P2 cumulative N2O emissions were significantly affected by the cropping system in both fields (p < 0.05). Indeed, in F1, cumulative N2O emissions were higher in INT and in ORG (average 2.0 ± 0.5 kg N–N2O ha−1) than in ORG+ (0.3 ± 0.1 kg N–N2O ha−1). In F2 N2O emissions were significantly higher in ORG (2.2 ± 0.7 kg N–N2O ha−1) than in ORG+ 1.0 ± 0.2 kg N–N2O ha−1), and INT was not significantly different from both ORG and ORG+ (1.1 ± 0.1 kg N–N2O ha−1).
There was an overall sink effect for CH4 cumulative emissions in all systems, in both periods and fields, with no significant differences among cropping systems (average in F1: −162 ± 38 g C–CH4 ha−1; average in F2: −356 ± 60 g C–CH4 ha−1) (Figure 9b).
Cumulative CO2 emissions in P1 were significantly affected by cropping system in both fields (F1: p < 0.01; F2: p < 0.05) (Figure 9c). Lower values were recorded in both fields in INT (F1: 13.0 ± 1.0 t C–CO2 ha−1; F2: 16.7 ± 0.8 t C–CO2 ha−1) than in ORG and ORG+ (average in F1: 18.3 ± 0.7 t C–CO2 ha−1; average in F2: 22.6 ± 0.6 t C–CO2 ha−1). In P2 differences were significant only in F1 (p < 0.01), where cumulative CO2 emissions were higher in ORG+ (8.5 ± 0.4 t C–CO2 ha−1) than in ORG and INT (5.4 ± 0.3 t C–CO2 ha−1).
The estimated net GHG emissions (CO2-eq) were significantly affected by the cropping systems with exception of P2 in F2 (Table 5).
In P1 in both F1 and F2 the net CO2-eq were significantly higher in ORG (+40%, +33%), and ORG+ (+37%) than in INT. The CO2-eq of non-CO2 GHG were not different among INT, ORG and ORG+ in both fields and periods.

4. Discussion

This study evaluated the effect on GHG emissions from soil under three different agricultural management systems, an integrated (INT), an organic (ORG) and an organic conservation (ORG+) system, on an irrigated vegetable crop rotation for two years, and the relationship of GHG fluxes with soil variables.
Daily fluxes of N2O correlated positively with soil temperature and CO2 fluxes, probably caused by the high microbial activity associated to the organic matter mineralization in the warm season. Indeed, higher peaks in N2O emissions occurred mainly between the end of March and the beginning of October, namely the period with higher soil temperatures (>20 °C). Other studies reported that soil temperature may be a driver for N2O production when substrates are abundant, and the soil water content is optimal for microbial processes [32,33]. However, in our experiment the period with higher soil temperatures corresponded to that during which all N fertilization occurred, thus, it is difficult to consider separately the effect of the two drivers on N2O emissions.
The agricultural management system influenced the average daily N2O flux within F1 in P1 and P2, and within F2 in P2; in those cases, we found lower values in ORG+ than in the other systems, likely due to the significantly lower N fertilizer rate supplied to ORG+. Indeed, ORG+ had significantly lower cumulative N2O emissions than INT and ORG in both fields in period 2, in which no fertilizers were supplied to spring and summer lettuce in ORG+.
We did not find a significant correlation between nitrate concentration in soil and N2O emissions, even if nitrates were higher after mineral fertilization events in INT than organic fertilization in ORG and ORG+ in few sampling days in summer 2015, since the low number of the soil samples (29 in F1 and 27 in F2) may have negatively affected the robustness of the model.
The effect of nitrogen fertilization events, implying either mineral or organic N forms, on stimulating both short-term N2O flux and cumulative N2O emissions, was already reported by many authors [34,35]. In our study, high peaks of N2O (>10 mg N2O m−2 day−1) were recorded a few days after fertilization events (4–10 days), in accordance to what was reported by Volpi et al. [36] in a similar soil and in the same environment.
In our study, peaks on daily N2O flux were generally higher (>15 mg N2O m−2 day−1) after organic N fertilization events (ORG and ORG+), than after mineral N fertilization (INT). The occurrence of peaks in soil N2O emissions after the application of organic fertilizers have been explained by other studies [37,38], as an effect of the increased availability of N and C for the soil microbial community. Thus, the increased microbial activity leads to high O2 consumption that may create anaerobic conditions suited for the denitrification process from which N2O is originated.
Differently, other studies reported lower N2O emissions with organic fertilizers than mineral fertilizers, especially with solid manure, due to a slower release of N respect to mineral fertilizers or liquid slurry [14]. However, the effect of fertilizers on soil GHG emissions strictly depends on climate and soil specific conditions as well as on the type of the organic fertilizer itself. In fact, Pelster et al. [39], comparing four different N sources (one mineral fertilizer and three different manures), observed that N2O emissions responded similarly to organic and mineral N sources in high-C soils, whereas in low-C soils N2O emissions may be specifically stimulated by the use of C-rich manures. Moreover, the application technique of organic fertilizers may influence the soil N2O emissions. Indeed, the incorporation of organic fertilizers is expected to increase N2O emissions when soil moisture status is suitable for N2O production, while ammonia volatilization may decrease, since more N entered the soil [40]. However, in our experiment we highlighted a tendency for lower N2O emissions in ORG+ where the fertilizers were broadcasted more on soil surface than in ORG, where they were incorporated in soil, though that result was most probably due to the low N rate applied in ORG+.
Moreover, peaks of N2O emissions, in a range between 5 and 20 mg N2O m−2 day−1, occurred from 10 to 15 days after the soil incorporation of the green manures in ORG. Heller et al. [41] in Mediterranean conditions, recorded the highest N2O flux maximum two weeks after the tillage operations practiced for maize residues incorporation. Other authors reported that the incorporation of crop biomass into the soil produced N2O and CO2 peaks due to the increased availability of substrates for mineralization and microbial activity, when soil moisture was not limiting [42,43]. In particular, it was reported that N2O emissions are generally increased when crop biomass with a low C:N ratio is incorporated in the soil [17,18]. However, in our study, peaks in N2O emissions were similar (15–20 mg N2O m−2 day−1) after the incorporation of both spring green manure, composed by only legumes (C:N = 12, Tables S1 and S2) and summer green manure, composed by one legume, two cereals and one pseudo-cereal (C:N = 33, Tables S1 and S2). Indeed, peaks in N2O emissions might have been due to an improvement of C availability in soil after plant material incorporation that stimulated denitrification [44].
Daily fluxes of CH4 were negative in about 80% and 90% of the sampling days in F1 and F2, respectively. CH4 uptake by soil was similar in all the cropping systems, with higher uptakes recorded only in the ORG system in F2 (average −0.19 mg CH4 m−2 day−1). Values of CH4 uptake recorded in our experiment were in the range reported by literature for non-flooded agricultural soils (from 0 to 1.03 mg CH4 m−2 day−1) [22]. However, CH4 uptake was lower than that reported by Flessa et al. [45] on a potato field in a temperate climate (average −0.35 mg CH4 m−2 day−1). Cumulative CH4 emissions were not different among the cropping systems, in both periods and fields. In that regard, our results comply with other studies that reported no effect by conservation tillage on CH4 emissions [46]. Differently, other studies comparing organic and non-organic management revealed a slightly, but significantly higher, net CH4 uptake in organic cropping systems [47]. Moreover, the higher mineral fertilizer rate distributed in INT and the higher tillage intensity of INT and ORG seemed to have not inhibited the soil CH4 oxidation capacity; namely the methanotrophic activity of microorganisms in soil, compared to the ORG+ system. However, the recent implementation of the three cropping systems could not yet have affected the soil stability, as well as the gas diffusion and the methanotrophic activity in soil that may influence CH4 uptake [22]. Indeed, the number of years since the initiation of conservation tillage is a key issue for evaluating and understanding the effects generated by this management strategy [48].
Moreover, our study showed no differences in CH4 emissions during periods of bare fallow (INT) and periods with cover crops (ORG and ORG+), similarly to what was reported by Sanz-Cobena et al. [49] and Guardia et al. [50] in a maize/cover crop rotation. However, studies are scarce on this topic, thus further research is needed to investigate the effect of cover crops on CH4 emissions [16].
Concerning soil conditions, we did not find any strong correlations among soil temperature, WFPS and CH4 emissions, with only a weak positive correlation between soil CH4 emissions and WFPS in ORG. In our experiment WFPS did not show prevalently very low or high values, and soil water content was not as a strong driver for CH4 emissions as reported in other studies, where it lowered the activity of methanotrophic bacteria in very dry or very wet soil conditions [51].
Measurements of daily CO2 flux in our experiment ranged from 3.9 to 65.2 g CO2 m−2 day−1, with values often higher than in other studies conducted in a Mediterranean environment on fertilized crops, including organic cultivation or cover crops (1.5–25.7 g CO2 m−2 day−1) [49,52]. In all treatments, the intensity of CO2 daily fluxes followed the variations of soil temperature, with values generally higher (up to 60 g CO2 m−2 day−1) during the warm season, between April and September, than in the rest of the year (<25 g CO2 m−2 day−1). Our results confirm the positive relationship between soil temperature and CO2 flux, usually non-linear, reported by other authors [53,54,55]. In our experiment, irrigation may have contributed to the high values of CO2 daily flux measured during the warm season, compared to those of other studies conducted in drought stressed Mediterranean environments. Indeed, Almagro et al. [56] reported that soil respiration varied following changes in soil moisture in late spring and summer, in a dry meso-Mediterranean climate, and that soil respiration was strongly limited by soil water content (SWC) < 10%. In our study, irrigation allowed us to maintain soil water content above 9% (20% WFPS), with the exception of three dates. In such a condition, soil water was never limiting for biological processes deputed to the production of CO2, including root respiration. Our results highlighted a negative correlation between WFPS and CO2 daily flux, only due to the stronger positive correlation of CO2 daily flux and soil temperature and to the inverse pattern of WFPS and soil temperature values both in winter and in summer periods.
Furthermore, our results showed a different effect of the cropping systems on daily flux of CO2, as the intercept of the linear regression describing the relationship between CO2 flux and soil temperature was higher in ORG and ORG+ than in INT. Thus, besides the variation mediated by soil temperature and water content, the level of organic substrates supplied to the soil in ORG and ORG+ have determined higher soil respiration rates.
Moreover, the incorporation of soil of green manure (ORG) might have been a significant driver for short-term CO2 fluxes, due to the proneness of green manure to mineralization [52,57]. Indeed, CO2 daily flux was higher in ORG than in the other treatments a few days after the green manure incorporation was carried out, before summer lettuce cultivation in F1, and before fennel cultivation in F2.
Short-term peaks in CO2 daily flux were also recorded in F1 after main tillage for sowing green manure and cabbage transplanting, and in F2 after tillage for fennel transplanting. Peaks in CO2 emissions after main tillage were previously reported by many authors, mainly due to an increased mineralization of soil organic matter, as well as a transitory effect, due to the removal of physical constraints on CO2 diffusion [46,58]. Cumulative CO2 emissions ranged between 2.0 and 8.2 t C–CO2 ha−1 and when there was a significant difference among the cropping systems, we highlighted a tendency in higher emissions in ORG and/or ORG+ than in INT. In ORG, the green manure incorporation and the organic fertilizer application could have increased the soil heterotrophic respiration [41] as discussed above, while in ORG+, living mulch may have increased the autotrophic component of respiration [59,60]. These results are in line with Chirinda et al. [61] that reported an increase of CO2 emissions due both to manure application and to catch crops’ cultivation in a sandy loam soil.
The net GHG emissions budget showed a tendency of being higher in ORG+ (in both fields and periods) and ORG (in P1 in F1 and F2) with respect to INT because of the effect of the cropping system on CO2 emissions, since the CO2-eq of non-CO2 GHG were not different among INT, ORG and ORG+.
Thus, the integration of organic and conservation agriculture showed a tendency of higher CO2 emissions and lower N2O emissions than the other cropping systems, with no clear potential for soil GHG mitigation, at least in the first two years of organic conservation management. Indeed, a long-term field trial could help to clarify whether the result of this study on the effect of ORG+ on soil CO2 and N2O emissions was only transitory, especially considering the importance of the duration of no-till [62]. It is well known, indeed, that the introduction of no-till practices may require a long time to produce beneficial effects on soil’s physical and biological aspects, which may buffer the GHG emission potential of the soil.
In the transition phase, a possible solution to improve the distribution of fertilisers in the soil profile and to sustain crop yield could come from a different fertilization strategy. The within-furrow application of organic fertilizers at transplant—which could be possible by means of a fertilizer tank mounted on the direct transplanting machine—and fertigation with organic material, may result in a better stratification of fertilizers even in no-till conditions, allowing the reduction of the exposure of organic fertilisers to oxidation conditions, while increasing their efficiency.
Moreover, the trade-off between GHG mitigation and the crop productivity has to be taken into account, evaluating the crop yield in the three cropping systems [63].

5. Conclusions

The ORG+ system registered a tendency of higher CO2 emissions and lower N2O emissions respect to INT and ORG systems. The lower N2O emissions were probably related to the low N rate supplied in ORG+, while the higher CO2 emissions could have been due to the higher supply of organic material with organic fertilizer and to the higher autotrophic respiration due to living mulch. No differences among the three systems were observed concerning CH4 emissions. Based on our results, the organic conservation system did not show a clear tendency towards mitigating soil GHG emissions in vegetable rotation in a Mediterranean environment.
Further soil GHG monitoring campaigns are needed to compare the three systems in the long term. Moreover, other studies will be needed to assess the overall sustainability of the three cropping systems from an agronomic, economic and environmental (e.g., life cycle assessment) point of view.

Supplementary Materials

The following are available online at https://www.mdpi.com/2073-4395/9/8/446/s1, Figure S1: (a) Relationship between WFPS and N2O daily flux; (b) relationship between soil temperature and CO2 daily flux., Table S1: Bibliographic references for C:N of each crop in the green manures., Table S2: Estimated values of C:N for the green manure mixtures (ORG) during the field experiment period.

Author Contributions

Conceptualization, S.B., D.A. and C.F.; data curation, S.B. and I.V.; formal analysis, I.V.; methodology, S.B. and D.A.; project administration, C.F.; software, I.V.; supervision, S.B. and C.F.; validation, G.R.; visualization, S.B. and I.V.; writing—original draft, S.B. and I.V.; writing—review and editing, D.A. and G.R..

Funding

This research was carried out within the project SMOCA "Smart Management of Organic Conservation Agriculture" (http://smoca.agr.unipi.it/) funded by the Italian Ministry of University and Research (MIUR) within the program FIRB-2013 (Future in Research), MIUR-FIRB13 (project number: RBFR13L8J6).

Acknowledgments

The authors would like to acknowledge Enrico Bonari for helpful discussions and comments and Cristiano Tozzini, Fabio Taccini, Jonatha Trabucco and Tommaso Bambini of the Institute of Life Sciences, Scuola Superiore Sant'Anna, for facilitating our field work. We thank the staff at the “Enrico Avanzi” Centre for Agro-Environmental Research of the University of Pisa, who managed the field trials and provided technical support throughout.

Conflicts of Interest

The authors declare no conflicts of interest.

References

  1. Cook, S.K.; Collier, R.; Clarke, J.; Lillywhite, R. Contribution of integrated farm management (IFM) to Defra objectives. Asp. Appl. Biol. 2009, 93, 131–138. [Google Scholar]
  2. Morris, C.; Winter, M. Integrated farming systems: The third way for European agriculture? Land Use Policy 1999, 16, 193–205. [Google Scholar] [CrossRef]
  3. Peigné, J.; Ball, B.C.; Roger-Estrade, J.; David, C. Is conservation tillage suitable for organic farming? A review. Soil Use Manag. 2007, 23, 129–144. [Google Scholar] [CrossRef]
  4. Peigné, J.; Casagrande, M.; Payet, V.; David, C.; Sans, F.X.; Blanco-Moreno, J.M.; Cooper, J.; Gascoyne, K.; Antichi, D.; Bàrberi, P.; et al. How organic farmers practice conservation agriculture in Europe. Renew. Agric. Food Syst. 2015, 31, 72–85. [Google Scholar] [CrossRef] [Green Version]
  5. González-Sánchez, E.J.; Ordóñez-Fernández, R.; Carbonell-Bojollo, R.; Veroz-González, O.; Gil-Ribes, J.A. Meta-analysis on atmospheric carbon capture in Spain through the use of conservation agriculture. Soil Tillage Res. 2012, 122, 52–60. [Google Scholar] [CrossRef]
  6. Hobbs, P.; Sayre, K.; Gupta, R. The role of conservation agriculture in sustainable agriculture. Philos. Trans. R. Soc. Lond. B Biol. Sci. 2008, 363, 543–555. [Google Scholar] [CrossRef] [PubMed]
  7. Holland, J.M. The environmental consequences of adopting conservation tillage in Europe: Reviewing the evidence. Agric. Ecosyst. Environ. 2004, 103, 1–25. [Google Scholar] [CrossRef]
  8. Sans, F.X.; Berner, A.; Armengot, L.; Mäder, P. Tillage effects on weed communities in an organic winter wheat-sunflower-spelt cropping sequence. Weed Res. 2011, 51, 413–421. [Google Scholar] [CrossRef]
  9. IFOAM. The IFOAM Norms for Organic Production and Processing; IFOAM: Bonn, Germany, 2012. [Google Scholar]
  10. Shirtliffe, S.J.; Johnson, E.N. Progress towards no-till organic weed control in western Canada. Renew. Agric. Food Syst. 2012, 27, 60–67. [Google Scholar] [CrossRef]
  11. Snyder, C.S.; Bruulsema, T.W.; Jensen, T.L.; Fixen, P.E. Review of greenhouse gas emissions from crop production systems and fertilizer management effects. Agric. Ecosyst. Environ. 2009, 133, 247–266. [Google Scholar] [CrossRef]
  12. Powlson, D.S.; Whitmore, A.P.; Goulding, K.W.T. Soil carbon sequestration to mitigate climate change: A critical re-examination to identify the true and the false. Eur. J. Soil Sci. 2011, 62, 42–55. [Google Scholar] [CrossRef]
  13. Palm, C.; Blanco-canqui, H.; Declerck, F.; Gatere, L.; Grace, P. Conservation agriculture and ecosystem services: An overview. Agric. Ecosyst. Environ. 2014, 187, 87–105. [Google Scholar] [CrossRef] [Green Version]
  14. Aguilera, E.; Lassaletta, L.; Gattinger, A.; Gimeno, B.S. Managing soil carbon for climate change mitigation and adaptation in Mediterranean cropping systems: A meta-analysis. Agric. Ecosyst. Environ. 2013, 168, 25–36. [Google Scholar] [CrossRef]
  15. Thorup-Kristensen, K.; Magid, J.; Jensen, L.S. Catch crops and green manures as biological tools in nitrogen management in temperate zones. Adv. Agron. 2003, 79, 227–302. [Google Scholar]
  16. Kaye, J.P.; Quemada, M. Using cover crops to mitigate and adapt to climate change. A review. Agron. Sustain. Dev. 2017, 37, 4. [Google Scholar] [CrossRef]
  17. Muhammad, I.; Sainju, U.M.; Zhao, F.; Khan, A.; Ghimire, R.; Fu, X. Regulation of soil CO2 and N2O emissions by cover crops: A meta-analysis. Soil Tillage Res. 2019, 192, 103–112. [Google Scholar] [CrossRef]
  18. Baggs, E.M.; Stevenson, M.; Pihlatie, M.; Regar, A.; Cook, H.; Cadisch, G. Nitrous oxide emissions following application of residues and fertiliser under zero and conventional tillage. Plant Soil 2003, 254, 361–370. [Google Scholar] [CrossRef]
  19. Basche, A.D.; Miguez, F.E.; Kaspar, T.C.; Castellano, M.J. Do cover crops increase or decrease nitrous oxide emissions? A meta-analysis. J. Soil Water Conserv. 2014, 69, 471–482. [Google Scholar] [CrossRef] [Green Version]
  20. Turner, P.A.; Baker, J.M.; Griffis, T.J.; Venterea, R.T. Impact of Kura Clover Living Mulch on Nitrous Oxide Emissions in a Corn–Soybean System. J. Environ. Qual. 2016, 45, 1782. [Google Scholar] [CrossRef]
  21. Six, J.; Ogle, S.M.; Breidt, F.J.; Conant, R.T.; Mosiers, A.R.; Paustian, K. The potential to mitigate global warming with no-tillage management is only realized when practised in the long term. Glob. Chang. Biol. 2004, 10, 155–160. [Google Scholar] [CrossRef] [Green Version]
  22. Hutsch, B.W. Methane oxidation in non-flooded soils as affected by crop production—Invited paper. Eur. J. Agron. 2001, 14, 237–260. [Google Scholar] [CrossRef]
  23. Ussiri, D.A.N.; Lal, R.; Jarecki, M.K. Nitrous oxide and methane emissions from long-term tillage under a continuous corn cropping system in Ohio. Soil Tillage Res. 2009, 104, 247–255. [Google Scholar] [CrossRef]
  24. Soil Survey Staff. Keys to Soil Taxonomy, 12th ed.; USDA-Natural Resources Conservation Service: Washington, DC, USA, 2014.
  25. Livingston, G.P.; Hutchinson, G.L. Enclosure-based measurement of trace gas exchange: Applications and sources of error. In Methods in Ecology. Biogenic Trace Gases: Measuring Emissions from Soil and Water; Matson, P.A., Harriss, R.C., Eds.; Blackwell Science: Malden, MA, USA, 1995; pp. 14–51. [Google Scholar]
  26. Bosco, S.; Volpi, I.; Nassi o Di Nasso, N.; Triana, F.; Roncucci, N.; Tozzini, C.; Villani, R.; Laville, P.; Neri, S.; Mattei, F.; et al. LIFE+IPNOA mobile prototype for the monitoring of soil N2O emissions from arable crops: First-year results on durum wheat. IJA 2015, 10, 124. [Google Scholar] [CrossRef]
  27. Laville, P.; Neri, S.; Continanza, D.; Vero, L.F.; Bosco, S.; Virgili, G. Cross-Validation of a Mobile N2O Flux Prototype (IPNOA) Using Micrometeorological and Chamber Methods. J. Energy Power Eng. 2015, 9, 375–380. [Google Scholar]
  28. Laville, P.; Bosco, S.; Volpi, I.; Virgili, G.; Neri, S.; Continanza, D.; Bonari, E. Temporal integration of soil N2O fluxes: Validation of IPNOA station automatic chamber prototype. Environ. Monit. Assess. 2017, 189, 485. [Google Scholar] [CrossRef] [PubMed]
  29. R Core Team. R: A Language and Environment for Statistical Computing; R Foundation for Statistical Computing: Vienna, Austria, 2018; Available online: https://www.R-project.org/ (accessed on 28 February 2018).
  30. Bates, D.; Maechler, M.; Bolker, B.; Walker, S.; Christensen, R.H.B.; Singmann, H.; Dai, B. Linear mixed-effects models using Eigen and S4. R package version 1.1-7. 2014. Available online: http://CRAN.R-project.org/package=lme4 (accessed on 12 March 2018).
  31. Myhre, G.; Shindell, D.; Bréon, F.-M.; Collins, W.; Fuglestvedt, J.; Huang, J.; Koch, D.; Lamarque, J.-F.; Lee, D.; Mendoza, B.; et al. Anthropogenic and Natural Radiative Forcing: In Climate Change 2013: The Physical Science Basis. Contribution of Working Group I to the Fifth Assessment Report of the Intergovernmental Panel on Climate Chang; Cambridge University Press: Cambridge, UK; New York, NY, USA, 2013; pp. 659–740. [Google Scholar]
  32. Skiba, U.; Smith, K.A. The control of nitrous oxide emissions from agricultural and natural soils. Chemosphere-Glob. Chang. Sci. 2000, 2, 379–386. [Google Scholar] [CrossRef]
  33. Liu, C.; Wang, K.; Meng, S.; Zheng, X.; Zhou, Z.; Han, S.; Chen, D.; Yang, Z. Effects of irrigation, fertilization and crop straw management on nitrous oxide and nitric oxide emissions from a wheat-maize rotation field in northern China. Agric. Ecosyst. Environ. 2011, 140, 226–233. [Google Scholar] [CrossRef]
  34. Flessa, H.; Ruser, R.; Dörsch, P.; Kamp, T.; Jimenez, M.A.; Munch, J.C.; Beese, F. Integrated evaluation of greenhouse gas emissions (CO2, CH4, N2O) from two farming systems in southern Germany. Agric. Ecosyst. Environ. 2002, 91, 175–189. [Google Scholar] [CrossRef]
  35. Snyder, C.S.; Davidson, E.A.; Smith, P.; Venterea, R.T. Agriculture: Sustainable crop and animal production to help mitigate nitrous oxide emissions. Curr. Opin. Environ.Sustain. 2014, 9, 46–54. [Google Scholar] [CrossRef]
  36. Volpi, I.; Laville, P.; Bonari, E.; Nassi O Di Nasso, N.; Bosco, S. Nitrous oxide mitigation potential of reduced tillage and N input in durum wheat in the Mediterranean. Nutr. Cycl. Agroecosyst. 2018, 111, 189–201. [Google Scholar] [CrossRef]
  37. De Rosa, D.; Rowlings, D.W.; Biala, J.; Scheer, C.; Basso, B.; Grace, P.R. N2O and CO2 emissions following repeated application of organic and mineral N fertiliser from a vegetable crop rotation. Sci. Total Environ. 2018, 637–638, 813–824. [Google Scholar] [CrossRef] [PubMed]
  38. Thangarajan, R.; Bolan, N.S.; Tian, G.; Naidu, R.; Kunhikrishnan, A. Role of organic amendment application on greenhouse gas emission from soil. Sci. Total Environ. 2013, 465, 72–96. [Google Scholar] [CrossRef] [PubMed]
  39. Pelster, D.E.; Chantigny, M.H.; Rochette, P.; Angers, D.A.; Rieux, C.; Vanasse, A. Nitrous Oxide Emissions Respond Differently to Mineral and Organic Nitrogen Sources in Contrasting Soil Types. J. Environ.Qual. 2012, 41, 427–435. [Google Scholar] [CrossRef] [PubMed]
  40. Webb, J.; Pain, B.; Bittman, S.; Morgan, J. The impacts of manure application methods on emissions of ammonia, nitrous oxide and on crop response—A review. Agric. Ecosyst. Environ. 2010, 137, 39–46. [Google Scholar] [CrossRef]
  41. Heller, H.; Bar-Tal, A.; Tamir, G.; Bloom, P.; Venterea, R.T.; Chen, D.; Zhang, Y.; Clapp, C.E.; Fine, P. Effects of Manure and Cultivation on Carbon Dioxide and Nitrous Oxide Emissions from a Corn Field under Mediterranean Conditions. J. Environ. Qual. 2010, 39, 437. [Google Scholar] [CrossRef] [PubMed]
  42. Ambus, P.; Jensen, E.; Robertson, G. Nitrous oxide and water mediated N-losses from agricultural soil: Influence of crop residue particle size, quality and placement. Phyton (Austria) 2001, 41, 7–15. [Google Scholar]
  43. Chen, H.; Li, X.; Hu, F.; Shi, W. Soil nitrous oxide emissions following crop residue addition: A meta-analysis. Glob. Chang Biol. 2013, 19, 2956–2964. [Google Scholar] [CrossRef]
  44. Pugesgaard, S.; Petersen, S.O.; Chirinda, N.; Olesen, J.E. Crop residues as driver for N2O emissions from a sandy loam soil. Agric. Meteorol. 2017, 233, 45–54. [Google Scholar] [CrossRef]
  45. Flessa, H.; Ruser, R.; Schilling, R.; Loftfield, N.; Munch, J.C.; Kaiser, E.A.; Beese, F. N2O and CH4 fluxes in potato fields: Automated measurement, management effects and temporal variation. Geoderma 2002, 105, 307–325. [Google Scholar] [CrossRef]
  46. Abdalla, M.; Osborne, B.; Lanigan, G.; Forristal, D.; Williams, M.; Smith, P.; Jones, M.B. Conservation tillage systems: A review of its consequences for greenhouse gas emissions. Soil Use Manag. 2013, 29, 199–209. [Google Scholar] [CrossRef]
  47. Skinner, C.; Gattinger, A.; Muller, A.; Mäder, P.; Fliebach, A.; Stolze, M.; Ruser, R.; Niggli, U. Greenhouse gas fluxes from agricultural soils under organic and non-organic management—A global meta-analysis. Sci. Total Environ. 2014, 468–469, 553–563. [Google Scholar] [CrossRef] [PubMed]
  48. Pittelkow, C.M.; Linquist, B.A.; Lundy, M.E.; Liang, X.; Van Groenigen, K.J.; Lee, J.; Van Gestel, N.; Six, J.; Venterea, R.T.; Van Kessel, C. When does no-till yield more? A global meta-analysis. Field Crop. Res. 2015, 183, 156–168. [Google Scholar] [CrossRef] [Green Version]
  49. Sanz-Cobena, A.; García-Marco, S.; Quemada, M.; Gabriel, J.L.; Almendros, P.; Vallejo, A. Do cover crops enhance N2O, CO2 or CH4 emissions from soil in Mediterranean arable systems? Sci. Total Environ. 2014, 466–467, 164–174. [Google Scholar] [CrossRef] [PubMed]
  50. Guardia, G.; Tellez-Rio, A.; García-Marco, S.; Martin-Lammerding, D.; Tenorio, J.L.; Ibáñez, M.Á.; Vallejo, A. Effect of tillage and crop (cereal versus legume) on greenhouse gas emissions and Global Warming Potential in a non-irrigated Mediterranean field. Agric. Ecosyst. Environ. 2016, 221, 187–197. [Google Scholar] [CrossRef]
  51. Serrano-Silva, N.; Sarria-Guzmán, Y.; Dendooven, L.; Luna-Guido, M. Methanogenesis and Methanotrophy in Soil: A Review. Pedosphere 2014, 24, 291–307. [Google Scholar] [CrossRef]
  52. Forte, A.; Fagnano, M.; Fierro, A. Potential role of compost and green manure amendment to mitigate soil GHGs emissions in Mediterranean drip irrigated maize production systems. J. Environ. Manag. 2017, 192, 68–78. [Google Scholar] [CrossRef] [PubMed] [Green Version]
  53. Lloyd, J.; Taylor, J.A. On the Temperature Dependence of Soil Respiration. Funct. Ecol. 1994, 8, 315–323. [Google Scholar] [CrossRef]
  54. Davidson, E.A.; Janssens, I.A.; Lou, Y. On the variability of respiration in terrestrial ecosystems: Moving beyond Q10. Glob. Chang. Biol. 2006, 12, 154–164. [Google Scholar] [CrossRef]
  55. Lai, R.; Arca, P.; Lagomarsino, A.; Cappai, C.; Seddaiu, G.; Demurtas, C.E.; Roggero, P.P. Manure fertilization increases soil respiration and creates a negative carbon budget in a Mediterranean maize (Zea mays L.)-based cropping system. Catena 2017, 151, 202–212. [Google Scholar] [CrossRef]
  56. Almagro, M.; López, J.; Querejeta, J.I.; Martínez-Mena, M. Temperature dependence of soil CO2 efflux is strongly modulated by seasonal patterns of moisture availability in a Mediterranean ecosystem. Soil Biol. Biochem. 2009, 41, 594–605. [Google Scholar] [CrossRef]
  57. Mancinelli, R.; Marinari, S.; Di Felice, V.; Savin, M.C.; Campiglia, E. Soil property, CO2 emission and aridity index as agroecological indicators to assess the mineralization of cover crop green manure in a Mediterranean environment. Ecol. Indic. 2013, 34, 31–40. [Google Scholar] [CrossRef]
  58. Morell, F.J.; Álvaro-Fuentes, J.; Lampurlanés, J.; Cantero-Martínez, C. Soil CO2 fluxes following tillage and rainfall events in a semiarid Mediterranean agroecosystem: Effects of tillage systems and nitrogen fertilization. Agric. Ecosyst. Environ. 2010, 139, 167–173. [Google Scholar] [CrossRef]
  59. Abdalla, M.; Hastings, A.; Helmy, M.; Prescher, A.; Osborne, B.; Lanigan, G.; Forristal, D.; Killi, D.; Maratha, P.; Williams, M.; et al. Assessing the combined use of reduced tillage and cover crops for mitigating greenhouse gas emissions from arable ecosystem. Geoderma 2014, 223–225, 9–20. [Google Scholar] [CrossRef]
  60. Negassa, W.; Price, R.F.; Basir, A.; Snapp, S.S.; Kravchenko, A. Cover crop and tillage systems effect on soil CO2 and N2O fluxes in contrasting topographic positions. Soil Tillage Res. 2015, 154, 64–74. [Google Scholar] [CrossRef]
  61. Chirinda, N.; Carter, M.S.; Albert, K.R.; Ambus, P.; Olesen, J.E.; Porter, J.R.; Petersen, S.O. Emissions of nitrous oxide from arable organic and conventional cropping systems on two soil types. Agric. Ecosyst. Environ. 2010, 136, 199–208. [Google Scholar] [CrossRef]
  62. Van Kessel, C.; Venterea, R.; Six, J.; Adviento-Borbe, M.A.; Linquist, B.; van Groenigen, K.J. Climate, duration, and N placement determine N2O emissions in reduced tillage systems: A meta-analysis. Glob. Chang. Biol. 2013, 19, 33–44. [Google Scholar] [CrossRef] [PubMed]
  63. Antichi, D.; Sbrana, M.; Martelloni, L.; Abou Chehade, L.; Fontanelli, M.; Raffaelli, M.; Mazzoncini, M.; Peruzzi, A.; Frasconi, C. Agronomic performances of organic field vegetables managed with conservation agriculture techniques: A study from Central Italy. 2019. Manuscript in preparation. [Google Scholar]
Figure 1. Presence of the crops in rotation in the three cropping systems (integrated farming (INT), organic farming (ORG) and organic-conservation farming (ORG+)) in the two fields, with the calendar of soil greenhouse gas (GHG) monitoring. Soil GHG data from periods identified as Period 1 (P1) and Period 2 (P2) were used to calculate daily and cumulative emissions.
Agronomy 09 00446 g001
Figure 2. Daily rainfall (mm), daily maximum, average and minimum air temperature (°C) from October 2014 to July 2016.
Agronomy 09 00446 g002
Figure 3. Data recorded in F1: (a) Soil water filled pore space (WFPS); (b) soil temperature; (c) soil nitrate (N–NO3) concentration for each treatment. Simple arrows indicate fertilization events, and dashed arrows the primary tillage of each crop. On field 1 (F1) the temporal crop sequence was: Fennel, summer lettuce, cabbage, then spring lettuce. Significance was as follows: n.s. is not significant; * is significant at the p ≤ 0.05 level; ** is significant at p ≤ 0.01 level; *** is significant at p ≤ 0.001 level.
Agronomy 09 00446 g003
Figure 4. Data recorded in F2: (a) Soil WFPS; (b) soil temperature; (c) soil nitrate (N–NO3) concentration for each treatment. Simple arrows indicate fertilization events; dashed arrows the primary tillage of each crop. On field 1 (F1) the temporal crop sequence was: Cabbage, spring lettuce, fennel, then summer lettuce. Significance was as follows: n.s. is not significant; * is significant at the p ≤ 0.05 level; ** is significant at p ≤ 0.01 level.
Agronomy 09 00446 g004
Figure 5. Daily average fluxes recorded in F1 of: (a) N2O; (b) CH4; and (c) CO2 for each treatment. Simple arrows indicate fertilization events; dashed arrows the primary tillage of each crop. On field 1 (F1) the temporal crop sequence was: Fennel, summer lettuce, cabbage, then spring lettuce. Significance was as follows: n.s. is not significant; * is significant at the p ≤ 0.05 level; ** is significant at p ≤ 0.01 level.
Agronomy 09 00446 g005
Figure 6. Daily average fluxes recorded in F2 of: (a) N2O; (b) CH4; and (c) CO2 for each treatment. Simple arrows indicate fertilization events; dashed arrows the primary tillage of each crop. On field 1 (F1) the temporal crop sequence was: Cabbage, spring lettuce, fennel, then summer lettuce. Significance was as follows: n.s. is not significant; * is significant at the p ≤ 0.05 level; ** is significant at p ≤ 0.01 level; *** is significant at p ≤ 0.001 level.
Agronomy 09 00446 g006
Figure 7. Correlation plot among the soil variables and GHG fluxes. Numbers indicate the correlation coefficients, while the intensity of the colour of the boxes represents the level of correlation according to the scale reported close to each plot. Significance was as follows: * is significant at the p ≤ 0.05 level; ** is significant at p ≤ 0.01 level; *** is significant at p ≤ 0.001 level.
Agronomy 09 00446 g007
Figure 8. Relationship between the logarithm of CO2 flux and the soil temperature.
Agronomy 09 00446 g008
Figure 9. Cumulative emissions of N2O (kg N–N2O ha−1), CH4 (g C–CH4 ha−1) and CO2 (t C–CO2 ha−1) for P1 and P2 in field 1 (a, b, c) and in field 2 (d, e, f), respectively. Different lowercase letters in P1, and uppercase letters in P2 indicate significant differences between the cropping systems resulting from the post-hoc test.
Agronomy 09 00446 g009
Table 1. Characterization of soil in the two fields (F1, F2) and at two depths (0–10 cm, 10–30 cm).
Parameter Field 1Field 2
Unit0–1010–300–1010–30
Sand (2 mm–0.05 mm)%81.982.379.479.3
Silt (0.05 mm–0.002 mm)%13.612.614.413.9
Clay (< 0.002 mm)%4.55.16.26.8
pH1:1 w/v6.76.17.27.1
Organic Matter%2.21.92.62.2
Total Ng kg−11.21.11.51.3
Available Pmg kg−16.63.44.93.6
Exchangeable Kmg kg−155.055.055.055.0
ConductivityμS/cm−3153.382.7185.688.4
C:N-10.810.49.910.0
Bulk densityg cm-31.40 1.44
Table 2. Agricultural practices carried out in field 1 for each crop in the three cropping systems; in field 2 the same agricultural practices were carried out, starting with savoy cabbage.
DataCropLevelMain tillageSowingFertilization rate kg ha−1 of: N; P2O5; K2OWeedPestResidue management
Jul–JanFennelINTSpading Transplanting122; 138; 245Chemical and mechanical weedingChemicalRemoved
ORGSpading Transplanting77; 94; 150Mechanical weeding Removed
ORG+No-tillNo till transplanting25; 58; 75Flame weeding Removed
Feb–MaySpring green manure*INT
ORGRotary tiller, incorporation into the soilBroadcast seeding Chopped and incorporated into the soil with spade
ORG+
Feb–MaySpring living mulch**INT
ORG
ORG+ No till broadcast seeding
Jun–JulSummer LettuceINTSpading Transplanting46; 46; 110Chemical and mechanical weedingChemicalRemoved
ORGSpading Transplanting0; 29; 75Mechanical weeding Removed
ORG+No-tillNo till transplanting0; 0; 0Flame weeding Removed
Jul–FebSavoy cabbageINTSpading Transplanting108; 69; 173Chemical and mechanical weedingChemicalRemoved
ORGSpading Transplanting59; 48; 96Mechanical weeding Removed
ORG+No-tillNo till transplanting28; 29; 50Flame weeding Removed
Ma–MaySpring LettuceINTSpading Transplanting27; 39; 75Chemical and mechanical weedingChemicalRemoved
ORGSpading Transplanting20; 21; 64Mechanical weeding Removed
ORG+No-tillNo till transplanting0; 0; 0Flame weeding Removed
Jun–JulSummer green manure***INT
ORGRotary tillerBroadcast seeding Chopped and incorporated into the soil with spade
ORG+
Jun–JulSummer dead mulch***INT
ORG
ORG+ No till broadcast seeding, devitalization with roller crimper and flaming Rolled and band flamed
* field peas (Pisum sativum L.) and faba beans (Vicia faba subsp. minor L.); ** red clover (Trifolium pratense L.); *** red cowpeas (Vigna unguiculata L.), buckwheat (Fagopyrum esculentum L.), millet (Panicum miliaceum L.) and foxtail millet (Setaria italica L.).
Table 3. Type and splitting of fertilizers in the three cropping systems for each crop.
CropLevelNitrogen fertilizer type and split
FennelINT122 kg N ha−1 as ammonium nitrate 27% (A) - halved in two topdressing applications
ORG25.7 kg N ha−1 as a commercial fertilizer composed by a mixture of manures 5% N (B) - before transplanting
51.3 kg N ha−1 as blood meal fertilizer 14% (C) - halved in two topdressing applications
ORG+9.3 kg N ha−1 as B - before transplanting
18.7 kg N ha−1 as C - at transplanting
Summer LettuceINT46 kg N ha−1 as A - halved in two topdressing applications
ORG
ORG+
Savoy cabbageINT108 kg N ha−1 as A - halved in two topdressing applications
ORG15 kg N ha−1 as B - before transplanting
44 kg N ha−1 as C - halved in two topdressing applications
ORG+7.5 kg N ha−1 as B - before transplanting
20 kg N ha−1 as C - halved in two topdressing applications
Spring LettuceINT27 kg N ha−1 as A - halved in two topdressing applications
ORG19.6 kg N ha−1 as C - before transplanting
ORG+
Table 4. Effects of the three cropping systems on average daily flux of CO2, CH4 and N2O, during the two monitoring periods (P1: January 2015–December 2015; P2: January 2016–July 2016) in Field 1 and Field 2. System levels are INT: Integrated; ORG: Organic; ORG+: Conservation organic. Different letters represent significant differences between the cropping systems resulting from the post-hoc test. Values are mean ± SE; n = 18.
F1 F2
Period N2O (mg m−2 day−1)CH4 (mg m−2 day−1)CO2 (g m−2 day−1)N2O (mg m−2 day−1)CH4 (mg m−2 day−1)CO2 (g m−2 day−1)
P1Systemp < 0.0001n.s.p < 0.0001n.s.p < 0.001p < 0.0001
INT3.05 ± 0.40 a−0.06 ± 0.0215.11 ± 0.98 b2.07 ± 0.23−0.21 ± 0.02 a18.08 ± 1.00 b
ORG2.66 ± 0.49 a−0.08 ± 0.0622.09 ± 1.72 a2.45 ± 0.47−0.23 ± 0.02 b23.63 ± 1.42 a
ORG+2.21 ± 1.18 b−0.10 ± 0.0320.93 ± 1.58 a2.56 ± 0.70−0.14 ± 0.02 a24.12 ± 1.54 a
P2Systemp < 0.0001n.s.p < 0.0001p < 0.05p < 0.05p < 0.0001
INT3.37 ± 1.47 a−0.09 ± 0.0315.59 ± 0.97 b1.62 ± 0.55 ab0.00 ± 0.05 a24.66 ± 0.96 a
ORG4.40 ± 1.77 a−0.07 ± 0.0316.59 ± 1.00 ab2.63 ± 0.59 a−0.14 ± 0.03 b26.11 ± 1.66 a
ORG+0.47 ± 0.12 b−0.08 ± 0.0219.81 ± 1.05 a1.39 ± 0.52 b−0.05 ± 0.03 b19.97 ± 0.79 b
Table 5. Estimated cumulative CO2 emissions (t CO2 ha−1): CO2 equivalents of non-CO2 GHG as the sum of cumulative N2O and CH4 emissions (t CO2-eq ha−1), and net GHG emissions (t CO2-eq ha−1) during the two monitoring periods (P1: January 2015-December 2015; P2: January 2016– July 2016) in Field 1 and Field 2. System levels are INT: Integrated; ORG: Organic; ORG+, conservation organic. Different letters represent significant differences between the cropping systems resulting from the post-hoc test.
CO2 emissions (t CO2 ha−1)CO2 equivalents of non-CO2 GHG (t CO2-eq ha−1)Total CO2-equivalents (t CO2-eq ha−1)
Period F1F2F1F2F1F2
Systemp < 0.001p < 0.01n.s.n.s.p < 0.01p < 0.01
P1INT47.5 ± 3.6 b61.3 ± 2.8 b2.7 ± 0.731.8 ± 0.2950.2 ± 4.1 b63.1 ± 2.8 b
ORG68.1 ± 4.0 a81.6 ± 3.3 a2.2 ± 0.822.0 ± 0.5070.2 ± 4.8 a83.6 ± 3.5 a
ORG+66.0 ± 4.4 a84.4 ± 3.1 a2.8 ± 1.322.4 ± 0.4668.8 ± 5.1 a86.8 ± 3.2 a
P2Systemp < 0.001n.s.n.s.n.s.p < 0.01n.s.
INT19.5 ± 1.4 b42.4 ± 1.41.0 ± 0.470.5 ± 0.0520.5 ± 1.8 b42.9 ± 1.3
ORG20.2 ± 1.5 b43.4 ± 2.40.9 ± 0.291.0 ± 0.3321.2 ± 1.8 b44.4 ± 2.7
ORG+31.3 ± 1.5 a36.4 ± 0.50.1 ± 0.030.4 ± 0.1131.5 ± 1.5 a36.9 ± 0.5

